Attached files
| file | filename |
|---|---|
| 8-K - 8-K - KENTUCKY BANCSHARES INC /KY/ | f8-k.htm |
Exhibit 99.1
|
|
Kentucky Bancshares, Inc. Investor Presentation Louis Prichard, President and CEO Jim Braden, EVP and COO August 9, 2017 Trading Symbol: KTYB www.kybank.com |

|
|
Cautionary Statement Regarding Forward-Looking Statements Statements in this presentation relating to Kentucky Bancshares, Inc. (“KTYB”, the “Company”, “we”, “our” or “us”) contain forward-looking statements under the Private Securities Litigation Reform Act of 1995 that involve risks and uncertainties. We intend such forward-looking statements to be covered by the safe harbor provisions for forward-looking statements contained in the federal securities laws. These statements are not historical facts, but rather statements based on our current expectations regarding our business strategies and their intended results and our future performance. Forward-looking statements are preceded by terms such as “expects,” “believes,” “anticipates,” “intends,” “estimates,” “potential,” “may,” and similar expressions. These forward-looking statement are based on management’s current expectations. KTYB cautions readers that forward-looking statements are not guarantees of future performance and actual results may differ materially from those anticipated, projected or assumed in the forward-looking statements due to various risks and uncertainties. These and other risks and uncertainties are described in greater detail under “Risk Factors” in the From 10-K and subsequent periodic reports filed with the Securities and Exchange Commission. Investors are cautioned that many of the assumptions upon which KTYB's forward-looking statements are based are likely to change after the forward-looking statements are made due to uncertainties KTYB cannot control. The forward-looking statements in this presentation are made as of the date of the release and the Company does not assume any responsibility to update these statements. 2 |
|
|
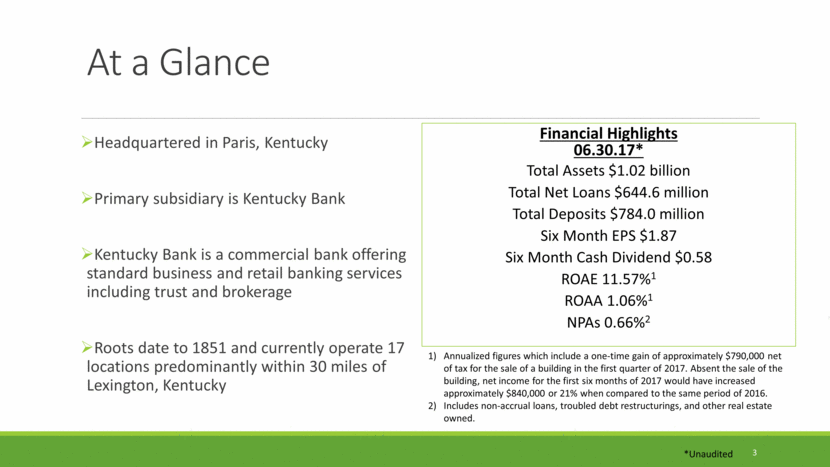
At a Glance Headquartered in Paris, Kentucky Primary subsidiary is Kentucky Bank Kentucky Bank is a commercial bank offering standard business and retail banking services including trust and brokerage Roots date to 1851 and currently operate 17 locations predominantly within 30 miles of Lexington, Kentucky 3 Financial Highlights 06.30.17* Total Assets $1.02 billion Total Net Loans $644.6 million Total Deposits $784.0 million Six Month EPS $1.87 Six Month Cash Dividend $0.58 ROAE 11.57%1 ROAA 1.06%1 NPAs 0.66%2 *Unaudited Annualized figures which include a one-time gain of approximately $790,000 net of tax for the sale of a building in the first quarter of 2017. Absent the sale of the building, net income for the first six months of 2017 would have increased approximately $840,000 or 21% when compared to the same period of 2016. Includes non-accrual loans, troubled debt restructurings, and other real estate owned. |
|
|
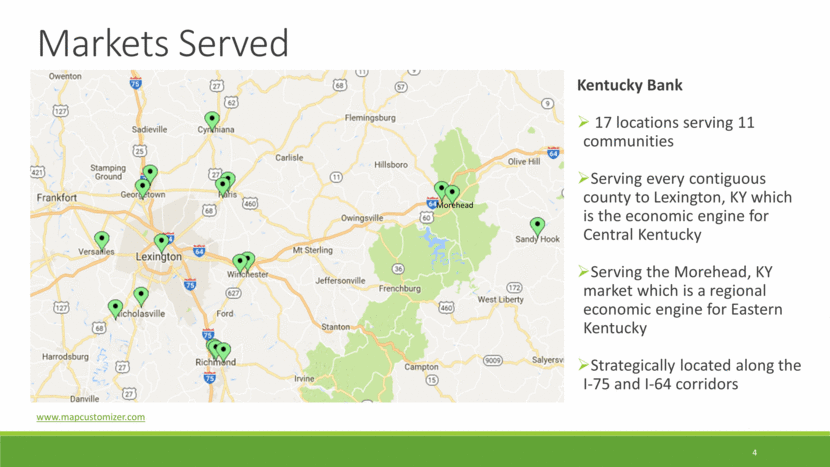
4 Markets Served www.mapcustomizer.com Kentucky Bank 17 locations serving 11 communities Serving every contiguous county to Lexington, KY which is the economic engine for Central Kentucky Serving the Morehead, KY market which is a regional economic engine for Eastern Kentucky Strategically located along the I-75 and I-64 corridors Morehead |
|
|
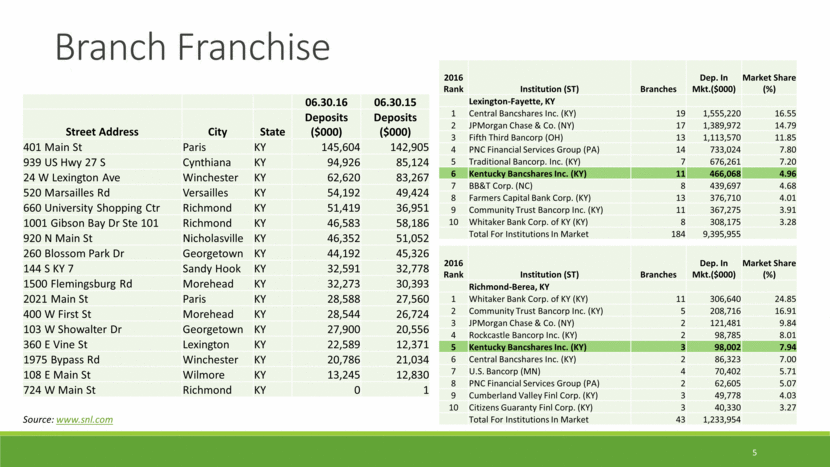
5 Branch Franchise 06.30.16 06.30.15 Street Address City State Deposits ($000) Deposits ($000) 401 Main St Paris KY 145,604 142,905 939 US Hwy 27 S Cynthiana KY 94,926 85,124 24 W Lexington Ave Winchester KY 62,620 83,267 520 Marsailles Rd Versailles KY 54,192 49,424 660 University Shopping Ctr Richmond KY 51,419 36,951 1001 Gibson Bay Dr Ste 101 Richmond KY 46,583 58,186 920 N Main St Nicholasville KY 46,352 51,052 260 Blossom Park Dr Georgetown KY 44,192 45,326 144 S KY 7 Sandy Hook KY 32,591 32,778 1500 Flemingsburg Rd Morehead KY 32,273 30,393 2021 Main St Paris KY 28,588 27,560 400 W First St Morehead KY 28,544 26,724 103 W Showalter Dr Georgetown KY 27,900 20,556 360 E Vine St Lexington KY 22,589 12,371 1975 Bypass Rd Winchester KY 20,786 21,034 108 E Main St Wilmore KY 13,245 12,830 724 W Main St Richmond KY 0 1 Source: www.snl.com 2016 Rank Institution (ST) Branches Dep. In Mkt.($000) Market Share (%) Lexington-Fayette, KY 1 Central Bancshares Inc. (KY) 19 1,555,220 16.55 2 JPMorgan Chase & Co. (NY) 17 1,389,972 14.79 3 Fifth Third Bancorp (OH) 13 1,113,570 11.85 4 PNC Financial Services Group (PA) 14 733,024 7.80 5 Traditional Bancorp. Inc. (KY) 7 676,261 7.20 6 Kentucky Bancshares Inc. (KY) 11 466,068 4.96 7 BB&T Corp. (NC) 8 439,697 4.68 8 Farmers Capital Bank Corp. (KY) 13 376,710 4.01 9 Community Trust Bancorp Inc. (KY) 11 367,275 3.91 10 Whitaker Bank Corp. of KY (KY) 8 308,175 3.28 Total For Institutions In Market 184 9,395,955 2016 Rank Institution (ST) Branches Dep. In Mkt.($000) Market Share (%) Richmond-Berea, KY 1 Whitaker Bank Corp. of KY (KY) 11 306,640 24.85 2 Community Trust Bancorp Inc. (KY) 5 208,716 16.91 3 JPMorgan Chase & Co. (NY) 2 121,481 9.84 4 Rockcastle Bancorp Inc. (KY) 2 98,785 8.01 5 Kentucky Bancshares Inc. (KY) 3 98,002 7.94 6 Central Bancshares Inc. (KY) 2 86,323 7.00 7 U.S. Bancorp (MN) 4 70,402 5.71 8 PNC Financial Services Group (PA) 2 62,605 5.07 9 Cumberland Valley Finl Corp. (KY) 3 49,778 4.03 10 Citizens Guaranty Finl Corp. (KY) 3 40,330 3.27 Total For Institutions In Market 43 1,233,954 |
|
|
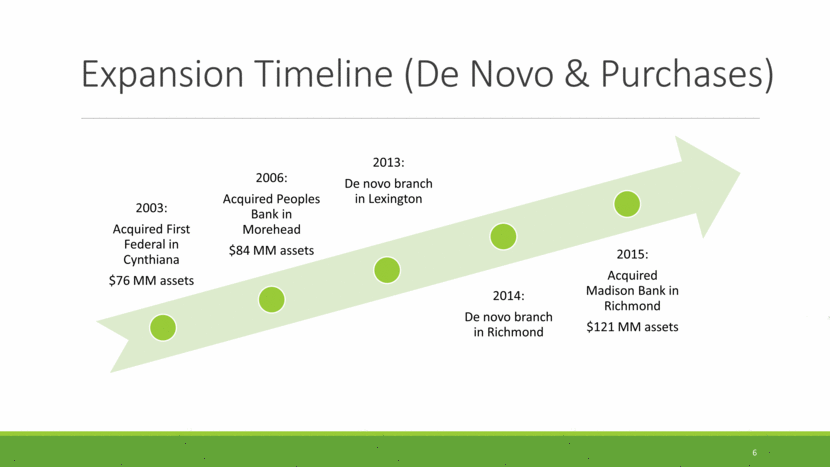
Expansion Timeline (De Novo & Purchases) 6 2003: Acquired First Federal in Cynthiana $76 MM assets 2006: Acquired Peoples Bank in Morehead $84 MM assets 2013: De novo branch in Lexington 2014: De novo branch in Richmond 2015: Acquired Madison Bank in Richmond $121 MM assets |
|
|
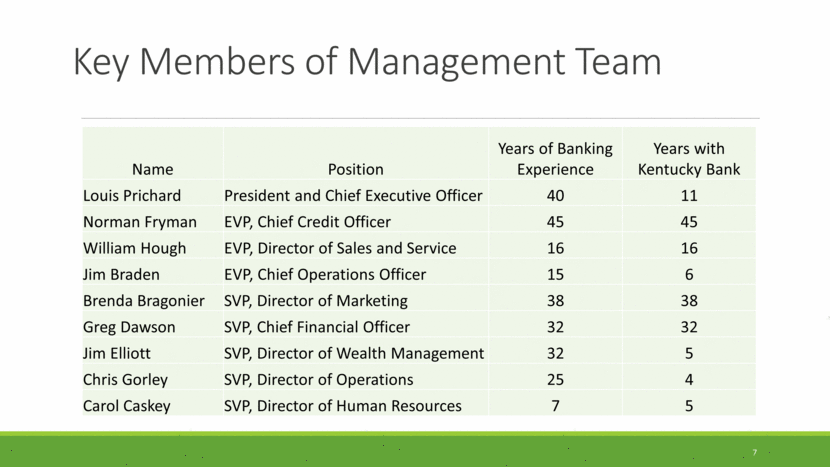
Key Members of Management Team 7 Name Position Years of Banking Experience Years with Kentucky Bank Louis Prichard President and Chief Executive Officer 40 11 Norman Fryman EVP, Chief Credit Officer 45 45 William Hough EVP, Director of Sales and Service 16 16 Jim Braden EVP, Chief Operations Officer 15 6 Brenda Bragonier SVP, Director of Marketing 38 38 Greg Dawson SVP, Chief Financial Officer 32 32 Jim Elliott SVP, Director of Wealth Management 32 5 Chris Gorley SVP, Director of Operations 25 4 Carol Caskey SVP, Director of Human Resources 7 5 |
|
|
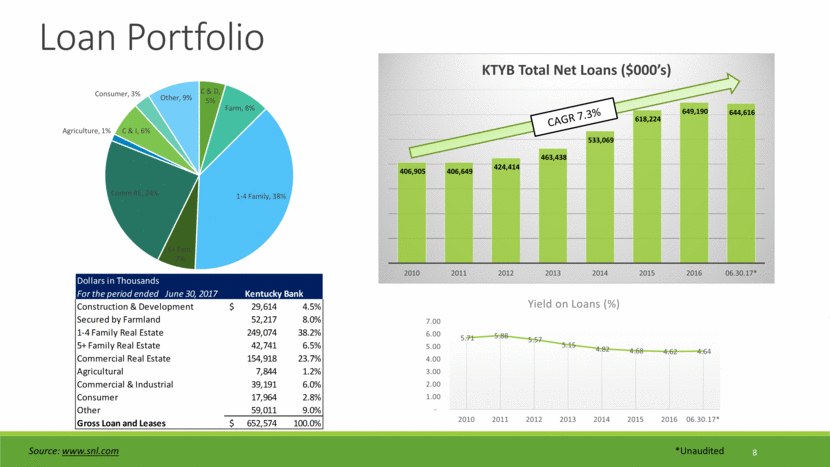
8 Loan Portfolio Source: www.snl.com *Unaudited CAGR 7.3% Dollars in Thousands For the period ended June 30, 2017 Kentucky Bank Construction & Development $ 29,614 4.5% Secured by Farmland 52,217 8.0% 1-4 Family Real Estate 249,074 38.2% 5+ Family Real Estate 42,741 6.5% Commercial Real Estate 154,918 23.7% Agricultural 7,844 1.2% Commercial & Industrial 39,191 6.0% Consumer 17,964 2.8% Other 59,011 9.0% Gross Loan and Leases $ 652,574 100.0% C & D , 5% Farm , 8% 1 - 4 Family , 38% 5+ Fam , 7% Comm RE , 24% Agriculture , 1% C & I , 6% Consumer , 3% Other , 9% 406,905 406,649 424,414 463,438 533,069 618,224 649,190 644,616 2010 2011 2012 2013 2014 2015 2016 06.30.17* KTYB Total Net Loans ($000’s) 5.71 5.88 5.57 5.15 4.82 4.68 4.62 4.64 - 1.00 2.00 3.00 4.00 5.00 6.00 7.00 2010 2011 2012 2013 2014 2015 2016 06.30.17* Yield on Loans (%) |
|
|
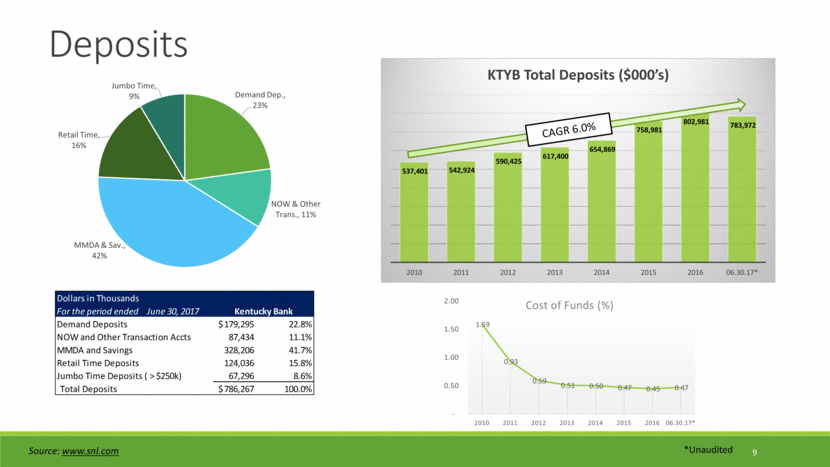
9 Deposits *Unaudited Source: www.snl.com CAGR 6.0% Dollars in Thousands For the period ended June 30, 2017 Kentucky Bank Demand Deposits $ 179,295 22.8% NOW and Other Transaction Accts 87,434 11.1% MMDA and Savings 328,206 41.7% Retail Time Deposits 124,036 15.8% Jumbo Time Deposits ( > $250k) 67,296 8.6% Total Deposits $ 786,267 100.0% Demand Dep. , 23% NOW & Other Trans. , 11% MMDA & Sav. , 42% Retail Time , 16% Jumbo Time , 9% 537,401 542,924 590,425 617,400 654,869 758,981 802,981 783,972 2010 2011 2012 2013 2014 2015 2016 06.30.17* KTYB Total Deposits ($000’s) 1.59 0.93 0.59 0.51 0.50 0.47 0.45 0.47 - 0.50 1.00 1.50 2.00 2010 2011 2012 2013 2014 2015 2016 06.30.17* Cost of Funds (%) |
|
|
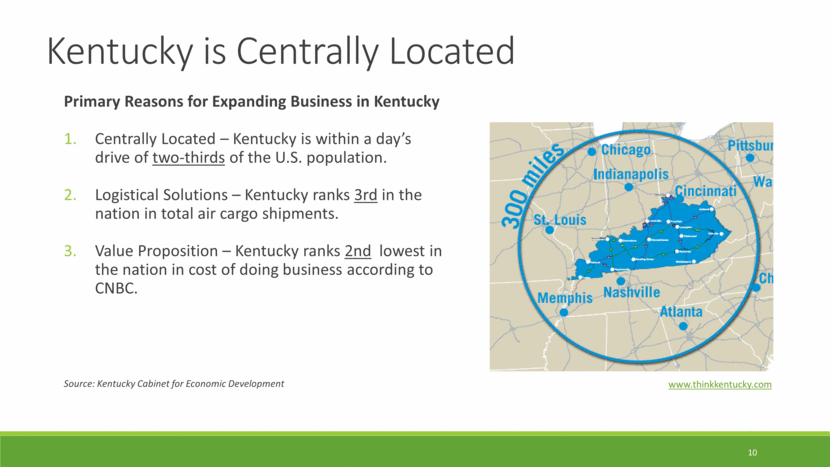
10 Kentucky is Centrally Located Primary Reasons for Expanding Business in Kentucky Centrally Located – Kentucky is within a day’s drive of two-thirds of the U.S. population. Logistical Solutions – Kentucky ranks 3rd in the nation in total air cargo shipments. Value Proposition – Kentucky ranks 2nd lowest in the nation in cost of doing business according to CNBC. Source: Kentucky Cabinet for Economic Development www.thinkkentucky.com |
|
|
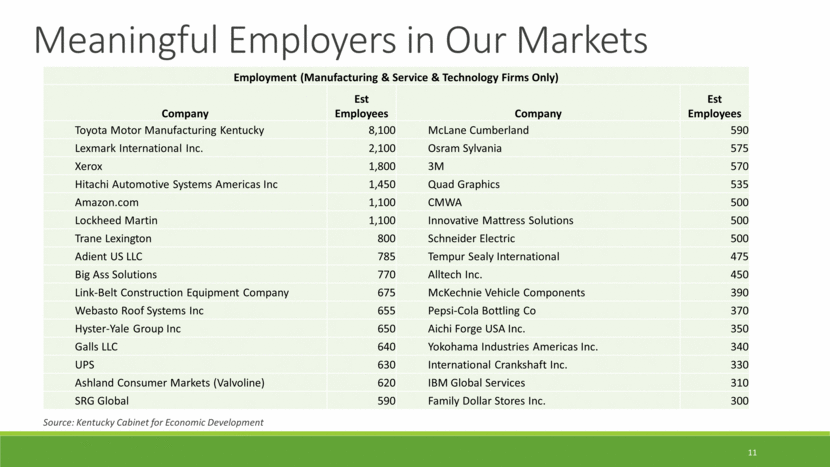
11 Meaningful Employers in Our Markets Source: Kentucky Cabinet for Economic Development Employment (Manufacturing & Service & Technology Firms Only) Company Est Employees Company Est Employees Toyota Motor Manufacturing Kentucky 8,100 McLane Cumberland 590 Lexmark International Inc. 2,100 Osram Sylvania 575 Xerox 1,800 3M 570 Hitachi Automotive Systems Americas Inc 1,450 Quad Graphics 535 Amazon.com 1,100 CMWA 500 Lockheed Martin 1,100 Innovative Mattress Solutions 500 Trane Lexington 800 Schneider Electric 500 Adient US LLC 785 Tempur Sealy International 475 Big Ass Solutions 770 Alltech Inc. 450 Link-Belt Construction Equipment Company 675 McKechnie Vehicle Components 390 Webasto Roof Systems Inc 655 Pepsi-Cola Bottling Co 370 Hyster-Yale Group Inc 650 Aichi Forge USA Inc. 350 Galls LLC 640 Yokohama Industries Americas Inc. 340 UPS 630 International Crankshaft Inc. 330 Ashland Consumer Markets (Valvoline) 620 IBM Global Services 310 SRG Global 590 Family Dollar Stores Inc. 300 |
|
|
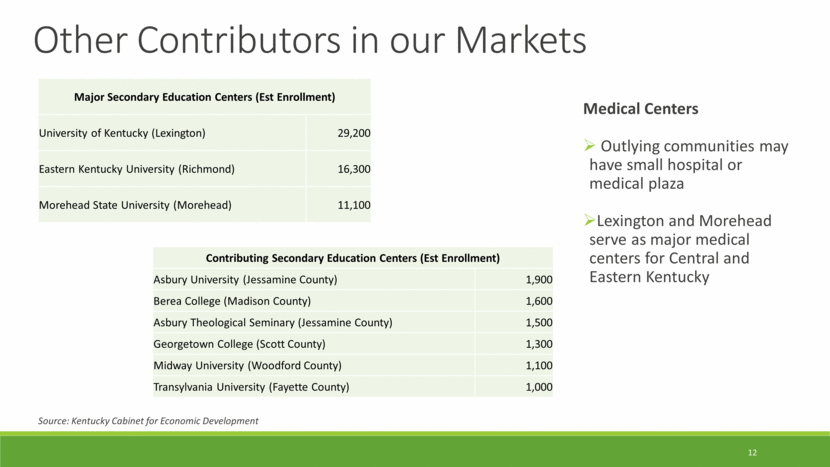
12 Other Contributors in our Markets Source: Kentucky Cabinet for Economic Development Major Secondary Education Centers (Est Enrollment) University of Kentucky (Lexington) 29,200 Eastern Kentucky University (Richmond) 16,300 Morehead State University (Morehead) 11,100 Medical Centers Outlying communities may have small hospital or medical plaza Lexington and Morehead serve as major medical centers for Central and Eastern Kentucky Contributing Secondary Education Centers (Est Enrollment) Asbury University (Jessamine County) 1,900 Berea College (Madison County) 1,600 Asbury Theological Seminary (Jessamine County) 1,500 Georgetown College (Scott County) 1,300 Midway University (Woodford County) 1,100 Transylvania University (Fayette County) 1,000 |
|
|
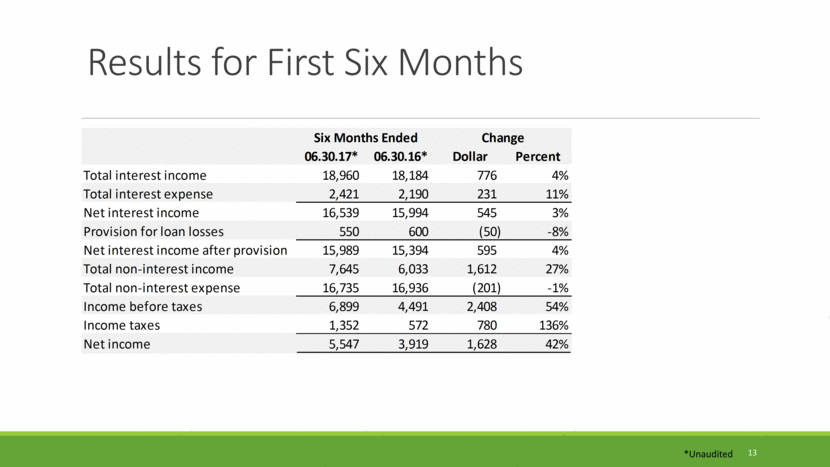
Results for First Six Months 13 *Unaudited Six Months Ended Change 06.30.17* 06.30.16* Dollar Percent Total interest income 18,960 18,184 776 4% Total interest expense 2,421 2,190 231 11% Net interest income 16,539 15,994 545 3% Provision for loan losses 550 600 (50) -8% Net interest income after provision 15,989 15,394 595 4% Total non-interest income 7,645 6,033 1,612 27% Total non-interest expense 16,735 16,936 (201) -1% Income before taxes 6,899 4,491 2,408 54% Income taxes 1,352 572 780 136% Net income 5,547 3,919 1,628 42% |
|
|
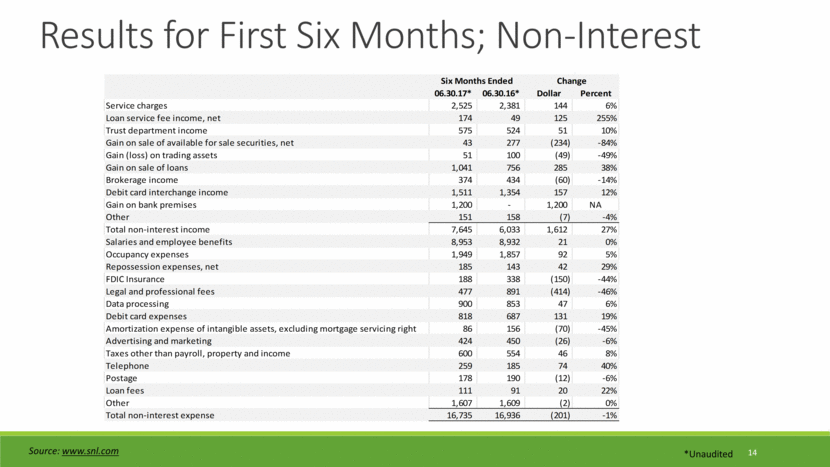
14 Results for First Six Months; Non-Interest *Unaudited Source: www.snl.com Six Months Ended Change 06.30.17* 06.30.16* Dollar Percent Service charges 2,525 2,381 144 6% Loan service fee income, net 174 49 125 255% Trust department income 575 524 51 10% Gain on sale of available for sale securities, net 43 277 (234) -84% Gain (loss) on trading assets 51 100 (49) -49% Gain on sale of loans 1,041 756 285 38% Brokerage income 374 434 (60) -14% Debit card interchange income 1,511 1,354 157 12% Gain on bank premises 1,200 - 1,200 NA Other 151 158 (7) -4% Total non-interest income 7,645 6,033 1,612 27% Salaries and employee benefits 8,953 8,932 21 0% Occupancy expenses 1,949 1,857 92 5% Repossession expenses, net 185 143 42 29% FDIC Insurance 188 338 (150) -44% Legal and professional fees 477 891 (414) -46% Data processing 900 853 47 6% Debit card expenses 818 687 131 19% Amortization expense of intangible assets, excluding mortgage servicing right 86 156 (70) -45% Advertising and marketing 424 450 (26) -6% Taxes other than payroll, property and income 600 554 46 8% Telephone 259 185 74 40% Postage 178 190 (12) -6% Loan fees 111 91 20 22% Other 1,607 1,609 (2) 0% Total non-interest expense 16,735 16,936 (201) -1% |
|
|
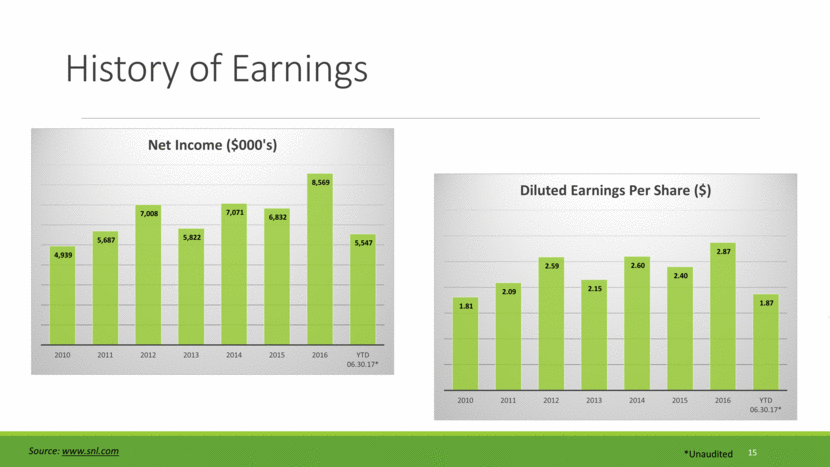
History of Earnings 15 *Unaudited Source: www.snl.com 4,939 5,687 7,008 5,822 7,071 6,832 8,569 5,547 2010 2011 2012 2013 2014 2015 2016 YTD 06.30.17* Net Income ($000's) 1.81 2.09 2.59 2.15 2.60 2.40 2.87 1.87 2010 2011 2012 2013 2014 2015 2016 YTD 06.30.17* Diluted Earnings Per Share ($) |
|
|
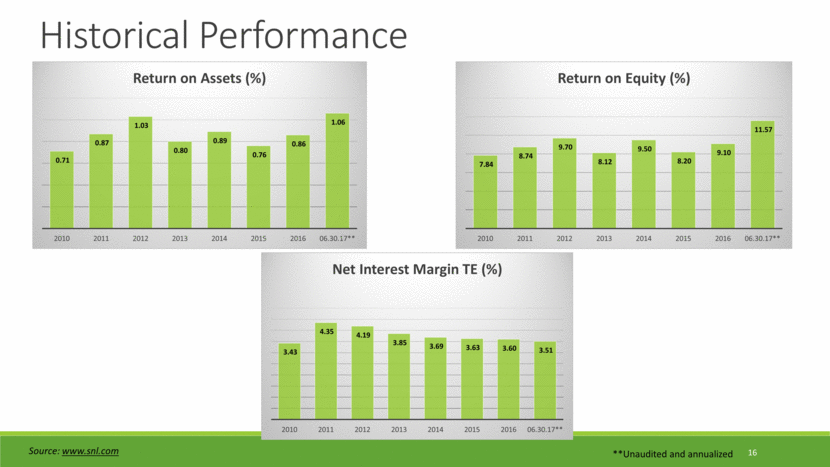
16 Historical Performance **Unaudited and annualized Source: www.snl.com 0.71 0.87 1.03 0.80 0.89 0.76 0.86 1.06 2010 2011 2012 2013 2014 2015 2016 06.30.17** Return on Assets (%) 7.84 8.74 9.70 8.12 9.50 8.20 9.10 11.57 2010 2011 2012 2013 2014 2015 2016 06.30.17** Return on Equity (%) 3.43 4.35 4.19 3.85 3.69 3.63 3.60 3.51 2010 2011 2012 2013 2014 2015 2016 06.30.17** Net Interest Margin TE (%) |
|
|
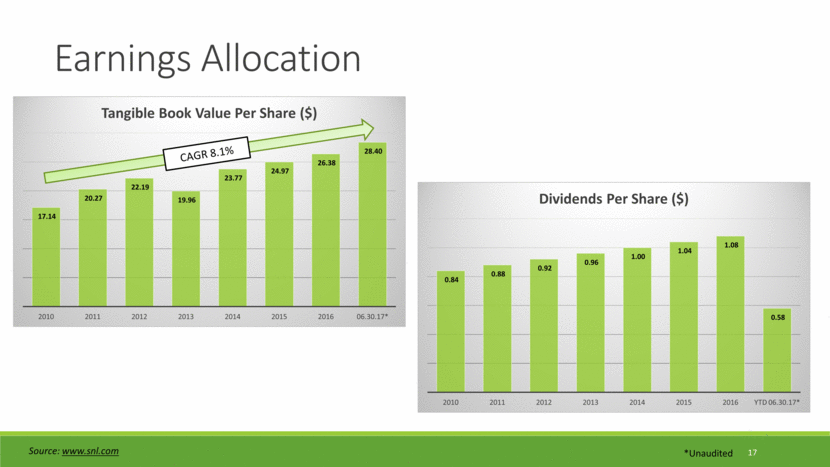
17 Earnings Allocation *Unaudited Source: www.snl.com CAGR 8.1% 17.14 20.27 22.19 19.96 23.77 24.97 26.38 28.40 2010 2011 2012 2013 2014 2015 2016 06.30.17* Tangible Book Value Per Share ($) 0.84 0.88 0.92 0.96 1.00 1.04 1.08 0.58 2010 2011 2012 2013 2014 2015 2016 YTD 06.30.17* Dividends Per Share ($) |
|
|
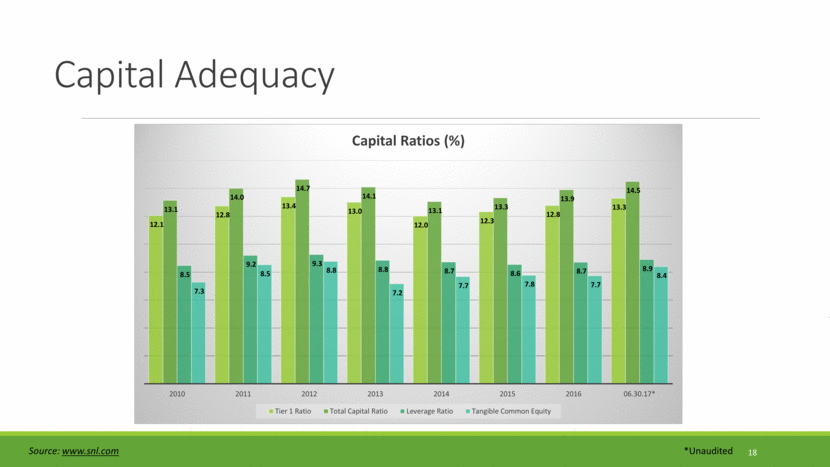
Capital Adequacy 18 *Unaudited Source: www.snl.com 12.1 12.8 13.4 13.0 12.0 12.3 12.8 13.3 13.1 14.0 14.7 14.1 13.1 13.3 13.9 14.5 8.5 9.2 9.3 8.8 8.7 8.6 8.7 8.9 7.3 8.5 8.8 7.2 7.7 7.8 7.7 8.4 2010 2011 2012 2013 2014 2015 2016 06.30.17* Capital Ratios (%) Tier 1 Ratio Total Capital Ratio Leverage Ratio Tangible Common Equity |
|
|
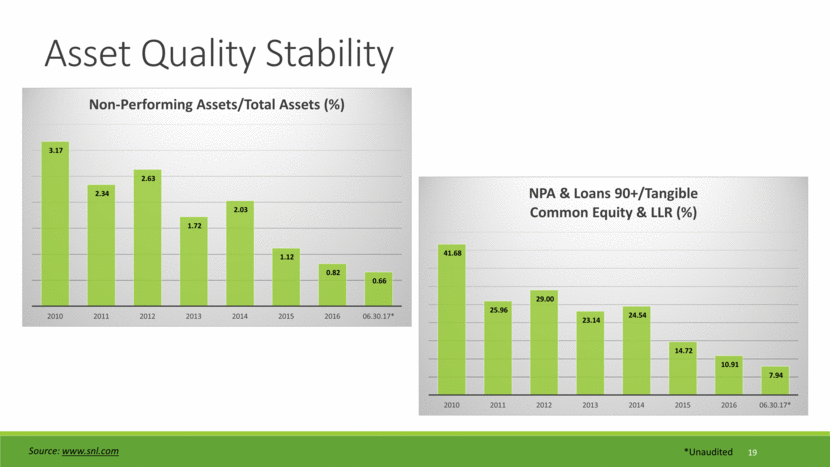
19 Asset Quality Stability *Unaudited Source: www.snl.com 3.17 2.34 2.63 1.72 2.03 1.12 0.82 0.66 2010 2011 2012 2013 2014 2015 2016 06.30.17* Non - Performing Assets/Total Assets (%) 41.68 25.96 29.00 23.14 24.54 14.72 10.91 7.94 2010 2011 2012 2013 2014 2015 2016 06.30.17* NPA & Loans 90+/Tangible Common Equity & LLR (%) |
|
|
Current Strategic Pursuits Increase core profitability through relationship driven loan growth while maintaining asset quality standards with appropriate rate and structure qualifications Increase core profitability through efficiency improvements driven by streamlining operations and consolidating functions Increase core profitability through further diversification of non-interest income through conditionally free product offerings, expansion of wealth management services, and alignment of market opportunities Increase core profitability through further reduction of classified assets through diligent loan and problem asset management 20 |
|
|
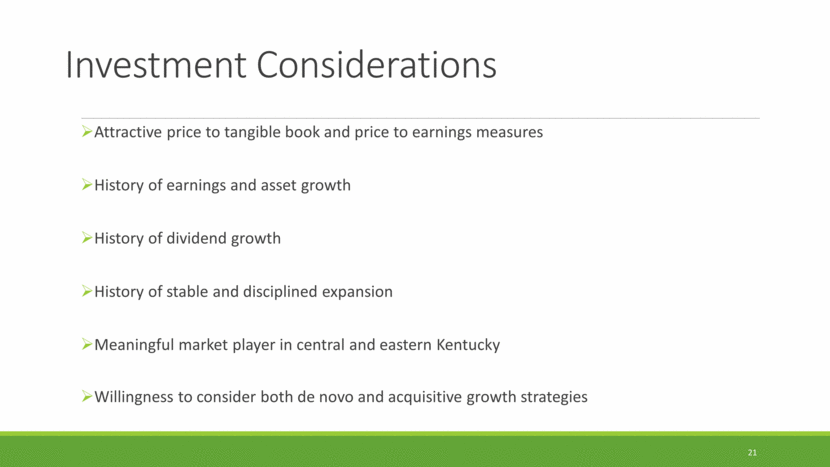
Investment Considerations Attractive price to tangible book and price to earnings measures History of earnings and asset growth History of dividend growth History of stable and disciplined expansion Meaningful market player in central and eastern Kentucky Willingness to consider both de novo and acquisitive growth strategies 21 |
|
|
Kentucky Bancshares, Inc. Trading Symbol: KTYB |