Attached files
| file | filename |
|---|---|
| EX-99.2 - EX-99.2 - Heritage Insurance Holdings, Inc. | d440131dex992.htm |
| EX-99.1 - EX-99.1 - Heritage Insurance Holdings, Inc. | d440131dex991.htm |
| EX-2.1 - EX-2.1 - Heritage Insurance Holdings, Inc. | d440131dex21.htm |
| 8-K - FORM 8-K - Heritage Insurance Holdings, Inc. | d440131d8k.htm |
Exhibit 99.3
Creating a Super Regional Personal Lines Carrier – Acquisition of Narragansett Bay Insurance August 2017
Disclaimer
Safe Harbor Statement
Statements in this presentation that are not historical facts are forward-looking statements that are subject to certain risks and uncertainties that could cause actual events and
results to differ materially from those discussed herein. Without limiting the generality of the foregoing, words such as “may,” “will,” “expect,” “believe,” “anticipate,” “intend,”
“could,” “would,” “estimate,” “or “continue” or the other negative variations thereof or comparable terminology are intended to identify forward looking statements. In particular, statements about
Heritage Insurance Holdings, Inc.’s (“Heritage”) and NBIC Holdings, Inc.’s (“NBIC”) plans, objectives, expectations and intentions; the actual and projected financial condition and results of operations of NBIC; the
anticipated timing of closing of Heritage’s proposed acquisition of NBIC; the potential benefits of the proposed acquisition; and the anticipated reinsurance and operating synergies are forward-looking statements. These statements are not
guarantees of future performance and involve risks, uncertainties and assumptions that could cause Heritage’s or NBIC’s actual results to differ from those expressed or implied by such forward-looking statements. Such risks and
uncertainties include, among other things, risks related to the satisfaction of the conditions to closing the acquisition (including the failure to obtain necessary regulatory approvals) in the anticipated timeframe or at all; risks that the
expected benefits from the proposed acquisition will not be realized or will not be realized within the expected time period; the risk that the businesses will not be integrated successfully; significant transaction costs; the risk of taking on
unknown or understated liabilities; and other business risks. Additional risks and uncertainties that could cause Heritage’s actual results to differ from those expressed or implied herein are those risks and uncertainties that are applicable
to Heritage’s business in general, which include, without limitation: the success of Heritage’s marketing initiatives; inflation and other changes in economic conditions (including changes in interest rates and financial markets); the
impact of new federal and state regulations that affect the property and casualty insurance market; the costs of reinsurance and the collectability of reinsurance; assessments charged by various governmental agencies; pricing competition and other
initiatives by competitors; Heritage’s ability to obtain regulatory approval for requested rate changes, and the timing thereof; legislative and regulatory developments; the outcome of litigation pending against Heritage, including the terms of
any settlements; risks related to the nature of Heritage’s business; dependence on investment income and the composition of Heritage’s investment portfolio; the adequacy of Heritage’s liability for losses and loss adjustment expense;
Heritage’s ability to build and maintain relationships with insurance agents; claims experience; ratings by industry services; catastrophe losses; reliance on key personnel; weather conditions (including the severity and frequency of storms,
hurricanes, tornadoes and hail); changes in loss trends; acts of war and terrorist activities; court decisions and trends in litigation; and other matters described from time to time by Heritage in its filings with the Securities and Exchange
Commission, including, but not limited to, Heritage’s Annual Report on Form 10-K for the year ended December 31, 2016 filed with the Securities and Exchange Commission on March 15, 2017. Heritage undertakes no obligations to update, change or
revise any forward looking statement, whether as a result of new information, additional or subsequent developments or otherwise, except as required by law.2
Transaction Summary
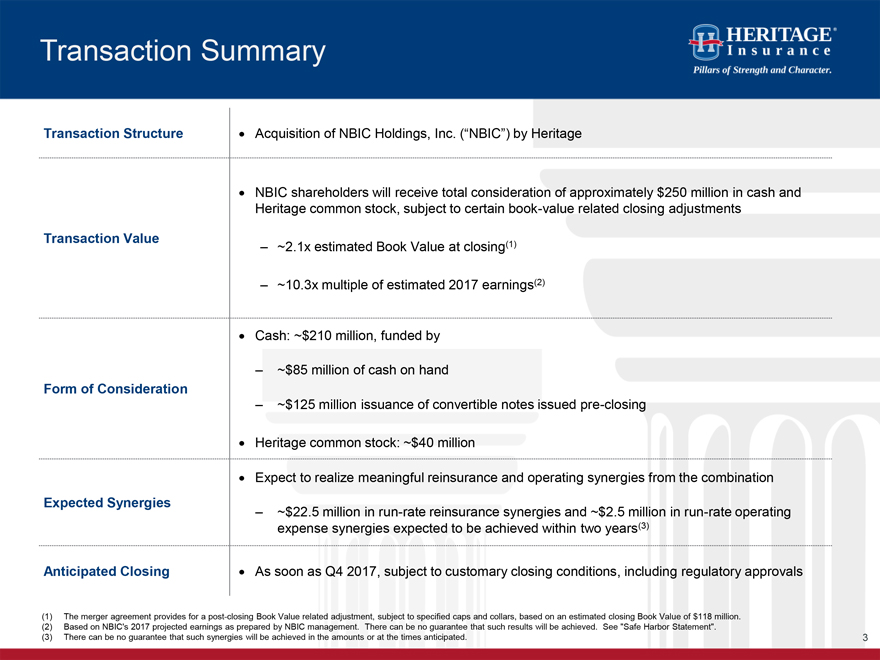
Transaction Structure
Acquisition of NBIC Holdings, Inc. (“NBIC”) by Heritage
NBIC shareholders will receive total consideration of approximately $250 million in cash and
Heritage common stock, subject to certain book-value related closing adjustments
Transaction Value –~2.1x estimated Book Value at closing(1)
– ~10.3x multiple of
estimated 2017 earnings(2)
Cash: ~$210 million, funded by
–
~$85 million of cash on hand
Form of Consideration
–
~$125 million issuance of convertible notes issued pre-closing
Heritage common stock: ~$40 million
Expect to realize meaningful reinsurance and operating synergies from the combination
Expected
Synergies
– ~$22.5 million in run-rate reinsurance synergies and ~$2.5 million in run-rate operating
expense synergies expected to be achieved within two years(3)
Anticipated Closing As soon as Q4 2017, subject to customary closing conditions, including regulatory approvals
(1)The merger agreement provides for a post-closing Book Value related adjustment, subject to specified caps and collars, based on an estimated closing Book Value of
$118 million.
(2)Based on NBIC’s 2017 projected earnings as prepared by NBIC management. There can be no guarantee that such results will be achieved.
See “Safe Harbor Statement”.
(3)There can be no guarantee that such synergies will be achieved in the amounts or at the times anticipated.
3
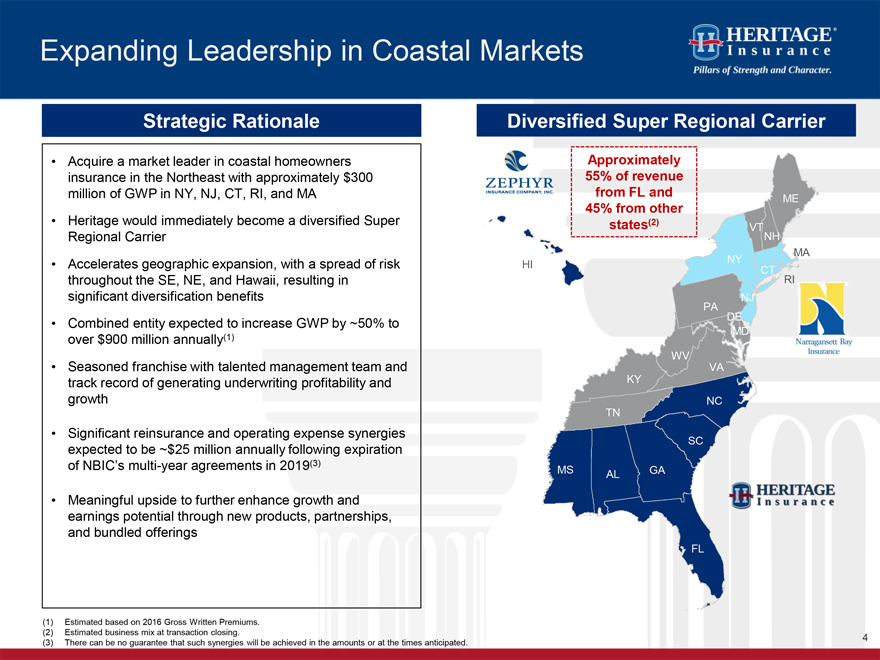
Expanding Leadership in Coastal Markets Strategic Rationale • Acquire a market leader in coastal homeowners insurance in the Northeast with approximately $300 million of GWP in NY, NJ, CT, RI, and MA • Heritage would immediately become a diversified Super Regional Carrier • Accelerates geographic expansion, with a spread of risk throughout the SE, NE, and Hawaii, resulting in significant diversification benefits • Combined entity expected to increase GWP by ~50% to over $900 million annually(1) • Seasoned franchise with talented management team and track record of generating underwriting profitability and growth • Significant reinsurance and operating expense synergies expected to be ~$25 million annually following expiration of NBIC’s multi-year agreements in 2019(3) • Meaningful upside to further enhance growth and earnings potential through new products, partnerships, and bundled offerings Diversified Super Regional Carrier Approximately 55% of revenue from FL and ME 45% from other states(2) (1) Estimated based on 2016 Gross Written Premiums. (2) Estimated business mix at transaction closing. (3)There can be no guarantee that such synergies will be achieved in the amounts or at the times anticipated. 4
Overview of NBIC
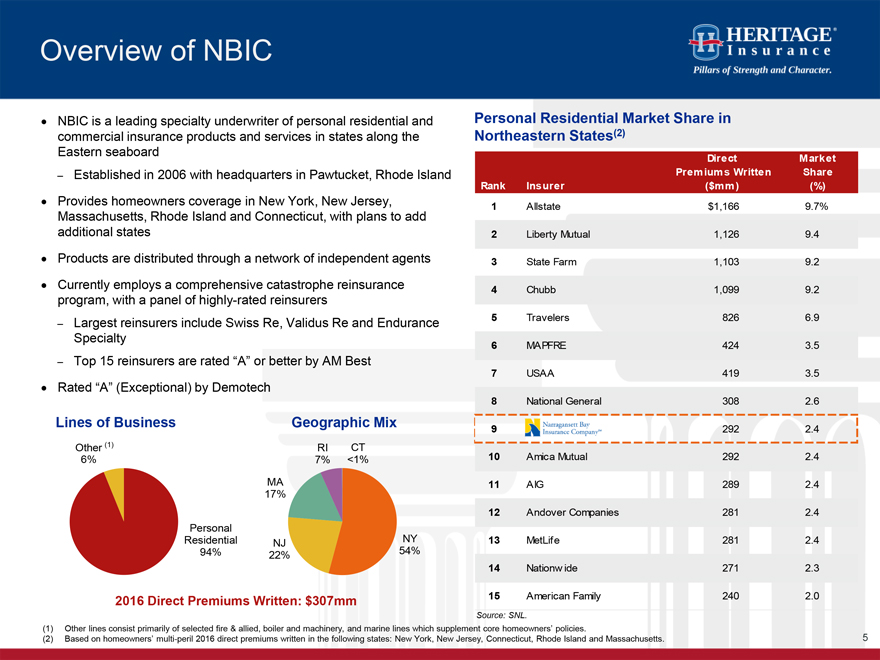
NBIC is a leading specialty
underwriter of personal residential and commercial insurance products and services in states along the Eastern seaboard
Established in 2006 with headquarters in
Pawtucket, Rhode Island
Provides homeowners coverage in New York, New Jersey, Massachusetts, Rhode Island and Connecticut, with plans to add additional states
Products are distributed through a network of independent agents
Currently
employs a comprehensive catastrophe reinsurance program, with a panel of highly-rated reinsurers
Largest reinsurers include Swiss Re, Validus Re and Endurance
Specialty
Top 15 reinsurers are rated “A” or better by AM Best
Rated “A” (Exceptional) by Demotech
Lines of Business Geographic
Mix
2016 Direct Premiums Written: $307mm
Personal Residential Market Share in
Northeastern States(2)
Direct Market Premiums Written Share Rank Insurer ($mm) (%)
1 Allstate $1,166 9.7%
2 Liberty Mutual 1,126 9.4
3 State Farm 1,103 9.2
4 Chubb 1,099 9.2
5 Travelers 826 6.9
6 MAPFRE 424 3.5
7 USAA 419 3.5
8 National General 308 2.6
9 292 2.4
10 Amica Mutual 292 2.4
11 AIG 289 2.4
12 Andover Companies 281 2.4
13 MetLife 281 2.4
14 Nationw ide 271 2.3
15 American Family 240 2.0
Source: SNL
(1) Other lines consist primarily of selected fire & allied, boiler and machinery, and marine lines which supplement core homeowners’ policies.
(2) Based on homeowners’ multi-peril 2016 direct premiums written in the following states: New York, New Jersey, Connecticut, Rhode Island and Massachusetts.
5
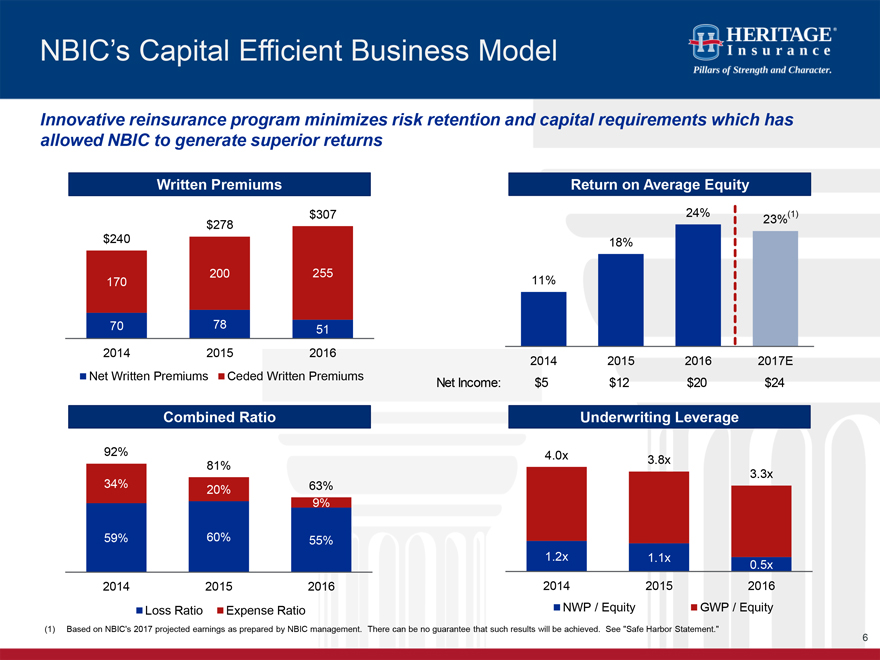
NBIC’s Capital Efficient Business Model Innovative reinsurance program minimizes risk retention and capital requirements which has allowed NBIC to generate superior returns Written Premiums $307 $278 $240 200 255 170 70 78 51 2014 2015 2016 Net Written Premiums Ceded Written Premiums Net Income: Combined Ratio 92% 81% 34% 20% 63% 9% 59% 60% 55% 2014 2015 2016 Loss Ratio Expense Ratio Return on Average Equity 24% 23%(1) 18% 11% 2014 2015 20162017E $5 $12 $20$24 Underwriting Leverage 4.0x 3.8x 3.3x 1.2x 1.1x0.5x 2014 20152016 NWP / Equity GWP / Equity (1) Based on NBIC’s 2017 projected earnings as prepared by NBIC management. There can be no guarantee that such results will be achieved. See “Safe Harbor Statement.” 6
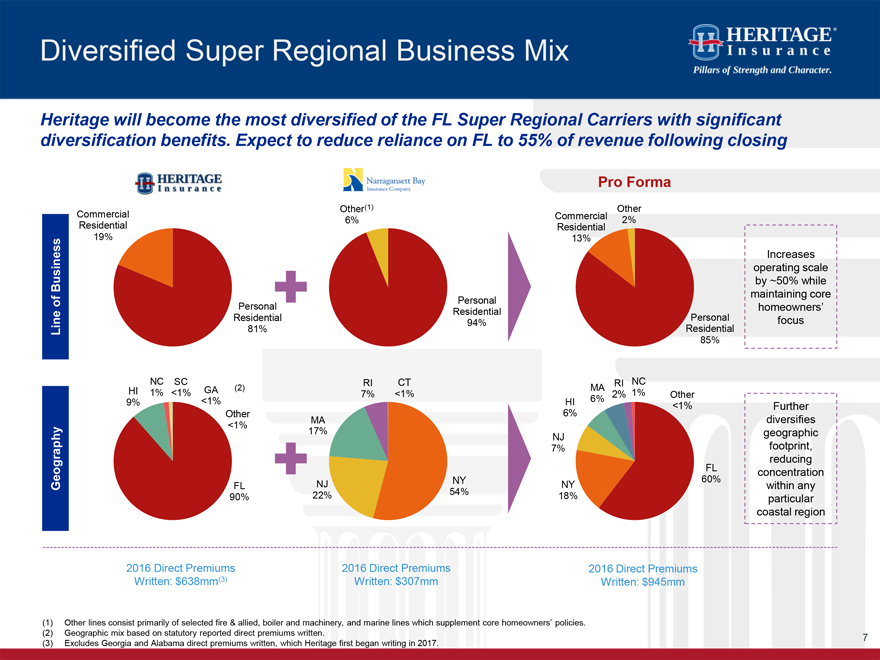
Diversified Super Regional Business Mix
Heritage
will become the most diversified of the FL Super Regional Carriers with significant diversification benefits. Expect to reduce reliance on FL to 55% of revenue following closing
Geography
Line of Business
Pro Forma
Increases operating scale by ~50% while maintaining core homeowners’ focus
Further diversifies geographic footprint, reducing concentration within any particular coastal region
2016 Direct Premiums 2016 Direct Premiums 2016 Direct Premiums Written: $638mm(3) Written: $307mm Written: $945mm
(1) Other lines consist primarily of selected fire & allied, boiler and machinery, and marine lines which supplement core homeowners’ policies.
(2) Geographic mix based on statutory reported direct premiums written.
(3) Excludes Georgia
and Alabama direct premiums written, which Heritage first began writing in 2017. 7
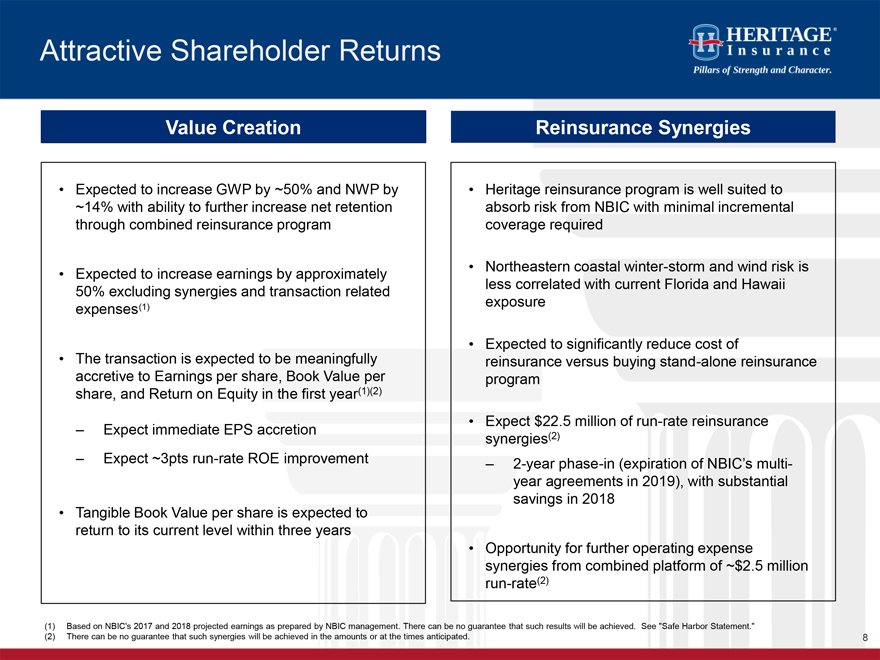
Attractive Shareholder Returns
Value Creation
Expected to increase GWP by ~50% and NWP by ~14% with ability to further increase net retention through combined reinsurance program
Expected to increase earnings by approximately 50% excluding synergies and transaction related expenses(1)
The transaction is expected to be meaningfully accretive to Earnings per share, Book Value per share, and Return on Equity in the first year(1)(2)
Expect immediate EPS accretion
Expect ~3pts run-rate ROE improvement
Tangible Book Value per share is expected to return to its current level within three years
Reinsurance Synergies
Heritage reinsurance program is well suited to absorb
risk from NBIC with minimal incremental coverage required
Northeastern coastal winter-storm and wind risk is less correlated with current Florida and Hawaii
exposure
Expected to significantly reduce cost of reinsurance versus buying stand-alone reinsurance program
Expect $22.5 million of run-rate reinsurance synergies(2)
2-year phase-in (expiration of
NBIC’s multi-year agreements in 2019), with substantial savings in 2018
Opportunity for further operating expense synergies from combined platform of ~$2.5
million run-rate(2)
(1) Based on NBIC’s 2017 and 2018 projected earnings as prepared by NBIC management. There can be no guarantee that such results will be
achieved. See “Safe Harbor Statement.”
(2) There can be no guarantee that such synergies will be achieved in the amounts or at the times anticipated. 8
Pro Forma Capital Structure
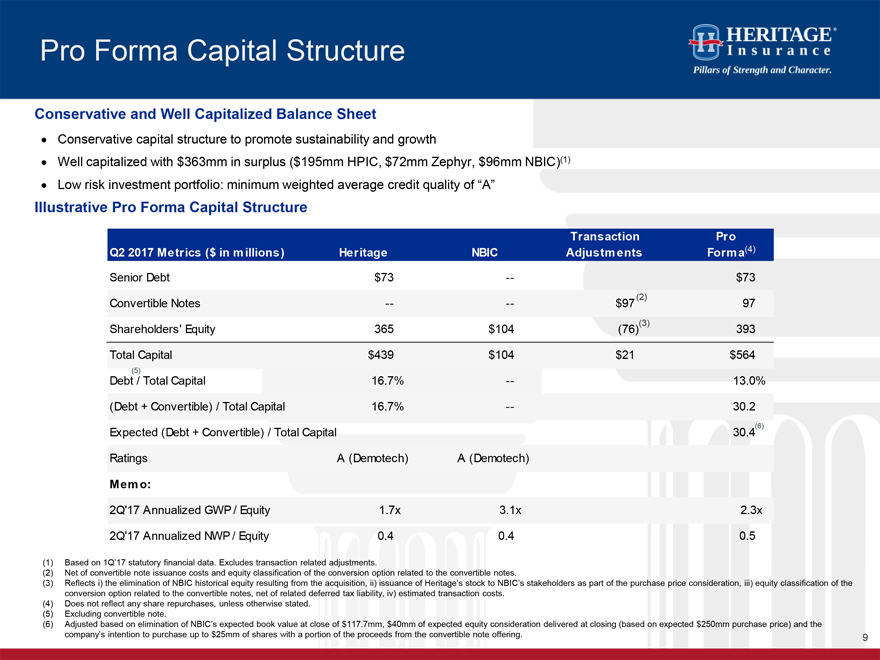
Conservative and Well
Capitalized Balance Sheet
Conservative capital structure to promote sustainability and growth
Well capitalized with $363mm in surplus ($195mm HPIC, $72mm Zephyr, $96mm NBIC)(1)
Low risk
investment portfolio: minimum weighted average credit quality of “A”
Illustrative Pro Forma Capital Structure
Transaction Pro
Q2 2017 Metrics ($ in millions) Heritage NBIC Adjustments Forma(4)
Senior Debt $73 -- $73
Convertible Notes -- -- $97(2) 97
Shareholders’ Equity 365 $104 (76)(3) 393
Total Capital $439 $104 $21 $564
(5)
Debt / Total Capital 16.7% -- 13.0%
(Debt + Convertible) / Total Capital 16.7% -- 30.2
Expected (Debt + Convertible) / Total
Capital 30.4(6)
Ratings A (Demotech) A (Demotech)
Memo:
2Q’17 Annualized GWP / Equity 1.7x 3.1x 2.3x
2Q’17 Annualized NWP / Equity 0.4 0.4
0.5
(1) Based on 1Q’17 statutory financial data. Excludes transaction related adjustments.
(2) Net of convertible note issuance costs and equity classification of the conversion option related to the convertible notes.
(3) Reflects i) the elimination of NBIC historical equity resulting from the acquisition, ii) issuance of Heritage’s stock to NBIC’s stakeholders as part of the purchase
price consideration, iii) equity classification of the conversion option related to the convertible notes, net of related deferred tax liability, iv) estimated transaction costs.
(4) Does not reflect any share repurchases, unless otherwise stated. (5) Excluding convertible note.
(6) Adjusted based on elimination of NBIC’s expected book value at close of $117.7mm, $40mm of expected equity consideration delivered at closing (based on expected $250mm
purchase price) and the company’s intention to purchase up to $25mm of shares with a portion of the proceeds from the convertible note offering. 9
Investment Story
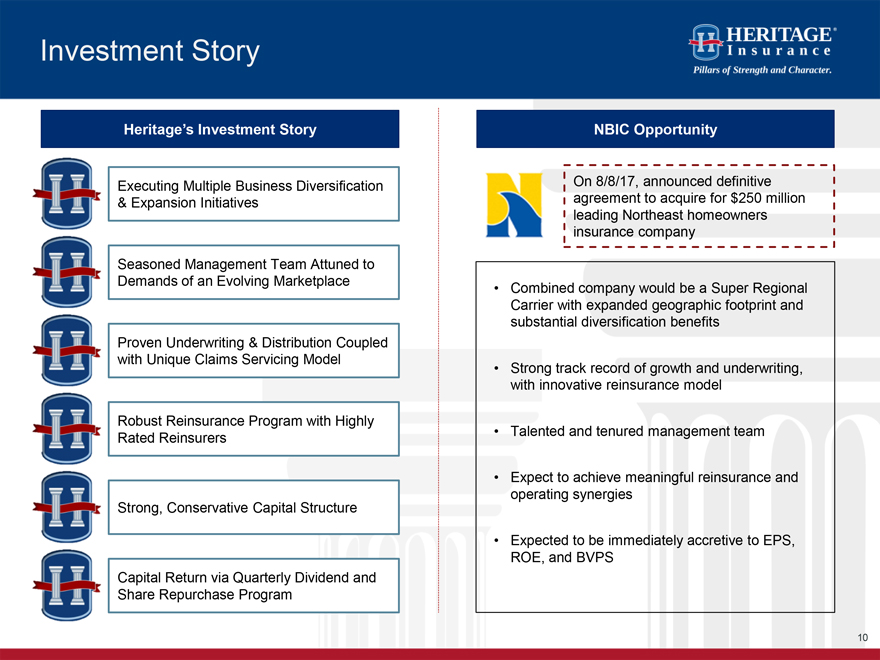
Heritage’s Investment Story
Executing Multiple Business Diversification & Expansion Initiatives
Seasoned Management Team Attuned to Demands of an Evolving Marketplace
Proven
Underwriting & Distribution Coupled with Unique Claims Servicing Model
Robust Reinsurance Program with Highly Rated Reinsurers
Strong, Conservative Capital Structure
Capital Return via Quarterly Dividend and Share
Repurchase Program
NBIC Opportunity
On 8/8/17, announced definitive agreement
to acquire for $250 million leading Northeast homeowners insurance company
Combined company would be a Super Regional Carrier with expanded geographic footprint
and substantial diversification benefits
Strong track record of growth and underwriting, with innovative reinsurance model
Talented and tenured management team
Expect to achieve meaningful reinsurance and operating
synergies
Expected to be immediately accretive to EPS, ROE, and BVPS 10

Overview of Heritage
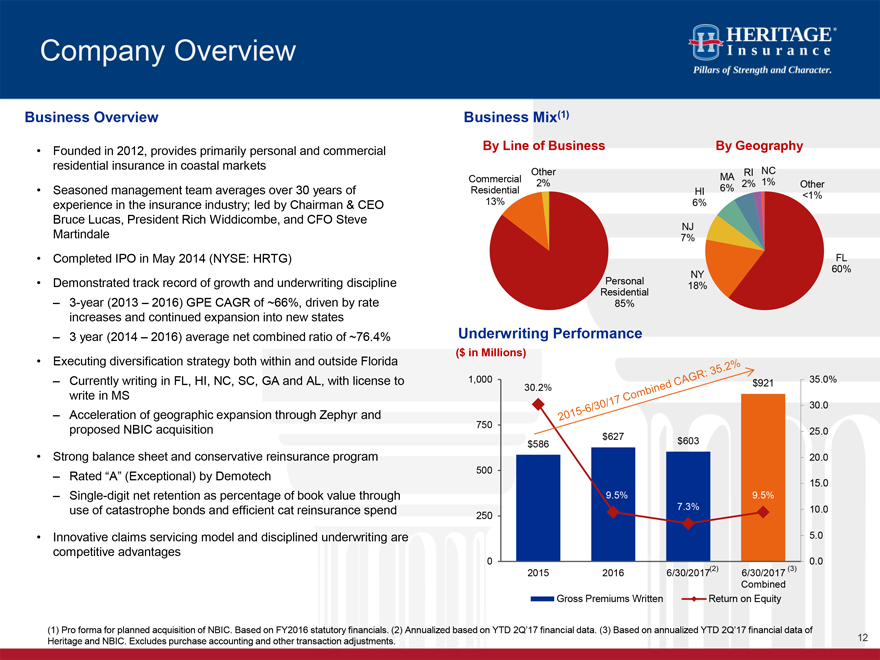
Company Overview Business Overview Founded in 2012, provides primarily personal and commercial residential insurance in coastal markets Seasoned management team averages over 30 years of experience in the insurance industry; led by Chairman & CEO Bruce Lucas, President Rich Widdicombe, and CFO Steve Martindale Completed IPO in May 2014 (NYSE: HRTG) Demonstrated track record of growth and underwriting discipline 3-year (2013 – 2016) GPE CAGR of ~66%, driven by rate increases and continued expansion into new states 3 year (2014 – 2016) average net combined ratio of ~76.4% Executing diversification strategy both within and outside Florida Currently writing in FL, HI, NC, SC, GA and AL, with license to write in MS Acceleration of geographic expansion through Zephyr and proposed NBIC acquisition Strong balance sheet and conservative reinsurance program Rated “A” (Exceptional) by Demotech Single-digit net retention as percentage of book value through use of catastrophe bonds and efficient cat reinsurance spend Innovative claims servicing model and disciplined underwriting are competitive advantages Business Mix(1) By Line of Business By Geography Other Commercial 2% Residential 13% Other Commercial 2% Residential 13% NY 18% NJ 7% HI 6% MA 6% RI 2% NC 1% Other <1% FL 60%Underwriting Performance ($ in Millions) 1,000 750 500 250 0 30.2% $586 $627 9.5% 9.5% $603 7.3% $921 9.5% 35.0% 30.0 25.0 20.0 15.0 10.0 5.0 0.0 2015 2016 6/30/2017(2) 6/30/2017(3) Combined Gross Premiums Written Return on Equity (1) Pro forma for planned acquisition of NBIC. Based on FY2016 statutory financials. (2) Annualized based on YTD 2Q’17 financial data. (3) Based on annualized YTD 2Q’17 financial data of Heritage and NBIC. Excludes purchase accounting and other transaction adjustments.12
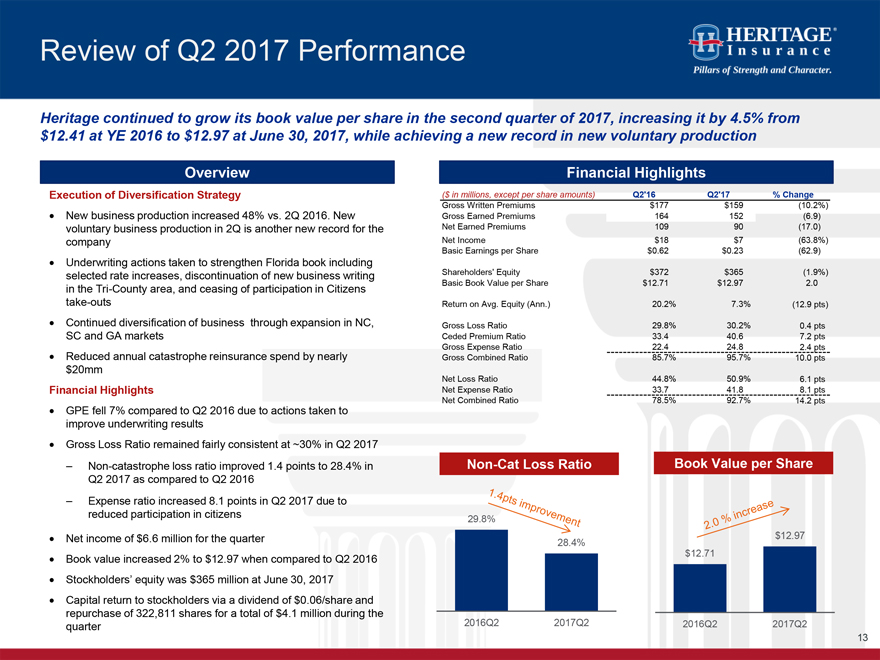
Review of Q2 2017 Performance Heritage continued to grow its book value per share in the second quarter of 2017, increasing it by 4.5%
from $12.41 at YE 2016 to $12.97 at June 30, 2017, while achieving a new record in new voluntary production Overview Execution of Diversification Strategy New business production increased 48% vs. 2Q 2016. New voluntary business production in 2Q is
another new record for the company Underwriting actions taken to strengthen Florida book including selected rate increases, discontinuation of new business writing in the Tri-County area, and ceasing of participation in Citizens take-outs Continued
diversification of business through expansion in NC, SC and GA markets Reduced annual catastrophe reinsurance spend by nearly $20mm Financial Highlights GPE fell 7% compared to Q2 2016 due to actions taken to improve underwriting results Gross Loss
Ratio remained fairly consistent at ~30% in Q2 2017 Non-catastrophe loss ratio improved 1.4 points to 28.4% in Q2 2017 as compared to Q2 2016 Expense ratio increased 8.1 points in Q2 2017 due to reduced participation in citizens Net income of $6.6
million for the quarter Book value increased 2% to $12.97 when compared to Q2 2016 Stockholders’ equity was $365 million at June 30, 2017 Capital return to stockholders via a dividend of $0.06/share and repurchase of 322,811 shares for a total
of $4.1 million during the quarter Financial Highlights
($ in millions, except per share amounts) Q2’16 Q2’17 % Change
Gross Written Premiums $177 $159 (10.2%)
Gross Earned Premiums 164 152 (6.9)
Net Earned Premiums 109 90 (17.0)
Net Income $18 $7 (63.8%)
Basic Earnings per Share $0.62 $0.23 (62.9)
Shareholders’ Equity $372 $365 (1.9%)
Basic Book Value per Share $12.71 $12.97 2.0
Return on Avg. Equity (Ann.)
20.2% 7.3% (12.9 pts)
Gross Loss Ratio 29.8% 30.2% 0.4 pts
Ceded Premium
Ratio 33.4 40.6 7.2 pts
Gross Expense Ratio 22.4 24.8 2.4 pts
Gross Combined
Ratio 85.7% 95.7% 10.0 pts
Net Loss Ratio 44.8% 50.9% 6.1 pts
Net Expense
Ratio 33.7 41.8 8.1 pts
Net Combined Ratio 78.5% 92.7% 14.2 pts
Non-Cat Loss
Ratio
Book Value per Share
1.4pts improvement
2.0% increase
29.8% 28.4% $12.71 $12.97 2016Q2 2017Q2 2016Q2 2017Q213
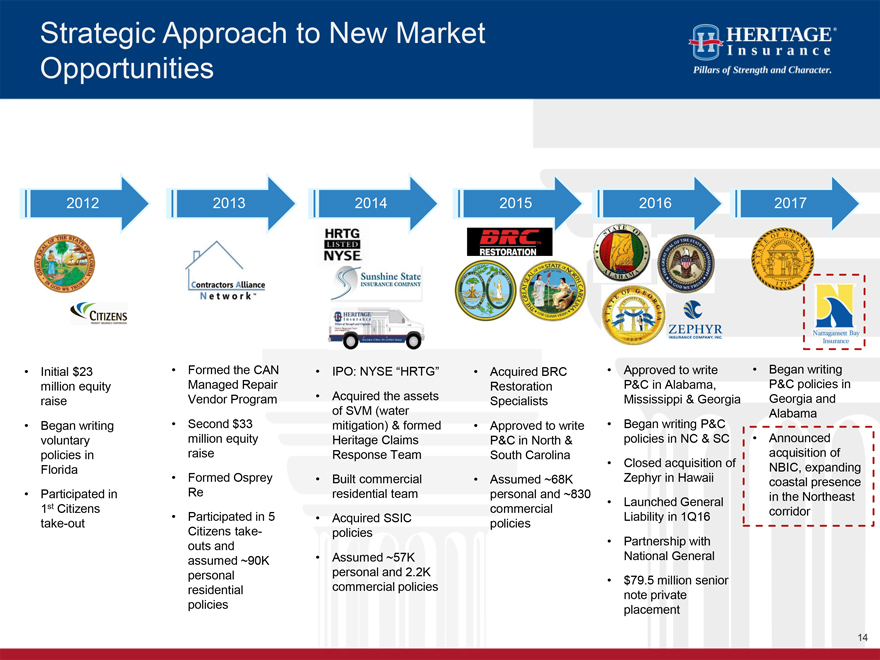
Strategic Approach to New Market Opportunities 2012 2013 2014 2015 2016 2017 Initial $23 million equity raise Began writing voluntary policies in Florida Participated in 1st Citizens take-out Formed the CAN Managed Repair Vendor Program Second $33 million equity raise Formed Osprey Re Participated in 5 Citizens take-outs and assumed ~90K personal residential policies IPO: NYSE “HRTG” Acquired the assets of SVM (water mitigation) & formed Heritage Claims Response Team Built commercial residential team Acquired SSIC policies Assumed ~57K personal and 2.2K commercial policies Acquired BRC Restoration Specialists Approved to write P&C in North & South Carolina Assumed ~68K personal and ~830 commercial policies Approved to write P&C in Alabama, Mississippi & Georgia Began writing P&C policies in NC & SC Closed acquisition of Zephyr in Hawaii Launched General Liability in 1Q16 Partnership with National General $79.5 million senior note private placement Began writing P&C policies in Georgia and Alabama Announced acquisition of NBIC, expanding coastal presence in the Northeast corridor14
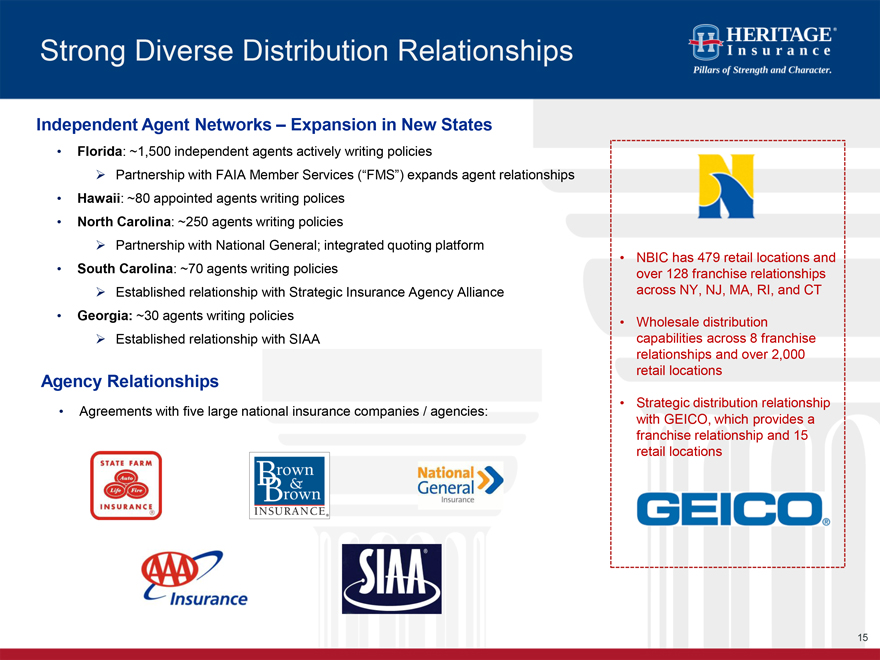
Strong Diverse Distribution Relationships Independent Agent Networks – Expansion in New States Florida: ~1,500 independent agents actively writing policies Partnership with FAIA Member Services (“FMS”) expands agent relationships Hawaii: ~80 appointed agents writing polices North Carolina: ~250 agents writing policies Partnership with National General; integrated quoting platform South Carolina: ~70 agents writing policies Established relationship with Strategic Insurance Agency Alliance Georgia: ~30 agents writing policies Established relationship with SIAA Agency Relationships Agreements with five large national insurance companies / agencies: NBIC has 479 retail locations and over 128 franchise relationships across NY, NJ, MA, RI, and CT Wholesale distribution capabilities across 8 franchise relationships and over 2,000 retail locations Strategic distribution relationship with GEICO, which provides a franchise relationship and 15 retail locations15
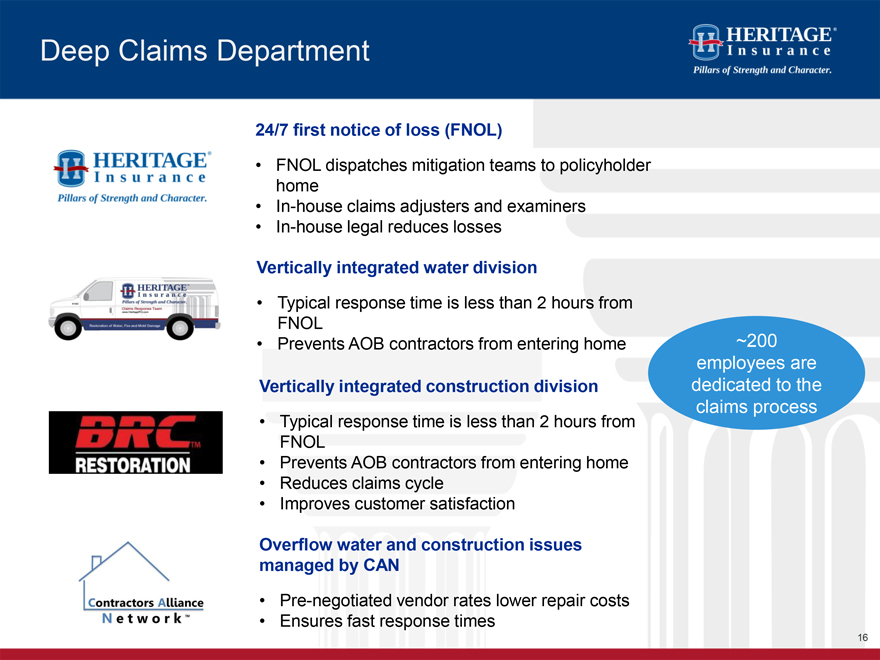
Deep Claims Department
24/7 first notice of loss
(FNOL)
FNOL dispatches mitigation teams to policyholder home In-house claims adjusters and examiners In-house legal reduces losses
Vertically integrated water division
Typical response time is less than 2 hours from FNOL
Prevents AOB contractors from entering home
Vertically integrated
construction division
Typical response time is less than 2 hours from FNOL
Prevents AOB contractors from entering home Reduces claims cycle Improves customer satisfaction
Overflow water and construction issues managed by CAN
Pre-negotiated vendor rates lower repair
costs Ensures fast response times
~200 employees are dedicated to the claims process16
Robust Reinsurance Program
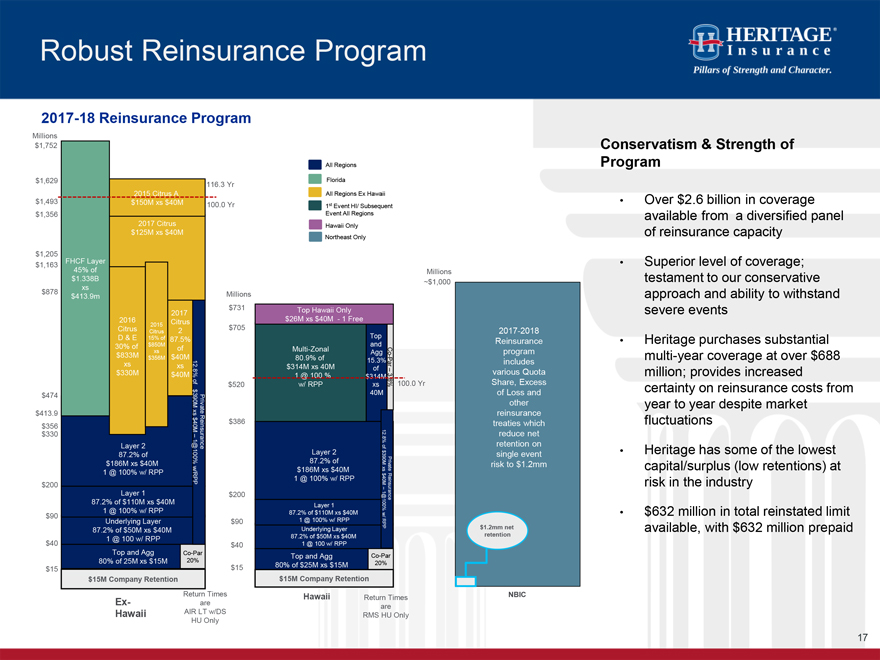
2017-18 Reinsurance
Program
Millions $1,752
All Regions
$1,629 Florida
116.3 Yr
2015 Citrus A All Regions Ex Hawaii $1,493 $150M xs $40M
100.0 Yr 1st Event HI/ Subsequent
$1,356 Event All Regions
2017 Citrus Hawaii Only $125M xs $40M
Northeast Only
$1,205
FHCF Layer $1,163
45% of Millions
$1.338B
~$1,000 xs $878 Millions $413.9m $731 Top Hawaii Only 2017 2016 2015 Citrus $26M xs $40M - 1 Free Citrus 2 $705
Citrus
D & E 15% of Top $850M 87.5%
30% of and xs of Multi-Zonal $833M Agg - Co $356M $40M 80.9% of
15.3% xs xs 12Par
. $314M xs 40M of – $330M $40M 8% 1 @ 100 % 3 $314M . of 100.0 Yr $520 w/ RPP xs 8%
3 $
40M $474
90M Private $413.9 xs $ $386 $356 40M $330 – . 12
8%
Layer 2 Reinsurance of
Layer 2 $
87.2% of 1@100% 87.2% of 390M $186M xs $40M Private
1 @ 100% w/ RPP $186M xs $40M xs
$
w/RPP 1 @ 100% w/ RPP 40M $200 Layer 1 –
$200 Reinsurance
87.2% of $110M xs $40M Layer 1 1@100%
$90 1 @ 100% w/ RPP 87.2% of $110M xs $40M w/
Underlying Layer $90 1 @ 100% w/ RPP RPP
87.2% of $50M xs $40M Underlying Layer
1 @ 100 w/ RPP 87.2% of $50M xs $40M
$40 $40 1 @ 100 w/ RPP
Top and Agg Co-Par
Top and Agg Co-Par 80% of 25M xs $15M 20% 20%
$15 80% of $25M xs $15M $15 $15M Company
Retention $15M Company Retention
Return Times Hawaii
Return Times
Ex- are
are Hawaii AIR LT w/DS
RMS HU Only HU Only
Conservatism & Strength of Program
Over $2.6 billion in coverage available from a diversified panel of reinsurance capacity
Superior level of coverage; testament to our conservative approach and ability to withstand severe events
Heritage purchases substantial multi-year coverage at over $688 million; provides increased certainty on reinsurance costs from year to year despite market fluctuations
Heritage has some of the lowest capital/surplus (low retentions) at risk in the industry
$632
million in total reinstated limit available, with $632 million prepaid17
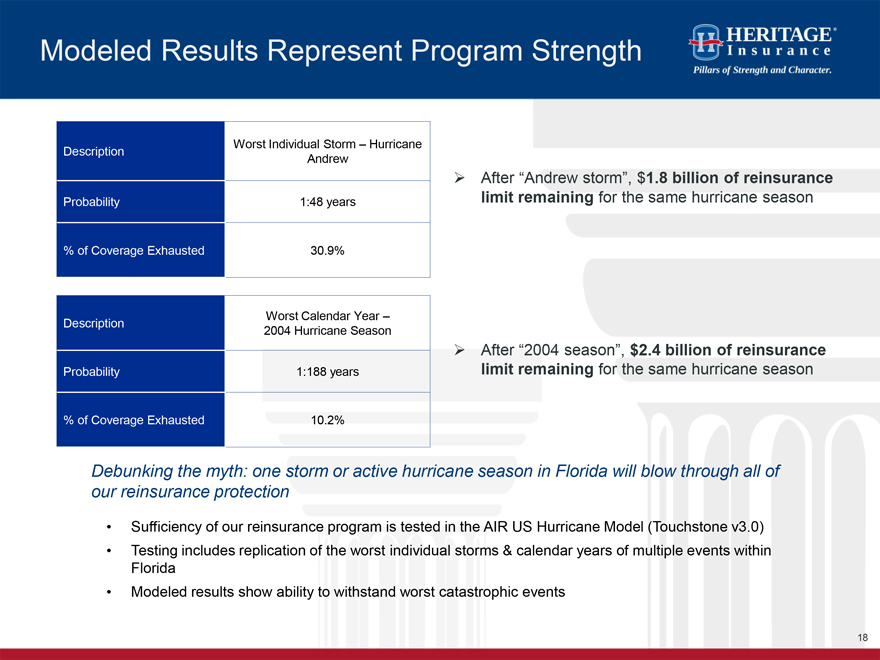
Modeled Results Represent Program Strength
Worst
Individual Storm – Hurricane Description Andrew
Probability 1:48 years
%
of Coverage Exhausted 30.9%
After “Andrew storm”, $1.8 billion of reinsurance limit remaining for the same hurricane season
Worst Calendar Year – Description 2004 Hurricane Season
Probability 1:188 years
% of Coverage Exhausted 10.2%
After “2004 season”, $2.4 billion of
reinsurance limit remaining for the same hurricane season
Debunking the myth: one storm or active hurricane season in Florida will blow through all of our
reinsurance protection
Sufficiency of our reinsurance program is tested in the AIR US Hurricane Model (Touchstone v3.0)
Testing includes replication of the worst individual storms & calendar years of multiple events within Florida
Modeled results show ability to withstand worst catastrophic events18