Attached files
| file | filename |
|---|---|
| EX-32 - EXHIBIT 32 - Fibrocell Science, Inc. | fcsc-2017630ex32.htm |
| EX-31 - EXHIBIT 31 - Fibrocell Science, Inc. | fcsc-2017630ex31.htm |
UNITED STATES
SECURITIES AND EXCHANGE COMMISSION
Washington, D.C. 20549
___________________________________________________________________
FORM 10-Q
x Quarterly Report Pursuant to Section 13 or 15(d) of the Securities Exchange Act of 1934
For the quarterly period ended June 30, 2017
OR
o Transition Report Pursuant to Section 13 or 15(d) of the Securities Exchange Act of 1934
___________________________________________________________________
Commission File Number 001-31564

Fibrocell Science, Inc.
(Exact name of registrant as specified in its Charter)
Delaware | 87-0458888 | |
(State or other jurisdiction of incorporation) | (I.R.S. Employer Identification No.) | |
405 Eagleview Boulevard
Exton, Pennsylvania 19341
(Address of principal executive offices, including zip code)
(484) 713-6000
(Registrant’s telephone number, including area code)
Indicate by check mark whether the registrant: (1) filed all reports required to be filed by Section 13 or 15(d) of the Exchange Act during the preceding 12 months (or for any shorter period that the registrant was required to file such reports), and (2) has been subject to such filing requirements for the past 90 days. Yes ý No o
Indicate by check mark whether the registrant has submitted electronically and posted on its corporate Web site, if any, every Interactive Data File required to be submitted and posted pursuant to Rule 405 of Regulation S-T (§ 232.405 of this chapter) during the preceding 12 months (or for such shorter period that the registrant was required to submit and post such files). Yes ý No o
Indicate by check mark whether the registrant is a large accelerated filer, an accelerated filer, a non-accelerated filer, smaller reporting company, or an emerging growth company. See the definitions of large accelerated filer, accelerated filer, smaller reporting company, and emerging growth company in Rule 12b-2 of the Exchange Act.
Large accelerated filer o | Accelerated filer o | |
Non-accelerated filer o (Do not check if a smaller reporting company) | ||
Smaller reporting company ý | ||
Emerging growth company o | ||
If an emerging growth company, indicate by check mark if the registrant has elected not to use the extended transition period for complying with any new or revised financial accounting standards provided pursuant to Section 13(a) of the Exchange Act. o
Indicate by check mark whether the registrant is shell company (as defined in Rule 12b-2of the Exchange Act). Yes o No ý
As of August 3, 2017, there were 14,717,166 outstanding shares of the registrant’s common stock, par value $0.001.
Fibrocell Science, Inc.
TABLE OF CONTENTS
PAGE | |||
_____________________________
Unless the context otherwise requires, all references in this Quarterly Report on Form 10-Q (this Form 10-Q) to the “Company,” “Fibrocell,” “we,” “us,” and “our” include Fibrocell Science, Inc. and its subsidiaries.
Trademark Notice
Fibrocell®, Fibrocell Science®, the Fibrocell logo and LAVIV® are trademarks of Fibrocell Science, Inc. (Exton, PA). All other trademarks, service marks or trade names appearing in this Form 10-Q are the property of their respective owners.
EXPLANATORY NOTE
The information contained in “Item 1—Financial Statements” of this Form 10-Q gives retroactive effect to a one-for-three reverse stock split of our issued and outstanding shares of common stock effected on March 10, 2017. See Note 1 of the Notes to Condensed Consolidated Financial Statements for further information.
NOTE REGARDING FORWARD-LOOKING STATEMENTS
This Form 10-Q contains “forward-looking statements” within the meaning of the Private Securities Litigation Reform
Act of 1995. These statements include, among others, statements relating to:
• | our expectation that our existing cash resources will be sufficient to enable us to fund our operations into the second quarter of 2018; |
• | future expenses and capital expenditures; |
• | our plans to address our future capital requirements and the consequences of failing to do so; |
• | our expectation to have three-month data for the multiple patients in the Phase 1 portion of our Phase 1/2 clinical trial of FCX-007 in the third quarter of 2017 and to initiate the Phase 2 portion of the trial in the fourth quarter of 2017; |
• | our expectation to complete a toxicology/biodistribution study and submit an Investigational New Drug application (IND) for FCX-013 to the United States Food and Drug Administration (FDA) in the fourth quarter of 2017; |
• | our product development goals under our collaborations with Intrexon Corporation for all of our product candidates; |
• | the potential benefits of Fast Track, Orphan Drug and Rare Pediatric Disease designations; |
• | the potential advantages of our product candidates and technologies; and |
• | the effect of legal and regulatory developments; |
as well as other statements relating to our future operations, financial performance and financial condition, prospects, strategies, objectives or other future events. Forward-looking statements appear primarily in the sections of this Form 10-Q entitled “Item 1—Financial Statements,” and “Item 2—Management’s Discussion and Analysis of Financial Condition and Results of Operations.” In some cases, you can identify forward-looking statements by words such as “may,” “will,” “could,” “would,” “should,” “expect,” “intend,” “plan,” “anticipate,” “believe,” “estimate,” “predict,” “project,” “potential,” “continue,” “ongoing,” “scheduled” and similar expressions, although not all forward-looking statements contain these identifying words.
Forward-looking statements are based upon current expectations and assumptions and are subject to a number of known and unknown risks, uncertainties and other factors that could cause actual results to differ materially and adversely from those expressed or implied by such statements. Factors that could cause or contribute to such differences include, but are not limited to, those discussed in this Form 10-Q and our Annual Report on Form 10-K for the fiscal year ended December 31, 2016 (2016 Form 10-K) and in particular, the risks and uncertainties discussed under the caption “Item 1A—Risk Factors” of our 2016 Form 10-K. As a result, you should not place undue reliance on forward-looking statements.
Additionally, the forward-looking statements contained in this Form 10-Q represent our views only as of the date of this Form 10-Q (or any earlier date indicated in such statement). While we may update certain forward-looking statements from time to time, we specifically disclaim any obligation to do so, even if new information becomes available in the future. However, you are advised to consult any further disclosures we make on related subjects in the periodic and current reports that we file with the Securities and Exchange Commission (SEC).
The foregoing cautionary statements are intended to qualify all forward-looking statements wherever they may appear in this Form 10-Q. For all forward-looking statements, we claim protection of the safe harbor for the forward-looking statements contained in the Private Securities Litigation Reform Act of 1995.
This Form 10-Q also contains estimates, projections and other information concerning our industry, our business, and the markets for certain diseases, including data regarding the estimated size of those markets, and the incidence and prevalence of certain medical conditions. Information that is based on estimates, forecasts, projections, market research or similar methodologies is inherently subject to uncertainties and actual events or circumstances may differ materially from events and circumstances reflected in this information. Unless otherwise expressly stated, we obtained this industry, business, market and other data from reports, research surveys, studies and similar data prepared by market research firms and other third parties, industry, medical and general publications, government data and similar sources.
3
PART I. FINANCIAL INFORMATION
Item 1. Financial Statements.
Fibrocell Science, Inc.
Condensed Consolidated Balance Sheets
(unaudited)
($ in thousands, except share and per share data)
June 30, 2017 | December 31, 2016 | ||||||
Assets | |||||||
Current assets: | |||||||
Cash and cash equivalents | $ | 15,912 | $ | 17,515 | |||
Prepaid expenses and other current assets | 441 | 513 | |||||
Total current assets | 16,353 | 18,028 | |||||
Property and equipment, net of accumulated depreciation of $1,718 and $1,561, respectively | 1,534 | 1,489 | |||||
Other assets | 84 | 65 | |||||
Total assets | $ | 17,971 | $ | 19,582 | |||
Liabilities and Stockholders’ Equity | |||||||
Current liabilities: | |||||||
Accounts payable | $ | 658 | $ | 440 | |||
Related party payable | 1,678 | 942 | |||||
Accrued expenses | 769 | 1,551 | |||||
Warrant liability, current | 315 | 54 | |||||
Total current liabilities | 3,420 | 2,987 | |||||
Convertible promissory notes, net of debt discount of $18,038 and $18,088, respectively (see Note 4) | — | — | |||||
Accrued interest payable | 594 | 228 | |||||
Warrant liability, long term | 15,401 | 5,980 | |||||
Derivative liability | 1,194 | 1,735 | |||||
Deferred rent | 797 | 791 | |||||
Total liabilities | 21,406 | 11,721 | |||||
Stockholders’ equity (deficit): | |||||||
Preferred stock, $0.001 par value; 5,000,000 shares authorized: | |||||||
Series A nonredeemable convertible preferred stock; 8,000 shares designated, 8,000 shares issued and outstanding as of June 30, 2017; no shares designated, issued or outstanding as of December 31, 2016; aggregate liquidation preference of $8,100 at June 30, 2017 | — | — | |||||
Common stock, $0.001 par value; 150,000,000 shares authorized, 14,709,971 and 14,688,135 shares issued and outstanding, respectively | 15 | 15 | |||||
Additional paid-in capital | 178,138 | 170,409 | |||||
Accumulated deficit | (181,588 | ) | (162,563 | ) | |||
Total stockholders’ equity (deficit) | (3,435 | ) | 7,861 | ||||
Total liabilities and stockholders’ equity | $ | 17,971 | $ | 19,582 | |||
The accompanying notes are an integral part of these unaudited condensed consolidated financial statements.
4
Fibrocell Science, Inc.
Condensed Consolidated Statements of Operations
(unaudited)
($ in thousands, except share and per share data)
Three Months Ended June 30, | Six Months Ended June 30, | |||||||||||||||
2017 | 2016 | 2017 | 2016 | |||||||||||||
Revenue from product sales | $ | — | $ | 73 | $ | — | $ | 85 | ||||||||
Collaboration revenue | — | 14 | — | 18 | ||||||||||||
Total revenue | — | 87 | — | 103 | ||||||||||||
Cost of product sales | — | 392 | — | 409 | ||||||||||||
Cost of collaboration revenue | — | — | — | 1 | ||||||||||||
Total cost of revenue | — | 392 | — | 410 | ||||||||||||
Gross loss | — | (305 | ) | — | (307 | ) | ||||||||||
Research and development expense | 1,679 | 2,352 | 3,143 | 4,954 | ||||||||||||
Research and development expense - related party (see Note 8) | 1,678 | 925 | 3,187 | 2,249 | ||||||||||||
Selling, general and administrative expense | 1,670 | 2,540 | 3,151 | 5,280 | ||||||||||||
Intangible asset impairment expense | — | 3,905 | — | 3,905 | ||||||||||||
Restructuring costs | — | 292 | — | 292 | ||||||||||||
Operating loss | (5,027 | ) | (10,319 | ) | (9,481 | ) | (16,987 | ) | ||||||||
Other income (expense): | ||||||||||||||||
Warrant revaluation income (expense) | (9,677 | ) | 2,254 | (9,723 | ) | 7,511 | ||||||||||
Derivative revaluation income | 853 | — | 541 | — | ||||||||||||
Interest expense | (185 | ) | — | (368 | ) | — | ||||||||||
Other income (expense), net | 18 | (27 | ) | 6 | (23 | ) | ||||||||||
Loss before income taxes | (14,018 | ) | (8,092 | ) | (19,025 | ) | (9,499 | ) | ||||||||
Income taxes | — | — | — | — | ||||||||||||
Net loss | (14,018 | ) | (8,092 | ) | (19,025 | ) | (9,499 | ) | ||||||||
Dividend paid in-kind to preferred stockholders | (80 | ) | — | (100 | ) | — | ||||||||||
Deemed dividend on preferred stock (see Note 10) | (136 | ) | — | (3,870 | ) | — | ||||||||||
Net loss attributable to common stockholders | $ | (14,234 | ) | $ | (8,092 | ) | $ | (22,995 | ) | $ | (9,499 | ) | ||||
Per Share Information: | ||||||||||||||||
Net loss: | ||||||||||||||||
Basic | $ | (0.97 | ) | $ | (0.55 | ) | $ | (1.56 | ) | $ | (0.65 | ) | ||||
Diluted | $ | (0.97 | ) | $ | (0.55 | ) | $ | (1.56 | ) | $ | (0.78 | ) | ||||
Weighted average number of common shares outstanding: | ||||||||||||||||
Basic | 14,695,970 | 14,632,988 | 14,695,296 | 14,632,988 | ||||||||||||
Diluted | 14,695,970 | 14,632,988 | 14,695,296 | 14,644,999 | ||||||||||||
The accompanying notes are an integral part of these unaudited condensed consolidated financial statements.
5
Fibrocell Science, Inc.
Condensed Consolidated Statement of Stockholders’ Equity (Deficit)
(unaudited)
($ in thousands, except share data)
Series A Convertible Preferred Stock | Common Stock | Additional paid-in capital | Accumulated deficit | Total Equity (Deficit) | |||||||||||||||||||||
Shares | Amount | Shares | Amount | ||||||||||||||||||||||
Balance, December 31, 2016 | — | $ | — | 14,688,135 | $ | 15 | $ | 170,409 | $ | (162,563 | ) | $ | 7,861 | ||||||||||||
Issuance of Series A convertible preferred stock with detachable warrants, net of issuance costs of $377 | 8,000 | — | — | — | 7,623 | — | 7,623 | ||||||||||||||||||
Stock-based compensation expense | — | — | — | — | 63 | — | 63 | ||||||||||||||||||
Exercise of liability-classified warrants | — | — | 6,941 | — | 41 | — | 41 | ||||||||||||||||||
Conversion of promissory notes | — | — | 14,895 | — | 2 | — | 2 | ||||||||||||||||||
Net loss | — | — | — | — | — | (19,025 | ) | (19,025 | ) | ||||||||||||||||
Balance, June 30, 2017 | 8,000 | $ | — | 14,709,971 | $ | 15 | $ | 178,138 | $ | (181,588 | ) | $ | (3,435 | ) | |||||||||||
The accompanying notes are an integral part of these unaudited condensed consolidated financial statements.
6
Fibrocell Science, Inc.
Condensed Consolidated Statements of Cash Flows
(unaudited)
($ in thousands)
Six Months Ended June 30, | |||||||
2017 | 2016 | ||||||
Cash flows from operating activities: | |||||||
Net loss | $ | (19,025 | ) | $ | (9,499 | ) | |
Adjustments to reconcile net loss to net cash used in operating activities: | |||||||
Stock-based compensation expense | 63 | 1,125 | |||||
Warrant revaluation expense (income) | 9,723 | (7,511 | ) | ||||
Derivative revaluation income | (541 | ) | — | ||||
Inventory reserve | — | 151 | |||||
Depreciation and amortization | 184 | 391 | |||||
Loss on disposal or impairment of property and equipment | 40 | 3,970 | |||||
Recovery of doubtful accounts | — | (12 | ) | ||||
Decrease (increase) in operating assets: | |||||||
Accounts receivable | — | 12 | |||||
Inventory | — | 222 | |||||
Prepaid expenses and other current assets | 72 | 728 | |||||
Other assets | (19 | ) | (64 | ) | |||
Increase (decrease) in operating liabilities: | |||||||
Accounts payable | 192 | (3 | ) | ||||
Related party payable | 736 | (9,796 | ) | ||||
Accrued expenses and deferred rent | (776 | ) | (518 | ) | |||
Accrued interest payable | 368 | — | |||||
Deferred revenue | — | (49 | ) | ||||
Net cash used in operating activities | (8,983 | ) | (20,853 | ) | |||
Cash flows from investing activities: | |||||||
Purchase of property and equipment | (243 | ) | (143 | ) | |||
Net cash used in investing activities | (243 | ) | (143 | ) | |||
Cash flows from financing activities: | |||||||
Proceeds from 2017 Series A Preferred Stock Offering, (net of offering costs of $377) | 7,623 | — | |||||
Payment of deferred offering costs | — | (109 | ) | ||||
Principal payments on capital lease obligations | — | (2 | ) | ||||
Net cash provided by (used in) financing activities | 7,623 | (111 | ) | ||||
Net decrease in cash and cash equivalents | (1,603 | ) | (21,107 | ) | |||
Cash and cash equivalents, beginning of period | 17,515 | 29,268 | |||||
Cash and cash equivalents, end of period | $ | 15,912 | $ | 8,161 | |||
Supplemental disclosures of cash flow information: | |||||||
Non-cash investing and financing activities: | |||||||
Property and equipment in accounts payable | $ | 26 | $ | 46 | |||
Offering costs in accounts payable and accrued expenses | $ | — | $ | 11 | |||
Reduction of warrant liability upon cashless exercise of warrants | $ | 41 | $ | — | |||
Reduction in accrued interest payable upon cashless exercise of promissory notes | $ | 2 | $ | — | |||
Dividend paid in-kind to preferred stockholders | $ | 100 | $ | — | |||
Deemed dividend on preferred stock | $ | 3,870 | $ | — | |||
The accompanying notes are an integral part of these unaudited condensed consolidated financial statements.
7
Fibrocell Science, Inc.
Notes to Condensed Consolidated Financial Statements
(unaudited)
Note 1. Business and Organization
Organization
Fibrocell Science, Inc. (as used herein, “we,” “us,” “our,” “Fibrocell” or the “Company”) is the parent company of Fibrocell Technologies, Inc. (Fibrocell Tech). Fibrocell Tech is the parent company of Isolagen International, S.A., a company organized under the laws of Switzerland (Isolagen Switzerland). The Company’s international activities are currently immaterial.
Business Overview
Fibrocell is an autologous cell and gene therapy company translating personalized biologics into medical breakthroughs. The Company is focused on discovering and developing therapies for the localized treatment of diseases affecting the skin and connective tissue. All of the Company’s product candidates incorporate its proprietary autologous fibroblast technology. The Company’s research and development efforts focus on gaining regulatory approvals of its product candidates in the United States.
Liquidity and Financial Condition
The Company expects to continue to incur losses and will require additional capital to advance its product candidates through development to commercialization. As of June 30, 2017, the Company had cash and cash equivalents of approximately $15.9 million and working capital of approximately $12.9 million. The Company believes that its cash and cash equivalents at June 30, 2017 will be sufficient to fund operations into the second quarter of 2018. The Company will require additional capital to fund operations beyond that point. To meet its capital needs, the Company intends to raise additional capital through debt or equity financings, collaborations, partnerships or other strategic transactions. However, there can be no assurance that the Company will be able to complete any such transaction on acceptable terms or otherwise. The failure of the Company to obtain sufficient funds on acceptable terms when needed could have a material adverse effect on the Company’s business, results of operations and financial condition. These conditions raise substantial doubt about its ability to continue as a going concern.
On March 10, 2017, the Company implemented a one-for-three reverse split of its issued and outstanding shares of common stock (the Reverse Stock Split), as authorized at a special meeting of stockholders on March 1, 2017. The Reverse Stock Split became effective on March 10, 2017 at 5:00 pm and the Company’s common stock began trading on The NASDAQ Capital Market on a post-split basis at the open of business on March 13, 2017. As of a result of the Reverse Stock Split, every three shares of the Company’s issued and outstanding common stock were combined into one share of its common stock, except to the extent that the Reverse Stock Split resulted in any of the Company’s stockholders owning a fractional share, which was rounded up to the next highest whole share. In connection with the Reverse Stock Split, there was no change in the nominal par value per share of $0.001. The Reverse Stock Split was effectuated in order to increase the per share trading price of the Company’s common stock to satisfy the $1.00 minimum bid price requirement for continued listing on The NASDAQ Capital Market. By letter dated March 27, 2017, The NASDAQ Capital Market Listing Qualification Department, confirmed that the Company's common stock was in compliance with listing requirements.
All share and per share amounts of common stock, options and warrants in the accompanying financial statements have been restated for all periods to give retroactive effect to the Reverse Stock Split. Accordingly, the Condensed Consolidated Statement of Stockholders’ Equity reflects the impact of the Reverse Stock Split by reclassifying from “Common Stock” to “Additional paid-in capital” an amount equal to the par value of the decreased shares resulting from the Reverse Stock Split.
8
Fibrocell Science, Inc.
Notes to Condensed Consolidated Financial Statements
(unaudited)
Note 2. Basis of Presentation
General
The accompanying unaudited Condensed Consolidated Financial Statements have been prepared in accordance with U.S. generally accepted accounting principles (GAAP) for interim financial information and with the instructions to Form 10-Q and Article 10 of Regulation S-X. Accordingly, they do not include all of the information and footnote disclosures required by GAAP for complete consolidated financial statements and certain information and footnote disclosures included in the Company’s annual consolidated financial statements and accompanying notes included in the Company’s Annual Report on Form 10-K for the year ended December 31, 2016 (2016 Form 10-K), filed with the SEC, have been condensed or omitted. In the opinion of management, all adjustments (consisting of normal recurring adjustments) considered necessary to a fair statement of the results for the interim periods have been included. The year-end condensed balance sheet data was derived from audited financial statements, but does not include all disclosures required by GAAP.
These financial statements and accompanying notes should be read in conjunction with the consolidated financial statements and accompanying notes included in the Company’s 2016 Form 10-K. The Company’s significant accounting policies are described in the Notes to the Consolidated Financial Statements in the 2016 Form 10-K and updated, as necessary, in Note 3 in this Form 10-Q. The results of the Company’s operations for any interim period are not necessarily indicative of the results of operations for any other interim period or full year.
All intercompany accounts and transactions have been eliminated in consolidation. The Company's international operations are immaterial and it has no unrealized gains or losses from the sale of investments. As a result, it does not have any items that would be classified as other comprehensive income in such a statement.
Note 3. Summary of Significant Accounting Policies
Convertible Instruments
The Company has utilized various types of financing to fund its business needs, including convertible debt and convertible preferred stock with detachable warrants. The Company considers guidance within Financial Accounting Standards Board (FASB) Accounting Standards Codification (ASC) 470-20, Debt with Conversion and Other Options (ASC 470-20), ASC 480, Distinguishing Liabilities from Equity (ASC 480), and ASC 815, Derivatives and Hedging (ASC 815) when accounting for the issuance of its convertible securities. Additionally, the Company reviews the instruments to determine whether they are freestanding or contain an embedded derivative and, if so, whether they should be classified in permanent equity, mezzanine equity or as a liability at each reporting period until the amount is settled and reclassified into equity.
When multiple instruments are issued in a single transaction, the Company allocates total proceeds from the transaction among the individual freestanding instruments identified. The allocation is made after identifying (1) all the freestanding instruments and (2) the subsequent measurement basis for those instruments. The subsequent measurement basis determines how the proceeds are allocated. Generally, proceeds are allocated based on one of the following methods:
• | Fair value method - The instrument being analyzed is allocated a portion of the proceeds equal to its fair value, with the remaining proceeds allocated to the other instruments as appropriate. |
• | Relative fair value method - The instrument being analyzed is allocated a portion of the proceeds based on the proportion of its fair value to the sum of the fair values of all the instruments covered in the allocation. |
• | Residual value method - The instrument being analyzed is allocated the remaining proceeds after an allocation is made to all other instruments covered in the allocation. |
Generally, when there are multiple instruments issued in a single transaction that have different subsequent measurement bases, the proceeds from the transaction are first allocated to the instrument that is subsequently measured at fair value (i.e. - instruments accounted for as a derivative liability) at its issuance date fair value, with the residual proceeds allocated to the instrument not subsequently measured at fair value. In the event both instruments in the transaction are not
9
Fibrocell Science, Inc.
Notes to Condensed Consolidated Financial Statements
(unaudited)
Note 3. Summary of Significant Accounting Policies (continued)
subsequently measured at fair value (i.e. equity-classified instruments), the proceeds from the transaction are allocated to the freestanding instruments based on their respective fair values, using the relative fair value method.
After the proceeds are allocated to the freestanding instruments, resulting in an initial discount on the host contract, those instruments are further evaluated for embedded features (i.e. conversion options) that require bifurcation and separate accounting as a derivative financial instrument pursuant to ASC 815. Embedded derivatives are initially and subsequently measured at fair value. Under ASC 815, a portion of the proceeds received upon the issuance of the hybrid contract is allocated to the fair value of the derivative. See Note 4 for additional discussion on the identified embedded derivatives associated with the Company’s convertible notes.
The Company accounts for convertible instruments in which it is determined that the embedded conversion options should not be bifurcated from their host instruments, in accordance with ASC 470-20. Under ASC 470-20, the Company records, when necessary, discounts to convertible notes or convertible preferred stock for the intrinsic value of conversion options embedded in the convertible instruments based upon the differences between the fair value of the underlying common stock at the commitment date of the transaction and the effective conversion price embedded in the convertible instrument, unless limited by the proceeds allocated to such instrument. See Note 4 and Note 10 for additional discussion on the identified embedded features (conversion options) associated with the Company’s convertible notes and convertible preferred stock and resulting beneficial conversion features recorded.
The Company allocates issuance costs between the individual freestanding instruments identified on the same basis as proceeds were allocated. Issuance costs associated with the issuance of stock or equity contracts (i.e. equity-classified warrants and convertible preferred stock) are recorded as a charge against the gross proceeds of the offering. Issuance costs associated with the issuance of debt (i.e. convertible debt) is recorded as a direct reduction of the carrying amount of the debt liability, however, if debt issuance costs exceed the carrying amount of the debt, issuance costs are recorded to additional paid-in capital as a reduction of the beneficial conversion feature. Any issuance costs associated with the issuance of liability-classified warrants are expensed as incurred.
Income Taxes
In accordance with ASC 270, Interim Reporting, and ASC 740, Income Taxes, the Company is required at the end of each interim period to determine the best estimate of its annual effective tax rate and then apply that rate in providing for income taxes on a current year-to-date (interim period) basis. For the six months ended June 30, 2017 and 2016, the Company did not record a tax expense or benefit due to the expected current year loss and its historical losses. The Company had not recorded its net deferred tax asset as of either June 30, 2017 or December 31, 2016 because it maintained a full valuation allowance against all deferred tax assets as management has determined that it is more likely than not, that the Company will be unable to realize these future tax benefits. As of June 30, 2017 and December 31, 2016, the Company had no uncertain tax positions.
Recently Issued Accounting Pronouncements
From time to time, new accounting pronouncements are issued by the FASB and rules are issued by the SEC that we adopt as of the specified date. Unless otherwise noted, management does not believe that any recently issued accounting pronouncements issued by the FASB or guidance issued by the SEC had, or is expected to have, a material impact on the Company’s present or future consolidated financial statements.
In May 2017, the FASB issued ASU 2017-09, “Scope of Modification Accounting,” which clarifies the application of stock based accounting guidance when a change is made to the terms or conditions of a share-based payment award. The guidance is effective for the Company beginning in the first quarter of fiscal year 2018. Early adoption is permitted. The Company is currently evaluating the impact of adopting this guidance on its consolidated financial statements.
In February 2016, the FASB issued ASU 2016-02, Leases (Topic 842), which is intended to increase transparency and comparability among organizations by recognizing lease assets and lease liabilities on the balance sheet (including by lessees for those leases classified as operating leases under previous GAAP) and disclosing key information about leasing
10
Fibrocell Science, Inc.
Notes to Condensed Consolidated Financial Statements
(unaudited)
Note 3. Summary of Significant Accounting Policies (continued)
arrangements. The guidance is effective for public companies with annual reporting periods beginning after December 15, 2018, including interim periods within that reporting period. Early adoption is permitted. While the Company is currently assessing the full impact this ASU will have on its Consolidated Financial Statements, the Company believes the primary impact upon adoption will be the recognition, on a discounted basis, of its minimum commitments under the current noncancelable operating lease, as amended, for its Exton, PA facility, resulting in the recording of right of use assets and lease obligations. The Company does not anticipate any other material impacts to its Consolidated Financial Statements.
Note 4. Convertible Notes
2016 Private Placement
In September 2016, the Company issued an aggregate of $18,087,500 in principal of convertible promissory notes (each, a Note and collectively, the Notes) and accompanying warrants to purchase an aggregate of 6,029,174 shares of common stock (each a Warrant and collectively, the Warrants) in a private placement to institutional and accredited investors (each an Investor and collectively, the Investors).
The Notes bear interest at four percent (4%) per annum. Interest is earned daily and compounded quarterly and, at the election of the Company at the beginning of each quarter, shall accrue or be paid in cash. If the Company elects to have interest accrue, such interest will not be added to the principal amount of the Notes but such interest shall be subject to additional interest at the rate of four percent (4%) per annum, compounded quarterly, and shall be due and payable upon the earliest of the conversion of the Notes, exercise of the Put Right, exercise of the Prepayment Right or the Maturity Date (in each case, as defined below). Additionally, if the Company elects for interest to accrue, then (i) the Company may elect to repay any such accrued and unpaid interest in cash at any time and from time to time and (ii) each Investor may elect to have the Company repay any such accrued and unpaid interest by delivering such number of shares of common stock equal to (x) the amount of the accrued and unpaid interest to be repaid, divided by (y) the greater of (i) the last closing bid price of a share of Common Stock as reported on NASDAQ on the date of such election and (ii) the Conversion Price (as defined below). As of June 30, 2017 and for each prior quarterly period since issuance, the Company has elected to accrue interest.
All unpaid principal of each Investor’s Note is convertible, at any time and from time to time, at the option of such Investor into shares of common stock at each such Investors’ applicable conversion price (as subject to adjustment, the Conversion Price) which range from $3.40875 to $3.67875 per share.
The Notes have a maturity date of the earlier of (i) September 7, 2026 and (ii) one-hundred and eighty (180) days after the date on which the Company’s product candidate, FCX-007, is approved by the FDA for the treatment of recessive dystrophic epidermolysis bullosa (the Maturity Date). Each Investor has the right to require the Company to repay all or any portion of the unpaid principal and accrued and unpaid interest from time to time on or after September 7, 2021 (such right, a Put Right). Such Put Right must be exercised by such Investor by delivering written notice to the Company no later than one-hundred and eighty (180) days prior to such exercise date of such Put Right. In addition, upon consummation of a specified change of control transaction, each Investor may elect to accelerate the repayment of all unpaid principal and accrued interest under such Investor’s Note. If an Investor does not elect to have the Company prepay its Note upon such change of control transaction, then the Company may prepay the Notes, in an amount equal to one hundred one percent (101%) of the outstanding principal due under the Notes (together with accrued and unpaid interest due thereon) (the Prepayment Right). Additionally, upon the occurrence of certain Events of Default, as defined in the Notes, each Investor may elect to accelerate the repayment of all unpaid principal and accrued interest under each Note and the Notes provide for automatic redemption upon the occurrence of certain bankruptcy related Events of Default, as defined in the Notes.
During the three and six month periods ending June 30, 2017, $50,000 of principal value notes and related accrued interest, were converted into 14,895 shares of the Company’s common stock.
11
Fibrocell Science, Inc.
Notes to Condensed Consolidated Financial Statements
(unaudited)
Note 4. Convertible Notes (continued)
Accounting for Convertible Notes and Embedded Derivatives
The Company accounts for debt as liabilities measured at amortized cost and amortizes the resulting debt discount from allocation of proceeds to interest expense using the effective interest method over the expected term of the Notes pursuant to ASC 835, Interest (ASC 835).
See Note 3 for discussion of the Company’s policies for accounting for convertible instruments (i.e. convertible debt) with detachable liability-classified warrants. In connection with the issuance of the Notes and Warrants, the Company recorded a debt discount of approximately $18.1 million based on an allocation of proceeds to the Warrants of approximately $9.6 million, an allocation to bifurcated derivatives (which consist of a contingent put option upon a change of control or acceleration upon event of default (the Contingent Put Option) and a contingent call option upon a change of control (the Contingent Call Option) included in the Notes) of approximately $1.3 million, and a beneficial conversion feature of approximately $7.2 million, before issuance costs, based on the difference between the fair value of the underlying common stock at the commitment date of each Note transaction and the effective conversion price of the Notes, as limited by the proceeds allocated to the Notes.
Convertible promissory notes outstanding were as follows:
($ in thousands) | June 30, 2017 | December 31, 2016 | |||||
Convertible promissory notes | $ | 18,038 | $ | 18,088 | |||
Debt discount - warrants | (9,617 | ) | (9,643 | ) | |||
Debt discount - compound bifurcated derivatives | (1,269 | ) | (1,273 | ) | |||
Debt discount - beneficial conversion feature | (7,152 | ) | (7,172 | ) | |||
Convertible promissory notes, net | $ | — | $ | — | |||
The debt discount and issuance costs are amortized using the effective interest method over five years, the expected term of the Notes, and is included in interest expense in the Condensed Consolidated Statements of Operations. Amortization for the three and six months ended June 30, 2017 was $0. Based on an effective yield of approximately 1,157% resulting from the Notes being initially recorded at a full discount, the Company will not recognize any material amounts of amortization until years 2020 and 2021.
Assumptions Used in Determining Fair Value of Compound Bifurcated Derivative
The Company utilizes a binomial lattice model to value its bifurcated derivatives included in the Notes. ASC 815 does not permit an issuer to account separately for individual derivative terms and features embedded in hybrid financial instruments that require bifurcation and liability classification as derivative financial instruments. Rather, such terms and features must be combined together and fair valued as a single, compound embedded derivative. The Company selected a binomial lattice model to value the compound embedded derivative because it believes this technique is reflective of all significant assumptions that market participants would likely consider in negotiating the transfer of the Notes. Such assumptions include, among other inputs, stock price volatility, risk-free rates, credit risk assumptions, and early redemption and conversion assumptions. Additionally, there are other embedded features of the Notes requiring bifurcation, other than the Contingent Put Option and the Contingent Call Option, which had no value at June 30, 2017 or December 31, 2016 due to management’s estimates of the likelihood of certain events, but that may have value in the future should those estimates change.
12
Fibrocell Science, Inc.
Notes to Condensed Consolidated Financial Statements
(unaudited)
Note 4. Convertible Notes (continued)
The estimated fair value of the compound bifurcated derivative is determined to represent a Level 3 instrument. Significant inputs and assumptions used in the binomial lattice model for the derivative liability are as follows:
($ in thousands except per share data) | June 30, 2017 | December 31, 2016 | |||||
Calculated aggregate value | $ | 1,194 | $ | 1,735 | |||
Closing price per share of common stock | $ | 4.01 | $ | 1.89 | |||
Contractual remaining term | 9 years, 2 months | 9 years, 8 months | |||||
Contractual interest rate | 4.0 | % | 4.0 | % | |||
Volume-weighted average conversion rate | $ | 3.40973 | $ | 3.40985 | |||
Risk-free interest rate (term structure) | 0.84% - 2.30% | 0.44% - 2.45% | |||||
Dividend yield | — | — | |||||
Credit Rating | CC | CC | |||||
Credit Spread | 36.70 | % | 33.27 | % | |||
Volatility | 98.8 | % | 99.9 | % | |||
The foregoing compound bifurcated derivative was recorded at its estimated fair value at the date of issuance, with subsequent changes in estimated fair value recorded in derivative revaluation expense in the Company’s Condensed Consolidated Statements of Operations. The change in estimated fair value of the Company's derivative liability for the three and six months ended June 30, 2017 resulted in non-cash income of approximately $0.9 million and $0.5 million, respectively.
Note 5. Warrants
The Company accounts for common stock warrants as either equity instruments, derivative liabilities or liabilities depending on the specific terms of the warrant agreement. See Note 3 for further details on accounting policies related to the Company’s convertible instruments, including common stock warrants.
In connection with various financing transactions, the Company has issued warrants to purchase the Company’s common stock. In March 2017, the Company issued warrants to purchase 3,437,334 shares of its common stock in connection with the Company’s public offering of convertible preferred stock and warrants (each a Series A Warrant and collectively, the Series A Warrants), more fully described in Note 10. Each Series A Warrant has an exercise price of $2.54, will be exercisable six months after the date of issuance and will expire five years from the date of issuance.
13
Fibrocell Science, Inc.
Notes to Condensed Consolidated Financial Statements
(unaudited)
Note 5. Warrants (continued)
The Company’s outstanding warrants consist of both liability-classified warrants and equity-classified warrants. The following table summarizes outstanding warrants to purchase common stock:
Number of warrants | |||||||||||
June 30, 2017 | December 31, 2016 | Exercise Price | Expiration Dates | ||||||||
Liability-classified Warrants | |||||||||||
Issued in Series E Preferred Stock offering | 46,430 | 71,430 | $ | 2.10 | Dec 2017 | ||||||
Issued with June 2012 Convertible Notes | 375,194 | 375,194 | $ | 7.50 | Jun 2018 | ||||||
Issued in Series E Preferred Stock offering | 523,045 | 523,045 | $ | 22.50 | Dec 2018 | ||||||
Issued with September 2016 Convertible Notes | 6,029,174 | 6,029,174 | $ | 4.50 | Sep 2021 | ||||||
6,973,843 | 6,998,843 | ||||||||||
Equity-classified Warrants | |||||||||||
Issued in 2017 Series A Preferred Stock Offering | 3,437,334 | — | $ | 2.54 | Mar 2022 | ||||||
3,437,334 | — | ||||||||||
Total outstanding warrants | 10,411,177 | 6,998,843 | |||||||||
The table below is a summary of the Company’s warrant activity during the six months ended June 30, 2017:
Number of warrants | Weighted- average exercise price | |||||||||
Liability-classified | Equity-classified | Total | ||||||||
Outstanding at December 31, 2016 | 6,998,843 | — | 6,998,843 | $ | 5.98 | |||||
Granted | — | 3,437,334 | 3,437,334 | 2.54 | ||||||
Exercised | (25,000 | ) | — | (25,000 | ) | 2.10 | ||||
Expired | — | — | — | — | ||||||
Outstanding at June 30, 2017 | 6,973,843 | 3,437,334 | 10,411,177 | $ | 4.85 | |||||
Accounting for Liability-Classified Warrants
The Company’s liability-classified warrants were recorded as liabilities at their estimated fair value at the date of issuance, with the subsequent changes in estimated fair value recorded in warrant revaluation income (expense) in the Company’s Condensed Consolidated Statements of Operations in each subsequent period. The change in the estimated fair value of the warrant liability for the three and six months ended June 30, 2017 resulted in non-cash expense of approximately $9.7 million for both periods as presented. The change in the estimated fair value of the warrant liability for the three and six months ended June 30, 2016 resulted in non-cash income of approximately $2.3 million and $7.5 million, respectively.
Additionally, the liability-classified warrants are classified as either current or non-current on the Company’s Condensed Consolidated Balance Sheets based on their contractual expiration date. The Company utilizes a Monte Carlo simulation valuation method to value its liability-classified warrants.
Assumptions Used In Determining Fair Value of Liability-Classified Warrants
The estimated fair value of warrants is determined using Level 2 and Level 3 inputs (as described below). Inherent in the Monte Carlo simulation valuation method are the following assumptions:
14
Fibrocell Science, Inc.
Notes to Condensed Consolidated Financial Statements
(unaudited)
Note 5. Warrants (continued)
Volatility. The Company estimates stock price volatility based on the Company’s historical stock price performance over a period of time that matches the volume-weighted average expected remaining life of the warrants.
Risk-free interest rate. The risk-free interest rate is based on the U.S. Treasury zero-coupon yield curve in effect at the valuation date commensurate with the expected remaining life assumption.
Expected remaining life. The expected life of the warrants is assumed to be equivalent to their remaining contractual term.
Dividend rate. The dividend rate is based on the historical rate, which the Company anticipates will remain at zero.
Scenarios. The probability of complex features of the warrants being triggered is subjective (no observable inputs or available market data) and based on internal and external information known to management at the valuation date.
The following table summarizes the calculated aggregate fair values, along with the inputs and assumptions utilized in each calculation:
($ in thousands except per share data) | June 30, 2017 | December 31, 2016 | |||||
Calculated aggregate value | $ | 15,716 | $ | 6,034 | |||
Weighted average exercise price per share | $ | 6.00 | $ | 5.98 | |||
Closing price per share of common stock | $ | 4.01 | $ | 1.89 | |||
Volatility | 85.5 | % | 85.6 | % | |||
Weighted average remaining expected life | 3 years, 9 months | 4 years, 3 months | |||||
Risk-free interest rate | 1.68 | % | 1.75 | % | |||
Dividend yield | — | — | |||||
Accounting for Equity-Classified Warrants
The Company’s equity-classified warrants were issued in connection with the Company’s 2017 Series A Preferred Stock Offering (as defined below) as more fully described in Note 10. The proceeds from the 2017 Series A Preferred Stock Offering (as defined below) (including offering costs) were allocated between the Series A Warrants and Series A Preferred Stock issued in the transaction based upon their respective fair values using the relative fair value (proportional) method. The fair value of the Series A Warrants issued was estimated using the Black-Scholes option pricing model with the following assumptions: dividend yield of 0%, expected volatility of 89.69%, risk free interest rate of 2.08%, and an expected life equal to the five year contractual term. The application of the relative fair value method resulted in an allocation of $3.0 million, before deducting offering costs, to the warrants which is included as a component of net proceeds of $7.6 million recorded in “Additional paid-in capital” within the stockholders’ equity section of the Company’s Condensed Consolidated Balance Sheets as of June 30, 2017.
Note 6. Fair Value Measurements
Assets and Liabilities Measured at Fair Value on a Recurring Basis
The Company follows the guidance in ASC 820, Fair Value Measurement, to account for financial assets and liabilities measured on a recurring basis. Fair value is the price that would be received to sell an asset or paid to transfer a liability in an orderly transaction between market participants at the measurement date. As such, fair value is a market-based measurement that should be determined based on assumptions that market participants would use in pricing an asset or liability. The Company uses a fair value hierarchy, which distinguishes between assumptions based on market data (observable inputs) and an entity's own assumptions (unobservable inputs). The guidance requires fair value measurements be classified and disclosed in one of the following three categories:
15
Fibrocell Science, Inc.
Notes to Condensed Consolidated Financial Statements
(unaudited)
Note 6. Fair Value Measurements (continued)
• | Level 1: Unadjusted quoted prices in active markets that are accessible at the measurement date for identical, unrestricted assets or liabilities. |
• | Level 2: Quoted prices in markets that are not active or inputs which are observable, either directly or indirectly, for substantially the full term of the asset or liability. |
• | Level 3: Prices or valuation techniques that require inputs that are both significant to the fair value measurement and unobservable (i.e., supported by little or no market activity). |
Determining which category an asset or liability falls within the hierarchy requires significant judgment. The Company evaluates its hierarchy disclosures each reporting period. There were no transfers between Level 1, 2 and 3 during the six months ended June 30, 2017.
The following fair value hierarchy table presents information about each major category of the Company’s financial assets and liabilities measured at fair value on a recurring basis as of June 30, 2017 and December 31, 2016:
June 30, 2017 | |||||||||||||||
($ in thousands) | Level 1 | Level 2 | Level 3 | Total | |||||||||||
Assets: | |||||||||||||||
Cash and cash equivalents | $ | 12,925 | $ | — | $ | — | $ | 12,925 | |||||||
Total Assets | $ | 12,925 | $ | — | $ | — | $ | 12,925 | |||||||
Liabilities: | |||||||||||||||
Warrant liability | $ | — | $ | — | $ | 15,716 | $ | 15,716 | |||||||
Derivative liability | — | — | 1,194 | 1,194 | |||||||||||
Total Liabilities | $ | — | $ | — | $ | 16,910 | $ | 16,910 | |||||||
December 31, 2016 | |||||||||||||||
($ in thousands) | Level 1 | Level 2 | Level 3 | Total | |||||||||||
Assets: | |||||||||||||||
Cash and cash equivalents | $ | 17,515 | $ | — | $ | — | $ | 17,515 | |||||||
Total Assets | $ | 17,515 | $ | — | $ | — | $ | 17,515 | |||||||
Liabilities: | |||||||||||||||
Warrant liability | $ | — | $ | — | $ | 6,034 | $ | 6,034 | |||||||
Derivative liability | — | — | 1,735 | 1,735 | |||||||||||
Total Liabilities | $ | — | $ | — | $ | 7,769 | $ | 7,769 | |||||||
16
Fibrocell Science, Inc.
Notes to Condensed Consolidated Financial Statements
(unaudited)
Note 6. Fair Value Measurements (continued)
Changes in Level 3 Liabilities Measured at Fair Value on a Recurring Basis
Common Stock Warrants - Warrant Liability
The reconciliation of the Company’s warrant liability measured at fair value on a recurring basis using unobservable inputs (Level 3) was as follows:
Warrant | |||
($ in thousands) | Liability | ||
Balance at December 31, 2016 | $ | 6,034 | |
Exercise of warrants | (41 | ) | |
Change in fair value of warrant liability | 9,723 | ||
Balance at June 30, 2017 | $ | 15,716 | |
The fair value of the warrant liability is based on Level 3 inputs. For this liability, the Company developed its own assumptions that do not have observable inputs or available market data to support the fair value. See Note 5 for further discussion of the warrant liability.
Bifurcated Compound Derivative - Derivative Liability
The reconciliation of the derivative liability measured at fair value on a recurring basis using unobservable inputs (Level 3) was as follows:
Derivative | |||
($ in thousands) | Liability | ||
Balance at December 31, 2016 | $ | 1,735 | |
Change in fair value of derivative liability | (541 | ) | |
Balance at June 30, 2017 | $ | 1,194 | |
The fair value of the derivative liability is based on Level 3 inputs. For this liability, the Company developed its own assumptions that do not have observable inputs or available market data to support the fair value. See Note 4 for further discussion of the derivative liability.
Effect of the Company’s Stock Price and Volatility Assumptions on the Calculation of Fair Value of Financial Instruments Measured on a Recurring Basis
Common Stock Warrants - Warrant Liability
The fair value of the Company's warrant liability is based on Level 3 inputs. As discussed in Note 5, the Company uses a Monte Carlo simulation valuation method to value its liability-classified warrants. The determination of fair value as of the reporting date is affected by the Company's stock price as well as assumptions regarding a number of subjective variables that do not have observable inputs or available market data to support the fair value. These variables include, but are not limited to, expected stock price volatility over the term of the warrants and the risk-free interest rate. The primary factors affecting the fair value of the warrant liability are the Company's stock price and volatility as well as certain assumptions by the Company as to the likelihood of provisions to the underlying warrant agreements being triggered. The methods described above and in Note 5 may produce a fair value calculation that may not be indicative of net realizable value or reflective of future fair values. Furthermore, while the Company believes its valuation method is appropriate and consistent with other market participants, the use of different methodologies or assumptions to determine the fair value could result in a different fair value measurement at the reporting date.
17
Fibrocell Science, Inc.
Notes to Condensed Consolidated Financial Statements
(unaudited)
Note 6. Fair Value Measurements (continued)
Bifurcated Compound Derivative - Derivative Liability
The fair value of the derivative liability is based on Level 3 inputs. As discussed in Note 4, the Company uses a binomial lattice model to value the compound embedded derivative bifurcated from the Notes. The determination of fair value as of the reporting date is affected by the Company’s stock price as well as assumptions regarding a number of subjective variables that do not have observable inputs or available market data to support the fair value. These variables include, but are not limited to, expected stock price volatility, changes in interest rates, assumptions regarding the adjusted conversion prices in the Notes, and early redemption or conversion of the Notes. The methods described above and in Note 4 may produce a fair value calculation that may not be indicative of net realizable value or reflective of future fair values. Furthermore, while the Company believes its valuation method is appropriate and consistent with other market participants, the use of different methodologies or assumptions to determine the fair value could result in a different fair value measurement at the reporting date.
Fair Value of Certain Financial Assets and Liabilities
The Company believes that the fair values of its current assets and liabilities approximate their reported carrying amounts. The fair value of the long-term convertible promissory notes with embedded derivatives was approximately $24.3 million at June 30, 2017, based on Level 3 inputs, compared to a carrying value of $0, as a result of unamortized debt discounts.
18
Fibrocell Science, Inc.
Notes to Condensed Consolidated Financial Statements
(unaudited)
Note 7. Stock-Based Compensation
2009 Equity Incentive Plan
The Company’s Board of Directors (the Board) adopted the 2009 Equity Incentive Plan (as amended to date, the Plan) effective September 3, 2009. The Plan is intended to further align the interests of the Company and its stockholders with its employees, including its officers, non-employee directors, consultants and advisers by providing equity-based incentives. The Plan allows for the issuance of up to 2,533,333 shares of the Company’s common stock. In addition, as of June 30, 2017 there were 8,334 options outstanding that were issued outside the Plan to consultants in 2013.
The types of awards that may be granted under the Plan include options (both non-qualified stock options and incentive stock options), stock appreciation rights, stock awards, stock units and other stock-based awards. The term of each award is determined by the Compensation Committee of the Board at the time each award is granted, provided that the term of the option does not exceed ten years. Vesting schedules for stock options vary, but generally vest 25% per year, over four years for employee options and on the one year anniversary date for non-employee director options. The Plan had 1,396,423 shares available for future grants as of June 30, 2017.
Accounting for Stock-Based Compensation
The Company recognizes non-cash compensation expense for stock-based awards based on their grant date fair value, determined using the Black-Scholes option-pricing model. During the six months ended June 30, 2017 and 2016, the weighted average fair market value for options granted was and $2.12 and $1.53, respectively.
Total stock-based compensation expense recognized using the straight-line attribution method and included in operating expenses in the Condensed Consolidated Statements of Operations was approximately $0.1 million and $0.6 million for the three months ended June 30, 2017 and 2016, respectively, and approximately $0.1 million and $1.1 million for the six months ended June 30, 2017 and 2016, respectively.
Assumptions Used In Determining Fair Value of Stock Options
Inherent in the Black-Scholes option-pricing model are the following assumptions:
Volatility. The Company estimates stock price volatility based on the Company’s historical stock price performance over a period of time that matches the expected term of the stock options.
Risk-free interest rate. The risk-free interest rate is based on the U.S. Treasury yield curve in effect at the time of grant commensurate with the expected term assumption.
Expected term. The expected term of stock options granted is based on an estimate of when options will be exercised in the future. The Company applied the simplified method of estimating the expected term of the options, described in the SEC’s Staff Accounting Bulletins 107 and 110, as the historical experience is not indicative of expected behavior in the future. The expected term, calculated under the simplified method, is applied to groups of stock options that have similar contractual terms. Using this method, the expected term is determined using the average of the vesting period and the contractual life of the stock options granted.
Dividend rate. The dividend rate is based on the historical rate, which the Company anticipates will remain at zero.
Forfeitures. The Company accounts for forfeitures when they occur. Ultimately, the actual expense recognized over the vesting period will be for only those shares that vest.
19
Fibrocell Science, Inc.
Notes to Condensed Consolidated Financial Statements
(unaudited)
Note 7. Stock-Based Compensation (continued)
The fair market value of these stock options at the date of grant was estimated using the Black-Scholes option-pricing model with the following weighted average assumptions for the six months ended:
June 30, 2017 | June 30, 2016 | ||||
Expected term | 6 years, 0 months | 6 years, 1 month | |||
Interest rate | 1.95 | % | 1.40 | % | |
Dividend rate | — | — | |||
Volatility | 88.7 | % | 92.4 | % | |
Stock Option Activity
The following table summarizes stock option activity for the six months ended June 30, 2017:
($ in thousands except share and per share data) | Number of shares | Weighted- average exercise price | Weighted- average remaining contractual term | Aggregate intrinsic value | ||||||||
Outstanding at December 31, 2016 | 1,279,379 | $ | 15.16 | 7 years, 2 months | $ | — | ||||||
Granted | 295,000 | 2.88 | ||||||||||
Exercised | — | — | ||||||||||
Forfeited | (265,164 | ) | 9.70 | |||||||||
Expired | (185,389 | ) | 14.50 | |||||||||
Outstanding at June 30, 2017(1) | 1,123,826 | $ | 13.34 | 7 years, 7 months | $ | 663,098 | ||||||
Exercisable at June 30, 2017 | 650,479 | $ | 20.52 | 6 years, 2 months | $ | 92,053 | ||||||
(1) | Includes both vested stock options as well as unvested stock options for which the requisite service period has not been rendered but that are expected to vest based on achievement of a service condition. |
The total fair value of options vested during the six months ended June 30, 2017 was approximately $0.4 million. Additionally, as of June 30, 2017, there was approximately $1.1 million of unrecognized compensation expense related to non-vested stock options which is expected to be recognized over a weighted-average period of 2.4 years.
Note 8. Related Party Transactions
The Company and Intrexon Corporation (Intrexon) are parties to two distinct exclusive channel collaboration agreements including the Exclusive Channel Collaboration Agreement entered into in October 2012 and amended in June 2013 and January 2014 (as amended, the 2012 ECC) and the Exclusive Channel Collaboration Agreement entered into in December 2015 (the 2015 ECC). Pursuant to these agreements, the Company engages Intrexon for support services for the research and development of product candidates covered under the respective agreements and reimburses Intrexon for its cost for time and materials for such work. Additionally, the Company’s future commitments pursuant to these agreements include potential cash royalties and various developmental milestone payments. No royalties or milestone payments have been incurred to date.
For the three months ended June 30, 2017, the Company incurred total expenses of approximately $1.7 million with Intrexon as compared to approximately $0.9 million, for the three months ended June 30, 2016, for work performed under the 2012 ECC for each of the three month periods. During the same periods, no expenses were incurred for work performed under the 2015 ECC. Of the $1.7 million incurred during the three months ended June 30, 2017, approximately $0.3 million related to direct expenses for work performed by Intrexon and approximately $1.4 million related to pass-through costs. Of the $0.9 million incurred in the three months ended June 30, 2016, approximately $0.3 million related to direct expenses for work
20
Fibrocell Science, Inc.
Notes to Condensed Consolidated Financial Statements
(unaudited)
Note 8. Related Party Transactions (continued)
performed by Intrexon and approximately $0.6 million related to pass-through costs. These costs are presented in the Company’s “Condensed Consolidated Statement of Operations” as research and development expenses - related party.
For the six months ended June 30, 2017 and 2016, the Company incurred total expenses of approximately $3.2 million and $2.2 million, respectively, with Intrexon, for work performed under the 2012 ECC. During the same periods, no expenses were incurred for work performed under the 2015 ECC. Of the $3.2 million incurred during the 2017 period, $0.6 million related to direct expenses for work performed by Intrexon and $2.6 million related to pass-through costs. Of the $2.2 million incurred during the 2016 period, $0.8 million related to direct expenses for work performed by Intrexon and $1.4 million related to pass-through costs. These costs are presented in the Company’s “Condensed Consolidated Statement of Operations” as research and development expenses - related party.
As of June 30, 2017 and December 31, 2016, the Company had outstanding payables to Intrexon of $1.7 million and $0.9 million, respectively. These amounts are presented in the Company’s “Condensed Consolidated Balance Sheets” as related party payable.
In the 2nd quarter, Intrexon notified the Company that it received invoices for approximately $1.1 million in charges from a vendor who provides services to Intrexon and which are passed-through to the Company under the 2012 ECC. Intrexon is disputing the volume and nature of these charges and has not invoiced the Company for these charges as of June 30, 2017. The Company has recorded approximately $0.8 million of such charges as its best estimate of the amount owed.
Randal J. Kirk is the chairman of the board and chief executive officer of Intrexon and, together with his affiliates, owns more than 50% of Intrexon’s common stock. Affiliates of Randal J. Kirk (including Intrexon) own approximately 38% of the Company’s common stock. Additionally, two of the Company’s directors, Julian Kirk (who is the son of Randal J. Kirk) and Marcus Smith, are employees of Third Security, LLC, which is an affiliate of Randal J. Kirk.
Affiliates of Randal J. Kirk (including Intrexon) participated in the Company’s private placement of convertible debt securities in September 2016, more fully described in Note 4, and were issued an aggregate of $6,762,500 in principal of Notes and accompanying Warrants to purchase an aggregate of 2,254,168 shares of common stock. Additionally, affiliates of Randal J. Kirk (including Intrexon) participated in the Company's 2017 Series A Preferred Stock Offering (as defined below), more fully described in Note 10, and were issued an aggregate of 3,016 shares of Series A Preferred Stock (as defined below) and accompanying Series A Warrants to purchase 1,295,875 shares of common stock.
Note 9. Loss Per Share
Basic loss per share is computed by dividing net loss for the period by the weighted average number of shares of common stock outstanding during that period. The diluted loss per share calculation gives effect to dilutive stock options, warrants, convertible preferred stock, convertible notes and other potentially dilutive common stock equivalents outstanding during the period. Diluted loss per share is based on the if-converted method or the treasury stock method, as applicable, and includes the effect from the potential issuance of common stock, such as shares issuable pursuant to the conversion of convertible preferred stock, convertible notes and the exercise of stock options and warrants, assuming the exercise of all "in-the-money" common stock equivalents based on the average market price during the period. Common stock equivalents have been excluded where their inclusion would be anti-dilutive.
21
Fibrocell Science, Inc.
Notes to Condensed Consolidated Financial Statements
(unaudited)
Note 9. Loss Per Share (continued)
Details in the computation of basic and diluted loss per share is as follows:
Three months ended June 30, | Six months ended June 30, | ||||||||||||||
($ in thousands except share and per share data) | 2017 | 2016 | 2017 | 2016 | |||||||||||
Loss per share - basic: | |||||||||||||||
Net loss | $ | (14,018 | ) | $ | (8,092 | ) | $ | (19,025 | ) | $ | (9,499 | ) | |||
Less: Dividend paid in-kind to preferred stockholders | (80 | ) | — | (100 | ) | — | |||||||||
Less: Deemed dividend on preferred stock | (136 | ) | — | (3,870 | ) | — | |||||||||
Net loss attributable to common stockholders - basic | $ | (14,234 | ) | $ | (8,092 | ) | $ | (22,995 | ) | $ | (9,499 | ) | |||
Numerator for basic loss per share | $ | (14,234 | ) | $ | (8,092 | ) | $ | (22,995 | ) | $ | (9,499 | ) | |||
Denominator for basic loss per share | 14,695,970 | 14,632,988 | 14,695,296 | 14,632,988 | |||||||||||
Basic loss per common share | $ | (0.97 | ) | $ | (0.55 | ) | $ | (1.56 | ) | $ | (0.65 | ) | |||
Loss per share - diluted: | |||||||||||||||
Numerator for basic loss per share | $ | (14,234 | ) | $ | (8,092 | ) | $ | (22,995 | ) | $ | (9,499 | ) | |||
Adjust: Warrant revaluation income for dilutive warrants | — | — | — | 1,958 | |||||||||||
Net loss attributable to common stockholders - diluted | $ | (14,234 | ) | $ | (8,092 | ) | $ | (22,995 | ) | $ | (11,457 | ) | |||
Denominator for basic loss per share | 14,695,970 | 14,632,988 | 14,695,296 | 14,632,988 | |||||||||||
Plus: Incremental shares underlying dilutive “in the money” warrants outstanding | — | — | — | 12,011 | |||||||||||
Denominator for diluted loss per share | 14,695,970 | 14,632,988 | 14,695,296 | 14,644,999 | |||||||||||
Diluted net loss per common share | $ | (0.97 | ) | $ | (0.55 | ) | $ | (1.56 | ) | $ | (0.78 | ) | |||
The following potentially dilutive securities have been excluded from the computations of diluted weighted-average shares outstanding, as their effect would be anti-dilutive:
Three months ended June 30, | Six months ended June 30, | ||||||||||
2017 | 2016 | 2017 | 2016 | ||||||||
“In the money” stock options | 239,611 | 72,000 | 196,765 | 181,834 | |||||||
“Out of the money” stock options | 717,841 | 1,326,768 | 709,973 | 1,185,621 | |||||||
“In the money” warrants | 46,430 | — | 46,430 | — | |||||||
“Out of the money” warrants | 10,364,747 | 1,780,491 | 10,364,747 | 1,583,915 | |||||||
Shares underlying convertible notes | 5,303,665 | — | 5,304,097 | — | |||||||
Shares underlying convertible accrued interest on convertible notes | 175,850 | — | 175,864 | — | |||||||
Shares underlying convertible preferred stock | 3,480,000 | — | 3,460,000 | — | |||||||
22
Fibrocell Science, Inc.
Notes to Condensed Consolidated Financial Statements
(unaudited)
Note 10. Equity
Preferred Stock
The Company is authorized to issue 5,000,000 shares of preferred stock, at a par value of $0.001 per share, in one or more series and to fix the rights, preferences, privileges, and restrictions thereof. These rights, preferences and privileges could include dividend rights, conversion rights, voting rights, terms of redemption, liquidation preferences, sinking fund terms and the number of shares constituting any series or the designation of such series, any or all of which may be greater than the rights of common stock. The issuance of the Company’s preferred stock could adversely affect the voting power of holders of common stock and the likelihood that such holders will receive dividend payments and payments upon liquidation. In addition, the issuance of preferred stock could have the effect of delaying, deferring or preventing a change of control of the Company or other corporate action.
Series A Convertible Preferred Stock
In March 2017, the Board authorized the issuance of 8,000 shares of preferred stock designated as Series A Convertible Preferred Stock (the Series A Preferred Stock). The rights, preferences and privileges of the Series A Preferred Stock is set forth in the Certificate of Designation of Preferences, Rights and Limitations of Series A Convertible Preferred Stock dated March 7, 2017 (Certificate of Designation).
On March 7, 2017, the Company entered into a securities purchase agreement with certain of its existing accredited investors pursuant to which the Company agreed to sell a total of 8,000 units (the Units) for a purchase price of $1,000 per Unit, with each Unit consisting of (i) one share of the Company’s Series A Preferred Stock, with an initial stated value of $1,000 and is convertible into shares of the Company’s common stock with a conversion price of $2.3271 and (ii) a warrant to purchase up to a number of shares of common stock equal to 100% of the conversion shares issuable on March 7, 2017 pursuant to the shares of Series A Preferred Stock purchased by each investor (collectively, the 2017 Series A Preferred Stock Offering). See Note 5 for discussion of the Series A Warrants issued in connection with the 2017 Series A Preferred Stock Offering. The 2017 Series A Preferred Stock Offering closed on March 8, 2017 and resulted in gross proceeds of $8.0 million, before deducting offering costs.
The proceeds from the 2017 Series A Preferred Stock Offering (including offering costs) were allocated between the Series A Warrants and Series A Preferred Stock issued in the transaction based upon their respective fair values using the relative fair value (proportional) method. The fair value of the Series A Preferred Stock issued was calculated as the sum of (i) the value of the Series A Preferred Stock as if it had been converted into common stock on the issuance date and (ii) the value of a perpetual annuity paying a 4% dividend rate in conversion shares for five years and 8% thereafter. In connection with the valuation, the following assumptions were used: risk free interest rate of 3.15%, credit spread of 31.27% and a market yield of 34.42%. The application of the relative fair value method resulted in an allocation of gross proceeds to the Series A Preferred Stock of approximately $1.3 million, net of discounts of $3.0 million attributed to the warrants (See Note 5) and $3.7 million from a beneficial conversion feature. The discount attributed to the beneficial conversion feature was immediately amortized as the Series A Preferred Stock has no stated redemption date and is convertible at the issuance date. For the six months ended June 30, 2017 the Company recognized $3.7 million of amortization of the discount on the Series A Preferred Stock as deemed dividends charged to additional paid-in capital (in the absence of retained earnings). The value of the beneficial conversion feature is calculated as the difference between the effective conversion price of the Series A Preferred Stock and the fair market value of the common stock into which the Series A Preferred Stock are convertible at the commitment date.
The discount attributed to the warrants is being accreted using the effective interest method and charged as a deemed dividend to additional paid-capital (in the absence of retained earnings), over the five-year period of the Series A Preferred Stock in which the stated dividend rate is 4%. For the six months ended June 30, 2017 the Company recognized approximately $0.1 million in deemed dividends due to the accretion of the warrant discount.
The 2017 Series A Preferred Stock Offering securities purchase agreement contains customary representations, warranties, and agreements by the Company. The securities purchase agreement also contains customary prohibitions on certain Company payments, the incurrence of certain senior and pari passu debt, certain affiliate transactions and the incurrence of certain liens.
23
Fibrocell Science, Inc.
Notes to Condensed Consolidated Financial Statements
(unaudited)
Note 10. Equity (continued)
Holders of the Series A Preferred Stock are entitled to receive cumulative dividends at a rate per share of 4% per annum (with such dividend rate increasing to 8% per annum on the five year anniversary of the original issuance of the Series A Preferred Stock), with such dividends compounded quarterly and payable only by way by increasing the stated value of the
Series A Preferred Stock in accordance with the terms of the Certificate of Designation. For each of the three and six months ended June 30, 2017 cumulative dividends paid in-kind to holders of the Series A Preferred Stock were approximately
$0.1 million.
Shares of Series A Preferred Stock generally have no voting rights, except as required by law; provided, however, that without the prior written consent of the holders of at least 70% of the then outstanding shares of Series A Preferred Stock, the Company may not: (i) alter or change adversely the powers, preferences or rights given to the Series A Preferred Stock or alter or amend the Certificate of Designation; (ii) amend the Company’s certificate of incorporation or other charter documents in any manner that adversely affects any rights of a holder of the Series A Preferred Stock; (iii) authorize or create any class of stock ranking as to redemption, distribution of assets upon liquidation or dividends senior to, or otherwise pari passu with, the Series A Preferred Stock; (iv) declare or make any dividends other than dividend payments or other distributions payable solely in the Common Stock; or (v) enter into any agreement with respect to any of the foregoing.
Upon a liquidation, dissolution or winding up of the Company, the holders of the Series A Preferred Stock are entitled to receive out of the Company’s assets, whether capital or surplus, an amount equal to such holder’s then stated value for each share of Series A Preferred Stock before any distribution to the holders of the Common Stock, any class or series of preferred stock and all other Common Stock equivalents other than those securities which are explicitly senior or pari passu to the Series A Preferred Stock in redemption, distribution of assets upon a liquidation or dividends. If there are insufficient assets to pay in full such amounts, then the available assets will be ratably distributed to the holders of the Series A Preferred Stock in accordance with the respective amounts that would be payable on such shares if all amounts payable thereon were paid in full.
24
Item 2. Management’s Discussion and Analysis of Financial Condition and Results of Operations.
The following discussion and analysis should be read in conjunction with:
• | our unaudited Condensed Consolidated Financial Statements and accompanying notes included in Part I, Item 1 of this Quarterly Report on Form 10-Q (this Form 10-Q); and |
• | our audited consolidated financial statements and accompanying notes included in our Annual Report on Form 10-K for 2016 (2016 Form 10-K), as well as the information contained under the heading “Management’s Discussion and Analysis of Financial Condition and Results of Operations” in our 2016 Form 10-K. |
Overview
We are an autologous cell and gene therapy company focused on translating personalized biologics into medical breakthroughs for diseases affecting the skin and connective tissue. Our approach to personalized biologics is distinctive and the foundation of our personalized biologics platform is our proprietary autologous fibroblast technology. Fibroblasts are the most common cell in skin and connective tissue and are responsible for synthesizing extracellular matrix proteins, including collagen and other growth factors, that provide structure and support. Because fibroblasts naturally reside in the localized environment of the skin and connective tissue, they represent an ideal delivery vehicle for proteins targeted to these areas. We target the underlying cause of disease by using fibroblast cells from a patient's skin to create localized therapies with genetic modification that are compatible with the unique biology of the patient (i.e., autologous).
We are focused on discovering and developing localized therapies for diseases affecting the skin and connective tissue, where there are high unmet needs, to improve the lives of patients and their families. In that regard, we commit significant resources to our research and development programs. Currently, all of our research and development operations and focus are on gaining regulatory approvals to commercialize our product candidates in the United States; however, we may seek to expand into international markets in the future.
Our current pipeline consists of the following product candidates which we are developing in collaboration with Intrexon Corporation (Intrexon):
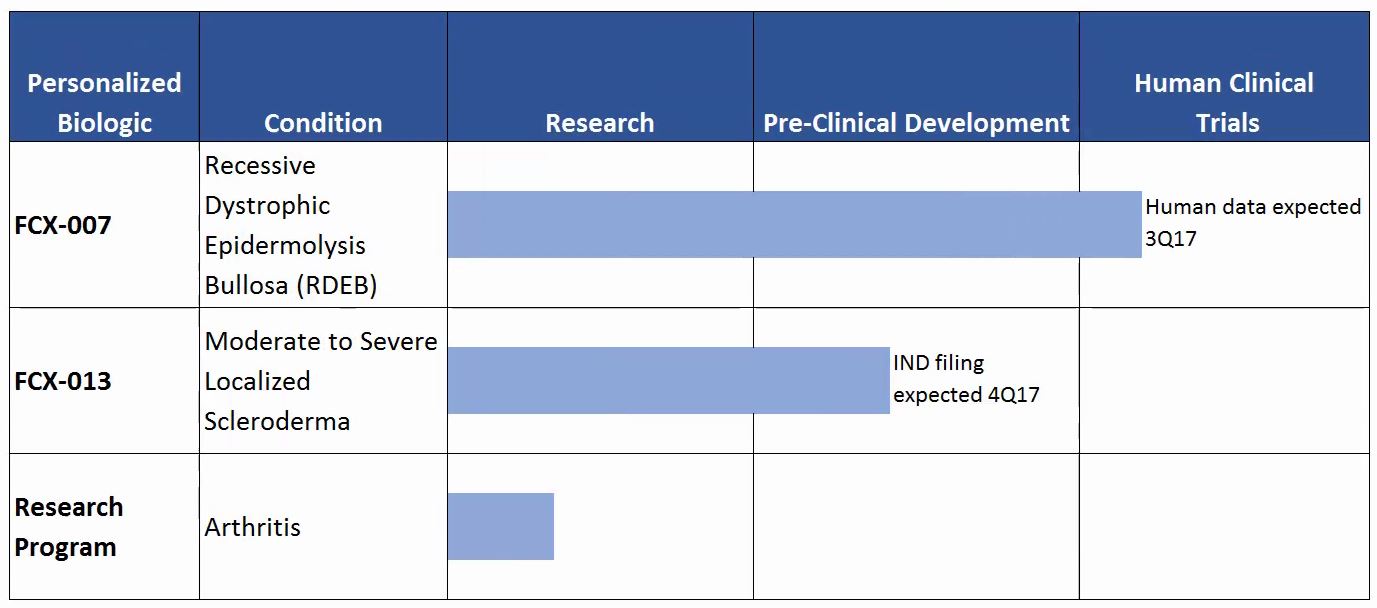
Our most advanced product candidate, FCX-007, is currently in a Phase 1/2 trial for the treatment of recessive dystrophic epidermolysis bullosa (RDEB). We are also in pre-clinical development of FCX-013, our product candidate for the treatment of moderate to severe localized scleroderma. In addition, we have a third program in the research phase for the treatment of arthritis and related conditions. See further discussion of our gene-therapy product candidates under the heading “Development Programs" below.
25
Intrexon Collaborations
We collaborate with Intrexon Corporation, a related party, through two distinct exclusive channel collaboration agreements consisting of the Exclusive Channel Collaboration Agreement entered into in October 2012 and amended in June 2013 and January 2014 (as amended, the 2012 ECC) and the Exclusive Channel Collaboration Agreement entered into in December 2015 (the 2015 ECC). Pursuant to these agreements, we engage Intrexon for support services for the research and development of product candidates covered under the respective agreements and reimburse Intrexon for its cost for time and materials for such work. We are developing FCX-007 and FCX-013 under the 2012 ECC and we are in the research phase for a gene-therapy treatment for arthritis and related conditions under the 2015 ECC. For additional details, see Note 8 in the accompanying Notes to the Condensed Consolidated Financial Statements included in this Form 10-Q and additional disclosures included in our 2016 Form 10-K.
Development Programs
FCX-007 for Recessive Dystrophic Epidermolysis Bullosa
RDEB is the most severe form of dystrophic epidermolysis bullosa (DEB), a congenital, progressive, devastatingly painful and debilitating genetic disorder that often leads to death. RDEB is caused by a mutation of the COL7A1 gene, the gene which encodes for type VII collagen (COL7), a protein that forms anchoring fibrils. Anchoring fibrils hold together the layers of skin, and without them, skin layers separate causing severe blistering, open wounds and scarring in response to friction, including normal daily activities like rubbing or scratching. Children who inherit this condition are often called “butterfly children” because their skin can be as fragile as a butterfly’s wings. We estimate that there are approximately 1,100 - 2,500 RDEB patients in the U.S. Currently, treatments for RDEB address only the sequelae, including daily bandaging (which can cost a patient in excess of $10,000 per month), hydrogel dressings, antibiotics, feeding tubes and surgeries.
Our lead product candidate, FCX-007, is in clinical development for the treatment of RDEB. FCX-007 is a genetically-modified autologous fibroblast that encodes the gene for COL7 for localized treatment of RDEB and is being developed in collaboration with Intrexon. By genetically modifying autologous fibroblasts ex vivo to produce COL7, culturing them and then treating blisters and wounds locally via injection, FCX-007 offers the potential to address the underlying cause of the disease by providing high levels of COL7 directly to the affected areas, thereby avoiding systemic treatment. In addition, we believe the autologous nature of the cells, localized delivery, use of an integrative vector and the low turnover rate of the protein will contribute to long-term persistence of the COL7 produced by FCX-007.
FCX-007 has received Orphan Drug Designation for the treatment of DEB, including RDEB, Rare Pediatric Disease Designation for the treatment of RDEB and Fast Track Designation for the treatment of RDEB from the United States Food and Drug Administration (FDA).
Phase 1/2 Clinical Trial of FCX-007 for RDEB
The primary objective of this open-label trial is to evaluate the safety of FCX-007 in RDEB patients. Additionally, the trial will assess (i) the mechanism of action of FCX-007 through the evaluation of type VII collagen expression and the presence of anchoring fibrils and (ii) the efficacy of FCX-007 through intra-subject paired analysis of target wound area by comparing FCX-007 treated wounds to untreated wounds in Phase 1 and to wounds administered with sterile saline in Phase 2 through the evaluation of digital imaging of wounds. Six adult patients are targeted for treatment with FCX-007 in the Phase 1 portion of the trial and six pediatric patients in the Phase 2 portion of the trial. Prior to enrolling pediatric patients, we are required to obtain allowance from the FDA by submitting evidence of FCX-007 safety and benefit in adult patients and data from its completed pre-clinical toxicology study.
We are actively recruiting adult patients to complete enrollment in the Phase 1 portion of the trial and currently have four of the six adult patients enrolled. The patients in the Phase 1 portion of the trial are divided into two equal cohorts in order to evaluate the safety of FCX-007 in each population type. One cohort is comprised of patients who have positive expression of the non-collagenous portion of COL7 protein (NC1+) and the other cohort is comprised of patients who do not express the non-collagenous portion of the protein (NC1-). Patients enrolled to date fulfilled the NC1+ cohort and also provided the first patient for the NC1- cohort. Two more patients are required for the NC1- cohort to complete enrollment in the Phase 1 portion of the trial. The clinical trial protocol is designed to allow a cohort to move into the Phase 2 portion of the trial even if the other cohort is still enrolling or in the follow-up evaluation period.
26
The first adult patient in the NC1+ cohort in the Phase 1 portion of the Phase 1/2 clinical trial was dosed in the first quarter of 2017. In May 2017, the Data Safety Monitoring Board (DSMB) recommended continuation of the Phase 1/2 clinical trial of FCX-007 for the treatment of RDEB, following a planned review of safety data from the first patient treated in the Phase 1 portion of the trial. No product-related adverse events were reported. Based on the DSMB’s recommendation, the remaining two patients in the NC1+ cohort in the Phase 1 portion of the trial were dosed in June 2017. We expect to have twelve-week post-treatment data for safety, mechanism of action and efficacy for multiple patients in the Phase 1 portion of the trial in the third quarter of 2017 and expect to initiate the Phase 2 portion of trial in the fourth quarter of 2017.
FCX-013 for Localized Scleroderma
Localized scleroderma, of which linear scleroderma is a subtype, is a chronic autoimmune skin disorder that manifests as excess production of extracellular matrix, specifically collagen, resulting in thickening of the skin and connective tissue. The localized areas of skin thickening may extend to underlying tissue and muscle in children which can impair growth and development. Lesions appearing across joints can be painful, impair motion and may be permanent. Current treatments for localized scleroderma, which include systemic or topical corticosteroids, UVA light therapy and physical therapy, only address the symptoms of the disorder. We estimate that there are approximately 90,000 patients in the U.S. considered to have severe localized scleroderma.
Our second gene-therapy product candidate, FCX-013, is in pre-clinical development for the treatment of moderate to severe localized scleroderma. FCX-013 is an autologous fibroblast genetically-modified using lentivirus and encoded for matrix metalloproteinase 1 (MMP-1), a protein responsible for breaking down collagen. FCX-013 incorporates Intrexon’s proprietary RheoSwitch Therapeutic System® (RTS®), a biologic switch activated by an orally administered compound to control protein expression at the site of localized scleroderma lesions. FCX-013 is designed to be injected under the skin at the location of the fibrotic lesions where the genetically-modified fibroblast cells will produce MMP-1 to break down excess collagen accumulation. With the FCX-013 therapy, the patient will take an oral compound to facilitate protein expression. Once the fibrosis is resolved, the patient will stop taking the oral compound which will control further MMP-1 production.
We have successfully completed a proof-of-concept study for FCX-013 in which the primary objective was to determine whether FCX-013 had the potential to reduce dermal thickness in fibrotic tissue. In this study, FCX-013 was evaluated in a bleomycin-induced scleroderma model utilizing severe combined immunodeficiency (SCID) mice. Data from the study demonstrated that FCX-013 reduced dermal thickness of fibrotic tissue to levels similar to that of the non-treated control and further reduced the thickness of the sub-dermal muscle layer. Based upon these data and the FDA’s feedback to our pre-Investigational New Drug application (IND) briefing package, we advanced FCX-013 into a pre-clinical dose-ranging study which has been completed. We expect to complete a toxicology/biodistribution study and submit an IND application for FCX-013 to the FDA in the fourth quarter of 2017.
FCX-013 has received Orphan Drug Designation from the FDA for the treatment of localized scleroderma and Rare Pediatric Disease Designation for moderate to severe localized scleroderma.
New Gene Therapy Program for Arthritis and Related Conditions
Arthritis is a broad term that covers a group of more than 100 different types of diseases that affect the joints, as well as connective tissues and organs, including the skin. According to the Centers for Disease Control and Prevention, arthritis—characterized by joint inflammation, pain and decreased range of motion—is the United States’ most common cause of disability affecting more than 52 million adults as well as 300,000 children at a cost exceeding $120 billion.
Our third gene-therapy program is in the research phase and is focused on the treatment of arthritis and related conditions. Our goal is to deliver a protein therapy locally to the joint to provide sustained efficacy while avoiding key side effects typically associated with systemic therapy.
27
Financial Condition, Liquidity and Capital Resources
Financial Condition
We have experienced losses since our inception. As of June 30, 2017, we had an accumulated deficit of $181.6 million. The process of developing and commercializing our product candidates requires significant research and development efforts and clinical trial work, as well as significant manufacturing and process development. These activities, together with our selling, general and administrative expenses, are expected to continue to result in significant operating losses for the foreseeable future.
Our financial condition is summarized below as of the following dates and is intended to supplement the more detailed discussion that follows:
June 30, 2017 | December 31, 2016 | ||||||
($ in thousands) | |||||||
Cash and cash equivalents | $ | 15,912 | $ | 17,515 | |||
Working capital: | |||||||
Total current assets | $ | 16,353 | $ | 18,028 | |||
Less: Total current liabilities | 3,420 | 2,987 | |||||
Net working capital | $ | 12,933 | $ | 15,041 | |||
Convertible notes payable (gross principal) | $ | 18,038 | $ | 18,088 | |||
Stockholders’ equity (deficit) | $ | (3,435 | ) | $ | 7,861 | ||
Liquidity and Capital Resources
Our principal sources of liquidity are cash and cash equivalents of $15.9 million and net working capital of $12.9 million as of June 30, 2017. Net working capital decreased approximately $2.1 million, or 14.0%, from December 31, 2016 to June 30, 2017. This decrease is primarily the result of the net loss incurred for the first six months of 2017, and is partially offset by proceeds from our 2017 Series A Preferred Stock Offering (discussed below). We believe that our existing cash and cash equivalents will be sufficient to fund our operations into the second quarter of 2018; however, changing circumstances may cause us to consume capital faster than we currently anticipate, and we may need to spend more money than currently expected because of such circumstances. We will require additional capital to fund operations beyond that point and prior to our business achieving significant net cash from operations. Our future capital requirements may be substantial, and will depend on many factors, including, but not limited to:
• | the cost of clinical activities and outcomes related to our Phase 1/2 clinical trial of FCX-007; |
• | the costs of pre-clinical activities and outcomes related to FCX-013, for which we expect to file an IND with the FDA in the fourth quarter of 2017; |
• | the cost of research related to our gene-therapy product candidate for arthritis and related conditions under the 2015 ECC; |
• | the cost of additional pre-clinical studies and clinical trials in order to obtain regulatory approvals for our product candidates; |
• | the cost of regulatory submissions, as well as the preparation, initiation and execution of clinical trials in potential new clinical indications; and |
• | the cost of filing, surveillance around, prosecuting, defending and enforcing patent claims. |
To meet our capital needs, we consider multiple alternatives, including but not limited to equity financings, debt financings, corporate collaborations, partnerships and other strategic transactions and funding opportunities. However, there is no assurance that we will be able to complete any such transaction or obtain the additional required capital on acceptable terms or otherwise. Furthermore, the covenants under our convertible notes limit our ability to obtain additional debt financing. If we raise additional funds by issuing equity securities, our stockholders will experience dilution. Debt financing, if available, will
28
result in increased fixed payment obligations and may involve agreements that include covenants limiting or restricting our ability to take specific actions, such as incurring additional debt, making capital expenditures or declaring dividends. Any debt or equity financing that we complete may contain terms, such as liquidation and other preferences, which are not favorable to us or our stockholders. If we raise additional funds through collaboration or partnership arrangements with third parties, it may be necessary to relinquish valuable rights to our technologies, future revenue streams or product candidates or to grant licenses on terms that may not be favorable to us.
If we are unable to raise additional capital in sufficient amounts or on terms acceptable to us, we will need to curtail and reduce our operations and costs and modify our business strategy which may require us to, among other things:
• | significantly delay, scale back or discontinue the development or commercialization of one or more of our product candidates or one or more of our other research and development initiatives; |
• | seek collaborators for one or more of our current or future product candidates at an earlier stage than otherwise would be desirable or on terms that are less favorable than might otherwise be available; or |
• | sell or license on unfavorable terms our rights to technologies or product candidates that we otherwise would seek to develop or commercialize ourselves. |
Additionally, failure to obtain the necessary capital in a timely manner could require us to seek bankruptcy protection or result in our breach or default under agreements on which our business relies or pursuant to which we obtain valuable rights which could result in, among other things, the potential acceleration of payments thereunder or the termination of such agreements.
These factors raise substantial doubt about our ability to continue as a going concern. As a result, our independent registered public accounting firm included an explanatory paragraph in its audit report on our consolidated financial statements for the year ended December 31, 2016 related to our ability to continue as a going concern.
Also, see Risks Related to Our Financial Position and Need for Additional Capital included within Part I, Item 1A, "Risk Factors" of our 2016 Form 10-K.
2017 Series A Preferred Stock Offering
On March 8, 2017, we completed our public offering of convertible preferred stock and warrants with certain of our existing investors, including Intrexon. After deducting offering expenses, net proceeds from the offering (excluding proceeds, if any, from future warrant exercises), were approximately $7.6 million. For additional details, see Note 10, Equity and Note 8, Related Party Transactions, to the Condensed Consolidated Financial Statements, included in Part I of this Form 10-Q.
29
Cash Flows
Our cash flow activity is summarized below for the following periods:
Six months ended June 30, | |||||||
($ in thousands) | 2017 | 2016 | |||||
Net cash flows (used in) provided by: | |||||||
Operating activities | $ | (8,983 | ) | $ | (20,853 | ) | |
Investing activities | $ | (243 | ) | $ | (143 | ) | |
Financing activities | $ | 7,623 | $ | (111 | ) | ||
Operating Activities. Cash used in operating activities during the six months ended June 30, 2017 was approximately $9.0 million, a decrease of $11.9 million as compared to the same period last year, due primarily to the $10 million up-front technology access fee payment to Intrexon in January 2016 in connection with the 2015 ECC which did not reoccur in 2017. In addition in the 2016 period $3.9 million in costs were incurred for disposal and impairment costs of property and equipment related to the decommissioning of our azficel-T manufacturing facility.
Investing Activities. Cash used in investing activities during both the six months ended June 30, 2017 and 2016 was related solely to equipment purchases.
Financing Activities. Cash provided by financing activities during the six months ended June 30, 2017 was approximately $7.6 million and related to net proceeds from our 2017 Series A Preferred Stock Offering. Cash used in financing activities during the six months ended June 30, 2016 was related primarily to payments of deferred offering costs in connection with our “at-the-market” equity offering program.
30
Results of Operations
Comparison of Three and Six Months Ended June 30, 2017 and 2016
Research and Development Expense
For each of our research and development programs, we incur both direct and indirect expenses. We track direct research and development expenses by program, which include third party costs such as contract research, consulting and preclinical development costs and clinical trial and manufacturing costs. We do not allocate indirect research and development expenses, which may include regulatory, laboratory (equipment and supplies), personnel, facility, process development and other overhead costs (including depreciation and amortization), to specific programs, as these expenses are to be deployed across all of our product candidates. We expect research and development costs to continue to be significant for the foreseeable future as a result of our pre-clinical studies and clinical trials, as well as our ongoing collaborations with Intrexon.
Direct research and development costs, by major program, and indirect research and development costs, by major component, were as follows:
For the Three Months Ended June 30, | For the Six Months Ended June 30, | |||||||||||||||||||||
($ in thousands) | 2017 | 2016 | % Change | 2017 | 2016 | % Change | ||||||||||||||||
Direct costs: | ||||||||||||||||||||||
FCX-007 | $ | 1,731 | $ | 895 | 93.4 | % | $ | 2,973 | $ | 1,918 | 55.0 | % | (1) | |||||||||
FCX-013 | 406 | 109 | 272.5 | % | 1,065 | 419 | 154.2 | % | (2) | |||||||||||||
Other | 30 | 157 | (80.9 | )% | 32 | 226 | (85.8 | )% | (3) | |||||||||||||
Total direct costs | 2,167 | 1,161 | 86.6 | % | 4,070 | 2,563 | 58.8 | % | ||||||||||||||
Indirect costs: | ||||||||||||||||||||||
Regulatory costs | 14 | 275 | (94.9 | )% | 61 | 450 | (86.4 | )% | (4) | |||||||||||||
Intangible amortization | — | 93 | (100.0 | )% | — | 231 | (100.0 | )% | (5) | |||||||||||||
Compensation and related expense | 541 | 959 | (43.6 | )% | 1,007 | 2,055 | (51.0 | )% | (6) | |||||||||||||
Process development | 6 | 401 | (98.5 | )% | 6 | 999 | (99.4 | )% | (7) | |||||||||||||
Other indirect R&D costs | 629 | 388 | 62.1 | % | 1,186 | 905 | 31.0 | % | (8) | |||||||||||||
Total indirect costs | 1,190 | 2,116 | (43.8 | )% | 2,260 | 4,640 | (51.3 | )% | ||||||||||||||
Total research and development expense | $ | 3,357 | $ | 3,277 | 2.4 | % | $ | 6,330 | $ | 7,203 | (12.1 | )% | ||||||||||
(1) | Costs for our FCX-007 program increased approximately $0.8 million, or 93.4%, for the three months ended June 30, 2017 compared to the same period in 2016. Costs increased approximately $1.1 million, or 55.0%, for the six months ended June 30, 2017 compared to the same period in 2016. The increases were due primarily to the progression of FCX-007 into clinical development, and costs specifically related to the Phase 1 portion of our Phase 1/2 clinical trial of FCX-007 in adults in which we dosed an additional two patients in the second quarter of 2017. More specifically, these costs include clinical research organization and clinical site fees, as well as product manufacturing costs. Costs incurred in the prior period related to completion of pre-clinical development activities. |
Through June 30, 2017, we have incurred approximately $23.5 million in direct research and development costs related to this program, life-to-date, which include non-cash expenses of $6.9 million in stock issuance costs associated with the 2012 ECC with Intrexon. Other costs include product and assay development, key opinion leader development, pre-clinical studies and manufacturing, the design of the Phase 1/2 clinical trial protocol and recruiting patients. Going forward, research and development investments for this program are expected to support clinical product manufacturing, statistical analyses, report generation and future clinical trial costs.
(2) | Costs for our FCX-013 program increased approximately $0.3 million, or 272.5%, for the three months ended June 30, 2017 compared to the same period in 2016. Costs increased approximately $0.6 million, or 154.2%, for the six months ended June 30, 2017 compared to the same period in 2016. The increases were due primarily to progression of the pre-clinical development of FCX-013. Costs incurred during 2017 related primarily to the execution of a pre-clinical dose-ranging study which commenced in the fourth quarter of 2016, pre-clinical product manufacturing (i.e.vector |
31
manufacturing) and certain IND-enabling work while costs incurred during the 2016 period related primarily to the completion of our proof-of-concept study.
Through June 30, 2017, we have incurred approximately $ 11.8 million in direct research and development costs related to this program, life-to-date, which include non-cash expenses of $6.4 million in stock issuance costs with the 2012 ECC with Intrexon. Other costs include product and assay development and pre-clinical work, including execution of our proof-of concept and pre-clinical dose-ranging studies. Going forward, research and development investments for this program are expected to support ongoing product and assay development, pre-clinical study execution, key opinion leader development, National Institutes of Health Recombinant DNA Advisory Committee meeting preparation expenses, and the design and execution of clinical trials.
(3) | Other costs decreased approximately $0.1 million, or 80.9% and $0.2 million or 85.8 % for the three and six months ended June 30, 2017 as compared to the same periods in 2016. These decreases are due to the stoppage of research and development activities for azficel-T for vocal cord scarring as of June 30, 2016. |
(4) | Regulatory costs decreased approximately $0.3 million, or 94.9%, for the three months ended June 30, 2017 as compared to the same period in 2016. Costs decreased approximately $0.4 million, or 86.4%, for the six months ended June 30, 2017 compared to the same period in 2016. The decreases were due primarily to a decrease in costs incurred with the FDA for fees levied under the Prescription Drug User Fee Act (PDUFA). The decrease in fees resulted from our decision to wind-down azficel-T (including LAVIV), which, beginning in the fourth quarter of 2016, exempted us from being assessed annual product registration and establishment fees imposed under PDUFA, which will result in cost savings of approximately $0.2 million per quarter. |
(5) | Intangible amortization decreased approximately $0.1 million, or 100.0%, for the three months ended June 30, 2017 and $0.2 million, or 100.0%, for the six months ended June 30, 2017 as compared to the same periods in 2016, due to the impairment of our intangible assets during the second quarter of 2016 which resulted in no subsequent amortization expense. |
(6) | Compensation and related expense decreased approximately $0.4 million, or 43.6%, for the three months ended June 30, 2017 and $1.0 million, or 51.0%, for the six months ended June 30, 2017 as compared to the same periods in 2016, due primarily to decreases in salaries, benefits and bonus expense resulting from the reduction in workforce associated with the aforementioned wind-down of azficel-T operations which occurred in June 2016. |
(7) | Process development costs decreased approximately $0.4 million, or 98.5%, for the three months ended June 30, 2017 and approximately $1.0 million, or 99.4%, for the six months ended June 30, 2017 as compared to the same periods in 2016, as a result primarily of internal process development work being halted in June 2016 in connection with the aforementioned wind-down of azficel-T operations and related restructuring initiatives. |
(8) | Other indirect costs increased approximately $0.2 million, or 62.1%, for the three months ended June 30, 2017 and approximately $0.3 million, or 31.0%, for the six months ended June 30, 2017 as compared to the same periods in 2016. These increases were primarily the result of increased lab supplies expenses, used primarily for the FCX-007 and FCX-013 clinical and pre-clinical manufacturing and support activities. |
32
Selling, General and Administrative Expense
Selling, general and administrative expense was comprised of the following:
For the Three Months Ended June 30, | For the Six Months Ended June 30, | |||||||||||||||||||||
($ in thousands) | 2017 | 2016 | % Change | 2017 | 2016 | % Change | ||||||||||||||||
Compensation and related expense | $ | 449 | $ | 1,352 | (66.8 | )% | $ | 777 | $ | 2,750 | (71.7 | )% | (1) | |||||||||
Severance expense | — | — | — | % | 137 | — | — | % | (2) | |||||||||||||
Professional fees | 475 | 434 | 9.4 | % | 962 | 1,018 | (5.5 | )% | ||||||||||||||
Facilities and related expense and other | 746 | 754 | (1.1 | )% | 1,275 | 1,512 | (15.7 | )% | (3) | |||||||||||||
Total selling, general and administrative expense | 1,670 | 2,540 | (34.3 | )% | 3,151 | 5,280 | (40.3 | )% | ||||||||||||||
(1) | Compensation and related expense decreased approximately $0.9 million, or 66.8%, for the three months ended June 30, 2017 and $2.0 million, or 71.7%, for the six months ended June 30, 2017 as compared to the same periods in 2016. These reductions were due primarily to decreases in salaries, bonus expense and stock-based compensation resulting from reductions in personnel in the 4th quarter of 2016 and carrying forward into the first half of 2017. |
(2) | Severance expense increased approximately $0.1 million for the six months ended June 30, 2017 as compared to the same six month period in 2016 as a result of severance payments made in conjunction with the resignations of certain senior management team members in 2017, the terms which are set forth in their respective separation agreements. No such severance-related expenses were incurred in the prior period. |
(3) | Facilities and related expense and other was approximately $0.7 million, for the three months ended June 30, 2017 and 2016. Facilities and related expense and other decreased $0.2 million, or 15.7%, for the six months ended June 30, 2017 as compared to the same period in 2016. This decrease is due primarily to approximately $0.2 million of income recognized as a result of the derecognition of certain reserves included in accrued expenses as of December 31, 2016. |
Warrant Revaluation Income (Expense)
During the three months ended June 30, 2017 and 2016, we recorded non-cash expense of $9.7 million and non-cash income of approximately $2.3 million for warrant revaluation charges in our Condensed Consolidated Statements of Operations, respectively. For the six months ended June 30, 2017 and 2016 we recorded non-cash expense of $9.7 million and non-cash income of $7.5 million. Due to the nature and inputs of the model used to assess the fair value of our outstanding warrants, it is not abnormal to experience significant fluctuations from period to period. These fluctuations are due to a variety of factors including changes in our stock price, changes in the remaining contractual life of the warrants, and changes in management's estimated probability of certain events occurring that would impact the warrants. The primary reason for the significant change between the warrant revaluation charges noted above is due to the large increase in our stock price during the six months ended June 30, 2017 compared to the significant decrease in our stock price experienced during the six months ended June 30, 2016.
Derivative Revaluation Expense
During the three months ended June 30, 2017, we recorded non-cash derivative revaluation income of approximately $0.9 million for derivative liability revaluation charges in our Condensed Consolidated Statements of Operations related to a compound bifurcated derivative initially recorded in September 2016 in connection with the 2016 Private Placement. For the six months ended June 30, 2017, we recorded non-cash derivative revaluation income of approximately $0.5 million. No such revaluation charges were incurred during the three and six months ended June 30, 2016.
33
Interest Expense
During the three months ended June 30, 2017, we recorded interest expense of approximately $0.2 million in our Condensed Consolidated Statements of Operations related to the Notes that we issued in the 2016 Private Placement which bear interest at 4% per annum. For the six months ended June 30, 2017, we recorded interest expense of approximately $0.4 million. No such expenses were incurred during the three and six months ended June 30, 2016.
Net Loss
Net loss increased approximately $5.9 million to $14.0 million for the three months ended June 30, 2017, as compared to an $8.1 million loss for the three months ended June 30, 2016. The increase in net loss was due primarily to warrant revaluation expense of $9.7 million, partially offset by lower research and development and selling, general and administrative expenses as described above. Net loss increased approximately $9.5 million to $19.0 million for the six months ended June 30, 2017, as compared to a $9.5 million loss for the six months ended June 30, 2016. The increase in net loss was due primarily to warrant revaluation expense of $9.7 million in the 2017 period versus warrant revaluation income of $2.3 million in the 2016 period.
Contractual Obligations
During the six months ended June 30, 2017, there have been no material changes to our contractual obligations outside the ordinary course of business from those specified in our 2016 Form 10-K.
Critical Accounting Policies
Management’s Discussion and Analysis of Financial Condition and Results of Operations is based upon our Condensed Consolidated Financial Statements, which have been prepared in conformity with U.S. generally accepted accounting principles (GAAP). Preparing financial statements requires us to make estimates and assumptions that affect the reported amounts of assets, liabilities, revenues and expenses. Estimates are based on our historical operations, our future business plans and projected financial results, the terms of existing contracts, our observance of trends in the industry, information provided by our customers and information available from other outside sources, as appropriate. These estimates and assumptions are affected by the application of our accounting policies. Critical accounting policies and practices are both important to the portrayal of a company’s financial condition and results of operations, and require management’s most difficult, subjective or complex judgments, often as a result of the need to make estimates about the effects of matters that are inherently uncertain. Actual results could differ from such estimates due to changes in economic factors or other conditions that are outside the control of management.
Our summary of significant accounting policies is described in Note 3 to our Consolidated Financial Statements contained in our 2016 Form 10-K. However, please refer to Note 3 in the accompanying Notes to the Condensed Consolidated Financial Statements contained in this Form 10-Q for updated policies and estimates, if applicable, that could impact our results of operations, financial position, and cash flows.
Recently Issued Accounting Pronouncements
See Note 3 in the accompanying Notes to the Condensed Consolidated Financial Statements of this Form 10-Q for discussion on recently issued accounting pronouncements.
34
Item 3. Quantitative and Qualitative Disclosures About Market Risk.
Not applicable.
Item 4. Controls and Procedures.
Evaluation of Disclosure Controls and Procedures
Our management, including our Chief Executive Officer (our principal executive officer and principal financial officer), have evaluated the effectiveness of the design and operation of our disclosure controls and procedures (as defined in Rules 13a-15(e) and 15d-15(e) under the Securities Exchange Act of 1934, as amended (the Exchange Act), as of the end of the period covered by this Form 10-Q. Based upon that evaluation, our Chief Executive Officer (our principal executive officer and principal financial officer), concluded that, as of June 30, 2017, our disclosure controls and procedures were effective to provide reasonable assurance that (a) the information required to be disclosed by us in the reports that we file or submit under the Exchange Act is recorded, processed, summarized and reported within the time periods specified in the Securities and Exchange Commission’s rules and forms, and (b) such information is accumulated and communicated to our management, including our Chief Executive Officer (our principal executive officer and principal financial officer), as appropriate to allow timely decisions regarding required disclosure.
In designing and evaluating our disclosure controls and procedures, our management recognized that any controls and procedures, no matter how well designed and operated, can provide only reasonable assurance of achieving the desired control objectives, and our management necessarily was required to apply its judgment in evaluating the cost-benefit relationship of possible controls and procedures.
Changes in Internal Control over Financial Reporting
There were no changes in our internal control over financial reporting during the quarterly period ended June 30, 2017 that have materially affected, or are reasonably likely to materially affect, our internal control over financial reporting.
35
PART II. OTHER INFORMATION
Item 1A. Risk Factors
You should carefully consider each of the risk factors set forth under the heading “Risk Factors” in our 2016 Form 10-K. The risk factor set forth below supplements those risk factors. The occurrence of any one or more of these risks could materially harm our business, operating results, financial condition and prospects. These risks and uncertainties could also cause actual results to differ materially and adversely from those expressed or implied by forward-looking statements that we make from time to time. Please see “Note Regarding Forward-Looking Statements” appearing at the beginning of this Form 10-Q.
Risks Related to our Financial Position and Need for Additional Capital
If our market value of listed securities falls below $35 million, our common stock may be subject to delisting from NASDAQ.
To maintain our listing on The NASDAQ Capital Market (NASDAQ), we are required to maintain: (i) a minimum bid price of $1.00 per share, (ii) a certain public float, (iii) a certain number of round lot stockholders and (iv) one of the following: a net income from continuing operations (in the latest fiscal year or two of the three last fiscal years) of at least $500,000, a market value of listed securities of at least $35 million or a stockholders' equity of at least $2.5 million. NASDAQ has the authority to delist our common stock if we fail to maintain these minimum requirements. As of June 30, 2017, we had a total stockholders’ deficit of $3.4 million and we have not had net income in any period during this fiscal year or either of the two last fiscal years. Therefore, if the market value of our listed securities falls below $35 million for a period of 30 consecutive business days, NASDAQ will notify us of the deficiency, at which point we will have a period of 180 calendar days from such notification to achieve compliance, which requires having a market value of listed securities of at least $35 million for a minimum of 10 consecutive business days during the 180-day period. If we are unable to regain compliance within the prescribed time period, we will be subject to delisting.
We are actively monitoring our market value of listed securities and will consider any and all options available to us to maintain compliance. There can be no assurance, however, that we will be able to maintain compliance and meet NASDAQ’s minimum market value of listed securities requirements. The alternatives to trading on NASDAQ or another national securities exchange are generally considered to be less efficient and less broad-based than the national securities exchanges and the liquidity of our common stock will likely be reduced. In addition, if at any time we are not listed on NASDAQ (or similar national securities exchange), then each holder of our outstanding convertible notes will have the option to declare the notes held by each holder immediately due and payable, which would drain our financial resources, have a material adverse effect on our financial condition and make it exceedingly difficult to continue as a going concern.
Item 6. Exhibits.
See the Exhibit Index following the signature page of this Form 10-Q for a list of exhibits filed or furnished with this report, which Exhibit Index is incorporated herein by reference.
36
SIGNATURES
Pursuant to the requirements of the Securities Exchange Act of 1934, the registrant has duly caused this report to be signed on its behalf by the undersigned thereunto duly authorized.
FIBROCELL SCIENCE, INC. | |
By: | /s/ John M. Maslowski |
John M. Maslowski | |
President and Chief Executive Officer | |
(Principal Executive Officer and Principal Financial Officer) | |
Date: | August 9, 2017 |
37
EXHIBIT INDEX
EXHIBIT NO. | IDENTIFICATION OF EXHIBIT | |
10.1 | Engagement letter, dated May 8, 2017, by and between Fibrocell Science, Inc., and AC Lordi (incorporated by reference to Exhibit 10.1 to our Current Report on Form 8-K, filed on May 9, 2017) | |
*31 | Certification of Principal Executive Officer and Principal Financial Officer pursuant to Rule 13a-14(a) and 15d-14(a), required under Section 302 of the Sarbanes-Oxley Act of 2002 | |
*32 | Certification of Principal Executive Officer and Principal Financial Officer pursuant to 18 U.S.C. Section 1350 as adopted pursuant to Section 906 of the Sarbanes-Oxley Act of 2002 | |
101.INS | XBRL Instance Document. | |
101.SCH | XBRL Taxonomy Extension Schema Document. | |
101.CAL | XBRL Taxonomy Extension Calculation Linkbase Document. | |
101.LAB | XBRL Taxonomy Extension Label Linkbase Document. | |
101.PRE | XBRL Taxonomy Extension Presentation Linkbase Document. | |
101.DEF | XBRL Taxonomy Extension Definition Linkbase Document. | |
* Filed herewith.
U Indicates management contract or compensatory plan or arrangement.
38