Attached files
| file | filename |
|---|---|
| EX-32.1 - EX-32.1 - RESMED INC | d380137dex321.htm |
| EX-31.2 - EX-31.2 - RESMED INC | d380137dex312.htm |
| EX-31.1 - EX-31.1 - RESMED INC | d380137dex311.htm |
| EX-23.1 - EX-23.1 - RESMED INC | d380137dex231.htm |
| EX-21.1 - EX-21.1 - RESMED INC | d380137dex211.htm |
Table of Contents
UNITED STATES
SECURITIES AND EXCHANGE COMMISSION
Washington, D.C. 20549
FORM 10-K
[X] ANNUAL REPORT PURSUANT TO SECTION 13 OR 15(d) OF
THE SECURITIES EXCHANGE ACT OF 1934
For the fiscal year ended June 30, 2017
Commission file number: 001-15317
RESMED INC.
(Exact name of registrant as specified in its charter)
DELAWARE
(State or other jurisdiction of incorporation or organization)
98-0152841
(IRS Employer Identification No.)
9001 Spectrum Center Blvd.
San Diego, CA 92123
United States of America
(Address of principal executive offices)
(858) 836-5000
(Registrant’s telephone number, including area code)
Securities registered pursuant to Section 12(b) of the Act:
TITLE OF EACH CLASS
Common Stock, $0.004 Par Value
Name of each exchange upon which registered
New York Stock Exchange
Securities registered pursuant to Section 12(g) of the Act
None
Indicate by check mark if the registrant is a well-known seasoned issuer, as defined in Rule 405 of the Securities Act. Yes [ x ] No [ ]
Indicate by check mark if the registrant is not required to file reports pursuant to Section 13 or 15(d) of the Act. Yes [ ] No [ x ]
Indicate by check mark whether the registrant (1) has filed all reports required to be filed by Section 13 or 15(d) of the Securities Exchange Act of 1934 during the preceding 12 months (or for such shorter period that the registrant was required to file such reports), and (2) has been subject to such filing requirements for the past 90 days. Yes [ x ] No [ ]
Indicate by check mark whether the registrant has submitted electronically and posted on its corporate Web site, if any, every Interactive Data File required to be submitted and posted pursuant to Rule 405 of Regulation S-T (§232.405 of this chapter) during the preceding 12 months (or for such shorter period that the registrant was required to submit and post such files). Yes [ x ] No [ ]
Indicate by check mark if disclosure of delinquent filers pursuant to Item 405 of Regulations S-K (§ 229.405 of this Chapter) is not contained herein, and will not be contained, to the best of registrant’s knowledge, in definitive proxy or information statements incorporated by reference in Part III of this Form 10-K or any amendment to this Form 10-K [ ]
Indicate by check mark whether the registrant is a large accelerated filer, an accelerated filer, a non-accelerated filer, a smaller reporting company or an emerging growth company. See the definitions of “large accelerated filer,” “accelerated filer,” “smaller reporting company,” and “emerging growth company” in Rule 12b-2 of the Exchange Act.
Large accelerated filer [ x ] Accelerated filer [ ] Non-accelerated filer [ ] Smaller reporting company [ ] Emerging growth company [ ]
If an emerging growth company, indicate by check mark if the registrant has elected not to use the extended transition period for complying with any new or revised financial accounting standards provided pursuant to Section 13(a) of the Exchange Act. [ ]
Indicate by check mark whether the registrant is a shell company (as defined in Rule 12b-2 of the Exchange Act). Yes [ ] No [ x ]
The aggregate market value of the voting and non-voting common equity held by non-affiliates of registrant as of December 31, 2016 (the last business day of the registrant’s most recently completed second fiscal quarter), computed by reference to the closing sale price of such stock on the New York Stock Exchange, was $8,675,392,803. All directors, executive officers, and 10% stockholders of registrant are considered affiliates.
At July 28, 2017, registrant had 142,209,115 shares of Common Stock, $0.004 par value, issued and outstanding. This number excludes 41,086,234 shares held by the registrant as treasury shares.
Portions of the registrant’s definitive Proxy Statement to be delivered to stockholders in connection with the registrant’s 2017 Annual Meeting of Stockholders, to be filed subsequent to the date hereof, are incorporated by reference into Part III of this report.
Table of Contents
As used in this 10-K, the terms “we”, “us”, “our” and “the Company” refer to ResMed Inc., a Delaware corporation, and its subsidiaries, on a consolidated basis, unless otherwise stated.
Table of Contents
PART I
Cautionary Note Regarding Forward-Looking Statements
This report contains certain forward-looking statements and information that are based on the beliefs of our management as well as estimates and assumptions made by, and information currently available to our management. All statements other than statements regarding historical facts are forward-looking statements. The words “believe,” “expect,” “anticipate,” “intend,” “seek,” “will,” “will continue,” “estimate,” “plan,” “future” and other similar expressions generally identify forward-looking statements, including, in particular, statements regarding the development and approval of new products and product applications, market expansion, pending litigation, and the development of new markets for our products, such as cardiovascular and stroke markets. These forward-looking statements are made under the safe harbor provisions of the Private Securities Litigation Reform Act of 1995. You are cautioned not to place undue reliance on these forward-looking statements each of which applies only as of the date of this report. Such forward-looking statements reflect the views of our management at the time such statements are made and are subject to a number of risks, uncertainties, estimates and assumptions, including, without limitation, and in addition to those identified in the text surrounding such statements, those identified in Item 1A “Risk Factors” and elsewhere in this report.
In addition, important factors to consider in evaluating such forward-looking statements include changes or developments in social, economic, market, legal or regulatory circumstances, changes in our business or growth strategy or an inability to execute our strategy due to changes in our industry or the economy generally, the emergence of new or growing competitors, the actions or omissions of third parties, including suppliers, customers, competitors and governmental authorities, and various other factors subject to risks and uncertainties which could cause actual results to materially differ from those projected or implied in the forward-looking statements. Should any one or more of these risks or uncertainties materialize, or the underlying estimates or assumptions prove incorrect, actual results may vary significantly from those expressed in such forward-looking statements, and there can be no assurance that the forward-looking statements contained in this report will in fact occur.
| ITEM 1 | BUSINESS |
General
We are a global leader in the development, manufacturing, distribution and marketing of medical devices and cloud-based software applications that diagnose, treat and manage respiratory disorders including sleep disordered breathing, or SDB, chronic obstructive pulmonary disease, or COPD, neuromuscular disease and other chronic diseases. SDB includes obstructive sleep apnea, or OSA, and other respiratory disorders that occur during sleep. Our products and solutions are designed to improve patient quality of life, reduce the impact of chronic disease and lower healthcare costs as global healthcare systems continue to drive a shift in care from hospitals to the home and lower cost settings. Our cloud-based software digital health applications, along with our devices are designed to provide connected care to improve patient outcomes and efficiencies for our customers.
Following our formation in 1989, we commercialized a treatment for OSA. This treatment, nasal Continuous Positive Airway Pressure, or CPAP, was the first successful noninvasive treatment for OSA. CPAP systems deliver pressurized air, typically through a nasal mask, to prevent collapse of the upper airway during sleep.
- 1 -
Table of Contents
Since the development of CPAP, we have expanded our business by developing or acquiring a number of innovative products and solutions for a broader range of respiratory disorders including technologies to be applied in medical and consumer products, ventilation devices, diagnostic products, mask systems for use in the hospital and home, headgear and other accessories, dental devices, portable oxygen concentrators, or POCs and cloud-based software informatics solutions to manage patient outcomes and customer and provider business processes. Our growth has been fueled by geographic expansion, our research and product development efforts, acquisitions and an increasing awareness of SDB and respiratory conditions like COPD as significant health concerns.
We employ approximately 6,000 people and sell our products in approximately 120 countries through a combination of wholly owned subsidiaries and independent distributors.
Our web site address is www.resmed.com. We make our periodic reports, together with any amendments, available on our website, free of charge, as soon as reasonably practicable after we electronically file or furnish the reports with the Securities and Exchange Commission, or SEC. Information contained on the website is not part of or incorporated into this annual report.
Corporate History
ResMed Inc., a Delaware corporation, was formed in March 1994 as the ultimate holding company for our operating subsidiaries. In June 1995, we completed an initial public offering of common stock and our common stock began trading on the NASDAQ National Market. In September 1999, we transferred our principal listing to the New York Stock Exchange, or NYSE, trading under the ticker symbol “RMD”. In November 1999, we established a secondary listing of our common stock via Chess Depositary Instruments, or CDIs, on the Australian Stock Exchange (now known as the Australian Securities Exchange), or ASX, also under the symbol “RMD”. Ten CDIs on the ASX represent one share of our common stock on the NYSE.
Our Australian subsidiary, ResMed Holdings Limited, was originally organized in 1989 by Dr. Peter Farrell to acquire from Baxter Center for Medical Research Pty Limited, or Baxter, the rights to certain technology relating to CPAP treatment as well as Baxter’s existing CPAP device business. Baxter acquired the rights to the technology in 1987, and sold CPAP devices in Australia from 1988 until our acquisition of the business.
Since formation we have acquired a number of businesses, including distributors, suppliers, developers of medical equipment and related technologies and software solutions providers.
Segment Information
We have determined that we predominantly operate in a single operating segment, which is the sleep and respiratory disorders sector of the medical device industry. Due to the acquisition of Brightree LLC in April 2016, our operations now include the supply of business management software and services to medical equipment and home health providers. However, these operations, both in terms of revenue and profit, are not material to our global operations and have not been separately reported. See Note 15 – Segment Information of the Notes to Financial Statements (Part II, Item 8) for financial information regarding segment reporting. Financial information about our revenues from and assets located in foreign countries is also included in the Notes to our consolidated financial statements.
The Market
We are focused on the sleep and related respiratory care markets, both of which we believe are globally underpenetrated markets, and where we believe our products can improve patient outcomes, create efficiencies for our customers, help physicians and providers better manage chronic disease and reduce overall healthcare system costs.
- 2 -
Table of Contents
Sleep
Sleep is a complex neurological process that includes two distinct states: rapid eye movement, or REM, sleep and non-rapid eye movement, or non-REM, sleep. REM sleep, which is about 20-25% of total sleep experienced by adults, is characterized by a high level of brain activity, bursts of rapid eye movement, increased heart and respiration rates, and paralysis of many muscles. Non-REM sleep is subdivided into four stages that generally parallel sleep depth; stage 1 is the lightest and stage 4 is the deepest.
The upper airway has no rigid support and is held open by active contraction of upper airway muscles. Normally, during REM sleep and deeper levels of non-REM sleep, upper airway muscles relax and the airway narrows. Individuals with narrow upper airways or poor muscle tone are prone to temporary collapses of the upper airway during sleep, called apneas, and to near closures of the upper airway called hypopneas. These breathing events result in a lowering of blood oxygen concentration, causing the central nervous system to react to the lack of oxygen or increased carbon dioxide and signaling the body to respond. Typically, the individual subconsciously arouses from sleep, causing the throat muscles to contract, opening the airway. After a few gasping breaths, blood oxygen levels increase and the individual can resume a deeper sleep until the cycle repeats itself. Sufferers of OSA typically experience ten or more such cycles per hour. While these awakenings greatly impair the quality of sleep, the individual is not normally aware of these disruptions. In addition, OSA has been recognized as a cause of hypertension and a significant co-morbidity for heart disease, stroke and diabetes.
A long-term epidemiology study published in 2013 estimated that 26% of adults age 30-70 have some form of obstructive sleep apnea. In the United States alone, this represents approximately 46 million people. Despite the high prevalence of OSA, there is a general lack of awareness of OSA among both the medical community and the general public. It is estimated that less than 20% of those with OSA have been diagnosed or treated. Many healthcare professionals are often unable to diagnose OSA because they are unaware that such non-specific symptoms as excessive daytime sleepiness, snoring, hypertension and irritability are characteristic of OSA.
While OSA has been diagnosed in a broad cross-section of the population, until recently, it has typically been diagnosed among middle-aged men who are obese. However, we believe the importance of OSA in women is increasingly being recognized, with nearly 40% of new PAP patients being female. A strong association has been discovered between OSA and a number of cardiovascular and metabolic diseases. Studies have shown that SDB is present in approximately 83% of patients with drug-resistant hypertension, approximately 72% of patients with type 2 diabetes, approximately 77% of patients with obesity and approximately 76% of patients with chronic heart failure.
Sleep-Disordered Breathing and Obstructive Sleep Apnea
Sleep-disordered breathing encompasses all disease processes that cause abnormal breathing patterns during sleep. Manifestations include OSA, central sleep apnea, or CSA, and hypoventilation syndromes that occur during sleep. Hypoventilation syndromes are generally associated with obesity, chronic obstructive lung disease and neuromuscular disease. OSA is the most common form of SDB.
- 3 -
Table of Contents
Sleep fragmentation and the loss of the deeper levels of sleep caused by OSA can lead to excessive daytime sleepiness, reduced cognitive function, including memory loss and lack of concentration, depression and irritability. OSA sufferers also experience an increase in heart rate and an elevation of blood pressure during the cycle of apneas. Several studies indicate that the oxygen desaturation, increased heart rate and elevated blood pressure caused by OSA may be associated with increased risk of cardiovascular morbidity and mortality due to angina, stroke and heart attack. Patients with OSA have been shown to have impaired daytime performance in a variety of cognitive functions including problem solving, response speed and visual motor coordination, and studies have linked OSA to increased occurrences of traffic and workplace accidents.
Generally, an individual seeking treatment for the symptoms of OSA is referred by a general practitioner to a sleep specialist for further evaluation. The diagnosis of OSA typically requires monitoring the patient during sleep at either a sleep clinic or the patient’s home. During overnight testing, respiratory parameters and sleep patterns may be monitored, along with other vital signs such as heart rate and blood oxygen levels. Simpler tests, using devices such as our Apnealink Air, or our automatic positive airway pressure devices, monitor airflow during sleep, and use computer programs to analyze airflow patterns. These tests allow sleep clinicians to detect any sleep disturbances such as apneas, hypopneas or subconscious awakenings.
Before 1981, the primary treatment for OSA was a tracheotomy, a surgical procedure to create a hole in the patient’s windpipe. Alternative surgical treatments have involved either uvulopalatopharyngoplasty, or UPPP, in which surgery is performed on the upper airway to remove excess tissue and to streamline the shape of the airway or implanting a device to add support to the soft palate. UPPP alone has a poor success rate; however, when performed in conjunction with multi-stage upper airway surgical procedures, a greater success rate has been claimed. These combined procedures, performed by highly specialized surgeons, are expensive and involve prolonged and often painful recovery periods. Surgical treatments are not considered first line therapy for OSA. Other alternative treatments available today include nasal surgery, mandibular advancement surgery, dental appliances, palatal implants, somnoplasty, nasal devices and electrical stimulation of the nerves or muscles. Alternative pharmaceutical therapy treatments are reported to be under development.
A variety of devices are marketed for the treatment of OSA. Most are only partially effective, but CPAP is a reliable treatment for all severities of OSA and is considered first-line therapy. Use of mandibular advancement devices is increasing as a second-line option in patients unable to use CPAP or those with mild OSA. These devices cause the mandible and tongue to be pulled forward and improve the dimensions of the upper airway. CPAP is a non-invasive means of treating OSA. CPAP was first used as a treatment for OSA in 1980 by Dr. Colin Sullivan, the past Chairman of our Medical Advisory Board and was commercialized for treatment of OSA in the United States in the mid-1980s. During CPAP treatment, a patient sleeps with a nasal interface connected to a small portable air device that delivers room air at a positive pressure. The patient breathes in air from the device and breathes out through an exhaust port in the interface. Continuous air pressure applied in this manner acts as a pneumatic splint to keep the upper airway open and unobstructed. Interfaces include nasal masks and nasal pillows. Sometimes, when a patient leaks air through their mouth, a full-face mask may need to be used, rather than a nasal interface.
- 4 -
Table of Contents
CPAP is not a cure and, therefore, must be used on a nightly basis as long as treatment is required. Patient compliance has been a major factor in the efficacy of CPAP treatment. Early generations of CPAP units provided limited patient comfort and convenience. Patients experienced soreness from the repeated use of nasal masks and had difficulty falling asleep with the CPAP device operating at the prescribed pressure. In more recent years, product innovations to improve patient comfort and compliance have been developed. These include more comfortable patient interface systems; delay timers that gradually raise air pressure allowing the patient to fall asleep more easily; bilevel air devices, including Variable Positive Airway Pressure, or VPAP systems, which provide different air pressures for inhalation and exhalation; heated humidification systems to make the airflow more comfortable; and autotitration devices that reduce the average pressure delivered during the night.
Respiratory Care
Our aim is to provide respiratory care solutions to patients suffering from COPD and other chronic respiratory diseases, such as overlap syndrome, obesity hypoventilation syndrome, or OHS, and neuromuscular disease, including amyotrophic lateral sclerosis, or ALS. We aim to improve their quality of life and slow down disease progression and reduce the costs of patient management.
Our products cover patients ranging from those who only require therapy from CPAP or VPAP systems at night, through to those who are dependent on non-invasive or invasive ventilation for life-support and those who require long-term oxygen therapy. Our devices are predominantly used in the home, and to a lesser extent in general hospital wards and respiratory wards. We supply CPAP and VPAP systems, non-invasive and invasive ventilators, humidifiers and accessories, including masks and tubing. We also offer stationary and portable battery powered oxygen concentrators for the administration of long-term oxygen therapy in the home as well as data management systems designed to improve the management of patients.
Chronic Obstructive Pulmonary Disease. COPD encompasses a group of lung diseases defined by persistent airflow limitation, prolongation of exhalation and loss of elasticity in the lungs. It is a progressive and debilitating disease and is associated with an increased inflammatory response in the airways to noxious gases or particles. Symptoms encountered with COPD include shortness of breath on exertion as well as chronic cough and sputum production. COPD includes diseases such as emphysema and chronic bronchitis. A recent study based on recent epidemiology data estimates that there are approximately 380 million people worldwide who suffer from COPD.
Patients with COPD can have different clinical presentations. Patients with chronic bronchitis present with hypoxemia and hypercapnia, a chronic productive cough, cor pulmonale and are commonly overweight. Patients with emphysema have more normal blood gases, are usually thin and hyperinflated and have a decreased diffusion capacity. During sleep, chronic bronchitic patients display more severe hypoxemia. In general, the more hypoxic a COPD patient is during the day the more severe the hypoxemia experienced during sleep. Hypercapnia as a consequence of hypoventilation also occurs in COPD patients and is more pronounced in REM sleep. Some COPD patients may also suffer from co-morbid OSA, a condition known as Overlap Syndrome.
Home non-invasive ventilation has the potential to reduce healthcare costs associated with the management of patients with severe COPD by significantly increasing the time between hospital readmissions.
- 5 -
Table of Contents
Overlap Syndrome. In patients with Overlap Syndrome, CPAP has been shown to provide benefits in relation to reducing mortality, decreasing hospitalizations and improving lung function and gas exchange. Non-invasive ventilation, or NIV, has been demonstrated to improve outcomes in patients with acute exacerbations of COPD through its ability to improve respiratory acidosis and decrease dyspnea and work of breathing. It may also increase survival rates and reduce length of hospital stays, as well as reducing and complication rates of factors such as ventilator-associated pneumonia. In patients with stable COPD the advantages of home NIV are less clear but clinical studies have shown improvements in dyspnea scores and health-related quality of life measures and reductions in hospital readmissions and intensive care stays.
Long-term oxygen therapy, or LTOT, is indicated in chronic respiratory failure patients. The administration of LTOT has been shown to increase survival rates in patients with severe resting hypoxemia. In hypoxemic COPD patients, LTOT is associated with a lower mortality compared to nocturnal oxygen therapy alone and improved health-related quality of life measures. In long-term COPD survivors with a history of congestive heart failure, LTOT is associated with a slowing of respiratory failure progression.
Obesity Hypoventilation Syndrome. OHS is characterized by the combination of obesity, chronic alveolar hypoventilation leading to daytime hypercapnia and hypoxia and SDB after the exclusion of other causes of alveolar hypoventilation. OHS is frequently associated with OSA with an estimated 90% of patients also having OSA.
In patients with OHS, positive airway therapy, both CPAP and NIV, has been shown to effectively treat upper airway obstruction and reverse daytime respiratory failure as well as reduce the work of breathing and improve respiratory drive.
Neuromuscular Disease. Neuromuscular disease is a broad term that encompasses many diseases that either directly (via intrinsic muscle pathology) or indirectly (via nerve pathology) impair the functioning of muscles. Symptoms of neuromuscular disease and respiratory failure include increasing generalized weakness and fatigue, dysphagia, dyspnoea on exertion and at rest, sleepiness, morning headache, difficulties with concentration and mood changes. Most neuromuscular diseases are characterized by progressive muscular impairment leading to loss of ambulation, being wheelchair-bound, swallowing difficulties, respiratory muscle weakness and, eventually, death from respiratory failure. Neuromuscular disorders can be progress rapidly or slowly. Rapidly progressive conditions, such as ALS and Duchenne muscular dystrophy in teenagers, are characterized by muscle impairment which worsens over months and can result in death within a few years. Variable or slowly progressive conditions, such as Myotonic muscular dystrophy, are characterized by muscle impairment that worsens over years and may mildly reduce life expectancy.
NIV treatment to patients with neuromuscular disease may lead to improvements in respiratory failure symptoms and daytime arterial blood gases. In ALS patients, NIV treatment has been associated with an improvement in quality of life measures, sleep-related symptoms and survival. Studies have demonstrated that patients with Duchenne muscular dystrophy may improve in quality of life measures and survival with NIV treatment.
- 6 -
Table of Contents
Business Strategy
We believe that the SDB and respiratory care markets will continue to grow in the future due to a number of factors, including increasing awareness of OSA, CSA and COPD, improved understanding of the role of SDB treatment in the management of cardiac, neurologic, metabolic and related disorders, improved understanding of the role of non-invasive ventilation in the management of COPD, and an increase in the use of digital and product technology to improve patient outcomes and create efficiencies for customers and providers. Our strategy for expanding our business operations and capitalizing on the growth of the SDB and respiratory care markets consists of the following key elements:
| • | Continue Product Development and Innovation. We are committed to ongoing innovation in developing products for the diagnosis and treatment of SDB. We have been a leading innovator of products designed to treat SDB more effectively, increase patient comfort and encourage compliance with prescribed therapy. In 2016, we introduced a number of new software solutions including our ResMed Resupply, GoScripts and new features and enhancements within our cloud-based software offerings. Through our acquisition of Brightree, we also acquired a suite of software-as-a-service solutions for U.S. based distributor and home health and hospice customers. In addition, through our acquisitions of Inova Labs and Curative Medical we acquired the Inova Labs range of POCs and a portfolio of Curative Medical SDB and ventilation products. We believe that the combination of continued product development, product and technology acquisitions and innovation are key factors to our ongoing success. In 2017, we have continued to introduce new, innovative products and solutions including AirFit™ N20 nasal and F20 full face masks with an InfinitySeal silicone cushion, AirMini™, the world’s smallest CPAP, AirTouch™ F20 full face mask with Ultrasoft™ memory foam and new integrations and enhancements of AirView and Brightree software, including AirView™ Action Groups. Approximately 14% of our employees are devoted to research and development activities. In fiscal year 2017, we invested $144.5 million, or approximately 7.0% of our net revenues, in research and development. |
| • | Expand Geographic Presence. We market our products in more than 120 countries to sleep clinics, home healthcare dealers, patients and third-party payors. We intend to increase our sales and marketing efforts in our principal markets, as well as expand the depth of our presence in other high-growth geographic regions. In 2016, we acquired Curative Medical to invest in the China market and expand our growth potential in SDB, COPD and respiratory care in China. |
| • | Respiratory Care. We are committed to ongoing innovation of our respiratory care products that serve the needs of patients with COPD and neuromuscular diseases. With the addition of Inova Labs POCs and our non-invasive ventilator devices and masks and accessories, we intend to continue to expand and enhance our product offerings in this area. |
- 7 -
Table of Contents
| • | Increase Public and Clinical Awareness. We continue to expand our existing promotional activities to increase awareness of SDB, COPD and other clinical conditions that can be treated with our industry-leading solutions. These promotional activities target both the population predisposed to SDB and medical specialists, such as pulmonologists, sleep medicine specialists, primary care physicians, cardiologists, neurologists and other medical subspecialists who treat these conditions and their associated comorbidities. In the last year we launched SleepScore Labs, a joint venture between ResMed, Dr. Mehmet Oz and Pegasus Capital to help consumers better understand and improve their sleep. We also target special interest groups, including the National Stroke Association, the American Heart Association and the National Sleep Foundation, to further increase awareness of the relationship between SDB or OSA, COPD, neuromuscular disease and co-morbidities such as cardiac disease, diabetes, hypertension and obesity. The programs also support our efforts to inform the community of the dangers of sleep apnea with regard to occupational health and safety, especially in the transport industry. We have helped establish a center for clinical care and medical research at the University of California at San Diego in the fields of sleep apnea and COPD and we established of perpetual academic chairs at the University of Sydney, called the ResMed Chair of Sleep Medicine for sleep-disordered breathing with a focus on chronic disease and the ResMed Chair of Biomedical Engineering with an emphasis on bio-informatics research. |
| • | Expand into New Clinical Applications. We continually seek to identify new applications of our technology for significant unmet medical needs. Studies have established a clinical association between OSA and both stroke and congestive heart failure, and have recognized SDB as a cause of hypertension or high blood pressure. Research also indicates that SDB is independently associated with glucose intolerance and insulin resistance. In addition, we maintain close working relationships with a number of prominent physicians to explore new medical applications for our products and technology. |
| • | Leverage the Experience of our Management Team. Our senior management team has extensive experience in the medical device industry in general, and in the fields of SDB, respiratory care and healthcare informatics in particular. We intend to continue to leverage the experience and expertise of these individuals to maintain our innovative approach to the development of products and solutions, and to increase awareness of the serious medical problems caused by SDB and the use of oxygen, non-invasive ventilation, and in-home life support ventilation to treat COPD. |
Products
Our portfolio of products includes devices, diagnostic products, mask systems, headgear and other accessories, dental devices, POCs and cloud-based software informatics solutions. For purposes of the following discussion, we refer to our air flow generators, ventilators and oxygen concentrators collectively as devices.
Devices
We produce CPAP, VPAP and AutoSet systems for the titration and treatment of SDB. The devices deliver positive airway pressure through a patient interface, either a small nasal mask, nasal pillows system, full-face mask or cannula. Our VPAP units deliver ultra-quiet, comfortable bilevel therapy. AutoSet systems are based on a proprietary technology to monitor breathing and can also be used in the diagnosis, treatment and management of OSA.
We also acquired a line of Chinese-developed and manufactured sleep and ventilation devices with the acquisition of Curative Medical.
- 8 -
Table of Contents
During fiscal year 2017, we launched AirMini, the smallest portable CPAP on the market today combining the same proven therapy modes used in the AirSense™ 10 with effective waterless humidification enabling portable convenience.
Devices in total accounted for approximately 56%, 58% and 58% of our net revenues in fiscal years 2017, 2016 and 2015, respectively.
The tables below provide a selection of products, as known by our trademarks, which have been released during the last five years.
| CPAP PRODUCTS | DESCRIPTION | INTRODUCTION DATE | ||
| AirSense 10 Elite |
An advanced fixed-pressure therapy device with an integrated humidifier. It is designed to be intuitive and easy-to-use. The device also features built-in wireless connectivity. | August 2014 | ||
| AirSense 10 CPAP |
The AirSense 10 CPAP is a fixed-pressure therapy device. It also provides compliance, AHI and leak data reporting. The device also features built-in wireless connectivity.
|
August 2014 | ||
| VPAP PRODUCTS | DESCRIPTION | INTRODUCTION DATE | ||
| S9 VPAP ST-A |
Bilevel pressure support therapy device with pressures up to 30 cmH2O designed for comfort, effective therapy with the assurance of back up rate up to 50 bpm and alarms. The device also has an optional integrated humidifier (H5i), ClimateLine heated tube and the small, lightweight SlimLine tube. | March 2013 | ||
| S9 VPAP COPD |
Bilevel pressure support up to pressure 30cmH2O with both fixed and adjustable alarms. This device has been specifically designed for COPD. | April 2013 | ||
| AirCurve 10 S |
A bilevel device for patients who need extra pressure support or find it difficult to adjust to therapy on a fixed pressure continuous positive airway pressure device. Features built-in wireless connectivity and works seamlessly with ResMed’s AirView™ patient monitoring software. | December 2014 | ||
| AirCurve 10 V Auto |
An auto-adjusting bilevel device for patients who need greater pressure support to treat their obstructive sleep apnea. Features built-in wireless connectivity and works seamlessly with ResMed’s AirView™ patient monitoring software. | December 2014 | ||
- 9 -
Table of Contents
| VPAP PRODUCTS | DESCRIPTION | INTRODUCTION DATE | ||
| AirCurve 10 ST |
A bilevel device with backup rate that provides exceptional patient-ventilator synchrony, reducing the work of breathing so patients remain comfortable and well ventilated. Features built-in wireless connectivity and works seamlessly with ResMed’s AirView™ patient monitoring software. | December 2014 | ||
| AirCurve 10 ASV |
An adaptive servo-ventilator specifically designed to treat patients exhibiting central sleep apnea (CSA), mixed sleep apnea and periodic breathing, with or without obstructive sleep apnea. The device also features built-in wireless connectivity. Features built-in wireless connectivity and works seamlessly with ResMed’s AirView™ patient monitoring software. | December 2014 | ||
| AirCurve 10 CS |
An adaptive servo-ventilator specifically designed to treat patients exhibiting central sleep apnea (CSA), mixed sleep apnea and periodic breathing, with or without obstructive sleep apnea. The device also features built-in wireless connectivity. Features built-in wireless connectivity and works seamlessly with ResMed’s AirView™ patient monitoring software.
|
December 2014 | ||
| AUTOSET PRODUCTS | DESCRIPTION | INTRODUCTION DATE | ||
| AirSense 10 Auto |
A premium auto-adjusting therapy device featuring AutoRamp™ with sleep onset detection, expiratory pressure relief (EPR™) and Easy-Breathe technology. The device also features built-in wireless connectivity. | August 2014 | ||
| AirMini |
The world’s smallest portable PAP device – this premium auto-adjusting therapy device features the same proven therapy modes used in the AirSense™ 10 Auto, AirMini also features built-in Bluetooth connectivity and effective waterless humidification enabled by HumidX technology.
|
May 2017 | ||
| VENTILATION PRODUCTS | DESCRIPTION | INTRODUCTION DATE | ||
| Astral 100 and 150 |
Pressure support and volume ventilator for invasive and non-invasive purposes so it can be used from the hospital to the home | May 2014 | ||
| Activox |
Portable oxygen concentrator system
|
July 2014 | ||
- 10 -
Table of Contents
| VENTILATION PRODUCTS | DESCRIPTION | INTRODUCTION DATE | ||
| Lumis 100 and 150 |
Pressure support non-invasive ventilators that support a variety of therapy modes, built-in wireless connectivity, integrated humidification and intuitive simplicity. | April 2015 | ||
| Lumis ST-A |
Pressure support non-invasive ventilators that support a variety of therapy modes, built-in wireless connectivity, integrated humidification and intuitive simplicity and a range of fixed and adjustable alarms.
|
October 2015 | ||
Mask Systems, Diagnostic Products, Accessories and Other Products
Masks, diagnostic products and accessories together accounted for approximately 37%, 40% and 42% of our net revenues in fiscal years 2017, 2016 and 2015, respectively.
Mask Systems and Diagnostic Products
Mask systems are one of the most important elements of SDB treatment systems. Masks are a primary determinant of patient comfort and as such may drive or impede patient compliance with therapy. We have been a consistent innovator in masks, improving patient comfort while minimizing size and weight.
| MASK PRODUCTS | DESCRIPTION | INTRODUCTION DATE | ||
| Quattro Air |
Next Generation lightweight Full Face Mask with improved comfort | June 2013 | ||
| Swift FX Nano |
A compact nasal mask designed to deliver an excellent user experience, without compromising on fit, comfort and ease of use. | June 2013 | ||
| AirFit P10 |
A compact, lightweight nasal pillows system that has only three parts, including a new soft and stable QuickFit™ headgear. | January 2014 | ||
| AirFit F10 |
A compact, lightweight full-face mask that delivers comfort, stability, and performance in a simple and elegant design. | April 2014 | ||
| AirFit N10 |
A compact nasal mask that stands out with its comfort and visual freedom in a user-friendly design. | April 2014 | ||
| AcuCare HFNC |
The AcuCare high flow nasal cannula (HFNC) for high flow oxygen therapy. | August 2015 | ||
| AirFit F20 |
A compact full-face mask that features an InfinitySeal silicone cushion that adapts to the unique facial contours of each patient to increase comfort, improve fit and reduce leakage.
|
November 2016 | ||
- 11 -
Table of Contents
| MASK PRODUCTS | DESCRIPTION | INTRODUCTION DATE | ||
| AirFit N20 |
A compact nasal mask that features an InfinitySeal silicone cushion that adapts to the unique facial contours of each patient to increase comfort, improve fit and reduce leakage. | November 2016 | ||
| AirTouch F20 |
A compact full-face mask that features a permeable foam cushion, which creates a uniquely natural, breathable seal that allows some excess heat and sweat to escape through the cushion without compromising therapy pressure. Modular frame design allows convenient interchangeability with AirFit™ 20 InfinitySeal™ cushion.
|
May 2017 | ||
We market sleep recorders for the diagnosis and titration of SDB in sleep clinics and hospitals. These diagnostic systems record relevant respiratory and sleep data, which can be analyzed by a sleep specialist or physician who can then tailor an appropriate OSA treatment regimen for the patient.
| DIAGNOSTIC PRODUCTS | DESCRIPTION | INTRODUCTION DATE | ||
| Apnealink Air |
A portable diagnostic device which measures oximetry, respiratory effort, pulse, nasal flow and snoring. Works with EasyCare Online to provide comprehensive diagnostic solution to clinicians.
|
December 2013 | ||
Accessories and Other Products
To enhance patient comfort, convenience and compliance, we market a variety of other products and accessories. These products include humidifiers, helping to prevent the drying of nasal passages that can cause discomfort, carry bags and breathing circuits. To assist those professionals diagnosing or managing the treatment of patients there are data communications and control products such as EasyCare, ResLink, ResControl, ResControl II, TxControl, ResScan and ResTraxx modules. With the introduction of our latest solutions we are expanding our use of cloud-based patient management and engagement platforms such as AirView enabling remote monitoring, over-the-air trouble shooting and changing of device settings, U-Sleep enabling automated patient coaching through a text, email or interactive voice phone call and myAir, a patient engagement application that provides sleep data and a daily score based on their previous night’s data. Due to the acquisition of Brightree LLC in April 2016, our operations now include the supply of business management software and services to medical equipment and home health providers. Brightree revenue accounted for approximately 7% of our net revenue in fiscal year 2017.
| DATA /
PATIENT MANAGEMENT PRODUCTS |
DESCRIPTION | INTRODUCTION DATE | ||
| EasyCare |
ResMed’s compliance management solution offering both wireless and card-to-cloud functionality, providing access to patient data anywhere with an internet connection. Intuitive user interface, easy to understand reports and automated compliance notification.
|
April 2012 | ||
- 12 -
Table of Contents
| DATA /
PATIENT MANAGEMENT PRODUCTS |
DESCRIPTION | INTRODUCTION DATE | ||
| U-Sleep |
A flexible compliance solution that monitors CPAP device usage and helps HMEs manage their patients during their initial acclimatization and ongoing therapy. | August 2012 | ||
| AirView |
AirView is a seamless, cloud-based system enabling remote monitoring and changing of patients’ device settings. AirView also makes it easier to simplify workflows and collaborate more efficiently across the patient’s care network. | August 2014 | ||
| myAir |
A personalized therapy management application for patients with sleep-disordered breathing providing support, education and troubleshooting tools for increased patient engagement and improved compliance. | October 2014 | ||
| S+ |
A personalized sleep solution that uses patented bio-motion sensors, designed to measure an individual’s sleep stages and environment, and deliver personalized feedback that helps improve sleep. | October 2014 | ||
| Brightree Solutions |
Cloud-based software designed to improve clinical and business performance in the HME, home health, hospice, orthotic and prosthetic, HME pharmacy, home infusion and rehabilitation home care segments. Brightree’s solutions follow the natural workflow of providers to automate and improve how they manage their business and serve patients. | April 2016 | ||
| Connectivity Module |
ResMed Connectivity Module (RCM) provides cellular connection between a compatible ResMed ventilation device and the ResMed AirView™ system.
|
May 2016 | ||
Product Development and Clinical Trials
We have a strong track record of innovation in the sleep market. In 1989, we introduced our first CPAP device. Since then we have been committed to an ongoing program of product advancement and development. Currently, our product development efforts are focused on not only improving our current product offerings, but also expanding into new product applications.
- 13 -
Table of Contents
We continually seek to identify new applications of our technology for significant unmet medical needs. SDB is associated with a number of symptoms beyond excessive daytime sleepiness and irritability. Studies have established a clinical association between SDB and hypertension, stroke, congestive heart failure and diabetes. We support clinical trials in many countries including the United States, Germany, France, the United Kingdom, Italy, Switzerland, China and Australia to develop new clinical applications for our technology. We have also begun presenting and publishing research findings based on the industry-leading connectivity platform and data assets that are unique to ResMed. In fiscal years 2016 and 2017, ResMed supported some of the largest SDB studies in history by performing advanced statistical analyses on hundreds of thousands of clinical data points.
We consult with physicians at major medical centers throughout the world to identify clinical and technological trends in the treatment of SDB, COPD and the other conditions associated with these diseases. New product ideas are also identified by our marketing staff, direct sales force and network of distributors, customers, clinicians and patients.
In fiscal years 2017, 2016 and 2015 we invested $144.5 million, $118.7 million and $114.9 million, respectively, on research and development.
Sales and Marketing
We currently market our products in more than 120 countries through a network of distributors and our direct sales force. We attempt to tailor our marketing approach to each national market, based on regional awareness of SDB as a health problem, physician referral patterns, consumer preferences and local reimbursement policies. See Note 15 – Segment Information of the Notes to Consolidated Financial Statements (Part II, Item 8) for financial information about our geographic areas.
North America and Latin America. Our products are typically purchased by a home healthcare dealer who then sells the products to the patient. The decision to purchase our products, as opposed to those of our competitors, is made or influenced by one or more of the following individuals or organizations: the prescribing physician and his or her staff; the home healthcare dealer; the insurer and the patient. In North and Latin America, our sales and marketing activities are conducted through a field sales organization made up of regional territory representatives, program development specialists and regional sales directors. Our field sales organization markets and sells products to home healthcare dealer branch locations throughout North and Latin America.
We also market our products directly to physicians and sleep clinics. Patients who are diagnosed with OSA or another respiratory condition and prescribed our products are typically referred by the diagnosing physician or sleep clinic to a home healthcare dealer to fill the prescription. The home healthcare dealer, in consultation with the referring physician, will assist the patient in selecting the equipment, fit the patient with the appropriate mask and set the device pressure to the prescribed level.
Sales in North and Latin America accounted for 63%, 61% and 57% of our net revenues for fiscal years 2017, 2016 and 2015 respectively.
Europe. We market our products in most major European countries. We have wholly-owned subsidiaries in Austria, Czech Republic, Denmark, Finland, France, Germany, Ireland, Netherlands, Norway, Poland, Sweden, Switzerland and the United Kingdom. We use independent distributors to sell our products in other areas of Europe. Distributors are selected in each country based on their knowledge of respiratory medicine and a commitment to SDB therapy. In each country in which we sell our products direct, a local senior manager is responsible for direct national sales. In many countries in Europe, we sell our products to home healthcare dealers or hospitals who then sell the products to the patients. In Germany, we also operate a home healthcare company, in which we provide products and services directly to patients, and receive reimbursement directly from third-party payors.
- 14 -
Table of Contents
Sales in Europe accounted for 26%, 29% and 32% of our total net revenues for fiscal years 2017, 2016 and 2015, respectively.
Asia Pacific. We have wholly-owned subsidiaries in Australia, China, India, Japan, Korea, New Zealand, and Taiwan. We use a combination of our direct sales force and independent distributors to sell our products in Asia Pacific. In Australia and New Zealand, we operate a home healthcare business and sell our products and services directly to patients.
Sales in Asia Pacific accounted for 11%, 10% and 11% of our total net revenues for the fiscal years 2017, 2016 and 2015, respectively.
Market Growth Opportunities
We view the future of our business in sleep and respiratory disorders as having three horizons of growth supported by three key foundations.
Our three key foundations reach across all three of our horizons and include: first, our focus on people, leadership and culture; second, our global leadership in digital health and connected care, an important advancement in our product and solution offerings; and third, our focus on operating excellence and high efficiency to leverage our global scale.
As we execute each horizon in our strategy, we will continue to expand into high growth geographic areas, including China, India, Eastern Europe, Brazil and Southeast Asia.
The first horizon includes our existing market in OSA treatment, where we believe our leadership in digital health and connected care is becoming an important distinguishing factor from our competitors. The use of technologies that allow remote collection and transfer of information through cloud-based computing is changing the current clinical pathways for following up with patients who use our devices, which we believe provides an opportunity to improve patient care and create efficiencies for customers and providers. We plan to continue to invest and expand our capabilities in this area.
The second horizon includes the use of connected devices for the treatment of respiratory failure both in the hospital and the home. We believe that COPD is a large and underpenetrated market where there are unmet patient needs as the global population with COPD continues to expand due to smoking and poor air quality. Some patients with later-stage COPD may benefit from the use of ventilation at night, but until recently only a small number of COPD patients were treated using ventilation on a long-term basis. A study published in 2014 found that patients with stable but severe COPD using non-invasive ventilation nightly for six months experienced a reduction in mortality and an improvement in quality of life and exercise capacity. The findings from this study and our associated marketing activities may result in an increase in the size of the homecare market for NIV. Additionally, the use of NIV is becoming routine in many acute care hospitals, as guidelines stipulate its use in acute exacerbations and familiarity with the techniques involved increases. In 2016, we expanded our product portfolio for the treatment of COPD with our acquisition of Inova Labs, a company that designs and manufactures POCs. Many patients in earlier stages of COPD may require oxygen therapy and through the use of NIV and POC products they can receive this treatment in the home.
Our third horizon focuses on a portfolio of new market options including sleep and consumer wellness, connected care expansion to continue to drive efficiency within the healthcare ecosystem and clinical areas of interest in adjacent markets like atrial fibrillation, heart failure and asthma.
- 15 -
Table of Contents
We continue to approach this horizon by building a pipeline of growth options focusing on technology disruption of healthcare that will lead to value creation opportunities. We continue working with key opinion leaders in pulmonology, cardiology, neurology, and related clinical areas. A growing body of literature documents the association and interactions between a number of cardiac diseases and SDB. OSA is the most common secondary cause of hypertension and is prevalent in hypertensive populations, particularly those resistant to therapy. Treatment with CPAP tends to lower blood pressure. OSA is prevalent in those with atrial fibrillation and may trigger episodes of fibrillation. Treatment with CPAP appears to improve outcomes. OSA is also known to be a strong risk factor for the development of acute coronary disease and cardiovascular disease in general. Heart failure is also commonly associated with both OSA and CSA, and both forms of SDB are risk factors for poor outcomes. We are undertaking several clinical trials in cardiology to strengthen the knowledge base on the effects of SDB therapy on outcomes. In addition to clinical trials we pursue suitable opportunities with professional and healthcare associations to raise awareness of the importance of SDB in cardiology patients.
We are also working with occupational health professionals to raise awareness of the issues caused by untreated OSA in the workplace including accidents, absenteeism and reduced productivity, plus increased costs for employers who provide healthcare coverage for employees.
We continue to provide research funding in these strategic areas while at the same time providing educational support to physicians working within these various specialties. We believe that the increasing awareness among physicians supports the efforts and investment we are making in new markets.
Manufacturing
Our manufacturing operations consist primarily of assembly and testing of our devices, masks and accessories. Of the numerous raw materials, parts and components purchased for assembly of our therapeutic and diagnostic sleep disorder products, most are off-the-shelf items available from multiple vendors. We also purchase uniquely configured components from various suppliers, including some who are single-source suppliers for us. Any reduction or halt in supply from one of these single-source suppliers could limit our ability to manufacture our products or devices until a replacement supplier is found and qualified. We generally manufacture to our internal sales forecasts and fill orders as received. Over the last few years, the manufacturing processes have been transformed along lean manufacturing guidelines to flow lines staffed by dedicated teams. Each team is responsible for the manufacture and quality of their product group and decisions are based on performance and quality measures, including customer feedback.
Our quality management system is based upon the requirements of ISO 9001, ISO 13485, FDA Quality System Regulations for Medical Devices, the Medical Device Directive (93/42/EEC) and other applicable regulations for the markets in which we sell. Our main manufacturing sites are certified to ISO 13485. Additionally, our Sydney, Loyang and Atlanta sites obtained Medical Device Single Audit Program or MDSAP, certifications which involve a single regulatory audit of medical device manufacturers’ quality management system to satisfy multiple regulatory requirements, including FDA, TGA, ANVISA, Health Canada and Japan. These sites are subject to third-party audits, conducted by the ISO notified bodies and MDSAP Auditing Organizations, at regular intervals.
Our main manufacturing facilities are located in Sydney, Australia; Loyang, Singapore; Chatsworth, California; Johor Bahru, Malaysia; Atlanta, Georgia. Refer to Item 2 for additional details on these properties.
- 16 -
Table of Contents
Third-Party Coverage and Reimbursement
The cost of medical care in many of the countries in which we operate is funded in substantial part by government and private insurance programs. In Germany, we receive payments directly from these payors. Outside Germany, although we do not generally receive payments for our products directly from these payors, our success in major markets depends on the ability of patients to obtain coverage and adequate reimbursement from third-party payors for our products.
In the United States, our products are purchased primarily by home healthcare dealers, hospitals or sleep clinics, who invoice third-party payors directly for reimbursement. Domestic third-party payors include government payors such as Medicare and Medicaid and commercial health insurance plans. These payors may deny coverage and reimbursement if they determine that a device is not used in accordance with certain covered treatment methods, or is experimental, unnecessary or inappropriate. The long-term trend towards cost-containment, through managed healthcare, or other legislative proposals to reform healthcare, could control or significantly influence the purchase of healthcare services and products and could result in lower prices for our products. In some foreign markets, such as France, Germany and Japan, government reimbursement is currently available for purchase or rental of our products, subject to constraints such as price controls or unit sales limitations. In Australia, China, and in some other foreign markets, there is currently limited or no reimbursement for devices that treat OSA.
The past decade of legislative reform in the United States, including, by way of example, the 2010 Patient Protection and Affordable Care Act, as amended by the Health Care and Education Reconciliation Act (collectively, the ACA), Medicare Improvement for Patients and Providers Act of 2008, Deficit Reduction Act of 2005, the Medicare Prescription Drug, Improvement, and Modernization Act of 2003, or the MMA, and the 21st Century Cures Act has significantly impacted government reimbursement for products that we provide. The longer term impact, though not entirely predictable, continues to bring significant changes to the third-party payor landscape.
Beginning in 2005, the MMA established a Medicare competitive acquisition program for home medical equipment, or HME, and imposed quality standards and accreditation requirements for HME suppliers. The Centers for Medicare & Medicaid Services, or CMS, implemented the competitive bidding program beginning in 2011, and included HME that we manufacture and develop, specifically, oxygen CPAP and respiratory assist devices, and related supplies and accessories. CMS is required by law to recompete these contracts at least once every three years. In addition, the ACA required CMS to roll out the competitive bidding process nationally or adjust prices in non-competitive bidding areas, also known as the non-bid or Round 3 areas, to match competitive bidding prices by 2016. CMS phased in the new rates beginning January 1, 2016, and the rates became fully effective July 1, 2016. As a result of the national rollout, Medicare payment for CPAP devices in non-competitive bidding areas was reduced by approximately 60% in urban areas and approximately 56% in rural areas, as compared to the Medicare payment rates that were effective in 2015. The implementation of the competitive acquisition program has resulted in reduced Medicare payment for oxygen CPAP and respiratory assist devices, and related supplies and accessories in both competitive bidding areas and non-competitive bidding areas.
On December 13, 2016, the 21st Century Cures Act was signed into law, which retroactively adjusted rates in non-bid areas to allow for higher phase-in rates to be paid for items furnished between July 1, 2016 and December 31, 2016, rather than the lower fully-adjusted rates. These payment adjustments are expected to be completed by October 2017.
- 17 -
Table of Contents
The ACA, which was passed both to expand the number of individuals with healthcare coverage and to develop additional revenue sources, also included, among other things, a deductible excise tax equal to 2.3% of the price for which medical devices are sold in the United States on any entity that manufactures or imports medical devices, with limited exceptions, beginning in 2013. However, this excise tax was subsequently suspended by the U.S. Congress for medical device sales during calendar years 2016 and 2017. If this excise tax had not been suspended it would be applicable to our products that are primarily used in hospitals and sleep labs, which includes the ApneaLink Air, VPAP Tx, certain respiratory care and dental sleep products. Absent further Congressional action, this excise tax will be reinstated for medical device sales beginning January 1, 2018. The ACA also provided for a number of Medicare regulatory requirements, including new face-to-face encounter requirements for durable medical equipment and home health services.
We cannot predict at this time the full impact that the ACA, or any U.S. legislation enacted in the future, will have on our revenues, profit margins, profitability, operating cash flows and results of operations. The administration and the U.S. Congress may take further action regarding the ACA, including, but not limited to, repeal or replacement. Additionally, all or a portion of the ACA and related subsequent legislation may be modified, repealed or otherwise invalidated through judicial challenge.
Service and Warranty
We generally offer either one-year or two-year limited warranties on our devices. Warranties on mask systems are for 90 days. Our distributors either repair our products with parts supplied by us or arrange shipment of products to our facilities for repair or replacement.
We receive returns of our products from the field for various reasons. We believe that the level of returns experienced to date is consistent with levels typically experienced by manufacturers of similar devices. We provide for warranties and returns based on historical data.
Competition
The markets for our products are highly competitive. We believe that the principal competitive factors in all of our markets are product features, value-added solutions, reliability and price. Customer support, reputation and efficient distribution are also important factors.
We compete on a market-by-market basis with various companies, some of which have greater financial, research, manufacturing and marketing resources than us. Our primary competitors include Philips BV; Fisher & Paykel Healthcare Corporation Limited; DeVilbiss Healthcare; Apex Medical Corporation; BMC Medical Co. Ltd.; and regional manufacturers. The disparity between our resources and those of our competitors may increase as a result of the trend towards consolidation in the healthcare industry. In addition, some of our competitors, such as Löwenstein Medical GmbH + Co. KG, are affiliates of customers of ours, which may make it difficult to compete with them. Finally, our products compete with surgical procedures and dental appliances designed to treat OSA and other SDB-related respiratory conditions. The development of new or innovative procedures or devices by others could result in our products becoming obsolete or noncompetitive, which would harm our revenues and financial condition.
Any product developed by us that gains regulatory clearance will have to compete for market acceptance and market share. An important factor in such competition may be the timing of market introduction of competitive products. Accordingly, the speed with which we can develop products, complete clinical testing and regulatory clearance processes and supply commercial quantities of the product to the market are important competitive factors. In addition, our ability to compete will continue to be dependent on successfully protecting our patents and other intellectual property.
- 18 -
Table of Contents
Patents and Proprietary Rights and Related Litigation
We rely on a combination of patents, trade secrets, copyrights, trademarks and non-disclosure agreements to protect our proprietary technology and rights.
Through our various subsidiaries, as of the date of this annual report, we own or have licensed rights to approximately 1,127 issued United States patents (including approximately 430 design patents) and approximately 2,083 issued foreign patents. In addition, there are approximately 468 pending United States patent applications (including approximately 44design patent applications), approximately 952 pending foreign patent applications, approximately 983 registered foreign designs and 50 pending foreign designs. Some of these patents, patent applications and designs relate to significant aspects and features of our products.
Of our patents, 222 United States patents and 483 foreign patents are due to expire in the next five years. There are 99 foreign patents due to expire in 2018, 46 in 2019, 134 in 2020, 75 in 2021, and 129 in 2022. There are 54 United States patents due to expire in 2018, 17 United States patents in 2019, 72 United States patents in 2020, 33 United States patents in 2021, and 46 United States patents in 2022. We believe that the expiration of these patents will not have a material adverse impact on our competitive position.
Litigation has been necessary in the past and may be necessary in the future to enforce patents issued to us, to protect our rights, or to defend third-party claims of infringement by us of the proprietary rights of others. The defense and prosecution of patent claims, including pending claims, as well as participation in other inter-party proceedings, can be expensive and time-consuming, even in those instances in which the outcome is favorable to us. Patent laws regarding the enforceability of patents vary from country to country. Therefore, there can be no assurance that patent issues will be uniformly resolved, or that local laws will provide us with consistent rights and benefits.
Government Regulations
FDA
Our products are subject to extensive regulation particularly as to safety, efficacy and adherence to FDA Quality System Regulation, and related manufacturing standards. Medical device products are subject to rigorous FDA and other governmental agency regulations in the United States and similar regulations of foreign agencies abroad. The FDA regulates the design, development, research, preclinical and clinical testing, introduction, manufacture, advertising, labeling, packaging, marketing, distribution, import and export, and record keeping for such products, in order to ensure that medical products distributed in the United States are safe and effective for their intended use. In addition, the FDA is authorized to establish special controls to provide reasonable assurance of the safety and effectiveness of most devices. Non-compliance with applicable requirements can result in import detentions, fines, civil and administrative penalties, injunctions, suspensions or losses of regulatory approvals, recall or seizure of products, operating restrictions, refusal of the government to approve product export applications or allow us to enter into supply contracts, and criminal prosecution.
Unless an exemption applies, the FDA requires that a manufacturer introducing a new medical device or a new indication for use of an existing medical device obtain either a Section 510(k) premarket notification clearance or a premarket approval, or PMA, before introducing it into the U.S. market. The type of marketing authorization is generally linked to the classification of the device. The FDA classifies medical devices into one of three classes (Class I, II or III) based on the degree of risk the FDA determines to be associated with a device and the level of regulatory control deemed necessary to ensure the device’s safety and effectiveness.
- 19 -
Table of Contents
Our products currently marketed in the United States are marketed pursuant to 510(k) pre-marketing clearances and are either Class I or Class II devices. The process of obtaining a Section 510(k) clearance generally requires the submission of performance data and often clinical data, which in some cases can be extensive, to demonstrate that the device is “substantially equivalent” to a device that was on the market before 1976 or to a device that has been found by the FDA to be “substantially equivalent” to such a pre-1976 device, a predecessor device is referred to as “predicate device.” As a result, FDA clearance requirements may extend the development process for a considerable length of time. In addition, in some cases, the FDA may require additional review by an advisory panel, which can further lengthen the process. The PMA process, which is reserved for new devices that are not substantially equivalent to any predicate device and for high-risk devices or those that are used to support or sustain human life, may take several years and requires the submission of extensive performance and clinical information.
Medical devices can be marketed only for the indications for which they are cleared or approved. After a device has received 510(k) clearance for a specific intended use, any change or modification that significantly affects its safety or effectiveness, such as a significant change in the design, materials, method of manufacture or intended use, may require a new 510(k) clearance or PMA approval and payment of an FDA user fee. The determination as to whether or not a modification could significantly affect the device’s safety or effectiveness is initially left to the manufacturer using available FDA guidance; however, the FDA may review this determination to evaluate the regulatory status of the modified product at any time and may require the manufacturer to cease marketing and recall the modified device until 510(k) clearance or PMA approval is obtained. The manufacturer may also be subject to significant regulatory fines or penalties. The FDA recently reviewed its guidance describing when it believes a manufacturer is obligated to submit a new 510(k) for modifications or changes to a previously cleared device and determined that manufacturers should continue adhering to the 1997 guidance on this topic. In August 2016, the FDA issued draft guidance that it believes preserves the basic content and format of the 1997 guidance, with updates to add clarity.
Any devices we manufacture and distribute pursuant to clearance or approval by the FDA are subject to pervasive and continuing regulation by the FDA and certain state agencies. These include product listing and establishment registration requirements, which help facilitate FDA inspections and other regulatory actions. As a medical device manufacturer, all of our manufacturing facilities are subject to inspection on a routine basis by the FDA. We are required to adhere to applicable regulations setting forth detailed cGMP requirements, as set forth in the QSR, which require, manufacturers, including third-party manufacturers, to follow stringent design, testing, control, documentation and other quality assurance procedures during all phases of the design and manufacturing process. Noncompliance with these standards can result in, among other things, fines, injunctions, civil penalties, recalls or seizures of products, total or partial suspension of production, refusal of the government to grant 510(k) clearance or PMA approval of devices, withdrawal of marketing approvals and criminal prosecutions. We believe that our design, manufacturing and quality control procedures are in compliance with the FDA’s regulatory requirements.
We must also comply with post-market surveillance regulations, including medical device reporting, or MDR, requirements which require that we review and report to the FDA any incident in which our products may have caused or contributed to a death or serious injury. We must also report any incident in which our product has malfunctioned if that malfunction would likely cause or contribute to a death or serious injury if it were to recur.
- 20 -
Table of Contents
Labeling and promotional activities are subject to scrutiny by the FDA and, in certain circumstances, by the Federal Trade Commission. Medical devices approved or cleared by the FDA may not be promoted for unapproved or uncleared uses, otherwise known as “off-label” promotion. The FDA and other agencies actively enforce the laws and regulations prohibiting the promotion of off-label uses, and a company that is found to have improperly promoted off-label uses may be subject to significant liability, including substantial monetary penalties and criminal prosecution.
Sales of medical devices outside the United States are subject to regulatory requirements that vary widely from country to country.
EEA
In the European Economic Area, (which is comprised of the 28 Member States of the European Union plus Norway, Iceland and Liechtenstein), or EEA, manufacturers of medical devices need to comply with the Essential Requirements laid out in Annex I to the EU Medical Devices Directive (Council Directive 93/42/EEC). Compliance with these requirements is a prerequisite to be able to affix the CE mark to medical devices, without which they cannot be marketed or sold in the EEA. To demonstrate compliance with the Essential Requirements and obtain the right to affix the CE Mark, manufacturers of medical devices must undergo a conformity assessment procedure, which varies according to the type of medical device and its classification. Except for low-risk medical devices (Class I with no measuring function and which are not sterile), where the manufacturer can issue an EC Declaration of Conformity based on a self-assessment of the conformity of its products with the Essential Requirements, a conformity assessment procedure requires the intervention of a Notified Body, which is an organization designated by a competent authority of an EEA country to conduct conformity assessments. Depending on the relevant conformity assessment procedure, the Notified Body would audit and examine the Technical File and the quality system for the manufacture, design and final inspection of the devices. The Notified Body issues a CE Certificate of Conformity following successful completion of a conformity assessment procedure conducted in relation to the medical device and its manufacturer and their conformity with the Essential Requirements. This Certificate entitles the manufacturer to affix the CE mark to its medical devices after having prepared and signed a related EC Declaration of Conformity.
Where appropriate, our products commercialized in Europe are CE marked and classified as either Class I or Class II.
On April 5, 2017, the European Parliament passed the Medical Devices Regulation, which repeals and replaces the EU Medical Devices Directive. Unlike directives, which must be implemented into the national laws of the EEA member States, the regulations would be directly applicable (i.e., without the need for adoption of EEA member State laws implementing them) in all EEA member States and are intended to eliminate current differences in the regulation of medical devices among EEA member States. The Medical Devices Regulation, among other things, is intended to establish a uniform, transparent, predictable and sustainable regulatory framework across the EEA for medical devices and in vitro diagnostic devices and ensure a high level of safety and health while supporting innovation.
The Medical Devices Regulation will however only become applicable three years after publication. Once applicable, the new regulations will among other things:
| • | strengthen the rules on placing devices on the market and reinforce surveillance once they are available; |
| • | establish explicit provisions on manufacturers’ responsibilities for the follow-up of the quality, performance and safety of devices placed on the market; |
- 21 -
Table of Contents
| • | improve the traceability of medical devices throughout the supply chain to the end-user or patient through a unique identification number; |
| • | set up a central database to provide patients, healthcare professionals and the public with comprehensive information on products available in the EU; |
| • | strengthened rules for the assessment of certain high-risk devices, such as implants, which may have to undergo an additional check by experts before they are placed on the market. |
These modifications may have an impact on the way we design and manufacture products and the way we conduct our business in the EEA.
Other regulatory bodies
Our devices are sold in multiple countries and often need to be registered with local regulatory bodies such as the Therapeutic Goods Administration in Australia, and Health Canada in Canada.
Other Healthcare Laws
Even though we do not submit claims or bill governmental programs and other third-party payers directly for reimbursement for our products sold in the United States, we are still subject to a number of laws and regulations that may restrict our business practices, including, without limitation, anti-kickback, false claims, physician payment transparency and data privacy and security laws. The government has interpreted these laws broadly to apply to the marketing and sales activities of manufacturers and distributors like us.
The federal Anti-Kickback Statute prohibits, among other things, persons or entities from knowingly and willfully soliciting, receiving, offering or providing remuneration, directly or indirectly, in cash or in kind, in exchange for or to induce either the referral of an individual for, or the purchase, lease, order or recommendation of, any good, facility, item or service for which payment may be made, in whole or in part, under federal healthcare programs such as Medicare and Medicaid. In addition, a claim including items or services resulting from a violation of the federal Anti-Kickback Statute constitutes a false or fraudulent claim for purposes of the federal civil False Claims Act.
The federal civil False Claims Act prohibits, among other things, any person or entity from knowingly presenting, or causing to be presented, a false or fraudulent claim for payment or approval to the federal government or knowingly making, using or causing to be made or used a false record or statement material to a false or fraudulent claim to the federal government. A claim includes “any request or demand” for money or property presented to the U.S. government. The civil False Claims Act also applies to false submissions that cause the government to be paid less than the amount to which it is entitled, such as a rebate. Intent to deceive is not required to establish liability under the civil False Claims Act. Private suits filed under the civil False Claims Act, known as qui tam actions, can be brought by individuals on behalf of the government. These individuals may share in any amounts paid by the entity to the government in fines or settlement.
The federal Health Insurance Portability and Accountability Act of 1996, or HIPAA, created federal criminal statutes that prohibit among other actions, knowingly and willfully executing, or attempting to execute, a scheme to defraud any healthcare benefit program, including private third-party payors, knowingly and willfully embezzling or stealing from a healthcare benefit program, willfully obstructing a criminal investigation of a healthcare offense, and knowingly and willfully falsifying, concealing or covering up a material fact or making any materially false, fictitious or fraudulent statement in connection with the delivery of or payment for healthcare benefits, items or services. Like the Anti-Kickback Statute, a person or entity does not need to have actual knowledge of these statutes or specific intent to violate them in order to have committed a violation.
- 22 -
Table of Contents
Also, many U.S. states and countries outside the U.S. have similar fraud and abuse statutes or regulations that may be broader in scope and may apply regardless of payor, in addition to items and services reimbursed under government programs.
Under HIPAA, as amended by the Health Information Technology for Economic and Clinical Health Act of 2009, or HITECH, which we collectively refer to as HIPAA, the Department of Health and Human Services, or HHS, has issued regulations, including the HIPAA Privacy, Security and Breach Notification Rules, to protect the privacy and security of protected health information, or PHI, used or disclosed by covered entities including health care providers and their business associates. HIPAA also regulates standardization of data content, codes and formats used in health care transactions and standardization of identifiers for health plans and providers. Penalties for violations of HIPAA regulations include civil and criminal penalties. In addition to federal privacy and security regulations, there are a number of state laws governing confidentiality and security of health information that are applicable to our business. New laws governing privacy may be adopted in the future as well. Failure to comply with privacy requirements could result in civil or criminal penalties, which could have a materially adverse effect on our business.
In some of our operations, such as those involving our cloud-based software digital health applications, we are a business associate under HIPAA and therefore required to comply with the HIPAA Security Rule, Breach Notification Rule and certain provisions of the HIPAA Privacy Rule, and are subject to significant civil and criminal penalties for failure to do so.
In addition, we are subject to laws and regulations in non-U.S. countries covering data privacy and the protection of health-related and other personal information. EU member states and other jurisdictions have adopted data protection laws and regulations, which impose significant compliance obligations. In particular, the new EU-wide General Data Protection Regulation, or GDPR, entered into force in May 2016 and will become applicable on May 25, 2018, replacing the current data protection laws of each EU member state. The GDPR will implement more stringent operational requirements for processors and controllers of personal data, including, for example, expanded disclosures about how personal information is to be used, limitations on retention of information, increased requirements pertaining to health data and pseudonymized (i.e., key-coded) data, mandatory data breach notification requirements and higher standards for data controllers to demonstrate that they have obtained valid consent for certain data processing activities. The GDPR provides that EU member states may make their own further laws and regulations limiting the processing of genetic, biometric or health data, which could limit our ability to use and share personal data or could cause our costs could increase, and harm our business and financial condition.
Numerous other state, federal and foreign laws, including consumer protection laws and regulations, govern the collection, dissemination, use, access to, confidentiality and security of patient health information. In addition, Congress and some states are considering new laws and regulations that further protect the privacy and security of medical records or medical information. With the recent increase in publicity regarding data breaches resulting in improper dissemination of consumer information, many states have passed laws regulating the actions that a business must take if it experiences a data breach, such as prompt disclosure to affected customers. Generally, these laws are limited to electronic data and make some exemptions for smaller breaches. Congress has also been considering similar federal legislation relating to data breaches. The Federal Trade Commission, or FTC, and states’ Attorneys General have also brought enforcement actions and prosecuted some data breach cases as unfair and/or deceptive acts or practices under the FTC Act. In addition to data breach notification laws, some states have enacted statutes and rules requiring businesses to reasonably protect certain types of personal information they hold or to otherwise comply with certain specified data security requirements for personal information. These laws may apply directly to our business or indirectly by contract when we provide services to other companies. We intend to continue to comprehensively protect all personal information and to comply with all applicable laws regarding the protection of such information.
- 23 -
Table of Contents
Additionally, there has been a recent trend of increased federal and state regulation of payments and transfers of value provided to healthcare professionals or entities. The Physician Payment Sunshine Act was enacted as part of the ACA, and imposed new annual reporting requirements on device manufacturers for payments and other transfers of value provided by them, directly or indirectly, to physicians and teaching hospitals, as well as ownership and investment interests held by physicians and their family members. A manufacturer’s failure to submit timely, accurately and completely the required information for all payments, transfers of value or ownership or investment interests may result in civil monetary penalties. Certain states also mandate implementation of commercial compliance programs, impose restrictions on device manufacturer marketing practices and/or require the tracking and reporting of gifts, compensation and other remuneration to healthcare professionals and entities.
The shifting commercial compliance environment and the need to build and maintain robust systems to comply with different compliance or reporting requirements in multiple jurisdictions increase the possibility that a healthcare company may fail to comply fully with one or more of these requirements. If our operations are found to be in violation of any of the health regulatory laws described above or any other laws that apply to us, we may be subject to penalties, including potentially significant criminal and civil and administrative penalties, damages, fines, disgorgement, imprisonment, exclusion from participation in government healthcare programs, contractual damages, reputational harm, administrative burdens, diminished profits and future earnings, and the curtailment or restructuring of our operations, any of which could adversely affect our ability to operate our business and our results of operations.
Employees
As of June 30, 2017, we had approximately 6,080 employees or full-time consultants, of which approximately 2,300 were employed in warehousing and manufacturing, 880 in research and development and 2,900 in sales, marketing and administration. Of our employees and consultants, approximately 1,810 were located in North and Latin America, 1,600 in Australia, 1,335 in Europe and 1,335 in Asia.
We believe that the success of our business will depend, in part, on our ability to attract and retain qualified personnel.
| ITEM 1A | RISK FACTORS |
Before deciding to purchase, hold or sell our common stock, you should carefully consider the risks described below in addition to the other cautionary statements and risks described elsewhere, and the other information contained, in this Report and in our other filings with the SEC, including our subsequent reports on Forms 10-Q and 8-K. The risks and uncertainties described below are not the only ones we face. Additional risks and uncertainties not presently known to us or that we currently deem immaterial may also affect our business. If any of these known or unknown risks or uncertainties actually occurs with material adverse effects on us, our business, financial condition and results of operations could be seriously harmed. In that event, the market price for our common stock will likely decline, and you may lose all or part of your investment.
- 24 -
Table of Contents
Our inability to compete successfully in our markets may harm our business. The markets for our SDB products are highly competitive and are characterized by frequent product improvements and evolving technology. Our ability to compete successfully depends, in part, on our ability to develop, manufacture and market innovative new products. The development of innovative new products by our competitors or the discovery of alternative treatments or potential cures for the conditions that our products treat could make our products noncompetitive or obsolete. Current competitors, new entrants, academics, and others are trying to develop new devices, alternative treatments or cures, and pharmaceutical solutions to the conditions our products treat.
Additionally, some of our competitors have greater financial, research and development, manufacturing and marketing resources than we do. The past several years have seen a trend towards consolidation in the healthcare industry and in the markets for our products. Industry consolidation could result in greater competition if our competitors combine their resources, if our competitors are acquired by other companies with greater resources than ours, or if our competitors become affiliated with customers of ours. This competition could increase pressure on us to reduce the selling prices of our products or could cause us to increase our spending on research and development and sales and marketing. If we are unable to develop innovative new products, maintain competitive pricing, and offer products that consumers perceive to be as good as those of our competitors, our sales or gross margins could decrease which would harm our business.
Our business depends on our ability to market effectively to dealers of home healthcare products and sleep clinics. We market our products primarily to home healthcare dealers and to sleep clinics that diagnose OSA and other sleep disorders, as well as to non-sleep specialist physician practices that diagnose and treat sleep disorders. We believe that these groups play a significant role in determining which brand of product a patient will use. The success of our business depends on our ability to market effectively to these groups to ensure that our products are properly marketed and sold by these third-parties.
We have limited resources to market to the sleep clinics, home healthcare dealer branch locations and to the non-sleep specialists, most of whom use, sell or recommend several brands of products. In addition, home healthcare dealers have experienced price pressures as government and third-party reimbursement has declined for home healthcare products, and home healthcare dealers are requiring price discounts and longer periods of time to pay for products purchased from us. We cannot assure you that physicians will continue to prescribe our products, or that home healthcare dealers or patients will not substitute competing products when a prescription specifying our products has been written.
We have expanded our marketing activities in some markets to target the population with a predisposition to sleep-disordered breathing as well as primary care physicians and various medical specialists. We cannot assure you that these marketing efforts will be successful in increasing awareness or sales of our products.
Consolidation in the health care industry could have an adverse effect on our revenues and results of operations. Many home health care dealers are consolidating which may result in greater concentration of market power. As the health care industry consolidates, competition to provide goods and services to industry participants may become more intense. These industry participants may try to use their market power to negotiate price concessions or reductions for medical devices and components produced by us. If we are forced to reduce our prices because of consolidation in the health care industry, our revenues may decrease and our consolidated earnings, financial condition, and/or cash flows may suffer.
- 25 -
Table of Contents
If we are unable to support our continued growth, our business could suffer. As we continue to grow, the complexity of our operations increases, placing greater demands on our management. Our ability to manage our growth effectively depends on our ability to implement and improve our financial and management information systems on a timely basis and to effect other changes in our business including, the ability to monitor and improve manufacturing systems, information technology, and quality and regulatory compliance systems, among others. Unexpected difficulties during expansion, the failure to attract and retain qualified employees, the failure to successfully replace or upgrade our management information systems, the failure to manage costs or our inability to respond effectively to growth or plan for future expansion could cause our growth to stop. If we fail to manage our growth effectively and efficiently, our costs could increase faster than our revenues and our business results could suffer.
If we fail to integrate our recent acquisitions with our operations, our business could suffer. In fiscal 2016 we completed a number of acquisitions, including among others, the acquisition of Brightree, Curative Medical and Inova Labs. The success of these acquisitions, as well as our other recent acquisitions, will depend, in part, on our ability to successfully integrate the business and operations of the acquired companies and fully realize the anticipated benefits from such acquisitions. Additionally, our management may have their attention diverted while trying to integrate these businesses. If we are not able to successfully integrate the operations, we may not realize the anticipated benefits of the acquisitions fully or at all, or may take longer to realize than expected.
We are subject to various risks relating to international activities that could affect our overall profitability. We manufacture substantially all of our products outside the United States and sell a significant portion of our products in non-U.S. markets. Sales outside North and Latin America accounted for approximately 37% and 39% of our net revenues in the years ended June 30, 2017 and June 30, 2016 respectively. We expect that sales within these areas will account for approximately 35% to 40% of our net revenues in the foreseeable future. Our sales and operations outside of the U.S. are subject to several difficulties and risks that are separate and distinct from those we face in the U.S., including:
| • | fluctuations in currency exchange rates; |
| • | tariffs and other trade barriers; |
| • | compliance with foreign medical device manufacturing regulations; |
| • | difficulty in enforcing agreements and collecting receivables through foreign legal systems; |
| • | reduction in third-party payor reimbursement for our products; |
| • | inability to obtain import licenses; |
| • | changes in trade policies and in U.S. and foreign tax policies; |
| • | possible changes in export or import restrictions; and |
| • | the modification or introduction of other governmental policies with potentially adverse effects. |
Any of the above factors may have a material adverse effect on our ability to increase or maintain our non-U.S sales.
- 26 -
Table of Contents
Government and private insurance plans may not adequately reimburse our customers for our products, which could result in reductions in sales or selling prices for our products. Our ability to sell our products depends in large part on the extent to which coverage and reimbursement for our products will be available from government health administration authorities, private health insurers and other organizations. These third-party payers are increasingly challenging the prices charged for medical products and services and can, without notice, deny coverage for our products or treatments that may include the use of our products. Therefore, even if a product is approved for marketing, we cannot make assurances that coverage and reimbursement will be available for the product, that the reimbursement amount will be adequate or that the reimbursement amount, even if initially adequate, will not be subsequently reduced. For example, in some markets, such as Spain, France and Germany, government coverage and reimbursement are currently available for the purchase or rental of our products but are subject to constraints such as price controls or unit sales limitations. In other markets, such as Australia, there is currently limited or no reimbursement for devices that treat SDB conditions. As we continue to develop new products, those products will generally not qualify for coverage and reimbursement until they are approved for marketing, if at all.
In the United States, we sell our products primarily to home healthcare dealers, hospitals and sleep clinics. Reductions in reimbursement to our customers by third-party payers, if they occur, may have a material impact on our customers and, therefore, may indirectly affect our pricing and sales to, or the collectability of receivables we have from, those customers. A development negatively affecting reimbursement stems from the Medicare competitive bidding program mandated by the MMA. Under the program, our customers who provide home healthcare services must compete to offer products in designated competitive bidding areas, or CBAs. In addition, under the ACA, in 2016, CMS adjusted the prices in non-competitive bidding areas to match competitive bidding prices. CMS phased in the new rates beginning January 1, 2016, and were fully effective July 1, 2016. This program has significantly reduced the Medicare reimbursement to our customers compared with reimbursement in 2011, at the beginning of the program. Similarly, provisions of the 21st Century Cures Act were signed into law, which retroactively adjusted rates in non-bid areas to allow for the higher phase-in rates to be paid for items furnished between July 1, 2016 and December 31, 2016, rather than the lower fully-adjusted rates. These payment adjustments are expected to be completed by October 2017. If changes are made to this law in the future, it could affect amounts being recovered by our customers.
We cannot predict at this time the full impact the competitive bidding program and the developments in the competitive bidding program will have on our business and financial condition.
Healthcare reform may have a material adverse effect on our industry and our results of operations. In March 2010, the ACA was signed into law in the United States. The ACA made changes that significantly impacted the healthcare industry, including medical device manufacturers. One of the principal purposes of the ACA was to expand health insurance coverage to millions of Americans who were uninsured. The ACA required adults not covered by an employer- or government-sponsored insurance plan to maintain health insurance coverage or pay a penalty, a provision commonly referred to as the individual mandate.
- 27 -
Table of Contents
The ACA also contained a number of provisions designed to generate the revenues necessary to fund the coverage expansions. This included new fees or taxes on certain health-related industries, including medical device manufacturers. Beginning in 2013, entities that manufacture, produce or import medical devices were required to pay an excise tax in an amount equal to 2.3% of the price for which such devices are sold in the United States. This excise tax is applicable to our products that are primarily used in hospitals and sleep labs, which includes the ApneaLink, VPAP Tx, certain Respiratory Care and dental sleep products. The medical device tax was suspended for 2016 and 2017 calendar years, but is scheduled to return beginning in 2018, absent further Congressional action. In addition to the competitive bidding changes discussed above, the ACA also included, among other things, demonstrations to develop organizations that are paid under a new payment methodology for voluntary coordination of care by groups of providers, such as physicians and hospitals, and the establishment of a new Patient-Centered Outcomes Research Institute to oversee, identify priorities in and conduct comparative clinical effectiveness research. The increased funding and focus on comparative clinical effectiveness research, which compares and evaluates the risks and benefits, clinical outcomes, effectiveness and appropriateness of products, may result in lower reimbursements by payers for our products and decreased profits to us.
Other federal legislative changes have been proposed and adopted since the ACA was enacted. These changes included an aggregate reduction in Medicare payments to providers of up to 2% per fiscal year, which went into effect on April 1, 2013 and will remain in effect through 2025 unless additional Congressional action is taken. On January 2, 2013, the American Taxpayer Relief Act of 2012, was signed into law, which, among other things, further reduced Medicare payments to several providers, including hospitals, and increased the statute of limitations period for the government to recover overpayments to providers from three to five years.
The full impact on our business of the ACA and other new laws is uncertain. Nor is it clear whether other legislative changes will be adopted, if any, or how such changes would affect the demand for our products. Future actions by the administration and the U.S. Congress including, but not limited to, repeal or replacement of the ACA could have a material adverse impact on our results of operations or financial condition. Additionally, all or a portion of the ACA and related subsequent legislation may be modified, repealed or otherwise invalidated through judicial challenge.
Various healthcare reform proposals have also emerged at the state level within the United States. The ACA as well as other federal and/or state healthcare reform measures that may be adopted in the future, singularly or in the aggregate, could have a material adverse effect on our business, financial condition and results of operations.
Failure to comply with anti-kickback and fraud regulations could result in substantial penalties and changes in our business operations. Although we do not provide healthcare services, submit claims for third-party reimbursement, or receive payments directly from Medicare, Medicaid or other third-party payors for our products, we are subject to healthcare fraud and abuse regulation and enforcement by federal, state and foreign governments, which could significantly impact our business. We also are subject to foreign fraud and abuse laws, which vary by country.
In the United States, the laws that may affect our ability to operate include, but are not limited to:
| • | the federal Anti-Kickback Statute, which prohibits, among other things, persons and entities from knowingly and willfully soliciting, receiving, offering, or paying remuneration, directly or indirectly, in cash or in kind, in exchange for or to induce either the referral of an individual for, or the purchase, lease, order or recommendation of, any good, facility, item or service for which payment may be made, in whole or in part, under federal healthcare programs such as Medicare and Medicaid. A person or entity does not need to have actual knowledge of this statute or specific intent to violate the Anti-Kickback statute itself to have committed a violation. The U.S. government has interpreted this law broadly to apply to the marketing and sales activities of manufacturers and distributors like us; |
- 28 -
Table of Contents
| • | federal civil and criminal false claims laws and civil monetary penalty laws, that prohibit, among other things, knowingly presenting, or causing to be presented, claims for payment or approval to the federal government that are false or fraudulent, knowingly making a false statement material to an obligation to pay or transmit money or property to the federal government or knowingly concealing or knowingly and improperly avoiding or decreasing an obligation to pay or transmit money or property to the federal government. These laws may apply to manufacturers and distributors who provide information on coverage, coding, and reimbursement of their products to persons who do bill third-party payers; |
| • | HIPAA, which created federal criminal laws that prohibit executing a scheme to defraud any healthcare benefit program or making false statements relating to healthcare matters. A person or entity does not need to have actual knowledge of these statutes or specific intent to violate them to have committed a violation; |
| • | the federal Physician Sunshine Act requirements under the ACA, which impose reporting and disclosure requirements on device and drug manufacturers for any “transfer of value” made or distributed by certain manufacturers of drugs, devices, biologics, and medical supplies to physicians (including doctors, dentists, optometrists, podiatrists and chiropractors) and teaching hospitals, and ownership and investment interests held by physicians and their immediate family members; |
| • | federal consumer protection and unfair competition laws, which broadly regulate marketplace activities and activities that potentially harm customers; and |
| • | state and foreign law equivalents of each of the above federal laws, such as state anti-kickback and false claims laws that may apply to items or services reimbursed by any third-party payor, including commercial insurers; state laws that require device companies to comply with the industry’s voluntary compliance guidelines and the relevant compliance guidance promulgated by the federal government, or otherwise restrict payments that may be made to healthcare providers and other potential referral sources; state laws that require device manufacturers to report information related to payments and other transfers of value to physicians and other healthcare providers or marketing expenditures. |
The scope and enforcement of these laws are uncertain and subject to rapid change in the current environment of healthcare reform, especially in light of the lack of applicable precedent and regulations. Federal and state enforcement bodies have recently increased their scrutiny of interactions between healthcare companies and healthcare providers, which has led to a number of investigations, prosecutions, convictions and settlements in the healthcare industry. For example, in July 2016, we received a federal administrative subpoena from the Office of Inspector General, or OIG, of the Department of Health and Human Services. The subpoena contains a request for documents and other materials that relate primarily to industry offerings of patient resupply software to home medical equipment providers. In November 2016, we received a second subpoena, requesting documents and other materials regarding other promotional programs. We are cooperating with the government’s request for documents and information. Responding to investigations can be time-and resource-consuming and can divert management’s attention from the business. Additionally, as a result of these investigations, healthcare providers and entities may face litigation or have to agree to settlements that can include monetary penalties and onerous compliance and reporting requirements as part of a consent decree or corporate integrity agreement. Any such investigation or settlement could increase our costs or otherwise have an adverse effect on our business.
If our operations are found to be in violation of any of the laws described above or any other governmental regulations that apply to us now or in the future, we may be subject to penalties, including civil and criminal penalties, damages, fines, disgorgement, exclusion from governmental health care programs, and the curtailment or restructuring of our operations, any of which could adversely affect our ability to operate our business and our financial results.
- 29 -
Table of Contents
Our use and disclosure of individually identifiable information, including health information, is subject to federal, state and foreign privacy and security regulations, and our failure to comply with those regulations or to adequately secure the information we hold could result in significant liability or reputational harm. The privacy and security of personally identifiable information stored, maintained, received or transmitted electronically is a major issue in the United States and abroad. While we strive to comply with all applicable privacy and security laws and regulations, as well as our own posted privacy policies, legal standards for privacy, including but not limited to ‘‘unfairness’’ and ‘‘deception,’’ as enforced by the FTC and state attorneys general, continue to evolve and any failure or perceived failure to comply may result in proceedings or actions against us by government entities or others, or could cause us to lose audience and customers, which could have a material adverse effect on our business. Recently, there has been an increase in public awareness of privacy issues in the wake of revelations about the activities of various government agencies and in the number of private privacy-related lawsuits filed against companies. Concerns about our practices with regard to the collection, use, disclosure, or security of personally identifiable information or other privacy-related matters, even if unfounded and even if we are in compliance with applicable laws, could damage our reputation and harm our business.
Numerous foreign, federal and state laws and regulations govern collection, dissemination, use and confidentiality of personally identifiable health information, including (i) state privacy and confidentiality laws (including state laws requiring disclosure of breaches); (ii) HIPAA; and (iii) European and other foreign data protection laws.
HIPAA establishes a set of national privacy and security standards for the protection of individually identifiable health information, including what is known as protected health information, by health plans, healthcare clearinghouses and healthcare providers that submit certain covered transactions electronically, or covered entities, and their ‘‘business associates,’’ which are persons or entities that perform certain services for, or on behalf of, a covered entity that involve the use or disclosure of protected health information. Certain portions of our business, such as the cloud-based software digital health applications, are subject to HIPAA as a business associate of our covered entities clients. To provide our covered entity clients with services that involve the use or disclosure of PHI, HIPAA requires us to enter into business associate agreements that require us to safeguard PHI in accordance with HIPAA. As a business associate, we are also directly liable for compliance with HIPAA. Penalties for violations of HIPAA regulations include civil and criminal penalties.
HIPAA authorizes state attorneys general to file suit under HIPAA on behalf of state residents. Courts can award damages, costs and attorneys’ fees related to violations of HIPAA in such cases. While HIPAA does not create a private right of action allowing individuals to sue us in civil court for HIPAA violations, its standards have been used as the basis for a duty of care claim in state civil suits such as those for negligence or recklessness in the misuse or breach of PHI.
HIPAA further requires business associates like us to notify our covered entity clients “without unreasonable delay and in no case later than 60 calendar days after discovery of the breach.” Covered entities must notify affected individuals “without unreasonable delay and in no case later than 60 calendar days after discovery of the breach” if their unsecured PHI is subject to an unauthorized access, use or disclosure. If a breach affects 500 patients or more, covered entities must report it to HHS and local media without unreasonable delay, and HHS will post the name of the breaching entity on its public website. If a breach affects fewer than 500 individuals, the covered entity must log it and notify HHS at least annually.
If we are unable to properly protect the privacy and security of health information entrusted to us, our solutions may be perceived as not secure, we may incur significant liabilities and customers may curtail their use of or stop using our solutions. In addition, if we fail to comply with the terms of our business associate agreements with our clients, we are liable not only contractually but also directly under HIPAA.
- 30 -
Table of Contents
We are also subject to laws and regulations in non-U.S. countries covering data privacy and the protection of health-related and other personal information. EU member states and other jurisdictions have adopted data protection laws and regulations, which impose significant compliance obligations. Laws and regulations in these jurisdictions apply broadly to the collection, use, storage, disclosure and security of personal information that identifies or may be used to identify an individual, such as names, contact information, and sensitive personal data such as health data. These laws and regulations are subject to frequent revisions and differing interpretations, and have generally become more stringent over time.
For example, the new EU-wide GDPR will implement more stringent operational requirements for processors and controllers of personal data, including, for example, expanded disclosures about how personal information is to be used, limitations on retention of information and mandatory data breach notification requirements. Compliance with such laws and regulations could cause our costs to increase and harm our business and financial condition. Additionally, limitations on our ability to use and share personal data could adversely affect our business.
We are also subject to evolving EU laws on data export, as we may transfer personal data from the EU to other jurisdictions. For example, in February 2016, the EU and the United States agreed to a new framework regarding the transfer of personal data from the EU to the United States called the Privacy Shield. However, there is currently litigation challenging this framework, and it is uncertain whether the Privacy Shield framework will be invalidated by the EU courts, similar to the treatment of the prior governing framework. We do not transfer any personal data relating to patients between the EU and United States. All other personal data transfers are subject to our internal controls as well as Standard Model clauses with any relevant European countries.
In recent years, U.S. and European lawmakers and regulators have also expressed concern over electronic marketing and the use of third-party cookies, web beacons and similar technology for online behavioral advertising. In the EU, informed consent is required for the placement of a cookie on a user’s device. The current EU laws that cover the use of cookies and similar technology and marketing online or by electronic means are under reform. A draft of the new ePrivacy Regulation was announced on January 10, 2017 and is targeted to become applicable on May 25, 2018 (alongside the GDPR). Unlike the current ePrivacy Directive, this will be directly implemented into the laws of each of the EU Member States, without the need for further enactment. When implemented, the ePrivacy Regulation is expected to alter rules on third-party cookies, web beacons and similar technology for online behavioral advertising and to impose stricter requirements on companies using these tools. The draft also extends the strict opt-in marketing rules with limited exceptions to business to business communications, and significantly increases penalties.
Any failure or perceived failure by us to comply with privacy or security laws, policies, legal obligations or industry standards or any security incident that results in the unauthorized release or transfer of personally identifiable information may result in governmental enforcement actions and investigations, fines and penalties, litigation and/or adverse publicity, including by consumer advocacy groups, and could cause our customers to lose trust in us, which could have an adverse effect on our reputation and business. Such failures could have a material adverse effect on our financial condition and operations. If the third parties we work with violate applicable laws, contractual obligations or suffer a security breach, such violations may also put us in breach of our obligations under privacy laws and regulations and/or could in turn have a material adverse effect on our business.
- 31 -
Table of Contents
Our business activities are subject to extensive regulation, and any failure to comply could have a materially adverse effect on our business, financial condition, or results of operations. We are subject to extensive U.S. federal, state, local and international regulations regarding our business activities. Failure to comply with these regulations could result in, among other things, recalls of our products, substantial fines and criminal charges against us or against our employees. Furthermore, our products could be subject to recall if the Food and Drug Administration, or the FDA, other regulators or we determine, for any reason, that our products are not safe or effective. Any recall or other regulatory action could increase our costs, damage our reputation, affect our ability to supply customers with the quantity of products they require and materially affect our operating results.
Actual or attempted breaches of security, unauthorized disclosure of information, denial of service attacks or the perception that personal and/or other sensitive or confidential information in our possession is not secure, could result in a material loss of business, substantial legal liability or significant harm to our reputation. We receive, collect, process, use and store a large amount of information from clients and our own employees, including personally identifiable, protected health and other sensitive and confidential information. This data is often accessed by us through transmissions over public and private networks, including the Internet. The secure transmission of such information over the Internet and other mechanisms is essential to maintain confidence in our information technology systems. We have implemented security measures, technical controls and contractual precautions designed to identify, detect and prevent unauthorized access, alteration, use or disclosure of our and our clients’ and employees’ data. However, there is no guarantee that these measures can provide absolute security. Beyond external criminal activity, systems that access or control access to our services and databases may be compromised as a result of human error, fraud or malice on the part of employees or third parties, or may result from accidental technological failure. Because the techniques used to circumvent security systems can be highly sophisticated and change frequently, often are not recognized until launched against a target and may originate from less regulated and remote areas around the world, we may be unable to proactively address all possible techniques or implement adequate preventive measures for all situations.
If someone is able to circumvent or breach our security systems, they could steal any information located therein or cause interruptions to our operations. Security breaches or attempts thereof could also damage our reputation and expose us to a risk of monetary loss and/or litigation, fines and sanctions. We also face risks associated with security breaches affecting third parties that conduct business with us or our clients and others who interact with our data. While we maintain insurance that covers certain security and privacy breaches, we may not carry appropriate insurance or maintain sufficient coverage to compensate for all potential liability.
We are subject to diverse laws and regulations relating to data privacy and security, including HIPAA and European data privacy laws. Complying with these numerous and complex regulations is expensive and difficult, and failure to comply with these regulations could result in regulatory scrutiny, fines and civil liability. In addition, any security breach or attempt thereof could result in liability for stolen assets or information, additional costs associated with repairing any system damage, incentives offered to clients or other business partners to maintain business relationships after a breach, and implementation of measures to prevent future breaches, including organizational changes, deployment of additional personnel and protection technologies, employee training and engagement of third-party experts and consultants. Furthermore, these rules are constantly changing; for example, as stated above, the EU-U.S. Safe Harbor Framework has been declared invalid and the EU-U.S. Privacy Shield Framework has recently been formally adopted by the European Commission. Additionally, the costs incurred to remediate any data security or privacy incident could be substantial.
- 32 -
Table of Contents
We cannot assure you that any of our third-party service providers with access to our or our clients and/or employees’ personally identifiable and other sensitive or confidential information will maintain appropriate policies and practices regarding data privacy and security in compliance with all applicable laws or that they will not experience data security breaches or attempts thereof, which could have a corresponding effect on our business.
Product sales, introductions or modifications may be delayed or canceled as a result of FDA regulations or similar foreign regulations, which could cause our sales and profits to decline. Unless a product is exempt, before we can market or sell a new medical device in the United States, we must obtain FDA clearance or approval, which can be a lengthy and time-consuming process. We generally receive clearance from the FDA to market our products in the United States under Section 510(k) of the Federal Food, Drug, and Cosmetic Act or our products are exempt from the Section 510(k) clearance process. The 510(k) clearance process can be expensive, time-consuming and uncertain. In the 510(k) clearance process, the FDA must determine that a proposed device is “substantially equivalent” to a device legally on the market, known as a “predicate” device, with respect to intended use, technology and safety and effectiveness, in order to clear the proposed device for marketing. The FDA has a high degree of latitude when evaluating submissions and may determine that a proposed device submitted for 510(k) clearance is not substantially equivalent to a predicate device. After a device receives 510(k) premarket notification clearance from the FDA, any modification that could significantly affect its safety or effectiveness, or that would constitute a major change in the intended use of the device, technology, materials, packaging, and certain manufacturing processes may require a new 510(k) clearance or premarket approval. We have modified some of our Section 510(k) approved products without submitting new Section 510(k) notices, which we do not believe were required. However, if the FDA disagrees with us and requires us to submit new Section 510(k) notifications for modifications to our existing products, we may be required to stop marketing the products while the FDA reviews the Section 510(k) notification.
Any new product introduction or existing product modification could be subjected to a lengthier, more rigorous FDA examination process. For example, in certain cases we may need to conduct clinical trials of a new product before submitting a 510(k) notice. We may also be required to obtain premarket approvals for certain of our products. Indeed, recent trends in the FDA’s review of premarket notification submissions suggest that the FDA is often requiring manufacturers to provide new, more expansive, or different information regarding a particular device than what the manufacturer anticipated upon 510(k) submission. This has resulted in increasing uncertainty and delay in the premarket notification review process.
For example, the FDA recently evaluated its guidance describing when it believes a manufacturer is obligated to submit a new 510(k) for modifications or changes to a previously cleared device. Although the FDA had proposed a number of changes to a long-standing guidance from 1997 on this topic, the FDA concluded that manufacturers should continue adhering to the principles in the 1997 guidance. In August 2016, the FDA issued a new draft guidance, which FDA believes preserves the basic format and content of the 1997 guidance with updates to add clarity. The FDA’s ongoing review of the 510(k) program may make it more difficult for us to make modifications to our previously cleared products, either by imposing more strict requirements on when a manufacturer must submit a new 510(k) for a modification to a previously cleared product, or by applying more onerous review criteria to such submissions. FDA continues to review its 510(k) clearance process which could result in additional changes to regulatory requirements or guidance documents which could increase the costs of compliance, or restrict our ability to maintain current clearances. The requirements of the more rigorous premarket approval process and/or significant changes to the 510(k) clearance process could delay product introductions and increase the costs associated with FDA compliance. Marketing and sale of our products outside the United States are also subject to regulatory clearances and approvals, and if we fail to obtain these regulatory approvals, our sales could suffer. We cannot assure you that any new products we develop will receive required regulatory approvals from U.S. or foreign regulatory agencies.
- 33 -
Table of Contents
We are subject to substantial regulation related to quality standards applicable to our manufacturing and quality processes. Our failure to comply with these standards could have an adverse effect on our business, financial condition, or results of operations. The FDA regulates the approval, manufacturing, and sales and marketing of many of our products in the U.S. Significant government regulation also exists in Canada, Japan, Europe, and other countries in which we conduct business. As a device manufacturer, we are required to register with the FDA and are subject to periodic inspection by the FDA for compliance with the FDA’s Quality System Regulation requirements, which require manufacturers of medical devices to adhere to certain regulations, including testing, quality control and documentation procedures. In addition, the federal Medical Device Reporting regulations require us to provide information to the FDA whenever there is evidence that reasonably suggests that a device may have caused or contributed to a death or serious injury or, if a malfunction were to occur, could cause or contribute to a death or serious injury. Compliance with applicable regulatory requirements is subject to continual review and is rigorously monitored through periodic inspections by the FDA. In the European Community, we are required to maintain certain ISO certifications in order to sell our products and must undergo periodic inspections by notified bodies to obtain and maintain these certifications. Failure to comply with current governmental regulations and quality assurance guidelines could lead to temporary manufacturing shutdowns, product recalls or related field actions, product shortages or delays in product manufacturing. Efficacy or safety concerns, an increase in trends of adverse events in the marketplace, and/or manufacturing quality issues with respect to our products could lead to product recalls or related field actions, withdrawals, and/or declining sales.
Laws regulating consumer contacts could adversely affect our business operations or create liabilities. Our business activities include contacts with consumers in different parts of the world. Certain laws, such as the U.S. Telephone Consumer Protection Act, regulate telemarketing practices and certain automated outbound contacts with consumers, such as phone calls, texts or emails. Our use of outbound contacts may be restricted by existing laws, or by laws, regulations, or regulatory decisions that may be adopted in the future. If we are found to have violated these laws or regulations, we may be subjected to substantial fines, penalties, or liabilities to consumers.
- 34 -
Table of Contents
Our products are the subject of clinical trials conducted by us, our competitors, or other third parties, the results of which may be unfavorable, or perceived as unfavorable, and could have a material adverse effect on our business, financial condition, and results of operations. As a part of the regulatory process to obtain marketing clearance for new products and new indications for existing products, or for other reasons, we conduct and participate in numerous clinical trials with a variety of study designs, patient populations, and trial endpoints. We, our competitors, or other third parties may also conduct clinical trials involving our commercially marketed products. The results of clinical trials may be unfavorable or inconsistent with previous findings, or could identify safety signals associated with our products. For example, in May 2015, we announced the preliminary analysis of the data from the SERVE-HF clinical trial, which was designed to assess whether the treatment of moderate to severe predominant central sleep apnea with Adaptive Servo-Ventilation, or ASV therapy could reduce mortality and morbidity in patients with symptomatic chronic heart failure. The preliminary headline results showed no significant difference with respect to all-cause mortality and hospitalization. However, the analysis of the data identified a statistically significant, 2.5% absolute, increased risk of cardiovascular mortality for those patients in the trial who received ASV therapy with moderate to severe predominant central sleep apnea and symptomatic chronic heart failure with reduced ejection fraction. We worked with global regulatory authorities to revise the labels and instructions for use for ResMed ASV devices as well as informing healthcare providers, physicians, and patients of the cardiovascular safety signal observed in SERVE-HF. Current or future clinical trials may not meet primary endpoints, may reveal disadvantages of our products and solutions for various markets we address, or could generate unfavorable or inconsistent clinical data. Clinical data, or the market’s or regulatory bodies’ perception of the clinical data, may adversely impact our ability to obtain product clearances or approvals, and our position in, and share of, the markets in which we participate. Moreover, if these clinical trials identify serious safety issues associated with our marketed products, potentially adverse consequences could result, including that regulatory authorities could withdraw clearances or approvals of our products, we could be required to halt the marketing and sales of our products or recall our products, we could be required to update our product labeling with additional warnings, we could be sued and held liable for harm caused to patients, and our reputation may suffer. Any of these could have a material adverse impact on our business, financial condition, and results of operations.
Off-label marketing of our products could result in substantial penalties. The FDA strictly regulates the promotional claims that may be made about FDA-cleared products. In particular, clearance under Section 510(k) only permits us to market our products for the uses indicated on the labeling cleared by the FDA. We may request additional label indications for our current products, and the FDA may deny those requests outright, require additional expensive clinical data to support any additional indications or impose limitations on the intended use of any cleared products as a condition of clearance. If the FDA determines that we have marketed our products for off-label use, we could be subject to fines, injunctions or other penalties. It is also possible that other federal, state or foreign enforcement authorities might take action if they consider our business activities to constitute promotion of an off-label use, which could result in significant penalties, including, but not limited to, criminal, civil and administrative penalties, damages, fines, disgorgement, exclusion from participation in government healthcare programs, and the curtailment of our operations. Any of these events could significantly harm our business and results of operations and cause our stock price to decline.
- 35 -
Table of Contents
Disruptions in the supply of components from our single source suppliers could result in a significant reduction in sales and profitability. We purchase uniquely configured components for our devices from various suppliers, including some who are single-source suppliers for us. We cannot assure you that a replacement supplier would be able to configure its components for our devices on a timely basis or, in the alternative, that we would be able to reconfigure our devices to integrate the replacement part. A reduction or halt in supply while a replacement supplier reconfigures its components, or while we reconfigure our devices for the replacement part, would limit our ability to manufacture our devices, which could result in a significant reduction in sales and profitability. We cannot assure you that our inventories would be adequate to meet our production needs during any prolonged interruption of supply.
We are subject to potential product liability claims that may exceed the scope and amount of our insurance coverage, which would expose us to liability for uninsured claims. We are subject to potential product liability claims as a result of the design, manufacture and marketing of medical devices. Any product liability claim brought against us, with or without merit, could result in the increase of our product liability insurance rates. In addition, we would have to pay any amount awarded by a court in excess of our policy limits. Our insurance policies have various exclusions, and thus we may be subject to a product liability claim for which we have no insurance coverage, in which case, we may have to pay the entire amount of any award. We cannot assure you that our insurance coverage will be adequate or that all claims brought against us will be covered by our insurance and we cannot assure you that we will be able to obtain insurance in the future on terms acceptable to us or at all. A successful product liability claim brought against us in excess of our insurance coverage, if any, may require us to pay substantial amounts, which could harm our business.
Our intellectual property may not protect our products, and/or our products may infringe on the intellectual property rights of third-parties. We rely on a combination of patents, trade secrets and non-disclosure agreements to protect our intellectual property. Our success depends, in part, on our ability to obtain and maintain United States and foreign patent protection for our products, their uses and our processes to preserve our trade secrets and to operate without infringing on the proprietary rights of third-parties. We have a number of pending patent applications, and we do not know whether any patents will issue from any of these applications. We do not know whether any of the claims in our issued patents or pending applications will provide us with any significant protection against competitive products or otherwise be commercially valuable. Legal standards regarding the validity of patents and the proper scope of their claims are still evolving, and there is no consistent law or policy regarding the valid breadth of claims. Additionally, there may be third-party patents, patent applications and other intellectual property relevant to our products and technology which are not known to us and that block or compete with our products. We face the risks that:
| • | third-parties will infringe our intellectual property rights; |
| • | our non-disclosure agreements will be breached; |
| • | we will not have adequate remedies for infringement; |
| • | our trade secrets will become known to or independently developed by our competitors; or |
| • | third-parties will be issued patents that may prevent the sale of our products or require us to license and pay fees or royalties in order for us to be able to market some of our products. |
- 36 -
Table of Contents
Litigation may be necessary to enforce patents issued to us, to protect our proprietary rights, or to defend third-party claims that we have infringed on proprietary rights of others. For example, we are involved in litigation with Fisher & Paykel HealthCare, which has sued us in the U.S. District Court for the Southern District of California for allegedly infringing various of their patents. Related cases are now pending in New Zealand, Germany and the United Kingdom. If the outcome of any litigation or proceeding brought against us were adverse, we could be subject to significant liabilities to third-parties, could be required to obtain licenses from third-parties, could be forced to design around the patents at issue or could be required to cease sales of the affected products. A license may not be available at all or on commercially viable terms, and we may not be able to redesign our products to avoid infringement. Additionally, the laws regarding the enforceability of patents vary from country to country, and we cannot assure you that any patent issues we face will be uniformly resolved, or that local laws will provide us with consistent rights and benefits.
Tax laws, regulations, and enforcement practices are evolving and may have a material adverse effect on our results of operations, cash flows and financial position. Tax laws, regulations, and administrative practices in various jurisdictions are evolving and may be subject to significant changes due to economic, political, and other conditions. There are many transactions that occur during the ordinary course of business for which the ultimate tax determination is uncertain, and significant judgment is required in evaluating and estimating our provision and accruals for taxes. Governments are increasingly focused on ways to increase tax revenues, particularly from multinational corporations, which may lead to an increase in audit activity and aggressive positions taken by tax authorities.
For example, the current U.S. administration and certain members of Congress have made public statements indicating that corporate tax reform is a priority. Changes to U.S. tax laws could materially affect the tax treatment of our domestic and foreign earnings. The Organisation for Economic Co-operation and Development, an international association of 34 countries, including the United States, released the final reports from its Base Erosion and Profit Shifting, or BEPS, Action Plans, which aim to standardize and modernize global tax policies. The BEPS Action Plans propose revisions to numerous tax rules, including country-by-country reporting, permanent establishment, hybrid entities and instruments, transfer pricing, and tax treaties. The BEPS Action Plans have been or are being enacted by countries where we have operations.
Developments in relevant tax laws, regulations, administrative practices and enforcement practices could have a material adverse effect on our operating results, financial position and cash flows, including the need to obtain additional financing.
We are subject to tax audits by various tax authorities in many jurisdictions. Our income tax returns are based on calculations and assumptions subject to audit by various tax authorities. In addition, the calculation of our tax liabilities involves dealing with uncertainties in the application of complex tax laws. We regularly assess the potential outcomes of examinations by tax authorities in determining the adequacy of our provision for income taxes. We are currently under audit by the Australian Taxation Office for the tax years 2009 to 2013. Although we do not believe that any material adjustments will result from this audit, the outcome of tax audits cannot be predicted with certainty. Any final assessment resulting from tax audits may result in material changes to our past or future taxable income, tax payable or deferred tax assets, and may require us to pay penalties and interest that could materially adversely affect our financial results.
- 37 -
Table of Contents
Our quarterly operating results are subject to fluctuation for a variety of reasons. Our operating results have, from time to time, fluctuated on a quarterly basis and may be subject to similar fluctuations in the future. These fluctuations may result from a number of factors, including:
| • | the introduction of new products by us or our competitors; |
| • | the geographic mix of product sales; |
| • | the success and costs of our marketing efforts in new regions; |
| • | changes in third-party payor reimbursement; |
| • | timing of regulatory clearances and approvals; |
| • | timing of orders by distributors; |
| • | expenditures incurred for research and development; |
| • | competitive pricing in different regions; |
| • | the effect of foreign currency transaction gains or losses; and |
| • | other activities of our competitors. |
Fluctuations in our quarterly operating results may cause the market price of our common stock to fluctuate.
If a natural or man-made disaster strikes our manufacturing facilities, we will be unable to manufacture our products for a substantial amount of time and our sales and profitability will decline. Our facilities and the manufacturing equipment we use to produce our products would be costly to replace and could require substantial lead-time to repair or replace. The facilities may be affected by natural or man-made disasters and in the event they were affected by a disaster, we would be forced to rely on third-party manufacturers. Although we believe we possess adequate insurance for the disruption of our business from causalities, such insurance may not be sufficient to cover all of our potential losses and may not continue to be available to us on acceptable terms, or at all.
Delaware law and provisions in our charter and could make it difficult for another company to acquire us. Provisions of our certificate of incorporation may have the effect of delaying or preventing changes in control or management which might be beneficial to us or our security holders. In particular, our board of directors is divided into three classes, serving for staggered three-year terms. Because of this classification, it will require at least two annual meetings to elect directors constituting a majority of our board of directors. Additionally, our board of directors has the authority to issue up to 2,000,000 shares of preferred stock and to determine the price, rights, preferences, privileges and restrictions, including voting rights, of those shares without further vote or action by the stockholders. The rights of the holders of our common stock will be subject to, and may be adversely affected by, the rights of the holders of any preferred stock that may be issued in the future. The issuance of preferred stock may have the effect of delaying, deferring or preventing a change in control, may discourage bids for our common stock at a premium over the market price of our common stock and may adversely affect the market price of our common stock and the voting and other rights of the holders of our common stock.
You may not be able to enforce the judgments of U.S. courts against some of our assets or officers and directors. A substantial portion of our assets are located outside the United States. Additionally, some of our directors and executive officers reside outside the United States, along with all or a substantial portion of their assets. As a result, it may not be possible for investors to enforce judgments of U.S. courts relating to any liabilities under U.S. securities laws against our assets, those persons or their assets. In addition, investors may not be able to pursue claims based on U.S. securities laws against these assets or these persons in Australian courts, where most of these assets and persons reside.
- 38 -
Table of Contents
We are increasingly dependent on information technology systems and infrastructure. Our technology systems are potentially vulnerable to breakdown or other interruption by fire, power loss, system malfunction, unauthorized access and other events. Likewise, data privacy breaches by employees and others with both permitted and unauthorized access to our systems may pose a risk that sensitive data may be exposed to unauthorized persons or to the public, or may be permanently lost. While we have invested heavily in the protection of data and information technology and in related training, there can be no assurance that our efforts will prevent significant breakdowns, breaches in our systems or other cyber incidents that could have a material adverse effect upon the reputation, business, operations or financial condition of the company. In addition, significant implementation issues may arise as we continue to consolidate and outsource certain computer operations and application support activities.
Our results of operations may be materially affected by global economic conditions generally, including conditions in the financial markets. Recently, concerns over inflation, energy costs, geopolitical issues, the availability and cost of credit, and the ability of sovereign nations to pay their debts have contributed to increased volatility and diminished expectations for the economy and the financial markets going forward. These factors, combined with volatile commodity prices, declining business and consumer confidence and increased unemployment, have precipitated an economic slowdown. It is difficult to predict how long the current economic conditions will continue and whether the economic conditions will continue to deteriorate. If the economic climate in the United States or outside the United States continues to deteriorate or there is a shift in government spending priorities, customers or potential customers could reduce or delay their purchases, which could impact our revenue, our ability to manage inventory levels, collect customer receivables, and ultimately decrease our profitability.
Our leverage and debt service obligations could adversely affect our business. As of June 30, 2017, our total consolidated debt was approximately $1.1 billion. We may incur additional indebtedness in the future. Our indebtedness could have adverse consequences, including:
| • | making it more difficult to satisfy our financial obligations; |
| • | increasing our vulnerability to adverse economic, regulatory and industry conditions |
| • | limiting our ability to compete and our flexibility in planning for, or reacting to, changes in our business and the industry in which we operate; |
| • | limiting our ability to borrow additional funds for working capital, capital expenditure, acquisitions and general corporate or other purposes; and |
| • | exposing us to greater interest rate risk. |
Our debt service obligations will require us to use a portion of our operating cash flow to pay interest and principal in indebtedness, which could impede our growth. Our ability to make payments on, and to refinance, our indebtedness, and to fund capital expenditures will depend on our ability to generate cash in the future. This is subject to general economic, financial, competitive, legislative, regulatory, and other factors, many of which are beyond our control.
We may write-off intangible assets, such as goodwill. We have recorded intangible assets, including goodwill in connection with our acquisitions of Brightree, Curative Medical and Inova Labs. At least on an annual basis, we will evaluate whether facts and circumstances indicate any impairment of the values of these intangible assets. As circumstances change, we cannot assure you that the value of these intangible assets will be realized by us. If we determine that a significant impairment has occurred, we will be required to write-off the impaired portion of intangible assets, which could have a material adverse effect on our results of operations in the period in which the write-off occurs.
- 39 -
Table of Contents
Before we acquired Brightree, Curative Medical and Inova Labs, those companies were each privately-held, and their new obligations of being a part of a public company may require significant resources and management attention. When we acquired Brightree, Curative Medical and Inova Labs, the acquired entities became subsidiaries of our consolidated company, and are now required to comply with the Sarbanes-Oxley Act of 2002 and the rules and regulations subsequently implemented by the SEC and the Public Company Accounting Oversight Board. We will need to ensure that each of the acquired companies establishes and maintains effective disclosure controls as well as internal controls and procedures for financial reporting, and such compliance efforts may be costly and may divert the attention of management.
| ITEM 1B | UNRESOLVED STAFF COMMENTS |
We have received no written comments regarding our periodic or current reports from the staff of the Securities and Exchange Commission that were issued 180 days or more before the end of our fiscal year 2017 that remain unresolved.
| ITEM 2 | PROPERTIES |
We conduct our operations in both owned and leased properties. Our principal executive offices and U.S. sales facilities, consist of approximately 230,000 square feet and are located on Spectrum Center Boulevard in San Diego, California, in a building we own. We have our primary research and development facilities, as well as office and manufacturing facilities at our owned site in Sydney, Australia. Other facilities are leased in Atlanta, Georgia, and Moreno Valley, California, U.S.A.; Loyang and Galaxais, Singapore; Munich, Germany; Lyon, France; Suzhou, China; and Johor Bahru, Malaysia.
- 40 -
Table of Contents
We believe that our facilities are adequate to meet the needs of our current business operations. At June 30, 2017, our principal owned and leased properties were as follows:
| Location | Ownership Status (Owned / Leased) |
Square footage | Primary Usage | |||||
| San Diego, California |
Owned | 230,000 | Corporate headquarters, sales and administration | |||||
| Sydney, Australia | Owned | 224,000 | Manufacturing, engineering, research and development | |||||
| Suzhou, China | Owned | 53,000 | Manufacturing, engineering, research and development | |||||
| Atlanta, Georgia | Leased | 508,000 | Manufacturing, warehouse and distribution, sales and administration, research and development | |||||
| Moreno Valley, California |
Leased | 130,000 | Warehouse and distribution | |||||
| Munich, Germany | Leased | 113,000 | Sales and distribution, research and development | |||||
| Loyang, Singapore | Leased | 95,000 | Manufacturing facility | |||||
| Chatsworth, California |
Leased | 72,000 | Motor manufacturing, engineering, research and development | |||||
| Lyon, France | Leased | 51,000 | Manufacturing, sales and distribution | |||||
| Johor Bahru, Malaysia |
Leased | 46,000 | Manufacturing facility | |||||
| Galaxais / Connexis, Singapore |
Leased | 16,000 | Engineering, research and development | |||||
| ITEM 3 | LEGAL PROCEEDINGS |
We are involved in various legal proceedings and claims. Litigation is inherently uncertain. Accordingly, we cannot predict the outcome of these matters. But we do not expect the outcome of these matters to have a material adverse effect on our consolidated financial statements when taken as a whole.
Fisher & Paykel Healthcare patent litigation. ResMed and Fisher & Paykel Healthcare are engaged in patent disputes in several global forums. Court cases related to the disputes are now pending in the United States, New Zealand, Germany and the United Kingdom. ResMed and Fisher & Paykel have also filed proceedings in patent offices in the United States, Germany and Europe to invalidate many of the patents being asserted against that party.
Administrative subpoenas. In July 2016, we received a federal administrative subpoena from the OIG of the Department of Health and Human Services. The subpoena contained a request for documents and other materials that relate primarily to industry offerings of patient resupply software to home medical equipment providers. In November 2016, we received a second subpoena, requesting documents and other materials regarding other promotional programs. We are cooperating with the government’s requests for documents and information.
- 41 -
Table of Contents
| ITEM 4 | MINE SAFETY DISCLOSURES |
Not Applicable.
- 42 -
Table of Contents
PART II
| ITEM 5 | MARKET FOR REGISTRANT’S COMMON EQUITY, RELATED STOCKHOLDER MATTERS AND ISSUER PURCHASES OF EQUITY SECURITIES |
Our common stock is traded on the NYSE under the symbol “RMD”. The following table sets forth for the fiscal periods indicated the high and low closing prices for the common stock as reported by the NYSE.
| 2017 | 2016 | |||||||||||||||
| High | Low | High | Low | |||||||||||||
| Quarter One, Ended September 30 |
$ | 70.90 | $ | 62.96 | $ | 57.95 | $ | 49.43 | ||||||||
| Quarter Two, Ended December 31 |
65.58 | 56.59 | 60.02 | 51.25 | ||||||||||||
| Quarter Three, Ended March 31 |
73.46 | 61.22 | 60.36 | 51.40 | ||||||||||||
| Quarter Four, Ended June 30 |
79.44 | 67.04 | 64.08 | 55.64 | ||||||||||||
At July 28, 2017, there were 20 holders of record of our common stock, although many of these holders of record own shares as nominees on behalf of other beneficial owners. During fiscal years 2017 and 2016, we paid dividends totaling $186.3 million and $168.1 million, respectively. On August 1, 2017, we announced an increase in the quarterly dividend from $0.33 per share to $0.35 per share. We pay the dividend in U.S. currency to holders of our common stock trading on the NYSE. Holders of CDIs trading on the ASX will receive an equivalent amount in Australian currency based on the exchange rate on the record date and reflecting the 10:1 ratio between CDIs and of common stock traded on the NYSE. We expect the dividend will continue to be unfranked for Australian tax purposes. We expect to fund our dividend commitments with our operating cash flows and existing loan facilities.
Securities Authorized for Issuance Under Equity Compensation Plans
The information included under Item 12 of Part III of this Report, “Security Ownership of Certain Beneficial Owners and Management and Related Stockholder Matters,” is hereby incorporated by reference into this Item 5 of Part II of this Report.
Purchases of Equity Securities
On February 21, 2014, our board of directors approved or current share repurchase program, authorizing us to acquire up to an aggregate of 20 million shares of our common stock. The program allows us to repurchase shares of our common stock from time to time for cash in the open market, or in negotiated or block transactions, as market and business conditions warrant and subject to applicable legal requirements. There is no expiration date for this program, and the program may be accelerated, suspended, delayed or discontinued at any time at the discretion of our board of directors. We temporarily suspended our share repurchase program due to recent acquisitions. However, we expect to resume the share repurchase program during fiscal year 2018. All share repurchases after February 21, 2014 have been executed under this program. During all of our share buyback programs, we have repurchased an aggregate of 41.1 million shares at a total cost of $1.5 billion.
- 43 -
Table of Contents
PERFORMANCE GRAPH
This performance graph is furnished and shall not be deemed “filed” with the SEC or subject to Section 18 of the Exchange Act, nor shall it be deemed incorporated by reference in any of our filings under the Securities Act of 1933, as amended.
The following graph compares the cumulative total stockholders return on our common stock from June 30, 2012 through June 30, 2017, with the comparable cumulative return of the S&P 500 index, the S&P 500 Health Care index, and the Dow Jones U.S. Medical Devices index. The graph assumes that $100 was invested in our common stock and each index on June 30, 2012. In addition, the graph assumes the reinvestment of all dividends paid. The stock price performance on the following graph is not necessarily indicative of future stock price performance.
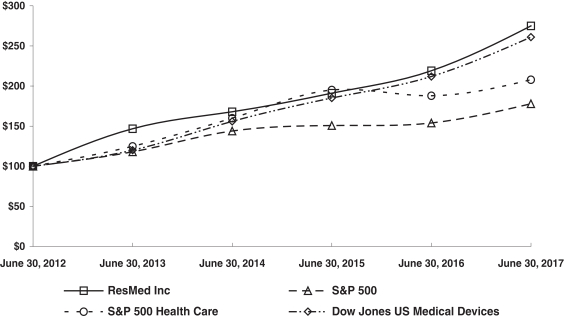
The following table shows total indexed return of stock price plus reinvestments of dividends, assuming an initial investment of $100 at June 30, 2012, for the indicated periods.
| Index | June 2012 | June 2013 | June 2014 | June 2015 | June 2016 | June 2017 | ||||||||||||||||||
| ResMed Inc. |
100 | 147 | 168 | 191 | 219 | 275 | ||||||||||||||||||
| S&P 500 |
100 | 118 | 144 | 151 | 154 | 178 | ||||||||||||||||||
| S&P 500 Health Care |
100 | 125 | 160 | 195 | 188 | 208 | ||||||||||||||||||
| Dow Jones U.S. Medical Devices |
100 | 120 | 156 | 185 | 212 | 261 | ||||||||||||||||||
- 44 -
Table of Contents
| ITEM 6 | SELECTED FINANCIAL DATA |
The following table summarizes certain selected consolidated financial data for, and as of the end of, each of the fiscal years in the five-year period ended June 30, 2017. The data set forth below should be read together with Item 7 of Part II of this annual report, “Management’s Discussion and Analysis of Financial Condition and Results of Operations” and Item 8 of Part II of this annual report, “Consolidated Financial Statements and Supplementary Data”, and related Notes included elsewhere in this annual report. The consolidated statement of income data for the years ended June 30, 2017, 2016 and 2015 and the consolidated balance sheet data as of June 30, 2017 and 2016 are derived from our audited consolidated financial statements included elsewhere in this annual report. The consolidated statement of income data for the years ended June 30, 2014 and 2013 and the consolidated balance sheet data as of June 30, 2015, 2014 and 2013 are derived from our audited consolidated financial statements. Historical results do not necessarily indicate the results to be expected in the future, and the results for the years presented should not be considered to indicate our future results of operations.
| Consolidated Statement of Income Data | Years Ended June 30, | |||||||||||||||||||
| (In thousands, except per share data): | 2017 | 2016 | 2015 | 2014 | 2013 | |||||||||||||||
| Net revenues |
$ | 2,066,737 | $ | 1,838,713 | $ | 1,678,912 | $ | 1,554,973 | $ | 1,514,457 | ||||||||||
| Cost of sales (excluding amortization of acquired intangible assets) | 864,992 | 772,216 | 667,516 | 565,187 | 573,800 | |||||||||||||||
| Gross profit |
1,201,745 | 1,066,497 | 1,011,396 | 989,786 | 940,657 | |||||||||||||||
| Selling, general and administrative expenses | 553,968 | 488,057 | 478,627 | 450,414 | 430,802 | |||||||||||||||
| Research and development expenses | 144,467 | 118,651 | 114,865 | 118,226 | 120,124 | |||||||||||||||
| Restructuring expenses | 12,358 | 6,914 | - | 6,326 | - | |||||||||||||||
| Education, research and settlement charge | 8,500 | - | - | - | 24,765 | |||||||||||||||
| Acquisition related expenses | 10,076 | - | - | - | - | |||||||||||||||
| Amortization of acquired intangible assets | 46,578 | 23,923 | 8,668 | 9,733 | 10,142 | |||||||||||||||
| Total operating expenses |
775,947 | 637,545 | 602,160 | 584,699 | 585,833 | |||||||||||||||
| Income from operations |
425,798 | 428,952 | 409,236 | 405,087 | 354,824 | |||||||||||||||
| Other income: |
||||||||||||||||||||
| Interest income, net |
(11,151 | ) | 5,654 | 20,430 | 25,107 | 32,486 | ||||||||||||||
| Other, net |
4,096 | 4,960 | 6,250 | 884 | (2,191 | ) | ||||||||||||||
| Total other income, net |
(7,055 | ) | 10,614 | 26,680 | 25,991 | 30,295 | ||||||||||||||
| Income before income taxes |
418,743 | 439,566 | 435,916 | 431,078 | 385,119 | |||||||||||||||
| Income taxes |
76,459 | 87,157 | 83,030 | 85,805 | 77,986 | |||||||||||||||
| Net income |
$ | 342,284 | $ | 352,409 | $ | 352,886 | $ | 345,273 | $ | 307,133 | ||||||||||
| Basic earnings per share |
$ | 2.42 | $ | 2.51 | $ | 2.51 | $ | 2.44 | $ | 2.15 | ||||||||||
| Diluted earnings per share |
$ | 2.40 | $ | 2.49 | $ | 2.47 | $ | 2.39 | $ | 2.10 | ||||||||||
| Dividends per share |
$ | 1.32 | $ | 1.20 | $ | 1.12 | $ | 1.00 | $ | 0.68 | ||||||||||
| Weighted average: |
||||||||||||||||||||
| Basic shares outstanding |
141,360 | 140,242 | 140,468 | 141,474 | 142,954 | |||||||||||||||
| Diluted shares outstanding |
142,453 | 141,669 | 142,687 | 144,359 | 146,410 | |||||||||||||||
- 45 -
Table of Contents
| Consolidated Balance Sheet Data | As of June 30, | |||||||||||||||||||
| (In thousands): | 2017 | 2016 | 2015 | 2014 | 2013 | |||||||||||||||
| Working capital |
$ | 1,283,877 | $ | 781,730 | $ | 1,141,381 | $ | 1,286,651 | $ | 874,800 | ||||||||||
| Total assets |
3,468,487 | 3,256,705 | 2,181,774 | 2,360,962 | 2,210,721 | |||||||||||||||
| Long-term debt, less current maturities |
1,078,611 | 873,332 | 300,594 | 300,770 | 769 | |||||||||||||||
| Total stockholders’ equity |
$ | 1,960,266 | $ | 1,694,831 | $ | 1,587,307 | $ | 1,758,248 | $ | 1,610,516 | ||||||||||
- 46 -
Table of Contents
| ITEM 7 | MANAGEMENT’S DISCUSSION AND ANALYSIS OF FINANCIAL CONDITION AND RESULTS OF OPERATIONS |
Overview
Management’s discussion and analysis of financial condition and results of operations is intended to help the reader understand the results of operations and financial condition of ResMed Inc. and subsidiaries. It is provided as a supplement to, and should be read together with the selected financial data and consolidated financial statements and notes included elsewhere in this report.
We are a leading developer, manufacturer and distributor of medical equipment for treating, diagnosing, and managing SDB and other respiratory disorders. During the fiscal year, we continued our efforts to build awareness of the consequences of untreated SDB and to grow our business in this market. In our efforts, we have attempted to raise awareness through market and clinical initiatives and by highlighting the increasing link between the potential effects SDB can have on co-morbidities such as cardiac disease, diabetes, hypertension and obesity.
We are committed to ongoing investment in research and development and product enhancements. During fiscal year 2017, we invested approximately $144.5 million on research and development activities, which represents approximately 7.0% of net revenues. Since the development of CPAP, we have developed a number of innovative products for the treatment of SDB and other respiratory disorders including devices, informatics solutions, diagnostic products, mask systems, headgear and other accessories. During fiscal year 2017, we released new products including the AirMini PAP device, AirFit mask range and AirTouch masks. We also introduced a number of new software solutions including our ResMed Resupply, GoScripts and new features and enhancements within our cloud-based software offerings. Through our acquisition of Brightree in 2016, we also acquired a suite of software-as-a-service solutions for U.S. based distributors and home health and hospice customers. These products, our cloud-based remote monitoring and therapy management system, and a robust product pipeline, should continue to provide us with a strong platform for future growth.
Net revenue in fiscal year 2017 increased to $2,066.7 million, an increase of 12% compared to fiscal year 2016. Gross profit increased for the year ended June 30, 2017 to $1,201.7 million, from $1,066.5 million for the year ended June 30, 2016, an increase of $135.2 million or 13%. Our net income for the year ended June 30, 2017 was $342.3 million or $2.40 per diluted share compared to net income of $352.4 million or $2.49 per diluted share for the year ended June 30, 2016.
Total operating cash flow for fiscal year 2017 was $414.1 million and at June 30, 2017, our cash and cash equivalents totaled $821.9 million. At June 30, 2017, our total assets were $3.5 billion and our stockholders’ equity was $2.0 billion. We temporarily suspended our share repurchase program due to the acquisitions completed in fiscal year 2016. Accordingly, we did not purchase any shares during fiscal year 2017. During fiscal year 2016, we repurchased 1.9 million shares at a cost of $102.1 million under our share repurchase program. We paid a quarterly dividend of $0.33 per share during fiscal 2017 with a total amount of $186.3 million paid to stockholders.
In order to provide a framework for assessing how our underlying businesses performed, excluding the effect of foreign currency fluctuations, we provide certain financial information on a “constant currency basis”, which is in addition to the actual financial information presented. In order to calculate our constant currency information, we translate the current period financial information using the foreign currency exchange rates that were in effect during the previous comparable period. However, constant currency measures should not be considered in isolation or as an alternative to U.S. dollar measures that reflect current period exchange rates, or to other financial measures calculated and presented in accordance with U.S. generally accepted accounting principles.
- 47 -
Table of Contents
Fiscal Year Ended June 30, 2017 Compared to Fiscal Year Ended June 30, 2016
Net Revenues. Net revenue for the year ended June 30, 2017 increased to $2,066.7 million from $1,838.7 million for the year ended June 30, 2016, an increase of $228.0 million or 12% (a 13% increase on a constant currency basis). Net revenue for the year ended June 30, 2017 includes revenue of $138.1 million from our Brightree’s operations. Excluding revenue attributable to Brightree, net revenue for the year ended June 30, 2017 was $1,928.7 million, an increase of $118.9 million or 7% compared to the year ended June 30, 2016 (an 8% increase on a constant currency basis). The increase in net revenue was attributable to an increase in unit sales of our devices, masks and accessories, partially offset by a decline in average selling prices. Movements in international currencies against the U.S. dollar negatively impacted net revenues by approximately $17.2 million for the year ended June 30, 2017.
Net revenue in North and Latin America for the year ended June 30, 2017 increased to $1,310.1 million from $1,130.4 million for the year ended June 30, 2016, an increase of $179.7 million or 16%. Excluding revenue attributable to Brightree, net revenue in North and Latin America increased for the year ended June 30, 2017 to $1,172.1 million, an increase of $70.5 million or 6%. The increase in net revenue in North and Latin America, excluding revenue attributable to Brightree, is primarily due to an increase in unit sales of our devices, masks and accessories, partially offset by a decline in average selling prices.
Net revenue in markets outside North and Latin America increased for the year ended June 30, 2017 to $756.6 million from $708.3 million for the year ended June 30, 2016, an increase of $48.3 million or 7% (a 9% increase on a constant currency basis). The constant currency increase in sales outside North and Latin America predominantly reflects an increase in unit sales of our devices, masks and accessories, partially offset by a decline in average selling prices.
Net revenue from devices for the year ended June 30, 2017 increased to $1,161.0 million from $1,064.2 million for the year ended June 30, 2016, an increase of $96.8 million or 9%, including an increase of 9% in North and Latin America and an increase of 10% outside North and Latin America (a 12% increase on a constant currency basis). Net revenue from masks and other accessories for the year ended June 30, 2017 increased to $767.7 million from $745.6 million for the year ended June 30, 2016, an increase of 3%, including an increase of 4% in North and Latin America and an increase of 1% outside North and Latin America (a 4% increase on a constant currency basis). Excluding the impact of foreign currency movements, device sales for the year ended June 30, 2017 increased by 10%, and masks and accessories sales increased by 4%, compared to the year ended June 30, 2016.
The following table summarizes the percentage movements in our net revenue, excluding revenue attributable to Brightree following the closing of our acquisition, for the year ended June 30, 2017 compared to the year ended June 30, 2016:
| North and Latin America |
Markets outside North and Latin America |
Total | Markets outside North and Latin America (Constant Currency)* |
Total (Constant Currency)* |
||||||||||||||||
| Devices |
9 | % | 10 | % | 9 | % | 12 | % | 10 | % | ||||||||||
| Masks and other accessories |
4 | % | 1 | % | 3 | % | 4 | % | 4 | % | ||||||||||
|
Total |
6 | % | 7 | % | 7 | % | 9 | % | 8 | % | ||||||||||
* Constant currency numbers exclude the impact of movements in international currencies.
- 48 -
Table of Contents
Gross Profit. Gross profit increased for the year ended June 30, 2017 to $1,201.7 million from $1,066.5 million for the year ended June 30, 2016, an increase of $135.2 million or 13%. Gross profit as a percentage of net revenue was 58.1% for the year ended June 30, 2017, compared with the 58.0% for the year ended June 30, 2016. The increase in gross margin was due primarily to manufacturing and procurement efficiencies, and an incremental contribution from the Brightree acquisition, partly offset by declines in our average selling prices and unfavorable product mix as sales of our lower margin products represented a higher proportion of our sales.
Selling, General and Administrative Expenses. Selling, general and administrative expenses increased for the year ended June 30, 2017 to $554.0 million from $488.1 million for the year ended June 30, 2016, an increase of $65.9 million or 14%. The selling, general and administrative expenses, as reported in U.S. dollars, were favorably impacted by the movement of international currencies against the U.S. dollar, which decreased our expenses by approximately $1.2 million. Excluding the impact of foreign currency movements, selling, general and administrative expenses for the year ended June 30, 2017 increased by 14% compared to the year ended June 30, 2016. As a percentage of net revenue, selling, general and administrative expenses for the year ended June 30, 2017 were 26.8%, compared to 26.5% for the year ended June 30, 2016.
The increase in selling, general and administrative expenses was primarily due to additional personnel to support our commercial activities, increased legal expenses, increased professional fees and additional expenses associated with the consolidation of recent acquisitions.
Research and Development Expenses. Research and development expenses increased for the year ended June 30, 2017 to $144.5 million from $118.7 million for the year ended June 30, 2016, an increase of $25.8 million or 22%. The research and development expenses were unfavorably impacted by the appreciation of the Australian dollar against the U.S. dollar, which increased our expenses by approximately $3.7 million, as reported in U.S. dollars. Excluding the impact of foreign currency movements, research and development expenses for the year ended June 30, 2017 increased by 19% compared to the year ended June 30, 2016. As a percentage of net revenue, research and development expenses were 7.0% for the year ended June 30, 2017 compared to 6.5% for the year ended June 30, 2016.
The increase in research and development expenses in constant currency terms was primarily due to an increase in the number of research and development personnel, an increase in materials and tooling costs incurred to facilitate development of new products and additional expenses associated with the consolidation of recent acquisitions.
Restructuring expenses. During the year ended June 30, 2017, we incurred restructuring expenses of $12.4 million associated with the reorganization of our Paris manufacturing activities and German research and development activities. The restructuring expenses consisted primarily of severance payments to employees in our German and Paris facilities, site closure costs and associated project cancellation costs. We recorded the full amount of $12.4 million during the year ended June 30, 2017, within our operating expenses and separately disclosed the amount as restructuring expenses and had $6.5 million remaining in our employee related costs accrual at year end. During the year ended June 30, 2016, we incurred restructuring expenses of $6.9 million associated with the rationalizing our European research and development operations and manufacturing facilities. The restructuring expenses consisted primarily of severance payments and an asset write-down of a legacy manufacturing facility.
Amortization of Acquired Intangible Assets. Amortization of acquired intangible assets for the year ended June 30, 2017 totaled $46.6 million compared to $23.9 million for the year ended June 30, 2016. The increase in amortization expense was attributable to our acquisitions from the prior year, in particular Brightree, Curative Medical and Inova Labs.
- 49 -
Table of Contents
Total other income (loss), net. Total other income (loss), net for the year ended June 30, 2017 was a loss of $7.1 million, compared with an income of $10.6 million for the year ended June 30, 2016. The change was due primarily to an increase in interest expense due to higher borrowings.
Income Taxes. Our effective income tax rate decreased to 18.3% for the year ended June 30, 2017 from 19.8% for the year ended June 30, 2016. Our effective income tax rate is affected by the geographic mix of our taxable income, including lower taxes associated with our Singapore and Malaysia manufacturing operations. Our Singapore and Malaysia operations operate under certain tax holidays and tax incentive programs which will expire in whole or in part at various dates through June 30, 2020. As of June 30, 2017, we have not provided for U.S. income taxes for the undistributed earnings of our foreign subsidiaries. We intend for these earnings to be permanently reinvested outside the United States.
Net Income and Earnings per Share. As a result of the factors above, our net income for the year ended June 30, 2017 was $342.3 million compared to net income of $352.4 million for the year ended June 30, 2016. Our earnings per diluted share for the year ended June 30, 2017 was $2.40 compared to $2.49 for the year ended June 30, 2016, a decrease of 4%.
Fiscal Year Ended June 30, 2016 Compared to Fiscal Year Ended June 30, 2015
Net Revenues. Net revenue for the year ended June 30, 2016 increased to $1,838.7 million from $1,678.9 million for the year ended June 30, 2015, an increase of $159.8 million or 10% (a 13% increase on a constant currency basis). Net revenue for the year ended June 30, 2016 includes revenue of $28.9 million from Brightree’s operations since the closing of our acquisition of Brightree. Excluding revenue attributable to Brightree, net revenue for the year ended June 30, 2016 was $1,809.8 million, an increase of $130.9 million or 8% compared to the year ended June 30, 2015 (an 11% increase on a constant currency basis). The increase in net revenue was attributable to an increase in unit sales of our devices, masks and accessories, partially offset by a decline in average selling prices. Movements in international currencies against the U.S. dollar negatively impacted net revenues by approximately $55.6 million for the year ended June 30, 2016.
Net revenue in North and Latin America for the year ended June 30, 2016 increased to $1,130.4 million from $962.7 million for the year ended June 30, 2015, an increase of $167.7 million or 17%. Excluding revenue attributable to Brightree, net revenue in North and Latin America increased for the year ended June 30, 2016 to $1,101.5 million, an increase of $138.8 million or 14%. The increase in net revenue in North and Latin America, excluding revenue attributable to Brightree, is primarily due to an increase in unit sales of our devices, masks and accessories, partially offset by a decline in average selling prices.
Net revenue in markets outside North and Latin America decreased for the year ended June 30, 2016 to $708.3 million from $716.2 million for the year ended June 30, 2015, a decrease of $7.9 million or 1% (a 6% increase on a constant currency basis). The constant currency increase in sales outside North and Latin America predominantly reflects an increase in unit sales of our devices, masks and accessories, partially offset by a decline in average selling prices.
Net revenue from devices for the year ended June 30, 2016 increased to $1,064.2 million from $975.9 million for the year ended June 30, 2015, an increase of $88.3 million or 9%, including an increase of 19% in North and Latin America and a decrease of 1% outside North and Latin America (a 6% increase on a constant currency basis). Net revenue from masks and other accessories for the year ended June 30, 2016 increased to $745.6 million from $703.0 million for the year ended June 30, 2015, an increase of 6%, including an increase of 10% in North and Latin America and a decrease of 2% outside North and Latin America (a 5% increase on a constant currency basis). Excluding the impact of foreign currency movements, device sales for the year ended June 30, 2016 increased by 13%, and masks and accessories sales increased by 9%, compared to the year ended June 30, 2015.
- 50 -
Table of Contents
The following table summarizes the percentage movements in our net revenue, excluding revenue attributable to Brightree following the closing of our acquisition, for the year ended June 30, 2016 compared to the year ended June 30, 2015:
| North and Latin America |
Markets outside North and Latin America |
Total | Markets outside North and Latin America (Constant Currency)* |
Total (Constant |
||||||||||||||||
| Devices |
19 | % | -1 | % | 9 | % | 6 | % | 13 | % | ||||||||||
| Masks and other accessories |
10 | % | -2 | % | 6 | % | 5 | % | 9 | % | ||||||||||
|
Total |
14 | % | -1 | % | 8 | % | 6 | % | 11 | % | ||||||||||
* Constant currency numbers exclude the impact of movements in international currencies.
Gross Profit. Gross profit increased for the year ended June 30, 2016 to $1,066.5 million from $1,011.4 million for the year ended June 30, 2015, an increase of $55.1 million or 5%. Gross profit as a percentage of net revenue was 58.0% for the year ended June 30, 2016, compared with the 60.2% for the year ended June 30, 2015. The decline in gross margins was primarily due to an unfavorable product mix as sales of our lower margin products represented a higher proportion of our sales, declines in our average selling prices and an unfavorable geographic mix with sales in our lower margin geographic areas representing a higher proportion of our overall sales.
Selling, General and Administrative Expenses. Selling, general and administrative expenses increased for the year ended June 30, 2016 to $488.1 million from $478.6 million for the year ended June 30, 2015, an increase of $9.4 million or 2%. The selling, general and administrative expenses, as reported in U.S. dollars, were favorably impacted by the movement of international currencies against the U.S. dollar, which decreased our expenses by approximately $25.6 million. Excluding the impact of foreign currency movements, selling, general and administrative expenses for the year ended June 30, 2016 increased by 7% compared to the year ended June 30, 2015. As a percentage of net revenue, selling, general and administrative expenses for the year ended June 30, 2016 was 26.5%, compared to 28.5% for the year ended June 30, 2015.
The increase in selling, general and administrative expenses was primarily due to additional personnel to support our commercial activities, increased legal expenses, acquisition expenses and incremental expenses due to the inclusion of our recent business acquisitions.
Research and Development Expenses. Research and development expenses increased for the year ended June 30, 2016 to $118.7 million from $114.9 million for the year ended June 30, 2015, an increase of $3.8 million or 3%. The research and development expenses were favorably impacted by the depreciation of the Australian dollar and Euro against the U.S. dollar, which decreased our expenses by approximately $13.9 million, as reported in U.S. dollars. Excluding the impact of foreign currency movements, research and development expenses for the year ended June 30, 2016 increased by 15% compared to the year ended June 30, 2015. As a percentage of net revenue, research and development expenses were 6.5% for the year ended June 30, 2016 compared to 6.8% for the year ended June 30, 2015.
The increase in research and development expenses in constant currency terms was primarily due to an increase in the number of research and development personnel, an increase in materials and tooling costs incurred to facilitate development of new products and additional expenses associated with the consolidation of recent acquisitions.
- 51 -
Table of Contents
Restructuring expenses. During the year ended June 30, 2016 we incurred restructuring expenses of $6.9 million associated with rationalizing our European research & development operations and manufacturing facilities. The restructure cost consisted primarily of severance payments and an asset write-down of a legacy manufacturing facility.
Amortization of Acquired Intangible Assets. Amortization of acquired intangible assets for the year ended June 30, 2016 totaled $23.9 million compared to $8.7 million for the year ended June 30, 2015. The increase in amortization expense was attributable to our acquisitions during the year, in particular Brightree, Curative Medical and Inova Labs.
Total other income, net. Total other income, net for the year ended June 30, 2016 was $10.6 million, compared with $26.7 million for the year ended June 30, 2015. The decrease in total other income, net, was due primarily to lower interest income resulting from lower interest rates on cash balances held, an increase in interest expense due to higher borrowings and reduced foreign currency hedging gains due to the depreciation of the Australian dollar against the U.S. dollar and Euro.
Income Taxes. Our effective income tax rate increased to 19.8% for the year ended June 30, 2016 from 19.0% for the year ended June 30, 2015. During the year ended June 30, 2016, we adopted the new accounting standard, ASU 2016-09 “Improvements to Employee Share-Based Payment Accounting”. As a result of adopting this standard, we recognized a tax benefit of $11.2 million. The impact of this tax benefit was offset by an additional tax expense relating to an increase in our foreign cash repatriation to the U.S. Our effective income tax rate is affected by the geographic mix of our taxable income, including lower taxes associated with our Singapore and Malaysia manufacturing operations. Our Singapore and Malaysia operations operate under certain tax holidays and tax incentive programs which will expire in whole or in part at various dates through June 30, 2020. As of June 30, 2016, we have not provided for U.S. income taxes for the undistributed earnings of our foreign subsidiaries. We intend for these earnings to be permanently reinvested outside the United States.
Net Income and Earnings per Share. As a result of the factors above, our net income for the year ended June 30, 2016 was $352.4 million compared to net income of $352.9 million for the year ended June 30, 2015. As a result of lower share count due to our stock repurchases during the year ended June 30, 2016, our earnings per share for the year ended June 30, 2016 was $2.49 per diluted share compared to $2.47 per diluted share for the year ended June 30, 2015, an increase of 1% over the year ended June 30, 2015.
Liquidity and Capital Resources
As of June 30, 2017 and June 30, 2016, we had cash and cash equivalents of $821.9 million and $731.4 million, respectively. Working capital was $1.3 billion and $0.8 billion, at June 30, 2017 and June 30, 2016, respectively. As of June 30, 2017, we had $1.1 billion of borrowings under our revolving credit facility agreement.
As of June 30, 2017 and June 30, 2016, our cash and cash equivalent balances held within the United States amounted to $23.2 million and $40.9 million, respectively. Our remaining cash and cash equivalent balances at June 30, 2017 and June 30, 2016, of $798.7 million and $690.5 million, respectively, were held by our non-U.S. subsidiaries, indefinitely invested outside the United States. Our cash and cash equivalent balances are held at highly rated financial institutions.
- 52 -
Table of Contents
As of June 30, 2017, the cumulative amount of undistributed earnings from our foreign subsidiaries was approximately $1.5 billion, and those undistributed earnings are considered permanently reinvested. We intend to reinvest the cash and cash equivalents of those entities whose undistributed earnings are permanently reinvested in our international operations. We reassess our reinvestment intentions each reporting period and currently believe that we have sufficient sources of liquidity to support our assertion that the undistributed earnings held by foreign subsidiaries may be considered to be reinvested permanently. If these earnings had not been permanently reinvested, deferred taxes of approximately $358 million would have been recognized in our consolidated financial statements.
We repatriated $215 million and $190 million to the U.S. in fiscal years 2017 and 2016, respectively, from earnings generated in each of those years. The amount of the current year foreign earnings that we have repatriated to the U.S. in the past has been determined, and the amount that we expect to repatriate during fiscal year 2018 will be determined, based on a variety of factors, including current year earnings of our foreign subsidiaries, foreign investment needs and the cash flow needs we have in the U.S., such as for the repayment of debt, dividend distributions, and other domestic obligations. The majority of our repatriation of foreign subsidiaries’ earnings to the U.S. has historically occurred at year-end, although we may repatriate funds earlier in the year based on our business needs, as we did during the year ended June 30, 2017. When we repatriate funds to the U.S., we are required to pay taxes in the U.S. on these amounts based on applicable U.S. tax rates, net of any foreign tax that would be allowed to be deducted or taken as a credit against U.S. income tax. We paid $24.6 million and $34.2 million in additional U.S. federal income taxes in fiscal years 2017 and 2016, respectively, as a result of repatriation of foreign earnings generated in those years.
Inventories at June 30, 2017 increased by $43.9 million or 20% to $268.3 million compared to June 30, 2016 inventories of $224.5 million. The increase in inventories was required to support our revenue growth and new product introductions.
Accounts receivable, net of allowance for doubtful accounts, at June 30, 2017 were $450.5 million, an increase of $68.4 million or 18% over the June 30, 2016 accounts receivable balance of $382.1 million. Accounts receivable days sales outstanding of 68 days at June 30, 2017 increased by 5 days compared to 63 days at June 30, 2016. Our allowance for doubtful accounts as a percentage of total accounts receivable at June 30, 2017 and 2016 was 2.4% and 3.2%, respectively. We believe the credit quality of our customers remains broadly consistent with our past experience.
During the year ended June 30, 2017, we generated cash of $414.1 million from operations. This was lower than the cash generated from operations for the year ended June 30, 2016 of $547.9 million, which was primarily due to the increase in accounts receivable and corporate income tax payments. Movements in foreign currency exchange rates during the year ended June 30, 2017 had the effect of increasing our cash and cash equivalents by $21.2 million, as reported in U.S. dollars. During fiscal year 2016, we temporarily suspended our share repurchase program due to acquisitions. Accordingly, we did not purchase any shares during fiscal year 2017. During fiscal year 2016, we repurchased 1.9 million shares at a cost of $102.1 million. During fiscal years 2017 and 2016, we also paid dividends totaling $186.3 million and $168.1 million, respectively.
- 53 -
Table of Contents
Details of contractual obligations at June 30, 2017 are as follows (in thousands):
| Payments Due by Fiscal Year | ||||||||||||||||||||||||||||
| In $000’s | Total | 2018 | 2019 | 2020 | 2021 | 2022 | Thereafter | |||||||||||||||||||||
| Long Term Debt | $ | 1,080,000 | $ | - | $ | 1,080,000 | $ | - | $ | - | $ | - | $ | - | ||||||||||||||
| Interest on Long Term Debt | 39,843 | 29,882 | 9,961 | - | - | - | - | |||||||||||||||||||||
| Operating Leases | 58,243 | 19,232 | 14,208 | 7,912 | 5,030 | 4,009 | 7,852 | |||||||||||||||||||||
| Capital Leases | 488 | 244 | 133 | 111 | - | - | - | |||||||||||||||||||||
| Purchase Obligations | 226,272 | 226,272 | - | - | - | - | - | |||||||||||||||||||||
| Total | $ | 1,404,846 | $ | 275,630 | $ | 1,104,302 | $ | 8,023 | $ | 5,030 | $ | 4,009 | $ | 7,852 | ||||||||||||||
Details of other commercial commitments at June 30, 2017 are as follows (in thousands):
| Amount of Commitment Expiration Per Fiscal Year | ||||||||||||||||||||||||||||
| In $000’s | Total | 2018 | 2019 | 2020 | 2021 | 2022 | Thereafter | |||||||||||||||||||||
| Standby Letter of Credit |
$ | 12,406 | $ | 9,054 | $ | - | $ | - | $ | - | $ | - | $ | 3,352 | ||||||||||||||
| Guarantees* |
$ | 12,783 | $ | 45 | $ | 1,234 | $ | 47 | $ | 39 | $ | 20 | $ | 11,398 | ||||||||||||||
| Other |
- | - | - | - | - | - | - | |||||||||||||||||||||
| Total |
$ | 25,189 | $ | 9,099 | $ | 1,234 | $ | 47 | $ | 39 | $ | 20 | $ | 14,750 | ||||||||||||||
*These guarantees mainly relate to requirements under contractual obligations with insurance companies transacting with our German subsidiaries and guarantees provided under our facility leasing obligations.
Refer to Note 19 Legal Actions and Contingencies of the Notes to the Consolidated Financial Statements for details of our contingent obligations under recourse provisions.
Segment Information
We have determined that we predominantly operate in a single operating segment, which is the sleep and respiratory disorders sector of the medical device industry. Due to the acquisition of Brightree LLC in April 2016, our operations now include the supply of business management software and services to medical equipment and home health providers. However, these operations, both in terms of revenue and profit, are not material to our global operations and therefore have not been separately reported as a segment. See Note 15 – Segment Information of the Notes to Financial Statements (Part II, Item 8) for financial information regarding segment reporting. Financial information about our revenues from and assets located in foreign countries is also included in the Notes to our consolidated financial statements.
- 54 -
Table of Contents
Credit Facility
On October 31, 2013, we entered into a revolving credit agreement, as borrower, with lenders, including Union Bank, N.A., as administrative agent, joint lead arranger, swing line lender and letters of credit issuer, and HSBC Bank USA, National Association, as syndication agent and joint lead arranger, providing for a revolving credit facility of $700 million, with an uncommitted option to increase the revolving credit facility by an additional $300 million. On April 4, 2016, in connection with our acquisition of Brightree LLC (“Brightree”), we entered into a first amendment to the revolving credit agreement to increase the size of the revolving credit facility from $700 million to $1 billion, with an uncommitted option to increase the revolving credit facility by an additional $300 million, and to make other modifications to provide for the acquisition of Brightree. On January 9, 2017, we entered into a second amendment to our agreement with our existing lenders, including MUFG Union Bank, N.A. as successor in interest to Union Bank, N.A., as Administrative Agent, Joint Lead Arranger, Swing Line Lender and L/C Issuer; and HSBC Bank USA, National Association, as Syndication Agent and Joint Lead Arranger. The second amendment, among other things, increases the size of our senior unsecured revolving credit facility from $1.0 billion to $1.3 billion, with an uncommitted option to increase the revolving credit facility by an additional $300 million. The credit facility terminates on October 31, 2018, when all unpaid principal and interest under the loans must be repaid. The outstanding principal amount due under the credit facility will bear interest at a rate equal to LIBOR plus 1.0% to 2.0% (depending on the then-applicable leverage ratio). At June 30, 2017, the interest rate that was being charged on the outstanding principal amount was 2.7%. A commitment fee of 0.15% to 0.25% (depending on the then-applicable leverage ratio) applies on the unused portion of the credit facility. The credit facility also includes a $25 million sublimit for letters of credit.
Our obligations under the revolving credit agreement (as amended) are unsecured but are guaranteed by certain of our direct and indirect U. S. subsidiaries, including ResMed Corp.; ResMed Motor Technologies Inc.; Birdie Inc.; Inova Labs, Inc.; Brightree LLC; Brightree Services LLC; Brightree Home Health & Hospice LLC; and Strategic AR LLC, under an unconditional guaranty. The credit agreement contains customary covenants, including certain financial covenants and an obligation that we maintain certain financial ratios, including a maximum leverage ratio of funded debt to EBITDA (as defined in the credit agreement) and an interest coverage ratio.
At June 30, 2017, we were in compliance with our debt covenants and there was $1,080.0 million outstanding under the revolving credit facility.
We expect to satisfy all of our liquidity and long-term debt requirements through a combination of cash on hand, cash generated from operations and debt facilities.
Term Loan
On April 4, 2016, in connection with the Brightree acquisition, we also entered into a credit agreement, or the “term loan credit agreement”, providing a $300 million senior unsecured one-year term loan credit facility. The proceeds from the funding of the term loan credit facility were used to pay a portion of the acquisition consideration for the Brightree acquisition, as well as to pay fees and expenses in connection with the acquisition, the amendment to the revolving credit agreement and the term loan credit agreement. On March 30, 2017 we drew down $300 million from the revolving credit facility to pay off all outstanding amounts under the term loan credit facility, in advance of the scheduled termination of the term loan credit facility on April 3, 2017.
- 55 -
Table of Contents
Tax Expense
Our income tax rate is governed by the laws of the jurisdictions where our income is recognized. To date, a substantial portion of our income has been subject to income tax in Australia where the statutory rate was 30% in fiscal years June 30, 2017, 2016 and 2015. During fiscal years June 30, 2017, 2016 and 2015, our consolidated effective tax rate has fluctuated between 18% and 20%. These and future effective tax rate fluctuations resulted from and depend on numerous factors including the level of foreign earnings repatriated to the U.S.; the geographic mix of taxable income and other tax credits and benefits available to us under applicable tax laws, including the lower statutory tax rates and incentives associated with our Singapore and Malaysia manufacturing operations, and any future changes to tax laws in the jurisdictions in which we operate.
Critical Accounting Principles and Estimates
The preparation of financial statements in conformity with accounting principles generally accepted in the United States requires us to make estimates and judgments that affect our reported amounts of assets and liabilities, revenues and expenses and related disclosures of contingent assets and liabilities. We evaluate our estimates on an ongoing basis, including those estimates related to allowance for doubtful accounts, inventory adjustments, warranty obligations, goodwill, impaired assets, intangible assets, income taxes, deferred tax valuation allowances and stock-based compensation costs.
We state these accounting policies in the Notes to the consolidated financial statements and at relevant sections in this discussion and analysis. The estimates are based on the information that is currently available to us and on various other assumptions that we believe to be reasonable under the circumstances. Actual results could vary from those estimates under different assumptions or conditions.
We believe that the following critical accounting policies affect the more significant judgments and estimates used in the preparation of our consolidated financial statements:
(1) Allowance for Doubtful Accounts. We maintain an allowance for doubtful accounts for estimated losses resulting from the inability of our customers to make required payments, which results in bad debt expense. We determine the adequacy of this allowance by periodically evaluating individual customer receivables, considering a customer’s financial condition, credit history and current economic conditions. If the financial condition of our customers were to deteriorate, resulting in an impairment of their ability to make payments, additional allowances may be required.
(2) Inventory Adjustments. Inventories are stated at lower of cost or market and are determined by the first-in, first-out method. We review the components of inventory on a regular basis for excess, obsolete and impaired inventory based on estimated future usage and sales. The likelihood of any material inventory write-downs depends on changes in competitive conditions, new product introductions by us or our competitors, or rapid changes in customer demand.
- 56 -
Table of Contents
(3) Valuation of Goodwill, Intangible and Other Long-Lived Assets. We make assumptions in establishing the carrying value, fair value and estimated lives of our goodwill, intangibles and other long-lived assets. Our goodwill impairment tests are performed at our reporting unit level which is one level below our operating segment. The criteria used for these evaluations include management’s estimate of the asset’s continuing ability to generate positive income from operations and positive cash flow in future periods compared to the carrying value of the asset, as well as the strategic significance of any identifiable intangible asset in our business objectives. If assets are considered to be impaired, we recognize as impairment the amount by which the carrying value of the assets exceeds their fair value. We base useful lives and related amortization or depreciation expense on our estimate of the period that the assets will generate revenues or otherwise be used by us. Factors that would influence the likelihood of a material change in our reported results include significant changes in the asset’s ability to generate positive cash flow, loss of legal ownership or title to the asset, a significant decline in the economic and competitive environment on which the asset depends, significant changes in our strategic business objectives, utilization of the asset, and a significant change in the economic and/or political conditions in certain countries.
We conducted our annual review for goodwill impairment during the final quarter of fiscal 2017, which indicated that no impaired goodwill exists as the fair value for each reporting unit exceeded its carrying value.
(4) Income Tax. We assess our income tax positions and record tax benefits for all years subject to audit based upon management’s evaluation of the facts, circumstances and information available at the reporting date. If we determine that it is not more likely than not that we would be able to realize all or part of our net deferred tax assets in the future, an adjustment to the deferred tax assets would be charged to income tax expense in the period such determination is made. Alternatively, if we determine that it is more likely than not that the net deferred tax assets would be realized, any previously provided valuation allowance is reversed. These changes to the valuation allowance and resulting increases or decreases in income tax expense may have a material effect on our operating results.
Our income tax returns are based on calculations and assumptions subject to audit by various tax authorities. In addition, the calculation of our tax liabilities involves dealing with uncertainties in the application of complex tax laws. Although currently immaterial, we recognize liabilities for uncertain tax positions based on a two-step process. The first step is to evaluate the tax position for recognition by determining if the weight of available evidence indicates that it is more likely than not that the position will be sustained on audit, including resolution of related appeals or litigation processes, if any. The second step is to measure the tax benefit as the largest amount that is more than 50% likely of being realized upon settlement. While we believe we have appropriate support for the positions taken on our tax returns, we regularly assess the potential outcomes of examinations by tax authorities in determining the adequacy of our provision for income taxes. Based on our regular assessment, we may adjust the income tax provision, income taxes payable and deferred taxes in the period in which the facts that give rise to a revision become known.
(5) Provision for Warranty. We provide for the estimated cost of product warranties at the time the related revenue is recognized. We determine the amount of this provision by using a financial model, which takes into consideration actual historical expenses and potential risks associated with our different products. We use this financial model to calculate the future probable expenses related to warranty and the required level of the warranty provision. Although we engage in product improvement programs and processes, our warranty obligation is affected by product failure rates and costs incurred to correct those product failures. Should actual product failure rates or estimated costs to repair those product failures differ from our estimates, we would be required to revise our estimated warranty provision.
- 57 -
Table of Contents
(6) Revenue Recognition. We generally record revenue on product sales at the time of shipment, which is when title transfers to the customer. We initially defer service revenue received in advance from service contracts and recognize that deferred revenue ratably over the life of the service contract. We initially defer revenue we receive in advance from rental unit contracts and recognize that deferred revenue ratably over the life of the rental contract. Otherwise, we recognize revenue from rental unit contracts ratably over the life of the rental contract. We include in revenue freight charges we bill to customers. We charge all freight-related expenses to cost of sales. Taxes assessed by government authorities that are imposed on and concurrent with revenue-producing transactions, such as sales and value added taxes, are excluded from revenue.
We do not normally offer a right of return or other recourse with respect to the sale of our products, other than returns for product defects or other warranty claims. We do not recognize revenues if we offer a right of return or variable sale prices for subsequent events or activities. However, as part of our sales processes we may provide upfront discounts for large orders, one-time special pricing to support new product introductions, sales rebates for centralized purchasing entities or price-breaks for regular order volumes. We record the costs of all such programs as an adjustment to revenue at the time the related revenue is recognized. Our products are predominantly therapy-based equipment and require no installation. Therefore, we have no significant installation obligations. For multiple-element arrangements, we allocate arrangement consideration to the deliverables by use of the relative selling price method. The selling price used for each deliverable is based on vendor-specific objective evidence.
We also generate revenue from time-based licensing of our software and associated services. In most instances, revenue is generated under sales agreements with multiple elements comprising subscription fees and professional services, which typically have contract terms of one to three years. We evaluate each element in these multiple-element arrangements to determine whether they represent a separate unit of accounting and recognize each element as the services are performed.
(7) Stock-Based Compensation. We measure the compensation cost of all stock-based awards at fair value on the date of grant. We recognize that value as compensation expense over the service period, net of estimated forfeitures. We estimate the fair value of employee stock options and purchase rights granted using a Black-Scholes valuation model. The fair value of an award is affected by our stock price on the date of grant as well as other assumptions including the estimated volatility of our stock price over the term of the awards, the expected dividend per share and the expected life of the awards. The risk-free interest rate assumption we use is based upon the U.S. Treasury yield curve at the time of grant appropriate for the expected life of the awards. Expected volatilities are based on a combination of historical volatilities of our stock and the implied volatilities from tradeable options of our stock corresponding to the expected term of the options. We use a combination of the historic and implied volatilities as the addition of the implied volatility is more representative of our future stock price trends. While there is a tradeable market of options on our common stock, less emphasis is placed on the implied volatility of these options due to the relative low volumes of these traded options and the difference in the terms compared to our employee options. In order to determine the estimated period of time that we expect employees to hold their stock options, we use historical rates by employee groups. The estimation of stock awards that will ultimately vest requires judgment, and to the extent actual results differ from our estimates, such amounts will be recorded as a cumulative adjustment in the period estimates are revised. The aforementioned inputs entered into the Black-Scholes valuation model we use to fair value our stock awards are subjective estimates and changes to these estimates will cause the fair value of our stock awards and related stock-based compensation expense we record to vary.
We estimate the fair value of restricted stock units based on the market value of the underlying shares as determined at the grant date less the fair value of dividends that holders are not entitled to, during the vesting period. We estimate the weighted average grant date fair value of performance restricted stock units, or PRSUs, which contain a market condition, using a Monte-Carlo simulation valuation model.
- 58 -
Table of Contents
Recently Issued Accounting Pronouncements
See Note 3 – New Accounting Pronouncements to the consolidated financial statements for a description of recently issued accounting pronouncements, including the expected dates of adoption and estimated effects on our results of operations, financial positions and cash flows.
Off-Balance Sheet Arrangements
As of June 30, 2017, we are not involved in any significant off-balance sheet arrangements, as defined in Item 303(a)(4)(ii) of Regulation S-K promulgated by the SEC.
| ITEM 7A | QUANTITATIVE AND QUALITATIVE DISCLOSURES ABOUT MARKET AND BUSINESS RISKS |
Foreign Currency Market Risk
Our reporting currency is the U.S. dollar, although the financial statements of our non-U.S. subsidiaries are maintained in their respective local currencies. We transact business in various foreign currencies, including a number of major European currencies as well as the Australian dollar. We have significant foreign currency exposure through both our Australian and Singapore manufacturing activities and international sales operations. We have established a foreign currency hedging program using purchased currency options and forward contracts to hedge foreign-currency-denominated financial assets, liabilities and manufacturing cash flows. The goal of this hedging program is to economically manage the financial impact of foreign currency exposures predominantly denominated in euros, Australian dollars and Singapore dollars. Under this program, increases or decreases in our foreign-currency-denominated financial assets, liabilities, and firm commitments are partially offset by gains and losses on the hedging instruments. We do not enter into financial instruments for trading or speculative purposes. The foreign currency derivatives portfolio is recorded in the consolidated balance sheets at fair value and included in Other assets current, Other assets non-current, Accrued expenses and Other liabilities non-current. All movements in the fair value of the foreign currency derivatives are recorded within Other income, net, on our consolidated statements of income.
- 59 -
Table of Contents
The table below provides information (in U.S. dollars) on our significant foreign-currency-denominated financial assets by legal entity functional currency as of June 30, 2017 (in thousands):
| Australian Dollar (AUD) |
U.S. Dollar (USD) |
Euro (EUR) |
Canadian Dollar (CAD) |
Malaysian Ringgit (MYR) |
Great Britain Pound (GBP) |
Chinese Yuan (CNY) |
||||||||||||||||||||||
| AUD Functional: |
||||||||||||||||||||||||||||
| Assets |
- | 267,296 | 155,925 | - | 5,046 | - | 14,560 | |||||||||||||||||||||
| Liability |
- | (107,348 | ) | (101,173 | ) | (710 | ) | - | (6,750 | ) | (625 | ) | ||||||||||||||||
| Foreign Currency Hedges |
- | (182,000 | ) | (78,808 | ) | - | (4,658 | ) | 6,512 | (13,271 | ) | |||||||||||||||||
| Net Total |
- | (22,052 | ) | (24,056 | ) | (710 | ) | 388 | (238 | ) | 664 | |||||||||||||||||
| USD Functional: |
||||||||||||||||||||||||||||
| Assets |
- | - | - | 20,035 | - | 8,042 | - | |||||||||||||||||||||
| Liability |
- | - | - | (2,035 | ) | - | (7,897 | ) | - | |||||||||||||||||||
| Foreign Currency Hedges |
- | - | - | (13,880 | ) | - | - | - | ||||||||||||||||||||
| Net Total |
- | - | - | 4,120 | - | 145 | - | |||||||||||||||||||||
| EURO Functional: |
||||||||||||||||||||||||||||
| Assets |
68 | 399 | - | - | - | 2,582 | - | |||||||||||||||||||||
| Liability |
(1 | ) | (6,345 | ) | - | - | - | (265 | ) | - | ||||||||||||||||||
| Foreign Currency Hedges |
- | - | - | - | - | (2,605 | ) | - | ||||||||||||||||||||
| Net Total |
67 | (5,946 | ) | - | - | - | (288 | ) | - | |||||||||||||||||||
| GBP Functional: |
||||||||||||||||||||||||||||
| Assets |
- | 461 | 85,941 | - | - | - | - | |||||||||||||||||||||
| Liability |
- | (816 | ) | (81,269 | ) | - | - | - | - | |||||||||||||||||||
| Foreign Currency Hedges |
- | - | - | - | - | - | - | |||||||||||||||||||||
| Net Total |
- | (355 | ) | 4,672 | - | - | - | - | ||||||||||||||||||||
| SGD Functional: |
||||||||||||||||||||||||||||
| Assets |
717 | 185,376 | 90,193 | - | - | - | 275 | |||||||||||||||||||||
| Liability |
(2,120 | ) | (24,459 | ) | (41,912 | ) | - | - | 2 | - | ||||||||||||||||||
| Foreign Currency Hedges |
- | (118,000 | ) | (45,686 | ) | - | - | - | - | |||||||||||||||||||
| Net Total |
(1,403 | ) | 42,917 | 2,595 | - | - | 2 | 275 | ||||||||||||||||||||
- 60 -
Table of Contents
The table below provides information about our foreign currency derivative financial instruments and presents the information in U.S. dollar equivalents. The table summarizes information on instruments and transactions that are sensitive to foreign currency exchange rates, including foreign currency call options, collars and forward contracts held at June 30, 2017. The table presents the notional amounts and weighted average exchange rates by contractual maturity dates for our foreign currency derivative financial instruments. These notional amounts generally are used to calculate payments to be exchanged under the options contracts (in thousands, except exchange rates):
|
Foreign Exchange |
Fair Value Assets / (Liabilities) | |||||||||||
| FY 2018 | FY 2019 | FY 2020 | Total | June 30, 2017 |
June 30, 2016 | |||||||
| Receive AUD/Pay USD |
||||||||||||
| Contract amount |
182,000 | - | - | 182,000 | 1,499 | 1,262 | ||||||
| Ave. contractual exchange rate |
AUD 1 = USD 0.7615 | AUD 1 = USD 0.7615 | ||||||||||
| Receive AUD/Pay Euro |
||||||||||||
| Contract amount |
113,070 | 45,690 | 22,840 | 181,600 | 1,191 | 2,325 | ||||||
| Ave. contractual exchange rate |
AUD 1 = Euro 0.6742 | AUD 1 = Euro 0.6687 | AUD 1 = Euro 0.6747 | AUD 1 = Euro 0. 6729 | ||||||||
| Receive SGD/Pay Euro |
||||||||||||
| Contract amount |
45,686 | - | - | 45,686 | 103 | 35 | ||||||
| Ave. contractual exchange rate |
SGD 1 = Euro 0. 6344 | SGD 1 = Euro 0. 6344 | ||||||||||
| Receive SGD/Pay USD |
||||||||||||
| Contract amount |
118,000 | - | - | 118,000 | 45 | 792 | ||||||
| Ave. contractual exchange rate |
SGD 1 = USD 0.7268 | SGD 1 = USD 0.7268 | ||||||||||
| Receive GBP/Pay AUD |
||||||||||||
| Contract amount |
6,512 | - | - | 6,512 | 17 | (120) | ||||||
| Ave. contractual exchange rate |
GBP 1 = AUD 0.59 | GBP 1 = AUD 0.59 | ||||||||||
| Receive EUR/Pay GBP |
||||||||||||
| Contract amount |
2,605 | - | - | 2,605 | (8) | 11 | ||||||
| Ave. contractual exchange rate |
EUR 1 = GBP 0.8795 | EUR 1 = GBP 0.8795 | ||||||||||
| Receive AUD/Pay CNY |
||||||||||||
| Contract amount |
13,271 | - | - | 13,271 | 18 | (24) | ||||||
| Ave. contractual exchange rate |
AUD 1 = CNY 5.2202 | AUD 1 = CNY 5.2202 | ||||||||||
| Receive USD/Pay CAD |
||||||||||||
| Contract amount |
13,880 | - | - | 13,880 | (45) | (96) | ||||||
| Ave. contractual exchange rate |
USD 1 = CAD 1.3010 | USD 1 = CAD 1.3010 | ||||||||||
| Receive AUD/Pay MYR |
||||||||||||
| Contract amount |
4,658 | 4,658 | (60) | - | ||||||||
| Ave. contractual exchange rate |
AUD 1 = MYR 3.3433 | AUD 1 = MYR 3.3433 | ||||||||||
- 61 -
Table of Contents
Interest Rate Risk
We are exposed to risk associated with changes in interest rates affecting the return on our cash and cash equivalents and debt. At June 30, 2017, we held cash and cash equivalents of $821.9 million principally comprising of bank term deposits and at-call accounts and are invested at both short-term fixed interest rates and variable interest rates. At June 30, 2017, we had total borrowings of $1,078.6 million, comprising a revolving credit balance, which is subject to variable interest rates. A hypothetical 10% change in interest rates during the year ended June 30, 2017, would not have had a material impact on pretax income. We have no interest rate hedging agreements.
| ITEM 8 | CONSOLIDATED FINANCIAL STATEMENTS AND SUPPLEMENTARY DATA |
The information required by this Item is incorporated by reference to the financial statements set forth in Item 15 of Part IV of this report, “Exhibits and Consolidated Financial Statement Schedules.”
| a) | Index to Consolidated Financial Statements |
| b) | Supplementary Data |
Quarterly Financial Information (unaudited) – The quarterly results for the years ended June 30, 2017 and 2016 are summarized below (in thousands, except per share amounts):
| 2017 | First Quarter |
Second Quarter |
Third Quarter |
Fourth Quarter |
Fiscal Year | |||||||||||||||
| Net revenue |
$ | 465,450 | $ | 530,397 | $ | 514,204 | $ | 556,686 | $ | 2,066,737 | ||||||||||
| Gross profit |
269,184 | 309,071 | 299,714 | 323,776 | 1,201,745 | |||||||||||||||
| Net income |
76,107 | 76,743 | 87,823 | 101,613 | 342,284 | |||||||||||||||
| Basic earnings per share |
0.54 | 0.54 | 0.62 | 0.72 | 2.42 | |||||||||||||||
| Diluted earnings per share |
0.54 | 0.54 | 0.62 | 0.71 | 2.40 | |||||||||||||||
| 2016 | First Quarter |
Second Quarter |
Third Quarter |
Fourth Quarter |
Fiscal Year | |||||||||||||||
| Net revenue |
$ | 411,647 | $ | 454,540 | $ | 453,879 | $ | 518,647 | $ | 1,838,713 | ||||||||||
| Gross profit |
238,619 | 266,509 | 259,880 | 301,489 | 1,066,497 | |||||||||||||||
| Net income* |
82,916 | 95,576 | 90,791 | 83,126 | 352,409 | |||||||||||||||
| Basic earnings per share* |
0.59 | 0.68 | 0.65 | 0.59 | 2.51 | |||||||||||||||
| Diluted earnings per share* |
0.58 | 0.68 | 0.64 | 0.59 | 2.49 | |||||||||||||||
Note: the amounts for each quarter are computed independently, and, due to the computation formula, the sum of the four quarters may not equal the year.
* The above amounts have been restated to reflect the adoption of ASU 2016-09 “Improvements to Employee Share-Based Payment Accounting” during the year ended June 30, 2016. Under this standard, we are required to report the impact as though the standard had been adopted on July 1, 2015, the beginning of our fiscal year, and to reflect the tax benefit as a discrete item within each of the respective interim reporting periods.
- 62 -
Table of Contents
| ITEM 9 | CHANGES IN AND DISAGREEMENTS WITH ACCOUNTANTS ON ACCOUNTING AND FINANCIAL DISCLOSURE |
None.
| ITEM 9A | CONTROLS AND PROCEDURES |
We maintain disclosure controls and procedures that are designed to ensure that information required to be disclosed in our Exchange Act reports is recorded, processed, summarized and reported within the time periods specified in the SEC’s rules and forms and that such information is accumulated and communicated to our management, including our chief executive officer and chief financial officer, as appropriate, to allow for timely decisions regarding required disclosure. In designing and evaluating the disclosure controls and procedures, management recognizes that any controls and procedures, no matter how well designed and operated, can provide only reasonable assurance of achieving the desired control objectives, and management is required to apply its judgment in evaluating the cost-benefit relationship of possible controls and procedures.
As required by SEC Rule 13a-15(b), we carried out an evaluation, under the supervision and with the participation of our management, including our chief executive officer and chief financial officer, of the effectiveness of the design and operation of our disclosure controls and procedures as of June 30, 2017. Based on the foregoing, our chief executive officer and chief financial officer concluded that our disclosure controls and procedures were effective at the reasonable assurance level as of June 30, 2017.
There has been no change in our internal control over financial reporting during our most recent fiscal quarter that has materially affected, or is reasonably likely to materially affect, our internal control over financial reporting.
- 63 -
Table of Contents
MANAGEMENT’S REPORT ON INTERNAL CONTROL OVER FINANCIAL REPORTING
Our management is responsible for establishing and maintaining adequate internal control over financial reporting as defined in Rules 13a-15(f) and 15d-15(f) under the Securities Exchange Act of 1934, as amended. Our internal control over financial reporting is designed to provide reasonable assurance regarding the reliability of financial reporting and the preparation of financial statements for external purposes in accordance with generally accepted accounting principles in the United States of America. Our internal control over financial reporting includes those policies and procedures that:
| (i) | Pertain to the maintenance of records that, in reasonable detail, accurately and fairly reflect the transactions and dispositions of our assets; |
| (ii) | Provide reasonable assurance that transactions are recorded as necessary to permit preparation of financial statements in accordance with generally accepted accounting principles, and that our receipts and expenditures are being made only in accordance with authorizations of our management and directors; and |
| (iii) | Provide reasonable assurance regarding prevention or timely detection of unauthorized acquisition, use or disposition of our assets that could have a material effect on the financial statements. |
Because of its inherent limitations, internal control over financial reporting may not prevent or detect misstatements. Also, projections of any evaluation of effectiveness to future periods are subject to the risk that controls may become inadequate because of changes in conditions, or that the degree of compliance with the policies or procedures may deteriorate.
Management assessed the effectiveness of our internal control over financial reporting as of June 30, 2017. In making this assessment, management used the framework in Internal Control-Integrated Framework (2013) issued by the Committee of Sponsoring Organizations of the Treadway Commission. Management’s assessment included an evaluation of the design of our internal control over financial reporting and testing of the operational effectiveness of its internal control over financial reporting. Management reviewed the results of its assessment with the audit committee of our board of directors.
Based on that assessment under the framework in Internal Control-Integrated Framework (2013), management concluded that the company’s internal control over financial reporting was effective as of June 30, 2017.
KPMG LLP, independent registered public accounting firm, who audited and reported on the consolidated financial statements of ResMed, Inc. included in this report, has issued an attestation report on the effectiveness of internal control over financial reporting.
- 64 -
Table of Contents
REPORT OF INDEPENDENT REGISTERED PUBLIC ACCOUNTING FIRM
The Board of Directors and Stockholders
ResMed Inc.:
We have audited ResMed Inc.’s internal control over financial reporting as of June 30, 2017, based on criteria established in Internal Control – Integrated Framework issued by the Committee of Sponsoring Organizations of the Treadway Commission (COSO). ResMed Inc.’s management is responsible for maintaining effective internal control over financial reporting and for its assessment of the effectiveness of internal control over financial reporting, included in the accompanying Management’s Report on Internal Control Over Financial Reporting. Our responsibility is to express an opinion on the Company’s internal control over financial reporting based on our audit.
We conducted our audit in accordance with the standards of the Public Company Accounting Oversight Board (United States). Those standards require that we plan and perform the audit to obtain reasonable assurance about whether effective internal control over financial reporting was maintained in all material respects. Our audit included obtaining an understanding of internal control over financial reporting, assessing the risk that a material weakness exists, and testing and evaluating the design and operating effectiveness of internal control based on the assessed risk. Our audit also included performing such other procedures as we considered necessary in the circumstances. We believe that our audit provides a reasonable basis for our opinion.
A company’s internal control over financial reporting is a process designed to provide reasonable assurance regarding the reliability of financial reporting and the preparation of financial statements for external purposes in accordance with generally accepted accounting principles. A company’s internal control over financial reporting includes those policies and procedures that (1) pertain to the maintenance of records that, in reasonable detail, accurately and fairly reflect the transactions and dispositions of the assets of the company; (2) provide reasonable assurance that transactions are recorded as necessary to permit preparation of financial statements in accordance with generally accepted accounting principles, and that receipts and expenditures of the company are being made only in accordance with authorizations of management and directors of the company; and (3) provide reasonable assurance regarding prevention or timely detection of unauthorized acquisition, use, or disposition of the company’s assets that could have a material effect on the financial statements.
Because of its inherent limitations, internal control over financial reporting may not prevent or detect misstatements. Also, projections of any evaluation of effectiveness to future periods are subject to the risk that controls may become inadequate because of changes in conditions, or that the degree of compliance with the policies or procedures may deteriorate.
In our opinion, ResMed Inc. maintained, in all material respects, effective internal control over financial reporting as of June 30, 2017, based on criteria established in Internal Control – Integrated Framework issued by the Committee of Sponsoring Organizations of the Treadway Commission (COSO).
We also have audited, in accordance with the standards of the Public Company Accounting Oversight Board (United States), the consolidated balance sheets of ResMed Inc. and subsidiaries as of June 30, 2017 and 2016, and the related consolidated statements of income, comprehensive income, stockholders’ equity, and cash flows for each of the years in the three-year period ended June 30, 2017, and our report dated August 3, 2017 expressed an unqualified opinion on those consolidated financial statements.
/s/ KPMG LLP
| San Diego, California |
| August 3, 2017 |
- 65 -
Table of Contents
| ITEM 9B | OTHER INFORMATION |
None.
- 66 -
Table of Contents
PART III
| ITEM 10 | DIRECTORS, EXECUTIVE OFFICERS AND CORPORATE GOVERNANCE |
Information required by this Item is incorporated by reference from our definitive proxy statement for our November 15, 2017, annual meeting of stockholders, which will be filed with the Securities and Exchange Commission within 120 days after June 30, 2017.
We have filed as exhibits to this annual report on Form 10-K for the year ended June 30, 2017, the certifications of our chief executive officer and chief financial officer required by Section 302 of the Sarbanes-Oxley Act of 2002.
| ITEM 11 | EXECUTIVE COMPENSATION |
Information required by this Item is incorporated by reference from our definitive proxy statement for our November 15, 2017, annual meeting of stockholders, which will be filed with the Securities and Exchange Commission within 120 days after June 30, 2017.
| ITEM 12 | SECURITY OWNERSHIP OF CERTAIN BENEFICIAL OWNERS AND MANAGEMENT AND RELATED STOCKHOLDER MATTERS |
Information required by this Item is incorporated by reference from our definitive proxy statement for our November 15, 2017, annual meeting of stockholders, which will be filed with the Securities and Exchange Commission within 120 days after June 30, 2017.
| ITEM 13 | CERTAIN RELATIONSHIPS AND RELATED TRANSACTIONS, AND DIRECTOR INDEPENDENCE |
Information required by this Item is incorporated by reference from our definitive proxy statement for our November 15, 2017, annual meeting of stockholders, which will be filed with the Securities and Exchange Commission within 120 days after June 30, 2017.
| ITEM 14 | PRINCIPAL ACCOUNTING FEES AND SERVICES |
Information required by this Item is incorporated by reference from our definitive proxy statement for our November 15, 2017, annual meeting of stockholders, which will be filed with the Securities and Exchange Commission within 120 days after June 30, 2017.
- 67 -
Table of Contents
PART IV
| ITEM 15 | EXHIBITS AND CONSOLIDATED FINANCIAL STATEMENT SCHEDULES |
The following documents are filed as part of this report:
| (a) | Consolidated Financial Statements and Schedules – The index to our consolidated financial statements and schedules are set forth in the “Index to Consolidated Financial Statements” under Item 8 of this report. | |
| (b) | Exhibit Lists | |
| 2.1 | Agreement and Plan of Merger, dated February 19, 2016, by and among ResMed Corp., Eagle Acquisition Sub LLC, Brightree LLC, Shareholder Representative Services LLC and ResMed Inc.(18)** | |
| 3.1 | First Restated Certificate of Incorporation of ResMed Inc., as amended.(16) | |
| 3.2 | Fifth Amended and Restated Bylaws of ResMed Inc.(13) | |
| 4.1 | Form of certificate evidencing shares of Common Stock.(1) | |
| 10.1 | Licensing Agreement between the University of Sydney and ResMed Ltd dated May 17, 1991, as amended.(1) | |
| 10.2* | ResMed Inc. 2006 Incentive Award Plan.(6) | |
| 10.3* | Amendment No. 1 to the ResMed Inc. 2006 Incentive Award Plan.(3) | |
| 10.4* | 2006 Grant agreement for Board of Directors.(3) | |
| 10.5* | 2006 Grant agreement for Executive Officers.(5) | |
| 10.6* | 2006 Grant agreement for Australian Executive Officers.(5) | |
| 10.7* | Form of Executive Agreement.(4) | |
| 10.8* | Amended and Restated 2006 Incentive Award Plan dated November 20, 2008.(7) | |
| 10.9 | Form of Indemnification Agreements for our directors and officers.(8) | |
| 10.10 | Form of Access Agreement for directors.(8) | |
| 10.11* | Updated Form of Executive Agreement.(2)(12) | |
| 10.12 | ResMed Inc. 2009 Incentive Award Plan.(9) | |
| 10.13 | ResMed Inc. 2009 Employee Stock Purchase Plan.(9) | |
| 10.14 | Amendment No. 1 to the ResMed Inc. 2009 Employee Stock Purchase Plan(14) | |
| 10.15 | Form of Restricted Stock Award Agreement.(9) | |
| 10.16 | ResMed Inc. Deferred Compensation Plan.(10) | |
| 10.17 | Credit Agreement, dated as of October 31, 2013, among ResMed Inc., the lenders Union Bank, N.A., as administrative agent, joint lead arranger, swing line lender and letters of credit issuer and HSBC Bank USA, National Association, as syndication agent and joint lead arranger.(17) | |
- 68 -
Table of Contents
| 10.18 | First Amendment to Credit Agreement dated as of April 4, 2016, by and among ResMed, as borrower, the lenders party thereto, Union Bank, N.A., as administrative agent, joint lead arranger, swing line lender and letter of credit issuer and HSBC Bank USA, National Association, as syndication agent and joint lead arranger.(19) | |||
| 10.19 | Second Amendment to Credit Agreement dated as of January 9, 2017, among ResMed Inc., as borrower, the lenders, MUFG Union Bank, N.A. as successor in interest to Union Bank, N.A., as administrative agent, joint lead arranger, swing line lender and letter of credit issuer, and HSBC Bank USA, National Association, as syndication agent and joint lead arranger.(22) | |||
| 10.20 | Term Loan Credit Agreement dated April 4, 2016, among ResMed Inc., as borrower, the lenders, Union Bank, N.A., as administrative agent, joint lead arranger and joint book runner, HSBC Bank USA, National Association, as joint lead arranger and joint book runner and HSBC Bank Australia Limited, as joint lead arranger and joint book runner.(20) | |||
| 10.21 | Unconditional Guaranty entered into as of April 4, 2016, by each of ResMed Corp., ResMed Motor Technologies Inc., Birdie Inc., Inova Labs, Inc., Brightree LLC, Brightree Services LLC, Brightree Home Health & Hospice LLC and Strategic AR LLC., in favor of Union Bank, N.A., as administrative agent.(21) | |||
| 10.22 | Form of Restricted Stock Unit Award Agreement for Executive Officers.(11) | |||
| 10.23 | Form of Restricted Stock Unit Award Agreement for Directors.(11) | |||
| 10.24 | Form of Stock Option Grant for Executive Officers.(11) | |||
| 10.25 | Form of Stock Option Grant for Directors.(11) | |||
| 10.26 | Form of Performance-Based Restricted Stock Unit Award Agreement for Executive Officers.(15) | |||
| 21.1 | Subsidiaries of the Registrant. (23) | |||
| 23.1 | Consent of Independent Registered Public Accounting Firm. (23) | |||
| 31.1 | Certification of Chief Executive Officer Pursuant to Section 302 of Sarbanes-Oxley Act of 2002. (23) | |||
| 31.2 | Certification of Chief Financial Officer Pursuant to Section 302 of Sarbanes-Oxley Act of 2002. (23) | |||
| 32.1 | Certification of Chief Executive Officer and Chief Financial Officer pursuant to Section 906 of the Sarbanes-Oxley Act of 2002. (23) | |||
| 101 | The following materials from ResMed Inc.’s Annual Report on Form 10-K for the fiscal year ended June 30, 2017 formatted in Extensible Business Reporting Language (XBRL): (i) the Consolidated Balance Sheets, (ii) the Consolidated Statements of Income, (iii) the Consolidated Statements of Stockholders’ Equity and Comprehensive Income, (iv) the Consolidated Statements of Cash Flows and (v) related notes.
| |||
* Management contract or compensatory plan or arrangement
** Exhibits and schedules have been omitted as authorized by Item 601(b)(2) of Regulation S-K. The Registrant will supplementally furnish copies of any of the omitted exhibits and schedules if the SEC requests; provided, however, that the Registrant may request confidential treatment for any exhibits or schedules it furnishes, under Rule 24b-2 of the Exchange Act.
(1) Incorporated by reference to the Registrant’s Registration Statement on Form S-1 (No. 33-91094) declared effective on June 1, 1995.
(2) Incorporated by reference to the Registrant’s Report on Form 10-K for the year ended June 30, 2009.
(3) Incorporated by reference to the Registrant’s Report on Form 10-Q for the quarter ended December 31, 2006.
(4) Incorporated by reference to the Registrant’s Report on Form 8-K filed on July 13, 2007.
- 69 -
Table of Contents
(5) Incorporated by reference to the Registrant’s Report on Form 10-K for the year ended June 30, 2007.
(6) Incorporated by reference to the Registrant’s Report on Form 8-K filed on November 15, 2006.
(7) Incorporated by reference to Appendix A of the Registrant’s Definitive Proxy Statement filed on October 15, 2008.
(8) Incorporated by reference to the Registrant’s Report on Form 8-K filed on June 24, 2009.
(9) Incorporated by reference to the Registrant’s Report on Form 8-K filed on November 23, 2009.
(10) Incorporated by reference to the Registrant’s Report on Form 8-K filed on May 25, 2010.
(11) Incorporated by reference to the Registrant’s Report on Form 10-Q for the quarter ended September 30, 2011.
(12) Incorporated by reference to the Registrant’s Report on Form 8-K filed on July 2, 2012.
(13) Incorporated by reference to the Registrant’s Report on Form 8-K/A filed on September 17, 2012.
(14) Incorporated by reference to Appendix A of the Registrant’s Definitive Proxy Statement filed on October 4, 2012.
(15) Incorporated by reference to the Registrant’s Report on Form 8-K filed on November 21, 2012.
(16) Incorporated by reference to Exhibit 3.1 to the Registrant’s Report on Form 10-Q for the quarter ended September 30, 2013
(17) Incorporated by reference to Exhibits 10.1 and 10.2 to the Registrant’s Report on Form 8-K filed on November 5, 2013
(18) Incorporated by reference to Exhibit 2.1 to the Registrant’s Report on Form 8-K filed on February 22, 2016.
(19) Incorporated by reference to Exhibit 10.1 to the Registrant’s Report on Form 8-K filed on August 10, 2017.
(20) Incorporated by reference to Exhibit 10.2 to the Registrant’s Report on Form 8-K filed on April 4, 2016.
(21) Incorporated by reference to Exhibit 10.3 to the Registrant’s Report on Form 8-K filed on April 4, 2016.
(22) Incorporated by reference to Exhibit 10.1 to the Registrant’s Report on Form 8-K filed on January 12, 2017.
(23) Filed with this report.
- 70 -
Table of Contents
| ITEM 16 | FORM 10-K SUMMARY |
None.
- 71 -
Table of Contents
REPORT OF INDEPENDENT REGISTERED PUBLIC ACCOUNTING FIRM
The Board of Directors and Stockholders
ResMed Inc.:
We have audited the accompanying consolidated balance sheets of ResMed Inc. (and subsidiaries) as of June 30, 2017 and 2016, and the related consolidated statements of income, comprehensive income, stockholders’ equity, and cash flows for each of the years in the three-year period ended June 30, 2017. In connection with our audits of the consolidated financial statements, we also have audited financial statement schedule II. These consolidated financial statements and financial statement schedule are the responsibility of the Company’s management. Our responsibility is to express an opinion on these consolidated financial statements and financial statement schedule based on our audits.
We conducted our audits in accordance with the standards of the Public Company Accounting Oversight Board (United States). Those standards require that we plan and perform the audit to obtain reasonable assurance about whether the financial statements are free of material misstatement. An audit includes examining, on a test basis, evidence supporting the amounts and disclosures in the financial statements. An audit also includes assessing the accounting principles used and significant estimates made by management, as well as evaluating the overall financial statement presentation. We believe that our audits provide a reasonable basis for our opinion.
In our opinion, the consolidated financial statements referred to above present fairly, in all material respects, the financial position of ResMed Inc. (and subsidiaries) as of June 30, 2017 and 2016, and the results of their operations and their cash flows for each of the years in the three-year period ended June 30, 2017, in conformity with U.S. generally accepted accounting principles. Also in our opinion, the related financial statement schedule, when considered in relation to the basic consolidated financial statements taken as a whole, present fairly, in all material respects, the information set forth therein.
We also have audited, in accordance with the standards of the Public Company Accounting Oversight Board (United States), ResMed Inc.’s internal control over financial reporting as of June 30, 2017, based on criteria established in Internal Control – Integrated Framework issued by the Committee of Sponsoring Organizations of the Treadway Commission (COSO), and our report dated August 3, 2017, expressed an unqualified opinion on the effectiveness of the internal control over financial reporting of ResMed Inc.
/s/ KPMG LLP
San Diego, California
August 3, 2017
- F1 -
Table of Contents
Consolidated Balance Sheets
June 30, 2017 and 2016
(In thousands, except share and per share data)
| June
30, 2017 |
June
30, 2016 |
|||||||
| Assets |
||||||||
| Current assets: |
||||||||
| Cash and cash equivalents |
$ | 821,935 | $ | 731,434 | ||||
| Accounts receivable, net of allowance for doubtful accounts of $11,150 and $12,555 at June 30, 2017 and June 30, 2016, respectively |
450,530 | 382,086 | ||||||
| Inventories (note 5) |
268,319 | 224,456 | ||||||
| Prepaid expenses and other current assets |
103,219 | 81,743 | ||||||
| Total current assets |
1,644,003 | 1,419,719 | ||||||
| Non-current assets: |
||||||||
| Property, plant and equipment, net (note 6) |
394,241 | 384,276 | ||||||
| Goodwill (note 7) |
1,064,874 | 1,059,245 | ||||||
| Other intangible assets, net (note 7) |
261,800 | 299,808 | ||||||
| Deferred income taxes (note 14) |
61,503 | 55,496 | ||||||
| Other assets |
42,066 | 38,161 | ||||||
| Total non-current assets |
1,824,484 | 1,836,986 | ||||||
| Total assets |
$ | 3,468,487 | $ | 3,256,705 | ||||
| Liabilities and Stockholders’ Equity |
||||||||
| Current liabilities: |
||||||||
| Accounts payable |
$ | 92,763 | $ | 92,571 | ||||
| Accrued expenses (note 9) |
186,295 | 156,805 | ||||||
| Deferred revenue |
51,918 | 50,009 | ||||||
| Income taxes payable |
29,150 | 39,166 | ||||||
| Short-term debt (note 11) |
- | 299,438 | ||||||
| Total current liabilities |
360,126 | 637,989 | ||||||
| Non-current liabilities: |
||||||||
| Deferred revenue |
53,235 | 40,281 | ||||||
| Deferred income taxes (note 14) |
13,822 | 9,061 | ||||||
| Other long-term liabilities |
2,427 | 1,211 | ||||||
| Long-term debt (note 11) |
1,078,611 | 873,332 | ||||||
| Total non-current liabilities |
1,148,095 | 923,885 | ||||||
| Total liabilities |
1,508,221 | 1,561,874 | ||||||
| Commitments and contingencies (notes 18 and 19) |
||||||||
| Stockholders’ equity: (note 12) |
||||||||
| Preferred stock, $0.01 par value, 2,000,000 shares authorized; none issued |
- | - | ||||||
| Common stock, $0.004 par value, 350,000,000 shares; 183,260,958 issued and 142,174,724 outstanding at June 30, 2017 and 181,747,157 issued and 140,660,923 outstanding at June 30, 2016 |
569 | 563 | ||||||
| Additional paid-in capital |
1,379,130 | 1,303,238 | ||||||
| Retained earnings |
2,316,237 | 2,160,299 | ||||||
| Treasury stock, at cost, 41,086,234 shares at June 30, 2017, and 41,086,234 shares at June 30, 2016 |
(1,546,611 | ) | (1,546,611 | ) | ||||
| Accumulated other comprehensive (loss) income |
(189,059 | ) | (222,658 | ) | ||||
| Total stockholders’ equity |
1,960,266 | 1,694,831 | ||||||
| Total liabilities and stockholders’ equity |
$ | 3,468,487 | $ | 3,256,705 | ||||
See accompanying notes to consolidated financial statements.
- F2 -
Table of Contents
Consolidated Statements of Income
Years Ended June 30, 2017, 2016 and 2015
(In thousands, except per share data)
| June 30, 2017 |
June 30, 2016 |
June 30, 2015 |
||||||||||
| Net revenue |
$ | 2,066,737 | $ | 1,838,713 | $ | 1,678,912 | ||||||
| Cost of sales (excluding amortization of acquired intangible assets) |
864,992 | 772,216 | 667,516 | |||||||||
| Gross profit |
1,201,745 | 1,066,497 | 1,011,396 | |||||||||
| Operating expenses: |
||||||||||||
| Selling, general and administrative |
553,968 | 488,057 | 478,627 | |||||||||
| Research and development |
144,467 | 118,651 | 114,865 | |||||||||
| Restructuring expenses (note 23) |
12,358 | 6,914 | - | |||||||||
| Litigation settlement expenses (note 24) |
8,500 | - | - | |||||||||
| Acquisition related expenses (note 20) |
10,076 | - | - | |||||||||
| Amortization of acquired intangible assets |
46,578 | 23,923 | 8,668 | |||||||||
| Total operating expenses |
775,947 | 637,545 | 602,160 | |||||||||
| Income from operations |
425,798 | 428,952 | 409,236 | |||||||||
| Other income, net: |
||||||||||||
| Interest income |
17,085 | 16,860 | 26,208 | |||||||||
| Interest expense |
(28,236 | ) | (11,206 | ) | (5,778 | ) | ||||||
| Other, net (note 13) |
4,096 | 4,960 | 6,250 | |||||||||
| Total other income, net |
(7,055 | ) | 10,614 | 26,680 | ||||||||
| Income before income taxes |
418,743 | 439,566 | 435,916 | |||||||||
| Income taxes (note 14) |
76,459 | 87,157 | 83,030 | |||||||||
| Net income |
$ | 342,284 | $ | 352,409 | $ | 352,886 | ||||||
| Basic earnings per share |
$ | 2.42 | $ | 2.51 | $ | 2.51 | ||||||
| Diluted earnings per share (note 4) |
$ | 2.40 | $ | 2.49 | $ | 2.47 | ||||||
| Dividend declared per share |
$ | 1.32 | $ | 1.20 | $ | 1.12 | ||||||
| Basic shares outstanding (000’s) |
141,360 | 140,242 | 140,468 | |||||||||
| Diluted shares outstanding (000’s) |
142,453 | 141,669 | 142,687 | |||||||||
See accompanying notes to consolidated financial statements.
- F3 -
Table of Contents
Consolidated Statements of Comprehensive Income
Years Ended June 30, 2017, 2016 and 2015
(In US$ thousands)
| Years Ended June 30, |
||||||||||||
| 2017 |
2016 |
2015 |
||||||||||
| Net income |
$ | 342,284 | $ | 352,409 | $ | 352,886 | ||||||
| Other comprehensive (loss) income: |
||||||||||||
| Foreign currency translation (loss) gain adjustments |
33,599 | (49,142 | ) | (325,073 | ) | |||||||
| Comprehensive income |
$ | 375,883 | $ | 303,267 | $ | 27,813 | ||||||
See accompanying notes to consolidated financial statements.
- F4 -
Table of Contents
Consolidated Statements of Stockholders’ Equity
Years ended June 30, 2017, 2016 and 2015
(In thousands)
|
Common Stock |
Additional Capital |
Treasury Stock |
Retained Earnings |
Accumulated Income (Loss) |
Total |
|||||||||||||||||||||||||||
| Shares | Amount | Shares | Amount | |||||||||||||||||||||||||||||
| Balance, June 30, 2014 |
176,747 | $ | 561 | $ | 1,117,644 | (36,442 | ) | $ | (1,291,910 | ) | $ | 1,780,396 | $ | 151,557 | $ | 1,758,248 | ||||||||||||||||
| Common stock issued on exercise of options (note 12) |
1,954 | 8 | 36,565 | 36,573 | ||||||||||||||||||||||||||||
| Common stock issued on vesting of restricted stock units, net of shares withheld for tax (note 12) |
651 | 3 | (11,406 | ) | (11,403 | ) | ||||||||||||||||||||||||||
| Common stock issued on employee stock purchase plan (note 12) |
309 | 1 | 13,412 | 13,413 | ||||||||||||||||||||||||||||
| Treasury stock purchases |
(11 | ) | (2,744 | ) | (152,644 | ) | (152,655 | ) | ||||||||||||||||||||||||
| Tax benefit from exercise of options |
24,868 | 24,868 | ||||||||||||||||||||||||||||||
| Stock-based compensation costs |
47,712 | 47,712 | ||||||||||||||||||||||||||||||
| Other comprehensive income |
(325,073 | ) | (325,073 | ) | ||||||||||||||||||||||||||||
| Net income |
352,886 | 352,886 | ||||||||||||||||||||||||||||||
| Dividends declared |
(157,262 | ) | (157,262 | ) | ||||||||||||||||||||||||||||
| Balance, June 30, 2015 |
179,661 | $ | 562 | $ | 1,228,795 | (39,186 | ) | $ | (1,444,554 | ) | $ | 1,976,020 | $ | (173,516 | ) | $ | 1,587,307 | |||||||||||||||
| Common stock issued on exercise of options (note 12) |
1,176 | 5 | 26,247 | 26,252 | ||||||||||||||||||||||||||||
| Common stock issued on vesting of restricted stock units, net of shares withheld for tax (note 12) |
619 | 3 | (12,388 | ) | (12,385 | ) | ||||||||||||||||||||||||||
| Common stock issued on employee stock purchase plan (note 12) |
291 | 1 | 14,081 | 14,082 | ||||||||||||||||||||||||||||
| Treasury stock purchases |
(8 | ) | (1,900 | ) | (102,057 | ) | (102,065 | ) | ||||||||||||||||||||||||
| Stock-based compensation costs |
46,503 | 46,503 | ||||||||||||||||||||||||||||||
| Other comprehensive income |
(49,142 | ) | (49,142 | ) | ||||||||||||||||||||||||||||
| Net income |
352,409 | 352,409 | ||||||||||||||||||||||||||||||
| Dividends declared |
(168,130 | ) | (168,130 | ) | ||||||||||||||||||||||||||||
| Balance, June 30, 2016 |
181,747 | $ | 563 | $ | 1,303,238 | (41,086 | ) | $ | (1,546,611 | ) | $ | 2,160,299 | $ | (222,658 | ) | $ | 1,694,831 | |||||||||||||||
| Common stock issued on exercise of options (note 12) |
740 | 3 | 22,246 | 22,249 | ||||||||||||||||||||||||||||
| Common stock issued on vesting of restricted stock units, net of shares withheld for tax (note 12) |
447 | 2 | (8,159 | ) | (8,157 | ) | ||||||||||||||||||||||||||
| Common stock issued on employee stock purchase plan (note 12) |
327 | 1 | 15,884 | 15,885 | ||||||||||||||||||||||||||||
| Treasury stock purchases |
- | |||||||||||||||||||||||||||||||
| Stock-based compensation costs |
45,921 | 45,921 | ||||||||||||||||||||||||||||||
| Other comprehensive income |
33,599 | 33,599 | ||||||||||||||||||||||||||||||
| Net income |
342,284 | 342,284 | ||||||||||||||||||||||||||||||
| Dividends declared |
(186,346 | ) | (186,346 | ) | ||||||||||||||||||||||||||||
| Balance, June 30, 2017 |
183,261 | $ | 569 | $ | 1,379,130 | (41,086 | ) | $ | (1,546,611 | ) | $ | 2,316,237 | $ | (189,059 | ) | $ | 1,960,266 | |||||||||||||||
See accompanying notes to consolidated financial statements.
- F5 -
Table of Contents
Consolidated Statements of Cash Flows
Years ended June 30, 2017, 2016 and 2015
(In thousands)
| June 30, 2017 |
June 30, 2016 |
June 30, 2015 |
||||||||||
| Cash flows from operating activities: |
||||||||||||
| Net income |
$ | 342,284 | $ | 352,409 | $ | 352,886 | ||||||
| Adjustment to reconcile net income to net cash provided by operating activities: |
||||||||||||
| Depreciation and amortization |
112,157 | 86,849 | 73,056 | |||||||||
| Stock-based compensation costs |
45,925 | 46,408 | 47,855 | |||||||||
| Impairment of long lived assets |
- | 2,815 | - | |||||||||
| Impairment of cost-method investments (note 8) |
1,955 | 750 | - | |||||||||
| Changes in fair value of business combination contingent consideration (note 20) |
10,076 | (2,986 | ) | (132 | ) | |||||||
| Payment of business combination contingent consideration (note 20) |
(8,460 | ) | - | - | ||||||||
| Gain on disposal of business |
- | - | (709 | ) | ||||||||
| Excess tax benefit from stock-based compensation arrangements |
- | - | (24,959 | ) | ||||||||
| Changes in operating assets and liabilities, net of effect of acquisitions: |
||||||||||||
| Accounts receivable, net |
(63,604 | ) | (27,307 | ) | (28,259 | ) | ||||||
| Inventories, net |
(41,599 | ) | 30,492 | (99,524 | ) | |||||||
| Prepaid expenses, net deferred income taxes and other current assets |
(19,257 | ) | 12,121 | (22,849 | ) | |||||||
| Accounts payable, accrued expenses and other liabilities |
34,576 | 46,382 | 85,815 | |||||||||
| Net cash provided by operating activities |
414,053 | 547,933 | 383,180 | |||||||||
| Cash flows from investing activities: |
||||||||||||
| Purchases of property, plant and equipment |
(62,219 | ) | (58,534 | ) | (62,502 | ) | ||||||
| Patent registration costs |
(9,257 | ) | (9,295 | ) | (9,442 | ) | ||||||
| Business acquisitions, net of cash acquired |
(7,274 | ) | (1,041,864 | ) | (29,407 | ) | ||||||
| Investments in cost-method investments |
(6,464 | ) | (8,965 | ) | (10,750 | ) | ||||||
| Proceeds from disposal of cost-method investments |
- | 468 | 937 | |||||||||
| Purchases of foreign currency contracts |
- | - | (700 | ) | ||||||||
| (Payment)/proceeds on maturity of foreign currency contracts |
3,324 | (7,564 | ) | (31,207 | ) | |||||||
| Net cash used in investing activities |
(81,890 | ) | (1,125,754 | ) | (143,071 | ) | ||||||
| Cash flows from financing activities: |
||||||||||||
| Proceeds from issuance of common stock, net |
30,161 | 27,694 | 38,806 | |||||||||
| Excess tax benefit from stock-based compensation arrangements |
- | - | 24,959 | |||||||||
| Purchases of treasury stock |
- | (102,058 | ) | (160,300 | ) | |||||||
| Payment of business combination contingent consideration (note 20) |
(11,682 | ) | (1,228 | ) | (458 | ) | ||||||
| Proceeds from borrowings, net of borrowing costs |
450,000 | 1,140,000 | 180,000 | |||||||||
| Repayment of borrowings |
(545,000 | ) | (283,694 | ) | (181,536 | ) | ||||||
| Dividends paid |
(186,346 | ) | (168,130 | ) | (157,262 | ) | ||||||
| Net cash (used in) provided by financing activities |
(262,867 | ) | 612,584 | (255,791 | ) | |||||||
| Effect of exchange rate changes on cash |
21,205 | (20,578 | ) | (172,799 | ) | |||||||
| Net increase (decrease) in cash and cash equivalents |
90,501 | 14,185 | (188,481 | ) | ||||||||
| Cash and cash equivalents at beginning of period |
731,434 | 717,249 | 905,730 | |||||||||
| Cash and cash equivalents at end of period |
$ | 821,935 | $ | 731,434 | $ | 717,249 | ||||||
| Supplemental disclosure of cash flow information: |
||||||||||||
| Income taxes paid, net of refunds |
$ | 92,901 | $ | 68,966 | $ | 48,533 | ||||||
| Interest paid |
$ | 28,236 | $ | 11,206 | $ | 5,778 | ||||||
| Fair value of assets acquired, excluding cash |
$ | 10,460 | $ | 338,353 | $ | 20,408 | ||||||
| Liabilities assumed |
(877 | ) | (79,808 | ) | (8,528 | ) | ||||||
| Goodwill on acquisition |
(645 | ) | 796,306 | 20,947 | ||||||||
| Deferred payments |
(84 | ) | 120 | (1,703 | ) | |||||||
| Fair value of contingent consideration |
(1,580 | ) | (13,107 | ) | (1,717 | ) | ||||||
| Cash paid for acquisition |
$ | 7,274 | $ | 1,041,864 | $ | 29,407 | ||||||
See accompanying notes to consolidated financial statements.
- F6 -
Table of Contents
Notes to Consolidated Financial Statements
| (1) | Organization and Basis of Presentation |
ResMed Inc. (referred to herein as “we”, “us”, “our” or the “Company”) is a Delaware corporation formed in March 1994 as a holding company for the ResMed Group. Through our subsidiaries, we design, manufacture and market equipment for the diagnosis and treatment of sleep-disordered breathing and other respiratory disorders, including obstructive sleep apnea. Our manufacturing operations are located in Australia, Singapore, Malaysia, France and the United States. Major distribution and sales sites are located in the United States, Germany, France, the United Kingdom, Switzerland, Australia, Japan, China, Norway and Sweden.
| (2) | Summary of Significant Accounting Policies |
| (a) | Basis of Consolidation |
The consolidated financial statements include the accounts of the Company and its wholly owned subsidiaries. All significant inter-company transactions and balances have been eliminated in consolidation.
The preparation of financial statements in conformity with U.S. generally accounting principles requires management estimates and assumptions that affect amounts reported in the consolidated financial statements and accompanying notes. Actual results could differ from management’s estimates.
| (b) | Revenue Recognition |
We generally record revenue on product sales at the time of shipment, which is when title transfers to the customer. We do not record revenue on product sales which require customer acceptance until we receive acceptance. We initially defer service revenue received in advance from service contracts and recognize that deferred revenue ratably over the life of the service contract. We initially defer revenue we receive in advance from rental unit contracts and recognize that deferred revenue ratably over the life of the rental contract. Otherwise, we recognize revenue from rental unit contracts ratably over the life of the rental contract. We include in revenue freight charges we bill to customers. We charge all freight-related expenses to cost of sales. Taxes assessed by government authorities that are imposed on and concurrent with revenue-producing transactions, such as sales and value added taxes, are excluded from revenue.
We do not recognize revenues to the extent that we offer a right of return or other recourse with respect to the sale of our products, other than returns for product defects or other warranty claims, nor do we recognize revenues if we offer variable sale prices for subsequent events or activities. However, as part of our sales processes we may provide upfront discounts for large orders, one-time special pricing to support new product introductions, sales rebates for centralized purchasing entities or price-breaks for regular order volumes. We record the costs of all such programs as an adjustment to revenue at the time the related revenue is recognized. Our products are predominantly therapy-based equipment and require no installation. Therefore, we have no installation obligations. For multiple-element arrangements, we allocate arrangement consideration to the deliverables by use of the relative selling price method. The selling price used for each deliverable is based on vendor–specific objective evidence.
We also generate revenue from time-based licensing of our software and associated services. In most instances, revenue is generated under sales agreements with multiple elements comprising subscription fees and professional services, which typically have contract terms of one to three years. We evaluate each element in these multiple-element arrangements to determine whether they represent a separate unit of accounting and recognize each element as the services are performed.
- F7 -
Table of Contents
RESMED INC. AND SUBSIDIARIES
Notes to Consolidated Financial Statements
| (2) | Summary of Significant Accounting Policies, Continued |
| (c) | Cash and Cash Equivalents |
Cash equivalents include certificates of deposit and other highly liquid investments and we state them at cost, which approximates market. We consider investments with original maturities of 90 days or less to be cash equivalents for purposes of the consolidated statements of cash flows.
Our cash and cash equivalents balance at June 30, 2017, include $276.5 million in cash which is subject to notice periods of up to 90 days. These cash balances earn interest rates above normal term deposit rates otherwise available and are held at highly rated financial institutions.
| (d) | Inventories |
We state inventories at the lower of cost (determined principally by the first-in, first-out method) or net realizable value. We include material, labor and manufacturing overhead costs in finished goods and work-in-process inventories. We review and provide for any product obsolescence in our manufacturing and distribution operations by assessing throughout the year individual products and components (based on estimated future usage and sales).
| (e) | Property, Plant and Equipment |
We record property, plant and equipment, including rental and demonstration equipment at cost. We compute depreciation expense using the straight-line method over the estimated useful lives of the assets. Useful lives are generally two to ten years except for buildings which are depreciated over an estimated useful life of 40 years and leasehold improvements, which we amortize over the lease term. We charge maintenance and repairs to expense as we incur them.
| (f) | Intangible Assets |
We capitalize the registration costs for new patents and amortize the costs over the estimated useful life of the patent, which is generally five years. If a patent is superseded or a product is retired, any unamortized costs are written off immediately.
We amortize all of our other intangible assets on a straight-line basis over their estimated useful lives, which range from two to fifteen years. We evaluate the recoverability of intangible assets periodically and take into account events or circumstances that warrant revised estimates of useful lives or that indicate that impairment exists. We have not identified any impairment of intangible assets during any of the periods presented.
| (g) | Goodwill |
We conducted our annual review for goodwill impairment during the final quarter of the year ended June 30, 2017. Our goodwill impairment tests are performed at our reporting unit level which is one level below our operating segment. Fair value is determined based on estimated discounted cash flows. Our goodwill impairment review involved the following steps:
Step 0 or Qualitative assessment – Evaluate qualitative factors to determine whether it is more likely than not that the fair value of a reporting unit is less than its carrying amount, including goodwill. Factors considered included, but were not limited to, macroeconomic conditions, industry and market considerations, cost factors, overall financial performance or events-specific to that reporting unit. If or when we determine it is more likely than not that the fair value of a reporting unit is less than the carrying amount, including goodwill, we would move to Step 1 of the quantitative method.
- F8 -
Table of Contents
RESMED INC. AND SUBSIDIARIES
Notes to Consolidated Financial Statements
| (2) | Summary of Significant Accounting Policies, Continued |
Step 1 - Compare the fair value for each reporting unit to its carrying value, including goodwill. For each reporting unit where the carrying value, including goodwill, exceeds the reporting unit’s fair value, move on to Step 2. If a reporting unit’s fair value exceeds the carrying value, no further work is performed and no impairment charge is necessary.
Step 2 - Allocate the fair value of the reporting unit to its identifiable tangible and non-goodwill intangible assets and liabilities. This will derive an implied fair value for the goodwill. Then, compare the implied fair value of the reporting unit’s goodwill with the carrying amount of the reporting unit’s goodwill. If the carrying amount of the reporting unit’s goodwill is greater than the implied fair value of its goodwill, an impairment loss must be recognized for the excess.
The results of our review indicated that no impaired goodwill exists as the fair value for each reporting unit exceeded its carrying value.
| (h) | Foreign Currency |
The consolidated financial statements of our non-U.S. subsidiaries, whose functional currencies are other than the U.S. dollar, are translated into U.S. dollars for financial reporting purposes. We translate assets and liabilities of non-U.S. subsidiaries whose functional currencies are other than the U.S. dollar at period end exchange rates, but translate revenue and expense transactions at average exchange rates for the period. We recognize cumulative translation adjustments as part of comprehensive income, as detailed in the consolidated statements of comprehensive income, and include those adjustments in accumulated other comprehensive income in the consolidated balance sheets until such time the relevant subsidiary is sold or substantially or completely liquidated. We reflect gains and losses on transactions denominated in other than the functional currency of an entity in our results of operations.
| (i) | Research and Development |
We record all research and development expenses in the period we incur them.
| (j) | Financial Instruments |
The carrying value of financial instruments, such as cash equivalents, accounts receivable and accounts payable, approximate their fair value because of their short-term nature. The carrying value of long-term debt approximates its fair value as the principal amounts outstanding are subject to variable interest rates that are based on market rates which are regularly reset. Foreign currency hedging instruments are marked to market and therefore reflect their fair value. We do not hold or issue financial instruments for trading purposes.
The fair value of financial instruments is the price that would be received to sell an asset or paid to transfer a liability in an orderly transaction between market participants at the measurement date.
| (k) | Foreign Exchange Risk Management |
We enter into various types of foreign exchange contracts in managing our foreign exchange risk, including derivative financial instruments encompassing forward exchange contracts and foreign currency options.
- F9 -
Table of Contents
RESMED INC. AND SUBSIDIARIES
Notes to Consolidated Financial Statements
| (2) | Summary of Significant Accounting Policies, Continued |
The purpose of our foreign currency hedging activities is to protect us from adverse exchange rate fluctuations with respect to net cash movements resulting from the sales of products to foreign customers and Australian and Singapore manufacturing activities. We enter into foreign exchange contracts to hedge anticipated sales and manufacturing costs, principally denominated in Australian and Singapore dollars, and Euros. The terms of such foreign exchange contracts generally do not exceed three years.
We have determined our hedge program to be a non-effective hedge as defined. We record the foreign currency derivatives portfolio at fair value and include it in other assets and accrued expenses in our consolidated balance sheets. We do not offset the fair value amounts recognized for foreign currency derivatives. We classify purchases of foreign currency derivatives and proceeds received from the exercise of foreign currency derivatives as an investing activity within our consolidated statements of cash flows.
We record all movements in the fair value of the foreign currency derivatives within other income, net in our consolidated statements of income.
| (l) | Income Taxes |
We account for income taxes under the asset and liability method. We recognize deferred tax assets and liabilities for the future tax consequences attributable to differences between the financial statement carrying amounts of existing assets and liabilities and their respective tax bases. We measure deferred tax assets and liabilities using the enacted tax rates we expect to apply to taxable income in the years in which those temporary differences are expected to be recovered or settled. The effect on deferred tax assets and liabilities of a change in tax rates is recognized in income in the period that includes the enactment date.
| (m) | Provision for Warranty |
We provide for the estimated cost of product warranties at the time the related revenue is recognized. We determine the amount of this provision by using a financial model, which takes into consideration actual historical expenses and potential risks associated with our different products. We use this financial model to calculate the future probable expenses related to warranty and the required level of the warranty provision. Although we engage in product improvement programs and processes, our warranty obligation is affected by product failure rates and costs incurred to correct those product failures. Should actual product failure rates or estimated costs to repair those product failures differ from our estimates, we would be required to revise our estimated warranty provision.
| (n) | Allowance for Doubtful Accounts |
We maintain an allowance for doubtful accounts for estimated losses resulting from the inability of our customers to make required payments, which results in bad debt expense. We determine the adequacy of this allowance by periodically evaluating individual customer receivables, considering a customer’s financial condition, credit history and current economic conditions. We are also contingently liable, within certain limits, in the event of a customer default, to independent leasing companies in connection with customer leasing programs. We monitor the collection status of these installment receivables and provide for estimated losses separately under accrued expenses within our consolidated balance sheets based upon our historical collection experience with such receivables and a current assessment of our credit exposure.
- F10 -
Table of Contents
RESMED INC. AND SUBSIDIARIES
Notes to Consolidated Financial Statements
| (2) | Summary of Significant Accounting Policies, Continued |
| (o) | Impairment of Long-Lived Assets |
We periodically evaluate the carrying value of long-lived assets to be held and used, including certain identifiable intangible assets, when events and circumstances indicate that the carrying amount of an asset may not be recovered. Recoverability of assets to be held and used is measured by a comparison of the carrying amount of an asset to future net cash flows expected to be generated by the asset. If assets are considered to be impaired, we recognize as the impairment the amount by which the carrying amount of the assets exceeds the fair value of the assets. We report assets to be disposed of at the lower of the carrying amount or fair value less costs to sell.
We did not recognize impairment charges in relation to long-lived assets during the fiscal years ended June 30, 2017 and 2015, but during the fiscal year ended June 30, 2016, we recognized $2.8 million of impairment charges.
| (p) | Contingencies |
We record a liability in the consolidated financial statements for loss contingencies when a loss is known or considered probable and the amount can be reasonably estimated. If the reasonable estimate of a known or probable loss is a range, and no amount within the range is a better estimate than any other, the minimum amount of the range is accrued. If a loss is reasonably possible but not known or probable, and can be reasonably estimated, the estimated loss or range of loss is disclosed. When determining the estimated loss or range of loss, significant judgment is required to estimate the amount and timing of a loss to be recorded.
| (3) | New Accounting Pronouncements |
| (a) | Recently issued accounting standards not yet adopted |
ASU No. 2014-09, “Revenue from Contracts with Customers”
In May, 2014, the FASB issued Accounting Standards Update (ASU), ASU No. 2014-09, “Revenue from Contracts with Customers” (Topic 606), which requires an entity to recognize the amount of revenue to which it expects to be entitled for the transfer of promised goods or services to customers. Since its initial release, the FASB has issued several amendments to the standard, which include clarification of accounting guidance related to identification of performance obligations, intellectual property licenses, and principal vs. agent considerations. ASU 2014-09 and all subsequent amendments (collectively, the “new revenue recognition standards”) will replace most existing revenue recognition guidance in U.S. GAAP when it becomes effective. The guidance also requires improved disclosures on the nature, amount, timing, and uncertainty of revenue that is recognized.
We formed an implementation team in fiscal year June 30, 2017 to oversee adoption of the new revenue recognition standards. The implementation team has commenced the diagnostic phase of its project which has included composition and detailed review of our contract portfolio and selection of sample contracts for assessment which, we expect to complete in the second quarter of the year ending June 30, 2018. There are a number of steps in the team’s project plan that remain to be completed including: finalizing contract reviews, evaluating the impact, and working through required changes to systems, business processes and controls to support the adoption of the new revenue recognition standards. We expect there will be changes to our accounting policies to align with terminology and concepts in the new revenue recognition standards as well as increased disclosures relating to our revenue streams, contract-related balances and contract details.
- F11 -
Table of Contents
RESMED INC. AND SUBSIDIARIES
Notes to Consolidated Financial Statements
| (3) | New Accounting Pronouncements, Continued |
The new revenue recognition standard is effective for us beginning in the first quarter of the fiscal year ending June 30, 2019 and early application is permitted for annual or interim periods beginning after December 15, 2016. The new guidance can be applied retrospectively to each prior reporting period presented, or retrospectively with the cumulative effect of the change recognized at the date of the initial application. Assuming the impact is not material, we expect to adopt the new revenue recognition standards using the modified retrospective method with an adjustment to beginning retained earnings for the cumulative effect of the change.
ASU No. 2016-01, “Financial Instruments—Overall”
In January 2016, the FASB issued Accounting Standards Update ASU No. 2016-01, “Financial Instruments—Overall” (Topic 825-10). The amendments address certain aspects of recognition, measurement, presentation, and disclosure of financial instruments, and require equity securities to be measured at fair value with changes in fair value recognized through net income. The amendments also simplify the impairment assessment of equity investments without readily determinable fair values by requiring a qualitative assessment for impairment quarterly at each reporting period. The amendments in ASU 2016-01 will be effective for our first quarter of the fiscal year ending June 30, 2019. An entity should apply the amendments by means of a cumulative-effect adjustment to the balance sheet as of the beginning of the fiscal year of adoption, with prospective adoption of the amendments related to equity securities without readily determinable fair values existing as of the date of adoption. We are currently assessing the impact as this standard will be relevant for our Cost-Method Investments.
ASU No. 2016-02, “Leases”
In February 2016, the FASB issued Accounting Standard Update ASU No. 2016-02, “Leases” (Topic 842). Under the new guidance, lessees are required to recognize a right-of-use asset and a lease liability on the balance sheet for all leases, other than those that meet the definition of a short-term lease. This update will establish a lease asset and lease liability by lessees for those leases classified as operating under current GAAP. Leases will be classified as either operating or finance under the new guidance. Operating leases will result in straight-line expense in the income statement, similar to current operating leases, and finance leases will result in more expense being recognized in the earlier years of the lease term, similar to current capital leases. For lessors, the update will more closely align lease accounting to comparable guidance in the new revenue standards described.
The new standard is effective for us beginning in the first quarter of the fiscal year ending June 30, 2020 and early application is not permitted. ASU 2016-02 will be adopted on a modified retrospective transition basis for leases existing at, or entered into after, the beginning of the earliest comparative period presented in the financial statements. We are currently evaluating the impact of this standard on its consolidated financial statements and expect to commence an implementation project during the fiscal year ending June 30, 2018. While the formal impact assessment has not commenced, we expect this amendment will affect the way we account for operating leases where we are the lessee (as described above), require reassessment of how we account for revenue where we are the lessor and will result in increased disclosures for all lease arrangements.
ASU No. 2016-16, “Income Taxes: Intra-Entity Transfers of Assets Other Than Inventory”
In October 2016, the FASB issued Accounting Standard Update ASU No. 2016-16, “Income Taxes: Intra-Entity Transfers of Assets Other Than Inventory” (Topic 740). Under the new guidance, an entity is required to recognize the income tax consequences of an intra-entity transfer of an asset other than inventory when the transfer occurs and eliminates the exception for an intra-entity transfer of an asset other than inventory. ASU 2016-16 will be effective for the first quarter of our fiscal year ending June 30, 2019, with early adoption permitted. If we enter into transactions within the scope of the standard, it could result in additional deferred tax balances being recognized at the time of the transfer.
- F12 -
Table of Contents
RESMED INC. AND SUBSIDIARIES
Notes to Consolidated Financial Statements
| (3) | New Accounting Pronouncements, Continued |
| (b) | Recently adopted accounting pronouncements |
ASU No. 2015-03, “Simplifying the Presentation of Debt Issuance Costs”
In April, 2015, the FASB issued ASU No. 2015-03, “Simplifying the Presentation of Debt Issuance Costs”. ASU 2015-03 more closely aligns the presentation of debt issuance costs under U.S. GAAP with the presentation under comparable International Financial Reporting Standards, or IFRS, by requiring that debt issuance costs be presented on the balance sheet as a direct deduction from the carrying amount of the related debt liability. As of July 1, 2016, we adopted ASU No. 2015-03, “Simplifying the Presentation of Debt Issuance Costs” which amended ASC 835-30, Interest – Imputation of Interest. As a result of the adoption, $2.2 million was reclassified from other assets and $0.6 million and $1.6 million we recognised in short-term debt and long-term debt, respectively in the company’s consolidated balance sheet as of June 30, 2016. The adoption of this guidance did not impact the company’s consolidated statements of income, comprehensive income, stockholders’ equity or cash flows.
ASU No. 2015-11, “Simplifying the Measurement of Inventory”
In July 2015, the FASB issued ASU No. 2015-11, “Simplifying the Measurement of Inventory” which requires an entity to measure inventory within the scope of this ASU at the lower of cost and net realizable value. Net realizable value is the estimated selling prices in the ordinary course of business, less reasonably predictable costs of completion, disposal, and transportation. The amendments in this guidance more closely align the measurement of inventory in GAAP with the measurement of inventory in IFRS. This accounting guidance was effective for us beginning in the first quarter of our fiscal year ending, June 30, 2018, however we have elected to early-adopt this amendment which can only be adopted on a prospective basis. There has been no impact on our consolidated financial statements and related disclosures as a result of this adoption.
ASU 2016-09, “Improvements to Employee Share-Based Payment Accounting”
On March 30, 2016, the FASB issued ASU 2016-09, “Improvements to Employee Share-Based Payment Accounting”, which requires companies to recognize additional tax benefits or expenses related to the vesting or settlement of employee share-based awards (the difference between the actual benefit for tax purposes and the tax benefit initially recognized for financial reporting purposes) as income tax benefit or expense in earnings, rather than in additional paid-in capital, in the reporting period in which they occur. This ASU also requires companies to classify cash flows resulting from employee share-based payments, including the additional tax benefits or expenses related to the vesting or settlement of share-based awards, as cash flows from operating activities rather than financing activities. Although this change will reduce some of the administrative complexities of tracking share-based awards, it will increase the volatility of our income tax expense and cash flows from operations. The new standard is effective for annual reporting periods beginning after December 15, 2016, with early adoption permitted. We elected to early adopt this ASU during the fourth quarter of fiscal year 2016 and were therefore required to report the impacts as though the ASU had been adopted on July 1, 2015, the beginning of our fiscal year, and to reflect the tax benefit as a discrete item within each of the respective interim reporting periods. Accordingly, we recognized additional income tax benefits as an increase to earnings of $6.1 million and $11.2 million during the years ended June 30, 2017 and June 30, 2016, respectively. We also recognized additional income tax benefits as an increase to operating cash flows of $9.2 million and $14.5 million for the years ended June 30, 2017 and June 30, 2016, respectively. The new accounting standard did not impact any periods prior to July 1, 2015, as we applied the changes on a prospective basis.
- F13 -
Table of Contents
RESMED INC. AND SUBSIDIARIES
Notes to Consolidated Financial Statements
| (4) | Earnings Per Share |
We compute basic earnings per share by dividing the net income available to common stockholders by the weighted average number of shares of common stock outstanding. For purposes of calculating diluted earnings per share, the denominator includes both the weighted average number of shares of common stock outstanding and the number of dilutive common stock equivalents such as stock options and restricted stock units.
The weighted average number of outstanding stock options and restricted stock units not included in the computation of diluted earnings per share were 173,000, 297,000 and 62,000 for the years ended June 30, 2017, 2016 and 2015, respectively, as the effect would have been anti-dilutive.
Basic and diluted earnings per share for the years ended June 30, 2017, 2016 and 2015 are calculated as follows (in thousands except per share data):
| 2017 | 2016 | 2015 | ||||||||||
| Numerator: |
||||||||||||
| Net Income, used in calculating diluted earnings per share |
$ | 342,284 | $ | 352,409 | $ | 352,886 | ||||||
| Denominator: |
||||||||||||
| Basic weighted-average common shares outstanding |
141,360 | 140,242 | 140,468 | |||||||||
| Effect of dilutive securities: |
||||||||||||
| Stock options and restricted stock units |
1,093 | 1,427 | 2,219 | |||||||||
| Diluted weighted average shares |
142,453 | 141,669 | 142,687 | |||||||||
| Basic earnings per share |
$ | 2.42 | $ | 2.51 | $ | 2.51 | ||||||
| Diluted earnings per share |
$ | 2.40 | $ | 2.49 | $ | 2.47 | ||||||
| (5) | Inventories |
Inventories were comprised of the following as of June 30, 2017 and June 30, 2016 (in thousands):
| 2017 | 2016 | |||||||
| Raw materials |
$ | 75,658 | $ | 67,121 | ||||
| Work in progress |
4,297 | 3,939 | ||||||
| Finished goods |
188,364 | 153,396 | ||||||
| Total inventories |
$ | 268,319 | $ | 224,456 | ||||
- F14 -
Table of Contents
RESMED INC. AND SUBSIDIARIES
Notes to Consolidated Financial Statements
| (6) | Property, Plant and Equipment, net |
Property, plant and equipment, net is comprised of the following as of June 30, 2017 and June 30, 2016 (in thousands):
| 2017 | 2016 | |||||||
| Machinery and equipment |
$ | 230,632 | $ | 197,485 | ||||
| Computer equipment |
154,032 | 154,105 | ||||||
| Furniture and fixtures |
47,074 | 40,776 | ||||||
| Vehicles |
7,667 | 9,060 | ||||||
| Clinical, demonstration and rental equipment |
86,024 | 79,641 | ||||||
| Leasehold improvements |
35,932 | 33,795 | ||||||
| Land |
55,311 | 54,338 | ||||||
| Buildings |
233,868 | 229,502 | ||||||
| 850,540 | 798,702 | |||||||
| Accumulated depreciation and amortization |
(456,299 | ) | (414,426 | ) | ||||
| Property, plant and equipment, net |
$ | 394,241 | $ | 384,276 | ||||
| (7) | Goodwill and Other Intangible Assets, net |
Goodwill
Changes in the carrying amount of goodwill for the years ended June 30, 2017 and June 30, 2016 (in thousands):
| 2017 | 2016 | |||||||
| Balance at the beginning of the period |
$ | 1,059,245 | $ | 264,261 | ||||
| Business acquisitions (note 22) |
(645 | ) | 796,306 | |||||
| Foreign currency translation adjustments |
6,274 | (1,322 | ) | |||||
| Balance at the end of the period |
$ | 1,064,874 | $ | 1,059,245 | ||||
For each of the years ended June 30, 2017 and June 30, 2016, we have not recorded any goodwill impairments.
- F15 -
Table of Contents
RESMED INC. AND SUBSIDIARIES
Notes to Consolidated Financial Statements
| (7) | Goodwill and Other Intangible Assets, net, Continued |
Other Intangible Assets
Other intangibles, net are comprised of the following as of June 30, 2017 and June 30, 2016 (in thousands):
| 2017 | 2016 | |||||||
| Developed/core product technology |
$ | 206,258 | $ | 202,050 | ||||
| Accumulated amortization |
(93,079 | ) | (63,825 | ) | ||||
| Developed/core product technology, net |
113,179 | 138,225 | ||||||
| Trade names |
48,768 | 47,897 | ||||||
| Accumulated amortization |
(10,894 | ) | (3,832 | ) | ||||
| Trade names, net |
37,874 | 44,065 | ||||||
| Non-compete agreements |
3,660 | 3,089 | ||||||
| Accumulated amortization |
(2,236 | ) | (1,899 | ) | ||||
|
Non-compete agreements, net |
1,424 | 1,190 | ||||||
| Customer relationships |
122,458 | 118,528 | ||||||
| Accumulated amortization |
(40,050 | ) | (26,783 | ) | ||||
| Customer relationships, net |
82,408 | 91,745 | ||||||
|
In-process research and development |
4,100 | 4,100 | ||||||
|
In-process research and development, net |
4,100 | 4,100 | ||||||
| Patents |
85,780 | 74,034 | ||||||
| Accumulated amortization |
(62,965 | ) | (53,551 | ) | ||||
| Patents, net |
22,815 | 20,483 | ||||||
| Total other intangibles, net |
$ | 261,800 | $ | 299,808 | ||||
Intangible assets consist of developed/core product technology, trade names, non-compete agreements, customer relationships, and patents, and we amortize them over the estimated useful life of the assets, generally between two and fifteen years. There are no expected residual values related to these intangible assets. In-process research and development is amortized over the estimated the useful life of the assets, once the research and development efforts are completed. At least on an annual basis, we evaluate the in-process research and development balances for impairment.
Refer to note 22 of the consolidated financial statements for details of acquisitions made during the year.
- F16 -
Table of Contents
RESMED INC. AND SUBSIDIARIES
Notes to Consolidated Financial Statements
| (7) | Goodwill and Other Intangible Assets, net, Continued |
Amortization expense related to identifiable intangible assets, including patents, for the year ended June 30, 2017 was $46.6 million. Estimated annual amortization expense for the years ending June 30, 2018 through June 30, 2022, is shown below (in thousands):
| Fiscal Year | Amortization expense | |||
| 2018 |
$ | 53,761 | ||
| 2019 |
51,705 | |||
| 2020 |
46,610 | |||
| 2021 |
38,623 | |||
| 2022 |
29,397 | |||
| (8) | Cost-Method Investments |
The aggregate carrying amount of our cost-method investments at June 30, 2017 and June 30, 2016, included within our other long-term assets on our consolidated balance sheets, was $38.3 million and $33.8 million, respectively.
We periodically evaluate the carrying value of our cost-method investments, when events and circumstances indicate that the carrying amount of an asset may not be recovered. We determine the fair value of our cost-method investments to evaluate whether impairment losses shall be recorded using Level 3 inputs. These investments include our holdings in privately held service and research companies that are not exchange traded and therefore not supported with observable market prices. However, these investments are valued by reference to their net asset values which can be market supported and unobservable inputs including future cash flows. We have determined, that the fair value of our cost-method investments exceed their carrying values.
The following table shows a reconciliation of the changes in our cost-method investments during the years ended June 30, 2017 and June 30, 2016 (in thousands):
| 2017 | 2016 | |||||||
| Balance at the beginning of the period |
$ | 33,815 | $ | 25,600 | ||||
| Investments |
6,464 | 8,965 | ||||||
| Impairment of investments |
(1,955 | ) | (750 | ) | ||||
| Balance at the end of the period |
$ | 38,324 | $ | 33,815 | ||||
- F17 -
Table of Contents
RESMED INC. AND SUBSIDIARIES
Notes to Consolidated Financial Statements
| (9) | Accrued Expenses |
Accrued expenses at June 30, 2017 and June 30, 2016 consist of the following (in thousands):
| 2017 | 2016 | |||||||
| Product warranties |
$ | 19,558 | $ | 15,043 | ||||
| Consulting and professional fees |
10,506 | 11,948 | ||||||
| Value added taxes and other taxes due |
18,228 | 14,769 | ||||||
| Employee related costs |
100,410 | 83,407 | ||||||
| Marketing and promotional programs |
2,661 | 2,401 | ||||||
| Business acquisition contingent consideration |
651 | 10,450 | ||||||
| Hedging instruments |
460 | 243 | ||||||
| Liability on receivables sold with recourse (note 19) |
18,068 | 4,615 | ||||||
| Accrued interest |
1,050 | 1,271 | ||||||
| Other |
14,703 | 12,658 | ||||||
| $ | 186,295 | $ | 156,805 | |||||
| (10) | Product Warranties |
We include the liability for warranty costs in accrued expenses in our consolidated balance sheets. Changes in the liability for product warranty for the years ended June 30, 2017 and June 30, 2016 are as follows (in thousands):
| 2017 | 2016 | |||||||
| Balance at the beginning of the period |
$ | 15,043 | $ | 9,823 | ||||
| Fair value of warranty obligations acquired on business combination |
- | 971 | ||||||
| Warranty accruals for the period |
19,805 | 15,014 | ||||||
| Warranty costs incurred for the period |
(15,489 | ) | (10,667 | ) | ||||
| Foreign currency translation adjustments |
199 | (98 | ) | |||||
| Balance at the end of the period |
$ | 19,558 | $ | 15,043 | ||||
| (11) | Debt |
Debt at June 30, 2017 and June 30, 2016 consists of the following (in thousands):
| June 30, 2017 | June 30, 2016 | |||||||
| Short-term debt |
$ | - | $ | 300,000 | ||||
| Deferred borrowing costs |
- | (562 | ) | |||||
| Short-term debt, net |
- | 299,438 | ||||||
| Long-term debt |
1,080,000 | 875,000 | ||||||
| Deferred borrowing costs |
(1,389 | ) | (1,668 | ) | ||||
| Long-term debt, net |
1,078,611 | 873,332 | ||||||
| Total debt |
$ | 1,078,611 | $ | 1,172,770 | ||||
- F18 -
Table of Contents
RESMED INC. AND SUBSIDIARIES
Notes to Consolidated Financial Statements
| (11) | Debt, Continued |
Credit Facility
On October 31, 2013, we entered into a revolving credit agreement, as borrower, with lenders, including Union Bank, N.A., as administrative agent, joint lead arranger, swing line lender and letters of credit issuer, and HSBC Bank USA, National Association, as syndication agent and joint lead arranger, providing for a revolving credit facility of $700 million, with an uncommitted option to increase the revolving credit facility by an additional $300 million. On April 4, 2016, in connection with our acquisition of Brightree LLC (“Brightree”), we entered into a first amendment to the revolving credit agreement to increase the size of the revolving credit facility from $700 million to $1 billion, with an uncommitted option to increase the revolving credit facility by an additional $300 million, and to make other modifications to provide for the acquisition of Brightree. On January 9, 2017, we entered into a second amendment to our agreement with our existing lenders, including MUFG Union Bank, N.A. as successor in interest to Union Bank, N.A., as Administrative Agent, Joint Lead Arranger, Swing Line Lender and L/C Issuer; and HSBC Bank USA, National Association, as Syndication Agent and Joint Lead Arranger. The second amendment, among other things, increases the size of our senior unsecured revolving credit facility from $1.0 billion to $1.3 billion, with an uncommitted option to increase the revolving credit facility by an additional $300 million. The credit facility terminates on October 31, 2018, when all unpaid principal and interest under the loans must be repaid. The outstanding principal amount due under the credit facility will bear interest at a rate equal to LIBOR plus 1.0% to 2.0% (depending on the then-applicable leverage ratio). At June 30, 2017, the interest rate that was being charged on the outstanding principal amount was 2.7%. A commitment fee of 0.15% to 0.25% (depending on the then-applicable leverage ratio) applies on the unused portion of the credit facility. The credit facility also includes a $25 million sublimit for letters of credit.
Our obligations under the revolving credit agreement (as amended) are unsecured but are guaranteed by certain of our direct and indirect U. S. subsidiaries, including ResMed Corp., ResMed Motor Technologies Inc., Birdie Inc., Inova Labs, Inc., Brightree, Brightree Services LLC, Brightree Home Health & Hospice LLC and Strategic AR LLC, under an unconditional guaranty. The credit agreement contains customary covenants, including certain financial covenants and an obligation that we maintain certain financial ratios, including a maximum leverage ratio of funded debt to EBITDA (as defined in the credit agreement) and an interest coverage ratio.
At June 30, 2017, we were in compliance with our debt covenants and there was $1,080.0 million outstanding under the revolving credit facility. We expect to satisfy all of our liquidity requirements through a combination of cash on hand, cash generated from operations and debt facilities.
Term Loan
On April 4, 2016, in connection with the Brightree acquisition, we also entered into the term loan credit agreement providing a $300 million senior unsecured one-year term loan credit facility.
The proceeds from the funding of the term loan credit facility were used to pay a portion of the acquisition consideration for the Brightree acquisition, as well as to pay fees and expenses in connection with the acquisition, the amendment to the revolving credit agreement and the term loan credit agreement. On March 30, 2017 we drew down $300 million from the revolving credit facility to pay off all outstanding amounts under the term loan credit facility, in advance of the scheduled termination of the term loan credit facility on April 3, 2017.
- F19 -
Table of Contents
RESMED INC. AND SUBSIDIARIES
Notes to Consolidated Financial Statements
| (12) | Stockholders’ Equity |
Common Stock. On February 21, 2014, our board of directors approved a new share repurchase program, authorizing us to acquire up to an aggregate of 20.0 million shares of our common stock. The program allows us to repurchase shares of our common stock from time to time for cash in the open market, or in negotiated or block transactions, as market and business conditions warrant and subject to applicable legal requirements. The 20.0 million shares the new program authorizes us to purchase are in addition to the shares we repurchased on or before February 21, 2014 under our previous programs. There is no expiration date for this program, and the program may be accelerated, suspended, delayed or discontinued at any time at the discretion of our board of directors. All share repurchases since February 21, 2014 have been executed in accordance with this program. We temporarily suspended our share repurchase program due to recent acquisitions. Accordingly, we did not repurchase any shares during the year ended June 30, 2017. However, we expect to resume the share repurchase program during fiscal year 2018.
As noted above, we did not repurchase any shares during the year ended June 30, 2017. During the year ended June 30, 2016, we repurchased 1.9 million shares at a cost of $102.1 million prior to the temporary suspension of the share repurchase program. As of June 30, 2017, we have repurchased a total of 41.1 million shares at a cost of $1.5 billion. Shares that are repurchased are classified as “treasury stock pending future use” and reduce the number of shares outstanding used in calculating earnings per share. At June 30, 2017, 13.6 million additional shares can be repurchased under the approved share repurchase program.
Preferred Stock. In April 1997, our board of directors authorized 2,000,000 shares of $0.01 par value preferred stock. No such shares were issued or outstanding at June 30, 2017.
Stock Options and Restricted Stock Units. We have granted stock options and restricted stock units to personnel, including officers and directors, in accordance with the ResMed Inc. 2009 Incentive Award Plan (the “2009 Plan”). These options and restricted stock units vest over one to four years and the options have expiration dates of seven years from the date of grant. We have granted the options with an exercise price equal to the market value as determined at the date of grant.
The maximum number of shares of our common stock authorized for issuance under the 2009 Plan is 43.7 million. The number of securities remaining available for future issuance under the 2009 Plan at June 30, 2017 is 11.6 million. The number of shares of our common stock available for issuance under the 2009 Plan will be reduced by (i) 2.8 shares for each one share of common stock delivered in settlement of any “full-value award,” which is any award other than a stock option, stock appreciation right or other award for which the holder pays the intrinsic value and (ii) one share for each share of common stock delivered in settlement of all other awards. The maximum number of shares, which may be subject to awards granted under the 2009 Plan to any individual during any calendar year, may not exceed 3 million shares of our common stock (except in a participant’s initial year of hiring up to 4.5 million shares of our common stock may be granted).
At June 30, 2017, there was $73.2 million in unrecognized compensation costs related to unvested stock-based compensation arrangements. This is expected to be recognized over a weighted average period of 2.3 years. The aggregate intrinsic value of the stock-based compensation arrangements outstanding and exercisable at June 30, 2017 and June 30, 2016 was $194.5 million and $164.9 million, respectively. The aggregate intrinsic value of the options exercised during the fiscal years 2017, 2016 and 2015, was $28.1 million, $40.4 million and $80.2 million, respectively.
- F20 -
Table of Contents
RESMED INC. AND SUBSIDIARIES
Notes to Consolidated Financial Statements
| (12) | Stockholders’ Equity, Continued |
The following table summarizes option activity during the year ended June 30, 2017:
| Weighted Average Exercise Price |
Weighted Average Remaining Contractual Term in Years |
|||||||||||
| Outstanding at beginning of period |
1,924,229 | $ | 38.70 | 3.2 | ||||||||
| Granted |
313,255 | 58.42 | ||||||||||
| Exercised* |
(741,911 | ) | 30.12 | |||||||||
| Forfeited |
- | - | ||||||||||
|
Outstanding at end of period |
1,495,573 | $ | 47.09 | 3.9 | ||||||||
| Exercise price of granted options |
$ | 58.42 | ||||||||||
| Options exercisable at end of period |
968,023 | $ | 41.32 | |||||||||
* Includes 1,508 shares netted for tax.
The following table summarizes the activity of restricted stock units, including performance restricted stock units, during year ended June 30, 2017:
| Weighted Average Grant- Date Fair Value |
Weighted Average Remaining Contractual Term in Years |
|||||||||||
| Outstanding at beginning of period |
1,861,510 | $ | 50.52 | 1.4 | ||||||||
| Granted |
864,562 | 54.57 | ||||||||||
| Vested* |
(584,517 | ) | 47.77 | |||||||||
| Expired |
(178,376 | ) | 50.08 | |||||||||
| Forfeited |
(56,784 | ) | 50.74 | |||||||||
|
Outstanding at end of period |
1,906,395 | $ | 53.26 | 1.6 | ||||||||
* Includes 137,932 shares netted for tax.
Employee Stock Purchase Plan (the “ESPP”). Under the ESPP, we offer participants the right to purchase shares of our common stock at a discount during successive offering periods. Each offering period under the ESPP will be for a period of time determined by the board of directors’ compensation committee of no less than 3 months and no more than 27 months. The purchase price for our common stock under the ESPP will be the lower of 85% of the fair market value of our common stock on the date of grant or 85% of the fair market value of our common stock on the date of purchase. An individual participant cannot subscribe for more than $25,000 in common stock during any calendar year. At June 30, 2017, the number of shares remaining available for future issuance under the ESPP is 0.8 million shares.
During years ended June 30, 2017 and June 30, 2016, we issued 327,000 and 291,000 shares to our employees in two offerings and we recognized $4.2 million and $4.3 million, respectively, of stock compensation expense associated with the ESPP.
- F21 -
Table of Contents
RESMED INC. AND SUBSIDIARIES
Notes to Consolidated Financial Statements
| (12) | Stockholders’ Equity, Continued |
The following table summarizes the total stock-based compensation costs incurred and the associated tax benefit recognized during the years ended June 30, 2017, 2016 and 2015 (in thousands):
| 2017 | 2016 | 2015 | ||||||||||
| Cost of sales – capitalized as part of inventory |
$ | 2,877 | $ | 2,731 | $ | 2,605 | ||||||
| Selling, general and administrative expenses |
37,096 | 36,994 | 38,755 | |||||||||
| Research and development expenses |
5,952 | 6,683 | 6,495 | |||||||||
| Stock-based compensation costs |
45,925 | 46,408 | 47,855 | |||||||||
| Tax benefit* |
(20,100 | ) | (25,020 | ) | (14,100 | ) | ||||||
| Stock-based compensation costs, net of tax benefit |
$ | 25,825 | $ | 21,388 | $ | 33,755 | ||||||
* Includes an additional tax benefit of $6.1 and $11.2 million for the years ended June 30, 2017 and June 30, 2016, respectively, associated with the early adoption of ASU 2016-09, “Improvements to Employee Share-Based Payment Accounting”, discussed in Note 3 – New Accounting Pronouncements.
| (13) | Other, net |
Other, net, in the consolidated statements of income is comprised of the following for the years ended 2017, 2016 and 2015 (in thousands):
| 2017 | 2016 | 2015 | ||||||||||
| Gain (loss) on foreign currency transactions and hedging, net |
$ | 5,434 | $ | 4,169 | $ | 5,068 | ||||||
| Impairment of cost method investments |
(1,955 | ) | (750 | ) | - | |||||||
| Other |
617 | 1,541 | 1,182 | |||||||||
| $ | 4,096 | $ | 4,960 | $ | 6,250 | |||||||
| (14) | Income Taxes |
Income before income taxes for the years ended June 30, 2017, 2016 and 2015, was taxed under the following jurisdictions (in thousands):
| 2017 | 2016 | 2015 | ||||||||||
| U.S. |
$ | (4,985 | ) | $ | 1,785 | $ | 11,431 | |||||
| Non-U.S. |
423,728 | 437,781 | 424,485 | |||||||||
| $ | 418,743 | $ | 439,566 | $ | 435,916 | |||||||
- F22 -
Table of Contents
RESMED INC. AND SUBSIDIARIES
Notes to Consolidated Financial Statements
| (14) | Income Taxes, Continued |
The provision for income taxes is presented below (in thousands):
| 2017 | 2016 | 2015 | ||||||||||
| Current: Federal |
$ | 16,468 | $ | 24,325 | $ | 28,429 | ||||||
| State |
(1,159 | ) | 5,805 | 695 | ||||||||
|
Non-U.S. |
65,612 | 58,023 | 50,892 | |||||||||
| 80,921 | 88,153 | 80,016 | ||||||||||
| Deferred: Federal |
11,385 | 5,640 | (4,269 | ) | ||||||||
| State |
2,706 | (1,644 | ) | (180 | ) | |||||||
|
Non-U.S. |
(18,553 | ) | (4,992 | ) | 7,463 | |||||||
| (4,462 | ) | (996 | ) | 3,014 | ||||||||
| Provision for income taxes |
$ | 76,459 | $ | 87,157 | $ | 83,030 | ||||||
The provision for income taxes differs from the amount of income tax determined by applying the applicable U.S. federal income tax rate of 35% to pretax income as a result of the following (in thousands):
| 2017 | 2016 | 2015 | ||||||||||
| Taxes computed at statutory U.S. rate |
$ | 146,560 | $ | 153,848 | $ | 152,570 | ||||||
| Increase (decrease) in income taxes resulting from: |
||||||||||||
| State income taxes, net of U.S. tax benefit |
(1,294 | ) | 2,573 | 348 | ||||||||
| Research and development credit |
(2,804 | ) | (5,138 | ) | (4,821 | ) | ||||||
| Tax effect of dividends |
97,662 | 80,754 | 56,219 | |||||||||
| Change in valuation allowance |
4,021 | (5,882 | ) | (614 | ) | |||||||
| Effect of non-U.S. tax rates |
(97,141 | ) | (91,124 | ) | (87,721 | ) | ||||||
| Foreign tax credits |
(67,689 | ) | (44,835 | ) | (36,725 | ) | ||||||
| Stock-based compensation expense |
(3,107 | ) | (8,170 | ) | 3,158 | |||||||
| Other |
251 | 5,131 | 616 | |||||||||
| $ | 76,459 | $ | 87,157 | $ | 83,030 | |||||||
- F23 -
Table of Contents
RESMED INC. AND SUBSIDIARIES
Notes to Consolidated Financial Statements
| (14) | Income Taxes, Continued |
The components of our deferred tax assets and liabilities at June 30, 2017 and June 30, 2016, are as follows (in thousands):
| 2017 | 2016 | |||||||
| Deferred tax assets: |
||||||||
| Employee liabilities |
$ | 19,275 | $ | 15,514 | ||||
| Inventories |
10,126 | 9,714 | ||||||
| Provision for warranties |
4,766 | 4,081 | ||||||
| Provision for doubtful debts |
2,967 | 3,708 | ||||||
| Net operating loss carryforwards |
36,117 | 33,881 | ||||||
| Capital loss carryover |
2,625 | 2,109 | ||||||
| Property, plant and equipment |
3,850 | - | ||||||
| Stock-based compensation expense |
15,143 | 15,460 | ||||||
| Other |
5,805 | 4,655 | ||||||
| 100,674 | 89,122 | |||||||
| Less valuation allowance |
(15,259 | ) | (10,807 | ) | ||||
| Deferred tax assets |
85,415 | 78,315 | ||||||
| Deferred tax liabilities: |
||||||||
| Unrealized foreign exchange gains |
(735 | ) | (1,016 | ) | ||||
| Property, plant and equipment |
- | (4,383 | ) | |||||
| Goodwill and other intangibles |
(36,999 | ) | (26,481 | ) | ||||
| Deferred tax liabilities |
(37,734 | ) | (31,880 | ) | ||||
| Net deferred tax asset |
$ | 47,681 | $ | 46,435 | ||||
We reported the net deferred tax assets and liabilities in our consolidated balance sheets at June 30, 2017 and June 30, 2016, as follows (in thousands):
| 2017 | 2016 | |||||||
| Non-current deferred tax asset |
61,503 | 55,496 | ||||||
| Non-current deferred tax liability |
(13,822 | ) | (9,061 | ) | ||||
| Net deferred tax asset |
$ | 47,681 | $ | 46,435 | ||||
As of June 30, 2017, we had $114.6 million of U.S. federal and state net operating loss carryforwards and $90.4 million of non-U.S. net operating loss carryforwards, which expire in various years beginning in 2018 or carry forward indefinitely.
The valuation allowance at June 30, 2017 relates to a provision for uncertainty of the utilization of net operating loss carryforwards of $12.1 million and capital loss and other items of $3.2 million. We believe that it is more likely than not that the benefits of deferred tax assets, net of any valuation allowance, will be realized.
- F24 -
Table of Contents
RESMED INC. AND SUBSIDIARIES
Notes to Consolidated Financial Statements
| (14) | Income Taxes, Continued |
A substantial portion of our manufacturing operations and administrative functions in Malaysia and Singapore operate under various tax holidays and tax incentive programs that will expire in whole or in part at various dates through June 30, 2020. The end of certain tax holidays may be extended if specific conditions are met. The net impact of these tax holidays and tax incentive programs increased our net earnings by $19.5 million ($0.14 per diluted share) for the year ended June 30, 2017 and $19.2 million ($0.14 per diluted share) for the year ended June 30, 2016.
At June 30, 2017, applicable U.S. federal income taxes and foreign withholding taxes have not been provided on the accumulated earnings of foreign subsidiaries that are expected to be permanently reinvested. The total amount of these undistributed earnings at June 30, 2017 amounted to approximately $1.5 billion. If these earnings had not been permanently reinvested, deferred taxes of approximately $358 million would have been recognized in the consolidated financial statements.
In accounting for uncertainty in income taxes, we recognize a tax benefit in the financial statements for an uncertain tax position only if management’s assessment is that the position is “more likely than not” (that is, a likelihood greater than 50 percent) to be allowed by the tax jurisdiction based solely on the technical merits of the position. The term “tax position” refers to a position in a previously filed tax return or a position expected to be taken in a future tax return that is reflected in measuring current or deferred income tax assets and liabilities for annual periods. The Company recognizes interest and penalties related to unrecognized tax benefits within the income tax expense line in the accompanying consolidated statements of income. Accrued interest and penalties are included within the related tax liability line in the consolidated balance sheets. Based on all known facts and circumstances and current tax law, we believe the total amount of unrecognized tax benefits on June 30, 2017, is not material to our results of operations, financial condition or cash flows, and if recognized, would not have a material impact on our effective tax rate.
Our income tax returns are based on calculations and assumptions subject to audit by various tax authorities. In addition, the calculation of our tax liabilities involves dealing with uncertainties in the application of complex tax laws. We regularly assess the potential outcomes of examinations by tax authorities in determining the adequacy of our provision for income taxes. We are currently under audit by the Australian Taxation Office for the tax years 2009 to 2013. Although we do not believe that any material adjustments will result from this audit, the outcome of tax audits cannot be predicted with certainty. Any final assessment resulting from tax audits may result in material changes to our past or future taxable income, tax payable or deferred tax assets, and may require us to pay penalties and interest that could materially adversely affect our financial results.
| (15) | Segment Information |
We predominantly operate in a single operating segment, which is the sleep and respiratory disorders sector of the medical device industry. Due to the acquisition of Brightree LLC in April 2016, our operations now include the supply of business management software and services to medical equipment and home health providers. However, these operations, both in terms of revenue and profit, are not material to our global operations and therefore have not been separately reported as a segment.
- F25 -
Table of Contents
RESMED INC. AND SUBSIDIARIES
Notes to Consolidated Financial Statements
| (15) | Segment Information, Continued |
Sales of devices for each of the years ended June 30, 2017, 2016 and 2015, were $1,161.0 million, $1,064.2 million and $975.9 million, respectively. Sales of masks and other accessories for each of the years ended June 30, 2017, 2016 and 2015, were $767.7 million, $745.6 million and $703.0 million, respectively. We allocate revenue to a geographic area based on where the products are shipped to or where the services are performed. Revenue information by geographic area for the years ended June 30, 2017, 2016 and 2015, is summarized below (in thousands):
| Revenue from external sources for the years ended June 30, |
||||||||||||
| 2017 | 2016 | 2015 | ||||||||||
| United States |
$ | 1,229,196 | $ | 1,056,453 | $ | 904,342 | ||||||
| Germany |
153,283 | 163,257 | 184,245 | |||||||||
| Rest of the World |
684,258 | 619,003 | 590,325 | |||||||||
| Total |
$ | 2,066,737 | $ | 1,838,713 | $ | 1,678,912 | ||||||
Long-lived assets of geographic areas are those assets used in our operations in each geographical area, and excludes goodwill, other intangible assets, and deferred tax assets. Long-lived assets by geographic area as of June 30, 2017, 2016 and 2015, is summarized below (in thousands):
| Long lived assets at June 30, | ||||||||||||
| 2017 | 2016 | 2015 | ||||||||||
| United States |
$ | 150,677 | $ | 148,789 | $ | 140,344 | ||||||
| Australia |
183,159 | 185,978 | 197,609 | |||||||||
| Rest of the World |
60,405 | 49,509 | 49,805 | |||||||||
| Total |
$ | 394,241 | $ | 384,276 | $ | 387,758 | ||||||
| (16) | Stock-based Employee Compensation |
We measure the compensation expense of all stock-based awards at fair value on the grant date. We estimate the fair value of stock options and purchase rights granted under the ESPP using the Black-Scholes valuation model. The fair value of restricted stock units is equal to the market value of the underlying shares as determined at the grant date less the fair value of dividends that holders are not entitled to, during the vesting period. We recognize the fair value as compensation expense using the straight-line method over the service period for awards expected to vest.
- F26 -
Table of Contents
RESMED INC. AND SUBSIDIARIES
Notes to Consolidated Financial Statements
| (16) | Stock-based Employee Compensation, Continued |
We estimate the fair value of stock options granted under our stock option plans and purchase rights granted under the ESPP using the following assumptions:
| Fiscal Year Ended June 30, | ||||||||
| 2017 | 2016 | |||||||
| Stock options: |
||||||||
| Weighted average grant date fair value |
$10.89 | $12.18 | ||||||
| Weighted average risk-free interest rate |
1.61 | % | 1.66 | % | ||||
| Expected life in years |
4.9 | 4.9 | ||||||
| Dividend yield |
2.02% - 2.29 | % | 2.06% - 2.09 | % | ||||
| Expected volatility |
25 | % | 27 | % | ||||
| ESPP purchase rights: |
||||||||
| Weighted average grant date fair value |
$12.50 | $13.61 | ||||||
| Weighted average risk-free interest rate |
0.5 | % | 0.2 | % | ||||
| Expected life in years |
6 months | 6 months | ||||||
| Dividend yield |
1.92% - 2.27 | % | 1.96% - 2.14 | % | ||||
| Expected volatility |
23 | % | 23% - 32 | % | ||||
During the fiscal years ended June 30, 2017 and June 30, 2016, we granted 243,000 and 208,000, performance restricted stock units (“PRSUs”), which contain a market condition, with the ultimate realizable number of PRSUs dependent on relative total stockholder return over a three-year period, up to a maximum amount to be issued under the award of 200% of the original grant. The weighted average grant date fair value of PRSUs granted during the fiscal years 2017 and 2016 was estimated at $51.60 and $53.11 per PRSU, respectively, using a Monte-Carlo simulation valuation model.
| (17) | Employee Retirement Plans |
We contribute to a number of employee retirement plans for the benefit of our employees. Details of the main plans are as follows:
(1) Australia - We contribute to defined contribution plans for each employee resident in Australia. All Australian employees, after serving a qualifying period, are entitled to benefits on retirement, disability or death. Employees may contribute additional funds to the plans. We contribute to the plans at the rate of approximately 9.5% of the salaries of all Australian employees. Our total contributions to the plans for the years ended June 30, 2017, 2016 and 2015, were $9.9 million, $9.1 million and $9.9 million, respectively.
(2) United States - We sponsor a defined contribution plan available to substantially all domestic employees. Company contributions to this plan are based on a percentage of employee contributions to a maximum of 4% of the employee’s salary. Our total contributions to the plan were $4.3 million, $3.3 million and $3.2 million in fiscal 2017, 2016 and 2015, respectively.
(3) Singapore - We sponsor a defined contribution plan available to substantially all domestic employees. Company contributions to this plan are based on a percentage of employee contributions to a maximum of 16% of the employee’s salary. Our total contributions to the plan were $1.7 million, $1.4 million and $1.2 million in fiscal 2017, 2016 and 2015, respectively.
- F27 -
Table of Contents
RESMED INC. AND SUBSIDIARIES
Notes to Consolidated Financial Statements
| (18) | Commitments |
We lease buildings, motor vehicles and office equipment under operating leases. We expense rental charges for operating leases on a straight-line basis over the lease term taking into account rent concessions or holidays. Rent expenses under operating leases for the years ended June 30, 2017, 2016 and 2015, were approximately $20.1 million, $17.4 million and $17.0 million, respectively. At June 30, 2017 we had the following future minimum lease payments under non-cancelable operating leases (in thousands):
| Fiscal Years | Operating Leases | |||
| 2018 |
$ | 19,232 | ||
| 2019 |
14,208 | |||
| 2020 |
7,912 | |||
| 2021 |
5,030 | |||
| 2022 |
4,009 | |||
| Thereafter |
7,852 | |||
| Total minimum lease payments |
$ | 58,243 | ||
| (19) | Legal Actions and Contingencies |
Litigation
In the normal course of business, we are subject to routine litigation incidental to our business. While the results of this litigation cannot be predicted with certainty, we believe that their final outcome will not, individually or in aggregate, have a material adverse effect on our consolidated financial statements taken as a whole.
Contingent Obligations Under Recourse Provisions
We use independent leasing companies to provide financing to certain customers for the purchase of our products. In some cases, we are contingently liable in the event of a customer default, to the leasing companies, within certain limits, for unpaid installment receivables transferred to the leasing companies. The gross amount of receivables sold, with recourse, during the fiscal years 2017 and 2016, amounted to $99.3 million and $67.1 million, respectively. The maximum potential amount of contingent liability under these arrangements at June 30, 2017 and June 30, 2016, were $27.5 million, and $12.9 million, respectively. The recourse liability recognized by us at June 30, 2017 and June 30, 2016 in relation to these arrangements was $1.4 million and $0.7 million, respectively.
| (20) | Fair Value Measurements |
In determining the fair value measurements of our financial assets and liabilities, we consider the principal and most advantageous market in which we transact and consider assumptions that market participants would use when pricing the financial asset or liability. We maximize the use of observable inputs and minimize the use of unobservable inputs when measuring fair value.
- F28 -
Table of Contents
RESMED INC. AND SUBSIDIARIES
Notes to Consolidated Financial Statements
| (20) | Fair Value Measurements, Continued |
The hierarchies of inputs are as follows:
| • Level 1: |
Input prices quoted in an active market for identical financial assets or liabilities; | |
| • Level 2: |
Inputs other than prices quoted in Level 1, such as prices quoted for similar financial assets and liabilities in active markets, prices for identical assets and liabilities in markets that are not active or other inputs that are observable or can be corroborated by observable market data; and | |
| • Level 3: |
Input prices quoted that are significant to the fair value of the financial assets or liabilities which are not observable nor supported by an active market. | |
The following table summarizes our financial assets and liabilities, as at June 30, 2017 and June 30, 2016 using the valuation input hierarchy (in thousands):
| Level 1 | Level 2 | Level 3 | Total | |||||||||||||
| Balances at June 30, 2017 |
||||||||||||||||
| Foreign currency hedging instruments, net |
$ | - | $ | 2,760 | $ | - | $ | 2,760 | ||||||||
| Business acquisition contingent consideration |
$ | - | $ | - | $ | (1,580 | ) | $ | (1,580 | ) | ||||||
| Balances at June 30, 2016 |
||||||||||||||||
| Foreign currency hedging instruments, net |
$ | - | $ | 4,185 | $ | - | $ | 4,185 | ||||||||
| Business acquisition contingent consideration |
$ | - | $ | - | $ | (10,450 | ) | $ | (10,450 | ) | ||||||
We determine the fair value of our financial assets and liabilities as follows:
Foreign currency options – These financial instruments are valued using third-party valuation models based on market observable inputs, including interest rate curves, on-market spot currency prices, volatilities and credit risk.
Contingent consideration – These liabilities include the fair value estimates of additional future payments that may be required for some of our previous business acquisitions based on the achievement of certain performance milestones. Each potential future payment is valued using the estimated probability of achieving each milestone, which is then discounted to present value.
During the year ended June 30, 2017 we recognized a charge of $10.1 million representing additional contingent consideration associated with the acquisition of Curative Medical Technology Inc. (“Curative Medical”), following the achievement of performance milestones under the purchase agreement which exceeded our earlier expectations.
The following is a reconciliation of changes in the fair value of contingent consideration during fiscal years ended June 30, 2017 and June 30, 2016 (in thousands):
| 2017 | 2016 | |||||||
| Balance at the beginning of the period |
$ | (10,450 | ) | $ | (1,584 | ) | ||
| Acquisition date fair value of contingent consideration |
(1,580 | ) | (13,107 | ) | ||||
| Changes in fair value included in operating income |
(10,076 | ) | 2,986 | |||||
| Payments |
20,142 | 1,228 | ||||||
| Foreign currency translation adjustments |
384 | 27 | ||||||
| Balance at the end of the period |
$ | (1,580 | ) | $ | (10,450 | ) |
- F29 -
Table of Contents
RESMED INC. AND SUBSIDIARIES
Notes to Consolidated Financial Statements
| (20) | Fair Value Measurements, Continued |
We did not have any significant non-financial assets or liabilities measured at fair value on June 30, 2017 or June 30, 2016.
| (21) | Derivative Instruments and Hedging Activities |
We transact business in various foreign currencies, including a number of major European currencies as well as the Australian and Singapore dollars. We have significant foreign currency exposure through both our Australian and Singaporean manufacturing activities, and international sales operations. We have established a foreign currency hedging program using purchased currency options and forward contracts to hedge foreign-currency-denominated financial assets, liabilities and manufacturing cash flows. The terms of such foreign currency hedging contracts generally do not exceed three years. The goal of this hedging program is to economically manage the financial impact of foreign currency exposures denominated mainly in Euros, Australian and Singapore dollars. Under this program, increases or decreases in our foreign currency denominated financial assets, liabilities, and firm commitments are partially offset by gains and losses on the hedging instruments.
We do not designate these foreign currency contracts as hedges. We have determined our hedge program to be a non-effective hedge as defined under the FASB issued authoritative guidance. All movements in the fair value of the foreign currency instruments are recorded within other income, net in our consolidated statements of income and through changes in our operating assets and liabilities within our consolidated statements of cash flows. We do not enter into financial instruments for trading or speculative purposes.
We held foreign currency instruments with notional amounts totaling $568.2 million and $612.2 million at June 30, 2017 and June 30, 2016, respectively, to hedge foreign currency fluctuations. These contracts mature at various dates prior to June 30, 2019.
The following table summarizes the amount and location of our derivative financial instruments as of June 30, 2017 and June 30, 2016 (in thousands):
| June 30, 2017 | June 30, 2016 | Balance Sheet Caption | ||||||||||
| Foreign currency hedging instruments |
$ | 2,614 | $ | 2,346 | Other assets - current | |||||||
| Foreign currency hedging instruments |
1,273 | 2,082 | Other assets - non current | |||||||||
| Foreign currency hedging instruments |
(1,127 | ) | (243 | ) | Accrued expenses | |||||||
| $ | 2,760 | $ | 4,185 | |||||||||
The following table summarizes the amount and location of gains (losses) associated with our derivative financial instruments and other foreign-currency-denominated transactions for the fiscal years ended June 30, 2017 and June 30, 2016, respectively (in thousands):
| Gain /(Loss) Recognized | Income Statement Caption | |||||||||||
| Year Ended June 30, | ||||||||||||
| 2017 | 2016 | |||||||||||
| Foreign currency hedging instruments |
$ | 1,812 | $ | (5,192 | ) | Other, net | ||||||
| Other foreign-currency-denominated transactions |
3,622 | 9,361 | Other, net | |||||||||
| $ | 5,434 | $ | 4,169 | Other, net | ||||||||
We are exposed to credit-related losses in the event of non-performance by counter parties to financial instruments. We minimize counterparty credit risk by entering into derivative transactions with major financial institutions and we do not expect material losses as a result of default by our counterparties.
- F30 -
Table of Contents
RESMED INC. AND SUBSIDIARIES
Notes to Consolidated Financial Statements
| (22) | Business Combinations |
Fiscal year ended June 30, 2017
On May 31, 2017, we completed the acquisition of assets in Conduit Technology, LLC (“Conduit”), a provider of documentation and workflow solutions. On June 30, 2017, we completed the acquisition of assets in AllCall Connect, LLC (“AllCall”), a provider of a live-calling solution for CPAP patient resupply. These acquisitions have been accounted for as business combinations using purchase accounting and are included in our consolidated financial statements from their respective acquisition dates. The acquisitions, individually and collectively, are not considered a material business combination and accordingly pro forma information is not provided. The acquisitions were funded through cash on-hand.
We have not yet completed the purchase price allocations associated with the Conduit and AllCall acquisitions. We expect to complete our Conduit and AllCall purchase price allocations during the quarter ending September 30, 2017. We do not believe that the completion of this work will materially modify the preliminary purchase price allocation for Conduit or AllCall. The cost of the acquisitions was allocated to the assets acquired and liabilities assumed based on estimates of their fair values at the date of acquisition. The goodwill recognized as part of these acquisitions, which is deductible for tax purposes, mainly represents the synergies that are unique to our combined businesses and the potential for new products and services to be developed in the future. The fair values of assets acquired and liabilities assumed, and the estimated useful lives of intangible assets acquired are as follows (in thousands):
| Preliminary | Intangible assets - useful life | |||||||
| Current assets |
$ | - | ||||||
| Property, plant and equipment |
69 | |||||||
| Trade names |
100 | 3 years | ||||||
| Non-compete |
520 | 1 - 3 years | ||||||
| Developed technology |
1,800 | 5 years | ||||||
| Customer relationships |
2,160 | 5 years | ||||||
| Goodwill |
2,000 | |||||||
| Assets acquired |
$ | 6,649 | ||||||
| Current liabilities |
(60 | ) | ||||||
| Total liabilities assumed |
$ | (60 | ) | |||||
| Net assets acquired |
$ | 6,589 | ||||||
During the year ended June 30, 2017 we did not record material acquisition-related expenses.
Fiscal year ended June 30, 2016
Brightree
On April 4, 2016 we completed the acquisition of Brightree LLC (“Brightree”), a provider of cloud-based clinical and business management software for the post-acute care industry, for a total purchase consideration paid of $802 million. This acquisition has been accounted for as a business combination using purchase accounting and included in our consolidated financial statements from April 4, 2016. The acquisition was funded through cash on-hand, funds available from the existing revolving credit facility, an increase in the size of our revolving credit facility from $700 million to $1 billion and we also entered into a $300 million senior unsecured one-year term loan credit facility.
- F31 -
Table of Contents
RESMED INC. AND SUBSIDIARIES
Notes to Consolidated Financial Statements
| (22) | Business Combinations, Continued |
We completed the purchase price allocation in relation to this acquisition during the quarter ended March 31, 2017. The cost of the acquisition was allocated to the assets acquired and liabilities assumed based on estimates of their fair values at the date of acquisition. The goodwill recognized as part of these acquisitions, which is deductible for tax purposes, mainly represents the synergies that are unique to our combined businesses and the potential for new products and services to be developed in the future. The fair values of assets acquired and liabilities assumed, and the estimated useful lives of intangible assets acquired, are as follows (in thousands):
| Brightree | Adjustments | Final | Intangible assets – useful life | |||||||||||||
| Current assets |
$ | 13,868 | 1,442 | 15,310 | ||||||||||||
| Property, plant and equipment |
1,045 | - | 1,045 | |||||||||||||
| Trade names |
28,700 | - | 28,700 | 10 years | ||||||||||||
| In-process research and development |
4,100 | - | 4,100 | n/a | ||||||||||||
| Developed technology |
114,700 | - | 114,700 | 5 to 6 years | ||||||||||||
| Customer relationships |
51,000 | - | 51,000 | 10 to 15 years | ||||||||||||
| Goodwill |
602,090 | 906 | 602,996 | |||||||||||||
| Assets acquired |
$ | 815,503 | $ | 2,348 | $ | 817,851 | ||||||||||
| Current liabilities |
(9,399 | ) | - | (9,399 | ) | |||||||||||
| Deferred revenue |
(4,571 | ) | - | (4,571 | ) | |||||||||||
| Deferred tax liabilities |
- | - | - | |||||||||||||
| Total liabilities assumed |
$ | (13,970 | ) | $ | - | $ | (13,970 | ) | ||||||||
| Net assets acquired |
$ | 801,533 | $ | 2,348 | $ | 803,881 | ||||||||||
The acquisition is considered a material business combination and accordingly unaudited pro forma information presented below for the fiscal years ended June 30, 2016 and 2015, include the effects of pro forma adjustments as if the acquisition of Brightree occurred on July 1, 2014. The pro forma results were prepared using the acquisition method of accounting and combine our historical results and Brightree’s for the fiscal years ended June 30, 2016 and 2015, including the effects of the business combination, primarily amortization expense related to the fair value of identifiable intangible assets acquired, interest expense associated with the financing obtained by us in connection with the acquisition, and the elimination of incurred acquisition-related costs.
The pro forma financial information presented below is not necessarily indicative of the results of operations that would have been achieved if the acquisition occurred at the beginning of the earliest period presented, nor is it intended to be a projection of future results.
| Unaudited Proforma Consolidated Results | Years Ended June 30, | |||||||
| (In thousands, except per share information) | 2016 | 2015 | ||||||
| Revenue |
$ | 1,931,257 | $ | 1,780,727 | ||||
| Net income attributable to stockholders |
$ | 354,565 | $ | 347,563 | ||||
| Basic earnings per share |
$ | 2.53 | $ | 2.47 | ||||
| Diluted earnings per share |
$ | 2.54 | $ | 2.44 | ||||
- F32 -
Table of Contents
RESMED INC. AND SUBSIDIARIES
Notes to Consolidated Financial Statements
| (22) | Business Combinations, Continued |
The unaudited pro forma consolidated results for the years ended June 30, 2016, and 2015 reflect primarily the following pro forma pre-tax adjustments:
| • | Addition of net amortization expense related to the fair value of identifiable intangible assets acquired of $19.9 million and $26.2 million for the years ended June 30, 2016 and June 30, 2015, respectively. |
| • | Addition of net interest expense associated with debt that was issued to finance the acquisition of $16.1 million and $16.5 million for the years ended June 30, 2016 and June 30, 2015, respectively. |
| • | Elimination of pre-tax acquisition-related costs totaling $4.1 million from the results for the year ended June 30, 2016. |
| • | Addition of net income tax expense of $1.3 million for the year ended June 30, 2016 and elimination of net income tax expense of $3.1 million for the year ended June 30, 2015, respectively. |
Although Brightree and its U.S. subsidiaries had historically elected to be treated as a partnership for U.S. Federal and state income tax purposes, and therefore, no income tax expense or benefit was previously recognized by Brightree in the U.S., the pro forma financial information assumes that Brightree’s historical income tax expense is based on a U.S. statutory rate of 37%. Brightree’s historical income tax expense was a benefit of $1.2 million and $0.4 million for the twelve months ended June 30, 2016 and 2015, respectively. The effective tax rate of the combined company could be significantly different depending on post-acquisition activities, such as the tax treatment applicable to each entity and the geographical mix of taxable income affecting state and foreign taxes, among other factors.
Other Acquisitions
On October 2, 2015, we completed the acquisition of 100% of the shares in Curative Medical Technology Inc., a leading provider of non-invasive ventilation and sleep-disordered breathing medical devices and accessories in China. Curative Medical has its manufacturing base in Suzhou, China, offices in Beijing, Germany and the United States, and a distributor network throughout China and in other select markets. On November 6, 2015, we completed the acquisition of 100% of the shares in Maribo Medico A/S, a distributor of medical equipment for treating, diagnosing, and managing sleep-disordered breathing and other respiratory disorders in Denmark and the Nordics. On November 30, 2015, we completed the acquisition of 100% of the shares in Bennett Precision Tooling Pty Ltd, an Australian based company that designs and manufactures tools specializing in applications for Liquid Silicon Rubber. On January 29, 2016, we completed the acquisition of 100% of the shares in Inova Labs Inc. (“Inova Labs”), a medical device company specializing in the development and commercialization of innovative oxygen therapy products. These acquisitions have been accounted for as business combinations using purchase accounting and are included in our consolidated financial statements from their respective acquisition dates. The acquisitions, individually and collectively, are not considered a material business combination and accordingly pro forma information is not provided. The acquisitions were funded through cash on-hand and by drawing on our existing credit facility.
- F33 -
Table of Contents
RESMED INC. AND SUBSIDIARIES
Notes to Consolidated Financial Statements
| (22) | Business Combinations, Continued |
We have completed the purchase price allocation in relation to all these acquisitions. The cost of the acquisitions was allocated to the assets acquired and liabilities assumed based on estimates of their fair values at the date of acquisition. The goodwill recognized as part of these acquisitions, which is not deductible for tax purposes, mainly represents the synergies that are unique to our combined businesses and the potential for new products and services to be developed in the future. The fair values of assets acquired and liabilities assumed, and the estimated useful lives of intangible assets acquired are as follows (in thousands):
| Preliminary | Adjustments | Final | Intangible assets – useful life | |||||||||||||
| Current assets |
$ | 49,370 | 3,184 | 52,554 | ||||||||||||
| Property, plant and equipment |
5,294 | - | 5,294 | |||||||||||||
| Trade names |
17,400 | - | 17,400 | 7 years | ||||||||||||
| Non-compete |
1,400 | - | 1,400 | 5 years | ||||||||||||
| Developed technology |
20,515 | 585 | 21,100 | 5 years | ||||||||||||
| Customer relationships |
37,303 | 600 | 37,903 | 5 to 8 years | ||||||||||||
| Goodwill |
194,216 | (3,551 | ) | 190,665 | ||||||||||||
| Assets acquired |
$ | 325,498 | $ | 818 | $ | 326,316 | ||||||||||
| Current liabilities |
(21,147 | ) | (370 | ) | (21,517 | ) | ||||||||||
| Debt assumed |
(21,201 | ) | - | (21,201 | ) | |||||||||||
| Deferred revenue |
(4,283 | ) | - | (4,283 | ) | |||||||||||
| Deferred tax liabilities |
(19,207 | ) | (448 | ) | (19,655 | ) | ||||||||||
| Total liabilities assumed |
$ | (65,838 | ) | $ | (818 | ) | $ | (66,656 | ) | |||||||
| Net assets acquired |
$ | 259,660 | $ | - | $ | 259,660 | ||||||||||
During the year ended June 30, 2016, we recorded $5.3 million in acquisition-related expenses.
| (23) | Restructuring Expenses |
During the year ended June 30, 2017, we incurred restructuring expenses of $12.4 million associated with the reorganization of our Paris manufacturing activities and German research and development activities. The restructuring expenses consisted primarily of severance payments to employees, site closure costs and associated project cancellation costs. We recorded the full amount of $12.4 million during the year ended June 30, 2017, within our operating expenses and separately disclosed the amount as restructuring expenses. We had $6.5 million remaining in our employee related costs accrual at year end.
During the year ended June 30, 2016, we incurred restructuring expenses of $6.9 million associated with rationalizing our European research & development operations and manufacturing facilities. The restructuring expenses consisted primarily of severance payments and an asset write-down of a legacy manufacturing facility. We recorded and paid the full amount of $6.9 million during the year ended June 30, 2016, within our operating expenses and separately disclosed the amount as restructuring expenses.
We did not recognize any restructuring expense for the year ended June 30, 2015.
- F34 -
Table of Contents
RESMED INC. AND SUBSIDIARIES
Notes to Consolidated Financial Statements
| (24) | Litigation Settlement Expenses |
During the fiscal year ended June 30, 2017 we recognized litigation settlement expenses of $8.5 million associated with an agreement with Chinese manufacturer, BMC Medical, and its U.S. distributor, 3B, to settle all outstanding disputes. The material terms of the settlement were:
| • | ResMed paid 3B the amount of $8.5 million to settle all claims in the Florida case, including claims against our three customers. |
| • | We agreed that for five years from the date of the agreement, we would not initiate legal suit against BMC for patent infringement for selling their range of devices and masks that were the subject of the current dispute. BMC agreed to pay us royalties on the sale of those products in the United States. |
| • | Mutual release and dismissal of all litigation current at the time of settlement, worldwide, including all validity challenges. It was agreed that neither party will initiate legal suit against the other for a period of five years without a 90 day meet and confer process. |
- F35 -
Table of Contents
RESMED INC. AND SUBSIDIARIES
VALUATION AND QUALIFYING ACCOUNTS AND RESERVES
YEARS ENDED JUNE 30, 2017, 2016 AND 2015
(in thousands)
| Balance at Beginning of Period |
Charged to costs and expenses |
Other (deductions) |
Balance at end of period |
|||||||||||||
| Year ended June 30, 2017 |
||||||||||||||||
| Applied against asset account |
||||||||||||||||
| Allowance for doubtful accounts |
$ | 12,555 | 4,269 | (5,674 | ) | $ | 11,150 | |||||||||
| Year ended June 30, 2016 |
||||||||||||||||
| Applied against asset account |
||||||||||||||||
| Allowance for doubtful accounts |
$ | 12,276 | 3,383 | (3,104 | ) | $ | 12,555 | |||||||||
| Year ended June 30, 2015 |
||||||||||||||||
| Applied against asset account |
||||||||||||||||
| Allowance for doubtful accounts |
$ | 10,971 | 3,559 | (2,254 | ) | $ | 12,276 | |||||||||
See accompanying report of independent registered public accounting firm.
Table of Contents
RESMED INC. AND SUBSIDIARIES
Under the requirements of Section 13 or 15(d) of the Securities Exchange Act of 1934, the registrant has caused this report to be signed on its behalf by the authorized persons below.
DATED August 3, 2017
ResMed Inc.
| /S/ MICHAEL J. FARRELL |
| Michael J. Farrell |
| Chief executive officer |
| (Principal Executive Officer) |
Pursuant to the requirements of the Securities Exchange Act of 1934, this report has been signed below by the following persons on behalf of the Registrant and in the capacities and on the dates indicated.
| SIGNATURE | TITLE | DATE | ||
| /S/ MICHAEL J. FARRELL Michael J. Farrell |
Chief executive officer and director (Principal Executive Officer) |
August 3, 2017 | ||
| /S/ BRETT A. SANDERCOCK Brett A. Sandercock |
Chief financial officer (Principal Financial Officer and Principal Accounting Officer) |
August 3, 2017 | ||
| /S/ PETER C. FARRELL Peter C. Farrell |
Non-executive chairman |
August 3, 2017 | ||
| /S/ CHRISTOPHER G. ROBERTS Christopher G. Roberts |
Director |
August 3, 2017 | ||
| /S/ CAROL J. BURT Carol J. Burt |
Director |
August 3, 2017 | ||
| /S/ GARY W. PACE Gary W. Pace |
Director |
August 3, 2017 | ||
| /S/ RICHARD SULPIZIO Richard Sulpizio |
Director |
August 3, 2017 | ||
| /S/ RON TAYLOR Ron Taylor |
Director |
August 3, 2017 | ||
| /S/ JOHN P. WAREHAM John P. Wareham |
Director |
August 3, 2017 | ||
S-1
Table of Contents
RESMED INC. AND SUBSIDIARIES
EXHIBIT INDEX
The following documents are filed as part of this report:
| (a) | Consolidated Financial Statements and Schedules – The index to our consolidated financial statements and schedules are set forth in the “Index to Consolidated Financial Statements” under Item 8 of this report. | |
| (b) | Exhibit Lists | |
| 2.1 | Agreement and Plan of Merger, dated February 19, 2016, by and among ResMed Corp., Eagle Acquisition Sub LLC, Brightree LLC, Shareholder Representative Services LLC and ResMed Inc.(18)** | |
| 3.1 | First Restated Certificate of Incorporation of ResMed Inc., as amended.(16) | |
| 3.2 | Fifth Amended and Restated Bylaws of ResMed Inc.(13) | |
| 4.1 | Form of certificate evidencing shares of Common Stock.(1) | |
| 10.1 | Licensing Agreement between the University of Sydney and ResMed Ltd dated May 17, 1991, as amended.(1) | |
| 10.2* | ResMed Inc. 2006 Incentive Award Plan.(6) | |
| 10.3* | Amendment No. 1 to the ResMed Inc. 2006 Incentive Award Plan.(3) | |
| 10.4* | 2006 Grant agreement for Board of Directors.(3) | |
| 10.5* | 2006 Grant agreement for Executive Officers.(5) | |
| 10.6* | 2006 Grant agreement for Australian Executive Officers.(5) | |
| 10.7* | Form of Executive Agreement.(4) | |
| 10.8* | Amended and Restated 2006 Incentive Award Plan dated November 20, 2008.(7) | |
| 10.9 | Form of Indemnification Agreements for our directors and officers.(8) | |
| 10.10 | Form of Access Agreement for directors.(8) | |
| 10.11* | Updated Form of Executive Agreement.(2)(12) | |
| 10.12 | ResMed Inc. 2009 Incentive Award Plan.(9) | |
| 10.13 | ResMed Inc. 2009 Employee Stock Purchase Plan.(9) | |
| 10.14 | Amendment No. 1 to the ResMed Inc. 2009 Employee Stock Purchase Plan(14) | |
| 10.15 | Form of Restricted Stock Award Agreement.(9) | |
| 10.16 | ResMed Inc. Deferred Compensation Plan.(10) | |
| 10.17 | Credit Agreement, dated as of October 31, 2013, among ResMed Inc., the lenders Union Bank, N.A., as administrative agent, joint lead arranger, swing line lender and letters of credit issuer and HSBC Bank USA, National Association, as syndication agent and joint lead arranger.(17) | |
| 10.18 | First Amendment to Credit Agreement dated as of April 4, 2016, by and among ResMed, as borrower, the lenders party thereto, Union Bank, N.A., as administrative agent, joint lead arranger, swing line lender and letter of credit issuer and HSBC Bank USA, National Association, as syndication agent and joint lead arranger.(19) | |
| 10.19 | Second Amendment to Credit Agreement dated as of January 9, 2017, among ResMed Inc., as borrower, the lenders, MUFG Union Bank, N.A. as successor in interest to Union Bank, N.A., as administrative agent, joint lead arranger, swing line lender and letter of credit issuer, and HSBC Bank USA, National Association, as syndication agent and joint lead arranger.(22) | |
Table of Contents
| 10.20 | Term Loan Credit Agreement dated April 4, 2016, among ResMed Inc., as borrower, the lenders, Union Bank, N.A., as administrative agent, joint lead arranger and joint book runner, HSBC Bank USA, National Association, as joint lead arranger and joint book runner and HSBC Bank Australia Limited, as joint lead arranger and joint book runner.(20) | |
| 10.21 | Unconditional Guaranty entered into as of April 4, 2016, by each of ResMed Corp., ResMed Motor Technologies Inc., Birdie Inc., Inova Labs, Inc., Brightree LLC, Brightree Services LLC, Brightree Home Health & Hospice LLC and Strategic AR LLC., in favor of Union Bank, N.A., as administrative agent.(21) | |
| 10.22 | Form of Restricted Stock Unit Award Agreement for Executive Officers.(11) | |
| 10.23 | Form of Restricted Stock Unit Award Agreement for Directors.(11) | |
| 10.24 | Form of Stock Option Grant for Executive Officers.(11) | |
| 10.25 | Form of Stock Option Grant for Directors.(11) | |
| 10.26 | Form of Performance-Based Restricted Stock Unit Award Agreement for Executive Officers.(15) | |
| 21.1 | Subsidiaries of the Registrant.(23) | |
| 23.1 | Consent of Independent Registered Public Accounting Firm.(23) | |
| 31.1 | Certification of Chief Executive Officer Pursuant to Section 302 of Sarbanes-Oxley Act of 2002.(23) | |
| 31.2 | Certification of Chief Financial Officer Pursuant to Section 302 of Sarbanes-Oxley Act of 2002.(23) | |
| 32.1 | Certification of Chief Executive Officer and Chief Financial Officer pursuant to Section 906 of the Sarbanes-Oxley Act of 2002.(23) | |
| 101 | The following materials from ResMed Inc.’s Annual Report on Form 10-K for the fiscal year ended June 30, 2017 formatted in Extensible Business Reporting Language (XBRL): (i) the Consolidated Balance Sheets, (ii) the Consolidated Statements of Income, (iii) the Consolidated Statements of Stockholders’ Equity and Comprehensive Income, (iv) the Consolidated Statements of Cash Flows and (v) related notes.
| |
| * | Management contract or compensatory plan or arrangement |
| ** | Exhibits and schedules have been omitted as authorized by Item 601(b)(2) of Regulation S-K. The Registrant will supplementally furnish copies of any of the omitted exhibits and schedules if the SEC requests; provided, however, that the Registrant may request confidential treatment for any exhibits or schedules it furnishes, under Rule 24b-2 of the Exchange Act. |
| (1) | Incorporated by reference to the Registrant’s Registration Statement on Form S-1 (No. 33-91094) declared effective on June 1, 1995. |
| (2) | Incorporated by reference to the Registrant’s Report on Form 10-K for the year ended June 30, 2009. |
| (3) | Incorporated by reference to the Registrant’s Report on Form 10-Q for the quarter ended December 31, 2006. |
| (4) | Incorporated by reference to the Registrant’s Report on Form 8-K filed on July 13, 2007. |
| (5) | Incorporated by reference to the Registrant’s Report on Form 10-K for the year ended June 30, 2007. |
| (6) | Incorporated by reference to the Registrant’s Report on Form 8-K filed on November 15, 2006. |
| (7) | Incorporated by reference to Appendix A of the Registrant’s Definitive Proxy Statement filed on October 15, 2008. |
| (8) | Incorporated by reference to the Registrant’s Report on Form 8-K filed on June 24, 2009. |
| (9) | Incorporated by reference to the Registrant’s Report on Form 8-K filed on November 23, 2009. |
| (10) | Incorporated by reference to the Registrant’s Report on Form 8-K filed on May 25, 2010. |
| (11) | Incorporated by reference to the Registrant’s Report on Form 10-Q for the quarter ended September 30, 2011. |
| (12) | Incorporated by reference to the Registrant’s Report on Form 8-K filed on July 2, 2012. |
| (13) | Incorporated by reference to the Registrant’s Report on Form 8-K/A filed on September 17, 2012. |
| (14) | Incorporated by reference to Appendix A of the Registrant’s Definitive Proxy Statement filed on October 4, 2012. |
| (15) | Incorporated by reference to the Registrant’s Report on Form 8-K filed on November 21, 2012. |
| (16) | Incorporated by reference to Exhibit 3.1 to the Registrant’s Report on Form 10-Q for the quarter ended September 30, 2013 |
| (17) | Incorporated by reference to Exhibits 10.1 and 10.2 to the Registrant’s Report on Form 8-K filed on November 5, 2013 |
| (18) | Incorporated by reference to Exhibit 2.1 to the Registrant’s Report on Form 8-K filed on February 22, 2016. |
| (19) | Incorporated by reference to Exhibit 10.1 to the Registrant’s Report on Form 8-K filed on April 4, 2016. |
| (20) | Incorporated by reference to Exhibit 10.2 to the Registrant’s Report on Form 8-K filed on April 4, 2016. |
| (21) | Incorporated by reference to Exhibit 10.3 to the Registrant’s Report on Form 8-K filed on April 4, 2016. |
| (22) | Incorporated by reference to Exhibit 10.1 to the Registrant’s Report on Form 8-K filed on January 12, 2017. |
| (23) | Filed with this report. |