Attached files
| file | filename |
|---|---|
| EX-99.1 - PRESS RELEASE DATED AUGUST 3, 2017 - J2 GLOBAL, INC. | exh99-1_18095.htm |
| 8-K - FORM 8K DATED AUGUST 3, 2017 - J2 GLOBAL, INC. | j2form8-k_18095.htm |
EXHIBIT 99.2

Investors Presentation ® Second Quarter 2017 Results August 3, 2017

Certain statements in this presentation are “forward-looking statements” within the meaning of the Private Securities Litigation Reform Act of 1995, particularly those regarding our 2017 Financial Guidance. Such forward-looking statements are subject to numerous assumptions, risks and uncertainties that could cause actual results to differ materially from those described in those statements. Readers should carefully review the Risk Factors slide of this presentation. These forward-looking statements are based on management’s expectations or beliefs as of August 3, 2017 and as well as those set forth in our Annual Report on Form 10-K filed by us on March 1, 2017 with the Securities and Exchange Commission (“SEC”) and the other reports we file from time-to-time with the SEC. We undertake no obligation to revise or publicly release any updates to such statements based on future information or actual results. Such forward-looking statements address the following subjects, among others: All information in this presentation speaks as of August 3, 2017 and any redistribution or rebroadcast of this presentation after that date is not intended and will not be construed as updating or confirming such information. Future operating resultsAbility to acquire businesses on acceptable terms and integrate and recognize synergies from acquired businessesDeployment of cash and investment balances to grow the companySubscriber growth, retention, usage levels and average revenue per accountCloud service and digital media growth and continued demand for fax servicesInternational growthNew products, services, features and technologiesCorporate spending including stock repurchasesIntellectual property and related licensing revenuesLiquidity and ability to repay or refinance indebtednessNetwork capacity, coverage, reliability and securityRegulatory developments and taxes 2 Safe Harbor for Forward-Looking Statements

Inability to sustain growth or profitability, particularly in light of an uncertain U.S. and worldwide economy and the related impact on customer acquisition, retention and usage levels, advertising spend and credit and debit card payment declinesReduced use of fax services due to increased use of email, scanning or widespread adoption of digital signatures or otherwiseInability to acquire businesses on acceptable terms or successfully integrate and realize anticipated synergies Failure to offer compelling digital media content causing reduced traffic and advertising levels; loss of advertisers or reduction in advertising spend; increased prevalence or effectiveness of advertising blocking technologies; inability to monetize handheld devices and handheld traffic supplanting monetized traffic; and changes by our vendors or partners that impact our traffic or publisher audience acquisition and/or monetization New or unanticipated costs or tax liabilities, including those relating to federal and state income tax and indirect taxes, such as sales, value-added and telecommunications taxesInability to manage certain risks inherent to our business, such as fraudulent activity, system failure or a security breachCompetition from others with regard to price, service, content and functionalityInadequate intellectual property (IP) protection, expiration or invalidity of key patents, violations of 3rd party IP rights or inability or significant delay in monetizing IPInability to continue to expand our business and operations internationallyInability to maintain required services on acceptable terms with financially stable telecom, co-location and other critical vendors; and inability to obtain telephone numbers in sufficient quantities on acceptable terms and in desired locationsLevel of debt limiting availability of cash flow to reinvest in the business; inability to repay or refinance debt when due; and restrictive covenants relating to debt imposing operating and financial restrictions on business activities or plansInability to maintain and increase our cloud services customer base or average revenue per userEnactment of burdensome telecommunications, Internet, advertising, health care or other regulations, or being subject to existing regulationsInability to adapt to technological change and diversify services & related revenues at acceptable levels of financial returnLoss of services of executive officers and other key employeesOther factors set forth in our Annual Report on Form 10-K filed by us on March 1, 2017 with the Securities and Exchange Commission (“SEC”) and the other reports we file from time-to-time with the SEC The following factors, among others, could cause our business, prospects, financial condition, operating results and cash flows to be materially adversely affected: 3 Risk Factors

Q2 2017 Results

5 Record Q2 ‘17 Consolidated ResultsQ2 Results: All-time quarterly record Revenue $273MEBITDA(1)(2) $110M, FCF(1)(2) $71M, and Adjusted EPS(1)(2) $1.33Q2 ‘17 Revenue up $61M or 29% vs. prior year (largest QoQ increase), EBITDA(1)(2) up $13M or 13% vs. prior yearExecuting M&A investment to further improve market position4 acquisitions completed in Q2 2017, all in the Cloud segment$331M in cash and cash equivalents as of quarter ending June 2017 / Currently $380M+ Cloud SegmentQ2 ‘17 Revenue of $145M, up $2M or 1.5% vs. prior year, EBITDA(1)(2) up $1.6M or 2.2% vs. prior yearRevenue growth in constant currencies is higher at 2.5%EBITDA margin(1)(2)(3) up to 53.2% as compared to 52.9% in prior yearCancel Rate 2.1%, lowest since 2015Digital Media SegmentQ2 ‘17 all-time high Revenue of $128M up $59M or +85% vs. prior yearQ2 ‘17 EBITDA(1)(2) up $11M or 43% vs. prior year 2017 Q2 Accomplishments Figures are Adjusted Non-GAAP. See slides 20-24 for a GAAP reconciliation of revenue, earnings per diluted share, free cash flow, and EBITDA.EBITDA margin defined as EBITDA divided by Revenue

j2 Global Consolidated

7 Q2 2017 Results vs. Prior Year See slides 20-24 for a GAAP reconciliation of revenue, adjusted non-GAAP gross profit, adjusted non-GAAP operating profit, adjusted EBITDA and adjusted earnings per diluted share for the Company as a whole and by segment.Includes Allocation from Cloud Connect to Cloud Services of $1.6M in Q2 ‘17 and $1.7M in Q2 ’16The Consolidated j2 Global data may not foot as each segment is calculated independently ($ in thousands)

Business Cloud Services

Q2 ‘17 all-time high Cloud Connect Revenue of $96M, +3% vs. Q2 ’16Q2 ‘17 Fax Revenue of $79M, continues to grow versus Q2 ’16, driven by strength in our premium eFax brand and Sfax acquisitionAll-time high Fax Revenue represents 29% of consolidated Q2 ‘17 Revenue vs 36% prior yearSubscriber base of 2.4M DIDs, +1.4% vs. Q2 ’16Corporate Fax Revenue continues to grow, up 11% vs Q2 ‘16Voice Revenue of $17M, grew 6% vs. Q2 ’16Acquired MyPhoneFax (Fax87 & Onlinefaxes.com) on June 30, 2017 Q2 2017 Cloud Connect (Fax/Voice) Highlights 9

Q2 ‘17 Revenue of $28M, , flat vs prior year in constant currenciesQ2 ‘ 17 Revenue, -4% vs Q2 ’16, affected by FXInternational Revenue is ~40% EBITDA(1)(2) continues to be > 50%Acquired CloudRecover an Australian-based Backup provider to SMBExpanded service into Australia, we now have operations in 10 countriesPositions us to provide a wide range of data protection services including Cloud Backup, DRaaS & eDiscoveryUpgraded to new state of the art domestic data center to improve back up performance including recovery time Q2 2017 Cloud Backup Highlights Figures are Adjusted Non-GAAPSee slides 20-24 for a GAAP reconciliation of revenue and EBITDA. 10

Email SecurityQ2 ‘17 Revenue of $10.6M and EBITDA(1)(2) of $3.7M (35% margin)Sequential quarterly growth of ~6.5% topline and 17% in EBITDAOrganic growth, increasing margin, M&AAcquired Nordic-based WeCloud & Simitu in Q2 2017, 40% revenue increase in NordicsEmail MarketingQ2 ‘17 Revenue of $7.7M, +22% vs. Q2 ’16EBITDA(1)(2) margin remains > 50% Campaigner continues to focus on product development and sales efforts upstream to higher premium, mid-market customersUsage(3) up 14% vs Q2 ’16ARPA(4) up 22% vs Q2 ‘16 Q2 2017 Email Security & Email Marketing Highlights Figures are Adjusted Non-GAAPEBITDA margin defined as EBITDA divided by RevenueUsage defined as total numbers of email sent per monthARPA defined as Average Revenue per Account per month 11

Digital Media

13 Figures are Adjusted Non-GAAPSee slides 20-24 for a GAAP reconciliation of revenue and EBITDAGoogle Analytics (GA), Omniture and /or Partner Platforms Digital media business demonstrating strong fundamentalsQ2 ‘17 Revenue of $128M, up 85% vs. Q2 ’16Q2 ‘17 EBITDA(1)(2) of $37M, up 43% vs. Q2 ’16Total multi-platform visits were up 17% YoY at 1.4B (3)Everyday Health, Medpage Today and WhatToExpect continue to launch new products and features and expand their reach on social platformsEverydayhealth.com introduced a visual storytelling product (Visualizer) for the first FDA approved drug to treat Primary Progressive Multiple SclerosisEveryday Health social followers grew 16% YOY to 568K, driven by an emphasis on Diet/Nutrition and Healthy LivingWhatToExpect moved into the affiliate commerce space with the launch of a weekly MomDeals email; the release of a Daily Deals Blog featuring 5+ new deals per day; and with over 50 product buying guides now liveMedpage today saw a 40% increase in video plays vs. prior year, to 142K(3) plays in Q2 ’17Commerce revenue grew 45% vs. Q2 2016Shopping clicks to our merchant partners reached a quarterly record high of 34.3 M, a 43% increase YOY and over 1.6M more than Q4 ‘16 holiday shopping quarter(3)AskMen launched a Subscription Review Hub (http://www.askmen.com/subscriptions/) with reviews of 48 brands across eight categories Q2 2017 Digital Media Highlights

14 Q2 2017 Digital Media Highlights IGN’s continues to expand video programming and distribution partnershipsLaunched The IGN Show, a daily, half-hour gaming and pop culture variety show, on cable TV’s Disney XDServed as Twitter’s exclusive E3 Expo partner, broadcasting live for 30 hoursReach over 87 million viewers across all IGN channels and platforms(2)Generated over 212 million video views and 623 million social impressions(2)IGN growing into a major channel for the premiering of movies, TV shows and games Live streaming partner for Universal Studios’ “Fate of the Furious” red carpet movie premiereLive Facebook video Q&A and behind-the-scenes look with the cast of the AMC’s “Preacher”Live streaming partner for Activision’s “Call of Duty: WWII” game premiereVideo subscribers and engagement grew substantiallyIGN passed the 10M subscriber mark on YouTube(3)YouTube watch time set a new record in Q2 with 1B total minutes viewed(3)Ookla achieved key milestones during Q2 2017Speedtest app installs eclipsed 280M, an increase of 30% YOY(1)Total tests across all platforms exceed 800M tests (+17% YOY) with mobile tests growing 23.5% YOY(2)Key additions to the Ziff Davis executive teamMike Finnerty: General Manager, Ziff Davis Tech and Commerce, previously SVP Global Strategy at The Weather CompanyMitch Galbraith: General Manager, IGN Entertainment, previously COO at Funny or DieJeff Blatt: General Manager, Everyday Health Professional, previously CEO of Synapse and SVP, Time Inc.Lisa Kennedy: General Manager, Everyday Health Consumer, previously President of Ideel and GM of Groupon Goods Internal Test DatabaseTwitterYouTube

2017 Financial Guidance

16 Reconfirming 2017 Guidance Figures are adjusted Non-GAAP.Adjusted earnings per diluted share excludes share-based compensation, amortization of acquired intangibles and the impact of any currently anticipated items, in each case net of tax. It is anticipated that the effective tax rate for 2017 (excluding certain expenses that may not be indicative of our recurring core business operating results) will be between 28.5% and 30.5%Overlapping Interest Expense was from June 27, 2017 through July 31, 2017 Revenues $1,130M - $1,170MAdjusted Non-GAAP EPS(1)(2) $5.60 - $6.00Sold Cambridge BioMarketing LLC in July $30M + up to $5M earn outFinancial impact – Revenue ($15M) / Adjusted EPS ($0.04)Refinanced $250M 8.0% Notes and $225M Bank LineJune 27 issued $650M of 6.0% Senior Unsecured Notes by j2 Cloud Services™ LLCFinancial Impact – Adjusted EPS ($0.08)Non-GAAP Interest expense is $13.7M per quarterOverlapping interest expense on the 8.0% Notes has been excluded in Adjusted non-GAAP EPS(3)

Supplemental Information

18 See slide 20-24 for a reconciliation of Non-GAAP earnings and EPS to GAAP net income and diluted GAAP EPSSee slide 20 for a definition of Free Cash Flow and reconciliation to net cash provided by operating activitiesSee slide 20 for a definition of adjusted EBITDA and reconciliation to Net Income Financial Metrics: Consolidated

19 Financial & Other Metrics Cloud & Media Cloud Services revenue includes IP Licensing revenueCloud Services Customers are defined as paying DIDs for Fax & Voice services and direct and resellers’ accounts for other servicesQuarterly ARPU is calculated using our standard convention of applying the average of the quarter’s beginning and ending customer base to the total revenue of the quarterUser cancel rate, also called user churn, is defined as cancellation of service by Cloud Business customers with greater than 4 months of continuous service (continuous service includes Cloud Business customers that are administratively cancelled and reactivated within the same calendar month). User cancel rate is calculated monthly and expressed here as an average over the three months of the quarter. Digital Media Traffic figures based on Google Analytics & Partner Platforms

20 Free Cash Flow (1) Free Cash Flow is defined as net cash provided by operating activities, less purchases of property, plant and equipment, plus excess tax benefits (deficiency) from share based compensation. Free Cash Flow amounts are not meant as a substitute for GAAP, but are solely for informational purposesAdjusted EBITDA is defined as net income plus interest and other expense, net; income tax expense; depreciation and amortization and the items used to reconcile GAAP to Adjusted Non-GAAP EPS. Adjusted EBITDA amounts are not meant as a substitute for GAAP, but are solely for informational purposes GAAP Reconciliation Free Cash Flow & Adjusted EBITDA Adjusted EBITDA (2) ($ in millions)

21 GAAP Reconciliation Q2 Adjusted Non-GAAP Earnings & EPS Adjusted Non-GAAP net income is not meant as a substitute for GAAP, and is defined as GAAP net income with the following modifications: 1) Elimination of shared-based compensation expense and associated payroll taxes 2) Elimination of certain acquisition-related integration costs 3) Elimination of amortization of acquired patents and intangible assets 4) Elimination of additional income tax (expense) benefit from prior years ($ in thousands)
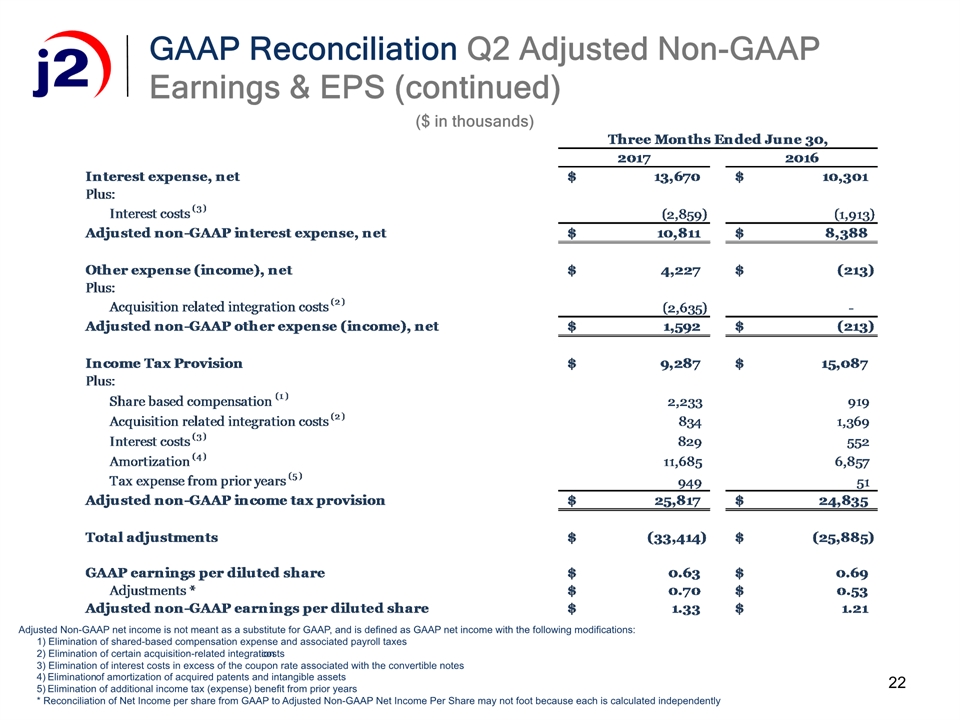
22 GAAP Reconciliation Q2 Adjusted Non-GAAP Earnings & EPS (continued) Adjusted Non-GAAP net income is not meant as a substitute for GAAP, and is defined as GAAP net income with the following modifications: 1) Elimination of shared-based compensation expense and associated payroll taxes 2) Elimination of certain acquisition-related integration costs 3) Elimination of interest costs in excess of the coupon rate associated with the convertible notes 4) Elimination of amortization of acquired patents and intangible assets 5) Elimination of additional income tax (expense) benefit from prior years * Reconciliation of Net Income per share from GAAP to Adjusted Non-GAAP Net Income Per Share may not foot because each is calculated independently ($ in thousands)

23 GAAP Reconciliation Q2 2017 Adjusted EBITDA ($ in thousands)

24 GAAP Reconciliation Q2 2016 Adjusted EBITDA ($ in thousands)

®