Attached files
| file | filename |
|---|---|
| 8-K - 8-K - FIRST CAPITAL INC | a17-19003_18k.htm |
Exhibit 99.1
First Capital, Inc. Symbol: FCAP August 2017 Raymond James Investor Meetings 1
Presented by: Bill Harrod President and CEO Chris Frederick Executive VP and CFO 2
CAUTIONARY NOTE REGARDING FORWARD-LOOKING STATEMENTS This presentation and any oral statements in connection herewith may contain forward-looking statements within the meaning of the Private Securities Litigation Reform Act of 1995. Forward-looking statements can be identified by use of the words “estimates,” “expects,” “believes,” “anticipates,” “projects,” “intends,” “could,” “should” and similar expressions. These statements are based on the current beliefs, expectations, and goals of First Capital, Inc.’s management and are not guarantees of future performance. Forward-looking statements speak only as of the date they are made, are inherently subject to significant risks, uncertainties, and changes in circumstances, including, without limitation, those described under the headings “Business – Forward Looking Statements and Associated Risk” and “Risk Factors” in First Capital, Inc.’s Annual Report on Form 10-K for the year ended December 31, 2016 filed with the Securities and Exchange Commission (“SEC”), as updated and supplemented by its other SEC reports filed from time to time, and should not be relied upon as representing management’s views as of any subsequent date. First Capital, Inc. undertakes no obligation to update forward-looking statements, whether as a result of new information, future events or otherwise, except as may be required by law. 3
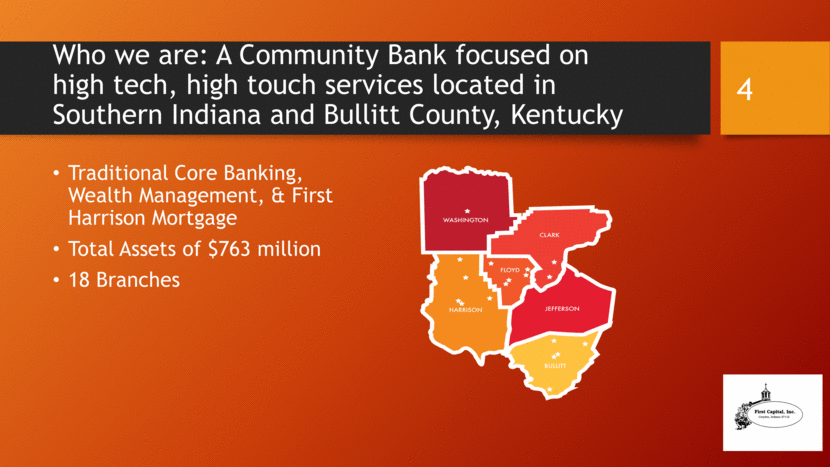
Who we are: A Community Bank focused on high tech, high touch services located in Southern Indiana and Bullitt County, Kentucky Traditional Core Banking, Wealth Management, & First Harrison Mortgage Total Assets of $763 million 18 Branches 4
Diversified Economic Base Major Employers in Southern Indiana Amazon Floyd Memorial Baptist Health Clark Memorial Hospital Greater Clark Schools U.S. Census Bureau Major Employers in Bullitt County, Kentucky Jim Beam Amazon Geek Squad City Gordon Food Services Bullitt County – 5th fastest growing county in the state. www.valuepenguin.com 5
River Ridge Commerce Center In Southern Indiana 6 River Ridge Commerce Center is a world-class business and manufacturing park with 6,000 prime acres under development in the Midwest’s top-ranked business environment. The Commerce Center is a high-profile location with large parcels of land along the Ohio River. It is close in proximity to the Greater Louisville, KY Metro area with access to I-265, I-65, I-64, and I-71. It’s adjacent to the Port of Indiana-Jeffersonville & Clark County Regional Airport. The Commerce Center is minutes away from UPS Worldport at Louisville International Airport. CSX railroad also has connection via the Mid-American rail services along with the U.S. Foreign Trade Zone and Indiana Urban Enterprise Zone.
History of the Company Founded in 1891 as First Federal Savings and Loan Association of Corydon and renamed First Federal Bank in 1993. First Capital, Inc. was established as a bank holding company for First Federal Bank in 1998 and conducted a public stock offering the same year. Merger of equals between First Federal Bank and Harrison County Bank in 2000 and renamed First Harrison Bank upon consummation. Purchased Hometown National Bank in New Albany, Indiana in 2003. Purchased The Peoples Bank of Bullitt County in Bullitt County, Kentucky in 2015. Currently have 18 offices in four counties in Indiana and one county in Kentucky. 7
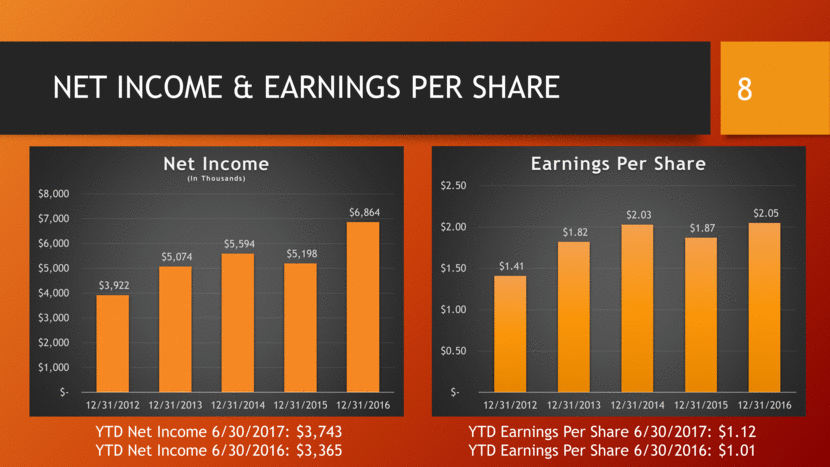
NET INCOME & EARNINGS PER SHARE 8 YTD Net Income 6/30/2017: $3,743 YTD Net Income 6/30/2016: $3,365 YTD Earnings Per Share 6/30/2017: $1.12 YTD Earnings Per Share 6/30/2016: $1.01 $3,922 $5,074 $5,594 $5,198 $6,864 $- $1,000 $2,000 $3,000 $4,000 $5,000 $6,000 $7,000 $8,000 12/31/2012 12/31/2013 12/31/2014 12/31/2015 12/31/2016 Net Income (In Thousands) $1.41 $1.82 $2.03 $1.87 $2.05 $- $0.50 $1.00 $1.50 $2.00 $2.50 12/31/2012 12/31/2013 12/31/2014 12/31/2015 12/31/2016 Earnings Per Share
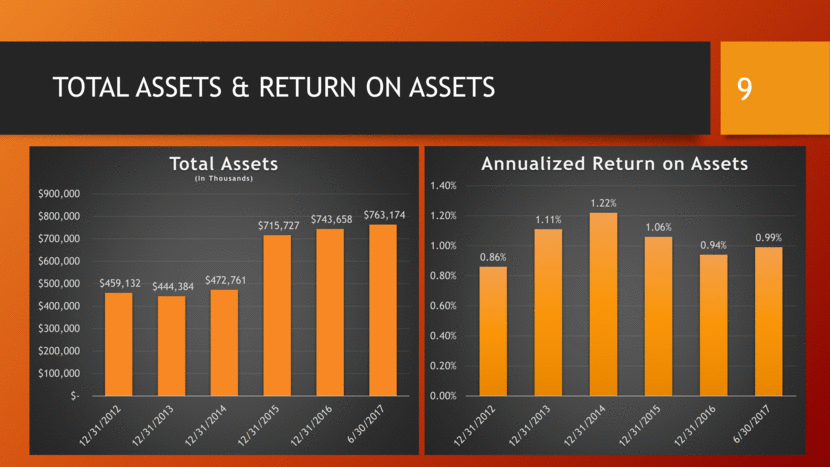
TOTAL ASSETS & RETURN ON ASSETS 9 $459,132 $444,384 $472,761 $715,727 $743,658 $763,174 $- $100,000 $200,000 $300,000 $400,000 $500,000 $600,000 $700,000 $800,000 $900,000 Total Assets (In Thousands) 0.86% 1.11% 1.22% 1.06% 0.94% 0.99% 0.00% 0.20% 0.40% 0.60% 0.80% 1.00% 1.20% 1.40% Annualized Return on Assets
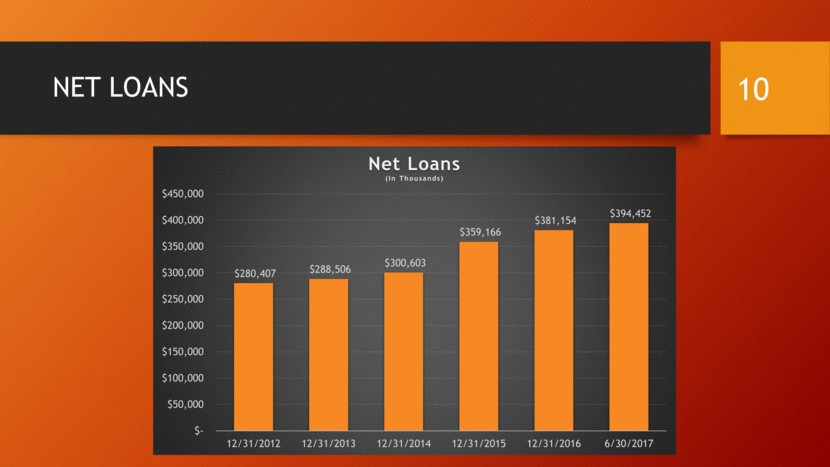
NET LOANS 10 $280,407 $288,506 $300,603 $359,166 $381,154 $394,452 $- $50,000 $100,000 $150,000 $200,000 $250,000 $300,000 $350,000 $400,000 $450,000 12/31/2012 12/31/2013 12/31/2014 12/31/2015 12/31/2016 6/30/2017 Net Loans (In Thousands)
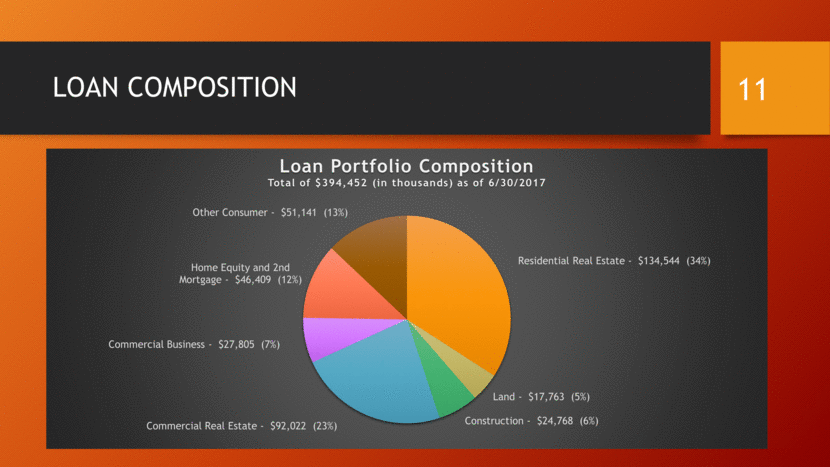
LOAN COMPOSITION 11 Residential Real Estate - $134,544 ( 34% ) Land - $17,763 ( 5% ) Construction - $24,768 ( 6% ) Commercial Real Estate - $92,022 ( 23% ) Commercial Business - $27,805 ( 7% ) Home Equity and 2nd Mortgage - $46,409 ( 12% ) Other Consumer - $51,141 ( 13% ) Loan Portfolio Composition Total of $394,452 (in thousands) as of 6/30/2017
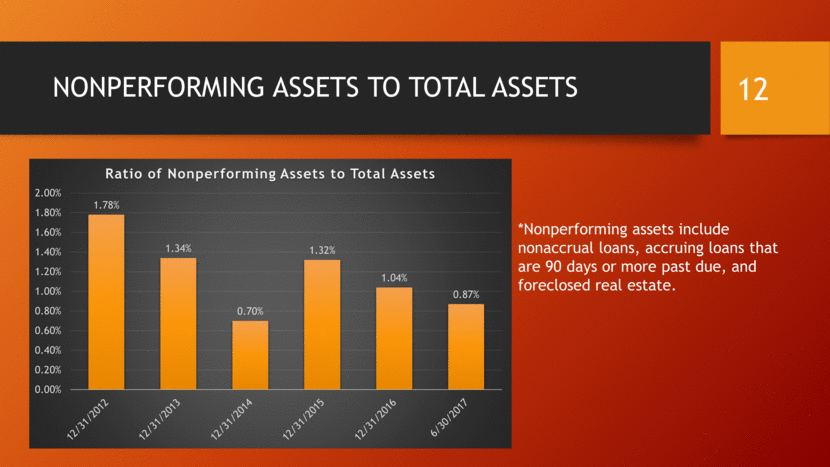
NONPERFORMING ASSETS TO TOTAL ASSETS 12 *Nonperforming assets include nonaccrual loans, accruing loans that are 90 days or more past due, and foreclosed real estate. 1.78% 1.34% 0.70% 1.32% 1.04% 0.87% 0.00% 0.20% 0.40% 0.60% 0.80% 1.00% 1.20% 1.40% 1.60% 1.80% 2.00% Ratio of Nonperforming Assets to Total Assets
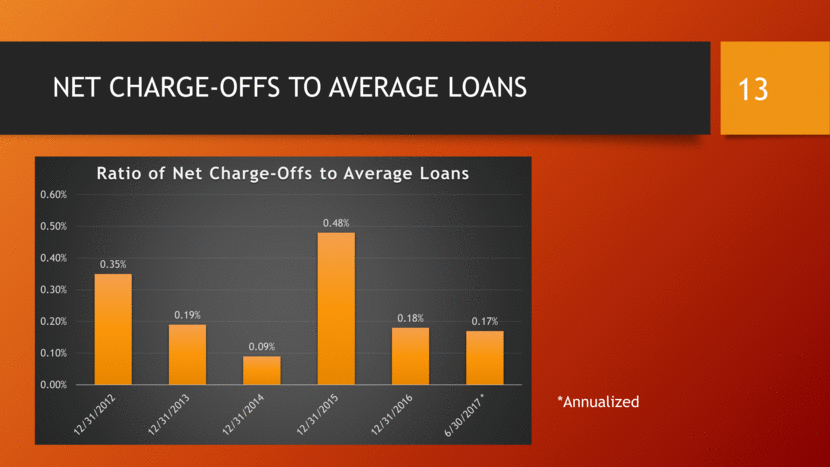
NET CHARGE-OFFS TO AVERAGE LOANS 13 *Annualized 0.35% 0.19% 0.09% 0.48% 0.18% 0.17% 0.00% 0.10% 0.20% 0.30% 0.40% 0.50% 0.60% Ratio of Net Charge - Offs to Average Loans
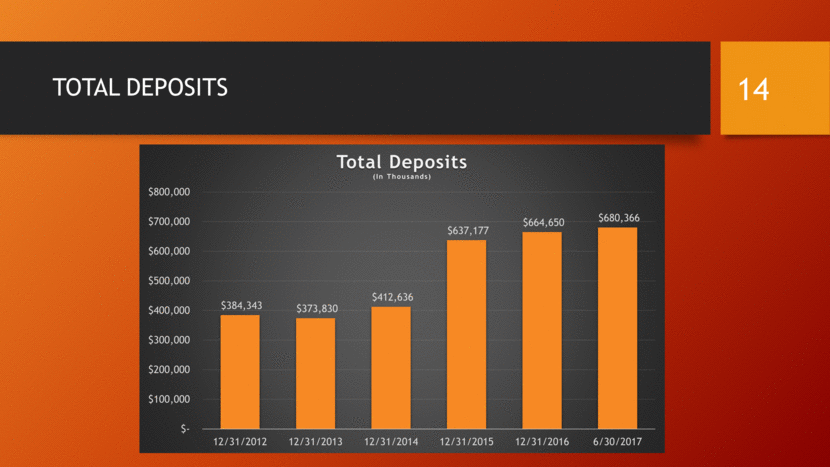
TOTAL DEPOSITS 14 $384,343 $373,830 $412,636 $637,177 $664,650 $680,366 $- $100,000 $200,000 $300,000 $400,000 $500,000 $600,000 $700,000 $800,000 12/31/2012 12/31/2013 12/31/2014 12/31/2015 12/31/2016 6/30/2017 Total Deposits (In Thousands)
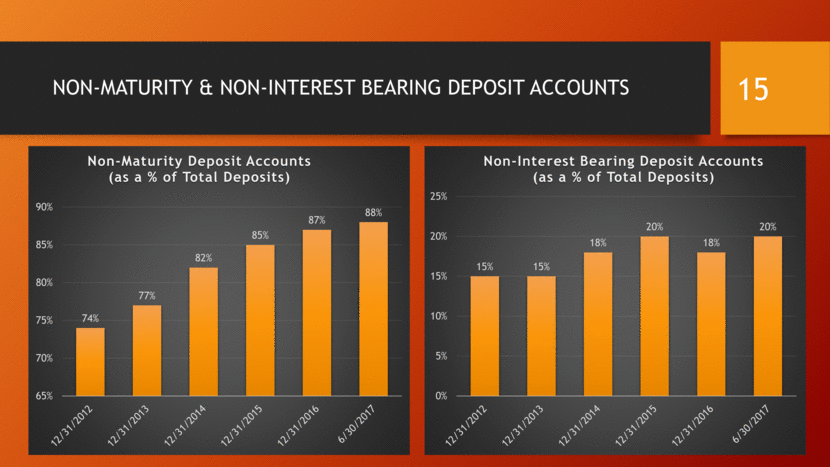
NON-MATURITY & NON-INTEREST BEARING DEPOSIT ACCOUNTS 15 15% 15% 18% 20% 18% 20% 0% 5% 10% 15% 20% 25% Non - Interest Bearing Deposit Accounts (as a % of Total Deposits) 74% 77% 82% 85% 87% 88% 65% 70% 75% 80% 85% 90% Non - Maturity Deposit Accounts (as a % of Total Deposits)
DEPOSIT COMPOSITION 16 Non - Interest Bearing Demand - $137,502 ( 20% ) Time Deposits - $78,907 ( 12% ) Interest Bearing Demand, Savings & Money Market - $463,957 ( 68% ) Deposit Composition Total of $680,366 (in thousands) as of 6/30/2017
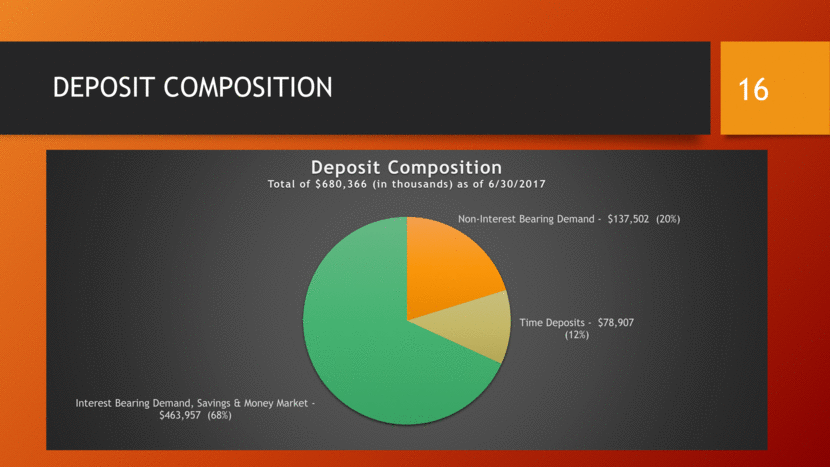
COST OF FUNDS 17 *Annualized 0.73% 0.48% 0.34% 0.29% 0.33% 0.26% 0.00% 0.10% 0.20% 0.30% 0.40% 0.50% 0.60% 0.70% 0.80% Cost of Funds
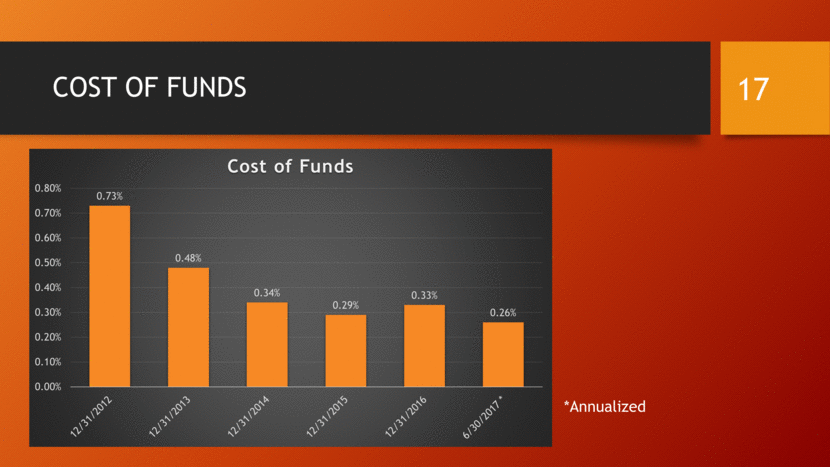
TOTAL EQUITY AND RETURN ON EQUITY 18 $52,824 $53,227 $57,121 $74,396 $75,730 $80,145 $- $10,000 $20,000 $30,000 $40,000 $50,000 $60,000 $70,000 $80,000 $90,000 Total Shareholders’ Equity Net of Non - Controlling Interest in Subsidiary (In Thousands) 7.54% 9.56% 10.09% 8.65% 8.90% 9.66% 0.00% 2.00% 4.00% 6.00% 8.00% 10.00% 12.00% Annualized Return on Equity
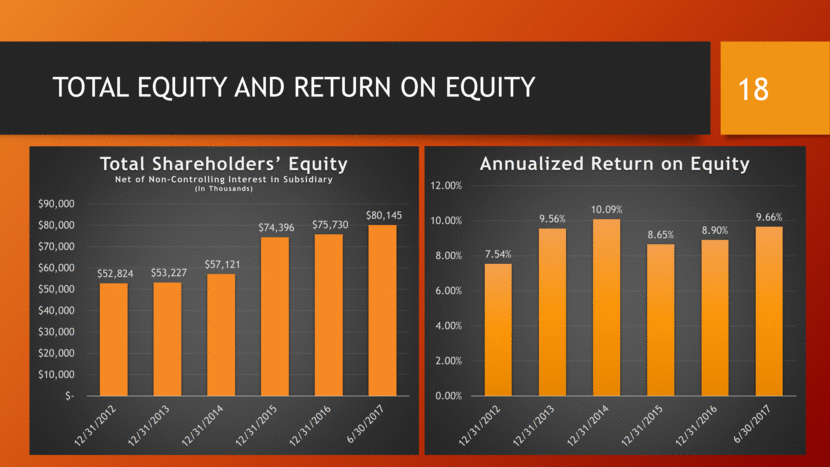
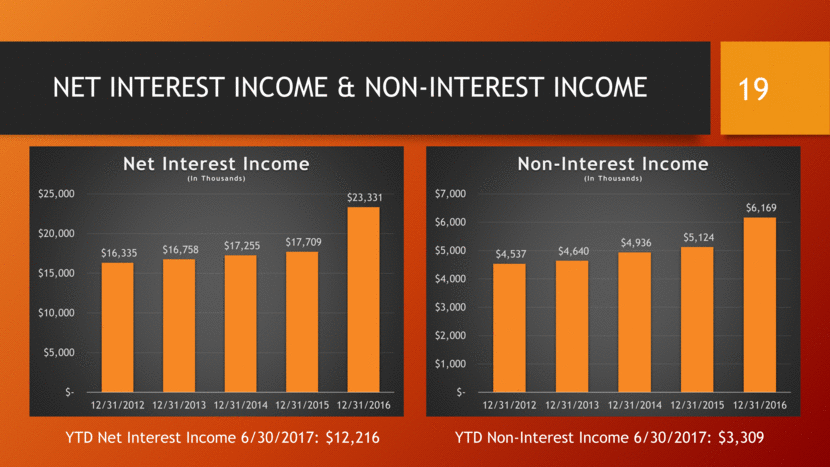
NET INTEREST INCOME & NON-INTEREST INCOME 19 YTD Net Interest Income 6/30/2017: $12,216 YTD Non-Interest Income 6/30/2017: $3,309 $16,335 $16,758 $17,255 $17,709 $23,331 $- $5,000 $10,000 $15,000 $20,000 $25,000 12/31/2012 12/31/2013 12/31/2014 12/31/2015 12/31/2016 Net Interest Income (In Thousands) $4,537 $4,640 $4,936 $5,124 $6,169 $- $1,000 $2,000 $3,000 $4,000 $5,000 $6,000 $7,000 12/31/2012 12/31/2013 12/31/2014 12/31/2015 12/31/2016 Non - Interest Income (In Thousands)
