Attached files
| file | filename |
|---|---|
| EX-99.3 - EXHIBIT 99.3 - Internap Corp | v472224_ex99-3.htm |
| EX-99.1 - EXHIBIT 99.1 - Internap Corp | v472224_ex99-1.htm |
| 8-K - FORM 8-K - Internap Corp | v472224_8k.htm |
Exhibit 99.2

© 2017 Internap Corporation (INAP) 2 nd Quarter 2017 Earnings Peter D. Aquino President & Chief Executive Officer Robert M. Dennerlein Chief Financial Officer August 3, 2017

2 FORWARD - LOOKING STATEMENTS This presentation contains forward - looking statements . These forward - looking statements include statements related to sales , improved profitability, margin expansion, operations improvement, cost reductions, participation in strategic transactions, our strategy to align into pure - play businesses and our expectations for full - year 2017 revenue, Adjusted EBITDA and capital expenditures . Our ability to achieve these forward - looking statements is based on certain assumptions, including our ability to execute on our business strategy, leveraging of multiple routes to market, expanded brand awareness for high - performance Internet infrastructure services and customer churn levels . These assumptions may prove inaccurate in the future . Because such forward - looking statements are not guarantees of future performance or results and involve risks and uncertainties, there are important factors that could cause INAP’s actual results to differ materially from those expressed or implied in the forward - looking statements, due to a variety of important factors . Such important factors include, without limitation : our ability to execute on our business strategy into a pure - play business and drive growth while reducing costs ; our ability to maintain current customers and obtain new ones, whether in a cost - effective manner or at all ; the robustness of the IT infrastructure services market ; our ability to achieve or sustain profitability ; our ability to expand margins and drive higher returns on investment ; our ability to sell into new and existing data center space ; the actual performance of our IT infrastructure services and improving operations ; our ability to correctly forecast capital needs, demand planning and space utilization ; our ability to respond successfully to technological change and the resulting competition ; the geographic concentration of the company’s data centers in certain markets and any adverse developments in local economic conditions or the demand for data center space in these markets ; ability to identify any suitable strategic transactions ; the availability of services from Internet network service providers or network service providers providing network access loops and local loops on favorable terms, or at all ; failure of third party suppliers to deliver their products and services on favorable terms, or at all ; failures in our network operations centers, data centers, network access points or computer systems ; our ability to provide or improve Internet infrastructure services to our customers ; our ability to protect our intellectual property ; our substantial amount of indebtedness, our possibility to raise additional capital when needed, on attractive terms, or at all, our ability to service existing debt or maintain compliance with financial and other covenants contained in our credit agreement ; our compliance with and changes in complex laws and regulations in the U . S . and internationally ; our ability to attract and retain qualified management and other personnel ; and volatility in the trading price of INAP common stock . These risks and other important factors discussed under the caption “Risk Factors” in our most recent Annual Report on Form 10 - K filed with the Securities and Exchange Commission (“SEC”), and our other reports filed with the SEC could cause actual results to differ materially from those indicated by the forward - looking statements made in this presentation . Given these risks and uncertainties, investors should not place undue reliance on forward - looking statements as a prediction of actual results . All forward - looking statements attributable to INAP or persons acting on its behalf are expressly qualified in their entirety by the foregoing forward - looking statements . All such statements speak only as of the date made, and INAP undertakes no obligation to update or revise publicly any forward - looking statements, whether as a result of new information, future events or otherwise . © 2017 Internap Corporation (INAP)
3 NON - GAAP MEASURES In addition to results presented in accordance with GAAP, this presentation includes non - GAAP financial measures. The Company believes these non - GAAP financial measures provide additional information that is useful to investors in helping to understand our underlying performance and trends. Non - GAAP financial measures have inherent limitations, which are not required to be uniformly applied. Readers should be aware of these limitations and should be cautious with respect to the use of such measures. To compensate for these limitations, we use non - GAAP financial measures as comparative tools, together with GAAP financial measures, to assist in the evaluation of our operating performance or financial condition. Our method of calculating these non - GAAP financial measures may differ from methods used by other companies. These non - GAAP financial measures should not be considered in isolation or as a substitute for those financial measures prepared in accordance with GAAP. As required by SEC rules, we have provided in this presentation reconciliations of the non - GAAP financial measures included in this presentation to the most directly comparable GAAP financial measures. Reconciliations of non - GAAP financial measures are also available in the attachment to our second quarter 2017 earnings press release available on our website at www.ir.Internap.com. © 2017 Internap Corporation (INAP)

4 2 nd Quarter Accomplishments Continue to Build Momentum • Top - Line initiatives are designed to improve our trajectory. Good progress in 2Q! – New Sales momentum taking hold: landing larger deals, focusing on adding quality direct sales talent, and leveraging our channel partners. • EBITDA Margin Expansion improves significantly. – INAP COLO and INAP CLOUD contribution margins expand. – Expense reduction projects from Phase I to III continue to bear fruit. • New Business Development effort is stepped up to supplement organic growth. – INAP expands in Phoenix to support a growing customer requirement. • Management strategically reorganizes its data center portfolio and presents INAP’s Top 20 Markets . – New portfolio supplemental data provided. © 2017 Internap Corporation (INAP) INAP is Building a Strong and Consistent Track Record!

5 INAP’S TOP 20 MARKETS © 2017 Internap Corporation (INAP) * Indicates ranking in the latest top 50 Metropolitan Statistical Areas (MSA) of the United States of America and 2016 Canadi an census ** Other major markets include: Chicago, Miami, Northern Virginia, Oakland/San Francisco, London, Amsterdam, Frankfurt, Hong Kon g, Singapore, and Sydney. *** Estimated as of June 30, 2017 About INAP : INAP operates in 20 metropolitan markets, primarily in North America, with 46 data centers and 85 POPs around the world. Currently, there is approximately 950K gross SF with 500K of data center footprint SF. Of the company’s total data center footprint, there is approximately 325K in raised floor SF, and 200K occupied SF. MSA/CAN*
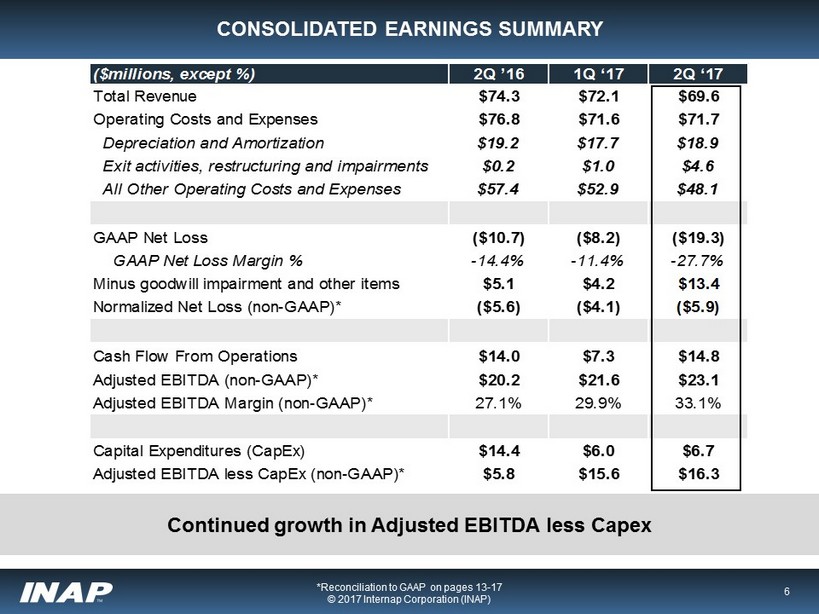
6 ($millions, except %) 2Q ’16 1Q ‘17 2Q ‘17 Total Revenue $74.3 $72.1 $69.6 Operating Costs and Expenses $76.8 $71.6 $71.7 Depreciation and Amortization $19.2 $17.7 $18.9 Exit activities, restructuring and impairments $0.2 $1.0 $4.6 All Other Operating Costs and Expenses $57.4 $52.9 $48.1 GAAP Net Loss ($10.7) ($8.2) ($19.3) GAAP Net Loss Margin % -14.4% -11.4% -27.7% Minus goodwill impairment and other items $5.1 $4.2 $13.4 Normalized Net Loss (non-GAAP)* ($5.6) ($4.1) ($5.9) Cash Flow From Operations $14.0 $7.3 $14.8 Adjusted EBITDA (non-GAAP)* $20.2 $21.6 $23.1 Adjusted EBITDA Margin (non-GAAP)* 27.1% 29.9% 33.1% Capital Expenditures (CapEx) $14.4 $6.0 $6.7 Adjusted EBITDA less CapEx (non-GAAP)* $5.8 $15.6 $16.3 CONSOLIDATED EARNINGS SUMMARY *Reconciliation to GAAP on pages 13 - 17 © 2017 Internap Corporation (INAP) Continued growth in Adjusted EBITDA less Capex
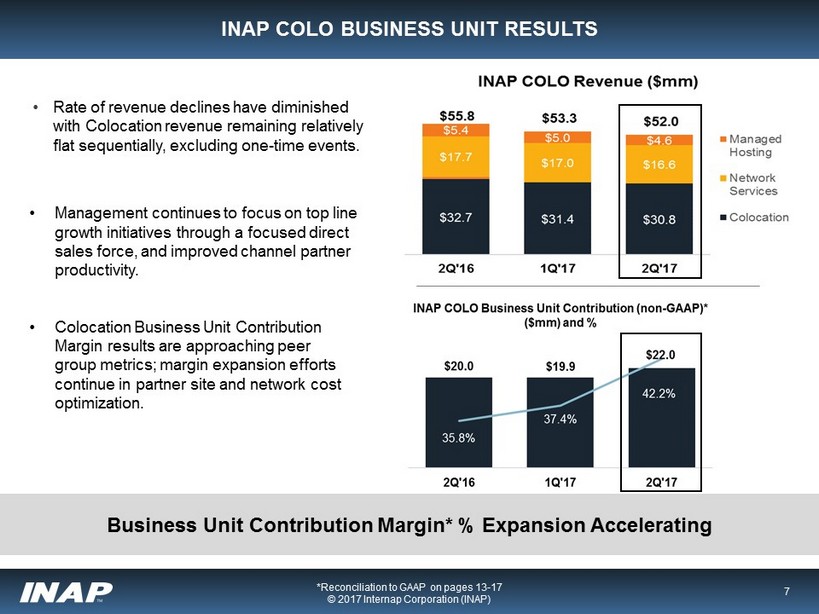
7 INAP COLO BUSINESS UNIT RESULTS *Reconciliation to GAAP on pages 13 - 17 © 2017 Internap Corporation (INAP) [Strengthening sequential performance in revenue generation and profitability.] • Rate of revenue declines have diminished with Colocation revenue remaining relatively flat sequentially, excluding one - time events. Business Unit Contribution Margin* % Expansion Accelerating • Management continues to focus on top line growth initiatives through a focused direct sales force, and improved channel partner productivity. • Colocation Business Unit Contribution Margin results are approaching peer group metrics; margin expansion efforts continue in partner site and network cost optimization.
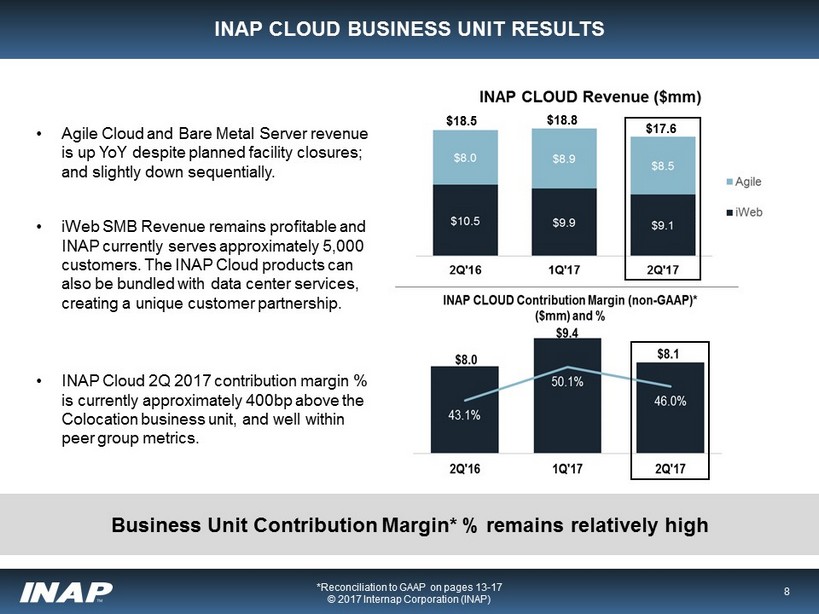
8 INAP CLOUD BUSINESS UNIT RESULTS *Reconciliation to GAAP on pages 13 - 17 © 2017 Internap Corporation (INAP) Business Unit Contribution Margin* % remains relatively high • Agile Cloud and Bare Metal Server revenue is up YoY despite planned facility closures; and slightly down sequentially. • iWeb SMB Revenue remains profitable and INAP currently serves approximately 5,000 customers. The INAP Cloud products can also be bundled with data center services, creating a unique customer partnership. • INAP Cloud 2Q 2017 contribution margin % is currently approximately 400bp above the Colocation business unit, and well within peer group metrics. $17.6 $18.8 $18.5

9 ($millions) 2Q'16 1Q'17 2Q'17 Net cash flows provided by operating activities (GAAP) 14.0$ 7.3$ 14.8$ Capital expenditures: Maintenance capital (1.7) (0.8) (1.0) Growth capital (12.7) (5.2) (5.7) Free Cash Flow (non-GAAP)* (0.4)$ 1.3$ 8.0$ Cash interest expense 7.8 7.3 7.6 Unlevered Free Cash Flow (non-GAAP)* 7.4$ 8.6$ 15.6$ Balance Sheet Total Debt 377.8$ 329.6$ 486.7$ Cash & Cash Equivalents 13.9$ 9.2$ 17.5$ CASH FLOW AND BALANCE SHEET SUMMARY *Reconciliation to GAAP on pages 13 - 17 © 2017 Internap Corporation (INAP) Debt and interest expense increases from refinancing and capital lease conversions

10 SECOND QUARTER 2017 FINANCIAL GUIDANCE UPDATE ($ millions) Former 2017 Range Updated 2017 Range Revenue $275 to $285 Reaffirming Adjusted EBITDA (non - GAAP)* $85 to $90 Reaffirming Capital Expenditures $37 - $42 $32 - $37 *Reconciliation to GAAP on pages 13 - 17 © 2017 Internap Corporation (INAP) Building on Adjusted EBITDA less Capex in 2017

11 Next Steps – Positioning INAP for Long - Term Growth © 2017 Internap Corporation (INAP) Strengthening the INAP Portfolio to Increase Shareholder Value • By concentrating our Sales efforts in the INAP Top 20 Markets , we expect to improve both sales productivity and profitable growth. • Management is leveraging our data center platform in major markets to differentiate INAP from the competition, as a full - service Retail Colo provider that can also offer Cloud and Network Services. • We aim to build a core competency in Sales Performance and Superior Customer Service in the age of Internet Infrastructure, where demand for solutions and partnerships can continue to attract and retain enterprise and business customers over the long term. • By strengthening the INAP portfolio through both organic and accretive deals , INAP is in the position to create long - term sustainable growth.

12 © 2017 Internap Corporation (INAP) APPENDIX Reconciliation of Non - GAAP Financial Measures

13 RECONCILIATION OF NON - GAAP FINANCIAL MEASURES Normalized Net Loss is a non - GAAP measure . Normalized Net Loss is net loss plus exit activities, restructuring and impairments, stock - based compensation, non - income tax contingency, strategic alternatives and related costs, organizational realignment costs, pre - acquisition costs, claim settlements, and debt extinguishment and modification expenses. © 2017 Internap Corporation (INAP) June 30, 2017 March 31, 2017 June 30, 2016 Net loss (GAAP) (19,283)$ (8,230)$ (10,693)$ Exit activities, restructuring and impairments, including goodwill impairment 4,628 1,023 152 Stock-based compensation 534 598 1,542 Non-income tax contingency - 1,500 - Strategic alternatives and related costs 8 6 282 Organizational realignment costs 295 287 1,417 Pre-acquisition costs 95 - - Claim settlement 713 - - Debt extinguishment and modification expenses 7,105 747 1,716 Normalized Net Loss (non-GAAP) (5,905)$ (4,069)$ (5,584)$ Three Months Ended

14 RECONCILIATION OF NON - GAAP FINANCIAL MEASURES Business Unit Contribution and Business Unit Contribution Margin are non - GAAP measures. Business Unit Contribution is defined as business unit revenues less direct costs of sales and services, customer support, and sales and marketing, exclusive of depreciation and amortization. Business Unit Contribution Margin is Business Unit Contribution as a percentage of business unit revenues. ($ in thousands) © 2017 Internap Corporation (INAP) June 30, 2017 March 31, 2017 June 30, 2016 Revenues: INAP COLO 52,044$ 53,339$ 55,827$ INAP CLOUD 17,598 18,794 18,488 Total 69,642 72,133 74,315 Direct costs of sales and services, customer support and sales and marketing: INAP COLO* 30,383 33,050 35,835 INAP CLOUD* 9,412 9,464 10,529 Total 39,795 42,514 46,364 Business Unit Contribution: INAP COLO 21,984 19,923 19,990 INAP CLOUD 8,101 9,416 7,960 Total 30,085$ 29,339$ 27,949$ Business Unit Contribution Margin: INAP COLO 42.2% 37.4% 35.8% INAP CLOUD 46.0% 50.1% 43.1% Total 43.2% 40.7% 37.6% Three Months Ended

15 RECONCILIATION OF NON - GAAP FINANCIAL MEASURES Adjusted EBITDA and Adjusted EBITDA Margin are non - GAAP measures. Adjusted EBITDA is GAAP net loss plus depreciation and amortization, interest expense, provision (benefit) for income taxes, other expense (income), (gain) loss on disposal of property and equipment, exit activities, restructuring and impairments, stock - based compensation, non - income tax contingency, strategic alternatives and related costs, organizational realignment costs, pre - acquisition costs, and claim settlements. Adjusted EBITDA margin is adjusted EBITDA as a percentage of revenues. © 2017 Internap Corporation (INAP) Reconciliation of GAAP Net Loss to Adjusted EBITDA: Amount Percent Amount Percent Amount Percent Total Revenue 69,642$ 100.0% 72,133$ 100.0% 74,315$ 100.0% Net Loss (GAAP) (19,283)$ -27.7% (8,230)$ -11.4% (10,693)$ -14.4% Add: Depreciation and amortization 18,934 27.2% 17,745 24.6% 19,217 25.9% Interest expense 17,145 24.6% 8,137 11.3% 8,082 10.9% Provision (benefit) for income taxes (50) -0.1% 518 0.7% 62 0.1% Other expense (income) 135 0.2% 67 0.1% 75 0.1% (Gain) loss on disposal of property and equipment, net (103) -0.1% (97) -0.1% 31 0.0% Exit activities, restructuring and impairments, including goodwill impairment 4,628 6.6% 1,023 1.4% 152 0.2% Stock-based compensation 534 0.8% 598 0.8% 1,542 2.1% Non-income tax contingency - 0.0% 1,500 2.1% - 0.0% Strategic alternatives and related costs 8 0.0% 6 0.0% 282 0.4% Organizational realignment costs 295 0.4% 287 0.4% 1,417 1.9% Pre-acquisition costs 95 0.1% - 0.0% - 0.0% Claim settlement 713 1.0% - 0.0% - 0.0% Adjusted EBITDA (non-GAAP) 23,051$ 33.1% 21,554$ 29.9% 20,167$ 27.1% June 30, 2017 March 31, 2017 June 30, 2016 Three Months Ended

16 RECONCILIATION OF NON - GAAP FINANCIAL MEASURES Adjusted EBITDA less CapEx is a non - GAAP measure. Adjusted EBITDA less CapEx is Adjusted EBITDA less capital expenditures with Adjusted EBITDA for this non - GAAP measure defined as net cash flow provided by operating activities plus cash paid for interest, cash paid for income taxes, cash paid for exit activities and restructuring, cash paid for strategic alternatives and related costs, cash paid for organizational realignment costs, payment of debt lender fees and other working capital changes less capital expenditures. © 2017 Internap Corporation (INAP) Reconciliation of GAAP Net Cash Flows provided by Operating Activities to Adjusted EBITDA less CapEx: June 30, 2017 March 31, 2017 June 30, 2016 Net Cash Flow provided by operating activites: 14,787$ 7,264$ 14,019$ Add : Cash paid for interest 7,563 7,336 7,816 Cash paid for income taxes 148 - 120 Cash paid for exit activities and restructuring 1,080 1,086 775 Cash paid for strategic alternatives and related costs 171 189 816 Cash paid for organizational realignment costs 912 267 261 Payment of debt lender fees - 2,583 1,716 Other working capital changes (1,610) 2,829 (5,356) Adjusted EBITDA (non-GAAP) 23,051$ 21,554$ 20,167$ Less: Capital Expenditures (CapEx) 6,748$ 5,989$ 14,402$ Adjusted EBITDA less CapEx 16,303$ 15,565$ 5,765$

17 RECONCILIATION OF NON - GAAP FINANCIAL MEASURES © 2017 Internap Corporation (INAP) Free Cash F low and Unlevered F ree C ash F low are non - GAAP measures . Free Cash F low is net cash flows provided by operating activities minus capital expenditures. Unlevered Free C ash F low is F ree Cash F low plus cash interest expense: Below is a reconciliation of GAAP net loss to forward looking Adjusted EBITDA for the period indicated: (in $millions) Amount Percent Amount Percent Total Revenue 275$ 100.0% 285$ 100.0% Net Loss (GAAP) (52)$ -18.9% (48)$ -16.8% Add: Depreciation and amortization 75 27.3% 75 26.3% Interest expense 49 17.8% 49 17.2% Provision for income taxes 1 0.4% 1 0.4% Other expense (income) 0.0% 0.0% (Gain) loss on disposal of property and equipment, net 0.0% 0.0% Exit activities, restructuring and impairments, including goodwill impairment 7 2.5% 7 2.5% Stock-based compensation 2 0.7% 2 0.7% Non-income tax contingency 1 0.4% 2 0.7% Strategic alternatives and related costs 0.0% 0.0% Organizational realignment costs 1 0.4% 1 0.4% Pre-acquisition costs 0.0% 0.0% Claim settlement 1 0.4% 1 0.4% Adjusted EBITDA (non-GAAP) 85$ 30.9% 90$ 31.6% Low High 2017 Full-Year Guidance June 30, 2017 March 31, 2017 June 30, 2016 Net cash flows provided by operating activities 14,787$ 7,264$ 14,019$ Capital expenditures: Maintenance capital (1,018) (790) (1,675) Growth capital (5,730) (5,199) (12,727) Free Cash Flow (non-GAAP) 8,039 1,275 (383) Cash interest expense 7,563 7,336 7,816 Unlevered Free Cash Flow (non-GAAP) 15,602$ 8,611$ 7,433$ Three Months Ended