Attached files
| file | filename |
|---|---|
| EX-99.1 - EXHIBIT 99.1 - AMAG PHARMACEUTICALS, INC. | ex991q22017earningsrelease.htm |
| 8-K - 8-K - AMAG PHARMACEUTICALS, INC. | amagq220178-k.htm |

AMAG Pharmaceuticals
Q2-2017 Financial Results &
Corporate Update
August 3, 2017
1

Forward-Looking Statements
This presentation contains forward-looking statements within the meaning of the Private Securities Litigation Reform Act of 1995
(PSLRA) and other federal securities laws. Any statements contained herein which do not describe historical facts, including, among
others, expectations regarding the commercial opportunity and revenue potential of Intrarosa, including the number of women who
suffer from dyspareunia in the U.S.; AMAG’s beliefs that its approach to the Intrarosa launch is well-planned and will result in a
successful launch and the quick capture of market share; AMAG’s unrestricted coverage goal of 65% by year end; beliefs that AMAG’s
commercial copay savings program will maximize the Intrarosa launch uptake; Intrarosa launch priorities, including affordable access for
patients and increased market awareness and physician prescribing; beliefs regarding the Makena market opportunity and Makena’s
position in the market; future growth drivers for Makena, including its ability to continue to gain share from compounders, grow the
Makena @Home administration, expand use in the late preterm birth segment, prepare to launch the Makena subcutaneous auto-
injector and prepare for potential competitive threat; growth drivers for Cord Blood Registry (CBR), including plans to differentiate CBR’s
offerings, build value proposition on storing newborn stem cells and leverage advancements in stem cell research; growth drivers for
Feraheme, including continued growth in key segments, complete recent group purchasing organization (GPO) sales, optimize net
revenue per gram, and expectations that the size of the addressable market, if the broader indication is approved, would double and
would require minimal sales force expansion; AMAG’s 2017 financial guidance, including forecasted GAAP and non-GAAP revenues,
GAAP net income and operating income, and non-GAAP adjusted EBITDA; and expectations regarding regulatory timelines for the
Makena subcutaneous auto-injector, Feraheme broader label, Intrarosa, bremelanotide and Velo, including anticipated FDA action and
commercial launch for each product, as applicable; AMAG’s key priorities for the second half of 2017 related to its products and product
candidates, portfolio expansion and financial goals; are forward-looking statements which involve risks and uncertainties that could
cause actual results to differ materially from those discussed in such forward-looking statements.
Such risks and uncertainties include, among others, those risks identified in AMAG’s Securities and Exchange Commission (“SEC”) filings,
including its Annual Report on Form 10-K for the year ended December 31, 2016 and its Quarterly Report on Form 10-Q for the quarter
ended March 31, 2017 and subsequent filings with the SEC. AMAG cautions you not to place undue reliance on any forward-looking
statements, which speak only as of the date they are made. AMAG disclaims any obligation to publicly update or revise any such
statements to reflect any change in expectations or in events, conditions or circumstances on which any such statements may be based,
or that may affect the likelihood that actual results will differ from those set forth in the forward-looking statements.
AMAG Pharmaceuticals® and Feraheme® are registered trademarks of AMAG Pharmaceuticals, Inc. MuGard® is a registered trademark of
Abeona Therapeutics, Inc. Makena® is a registered trademark of AMAG Pharmaceuticals IP, Ltd. Cord Blood Registry® and CBR® are
registered trademarks of Cbr Systems, Inc. IntrarosaTM is a trademark of Endoceutics, Inc.
2

Q2-2017 Earnings Call Agenda
Q2-2017 Highlights and Recent Events 1
5 Q&A
2 Product Portfolio Commercial Overview
4 2017 Key Priorities and Closing Remarks
3 Financial Update and Guidance
3

Bill Heiden
President & CEO
Q2-2017 Highlights and
Recent Events
4

Q2-2017 Financial Highlights
$127.4
$158.4
Q2-2016 Q2-2017
24% increase
driven by
strong growth
across product
portfolio
GAAP Total Net Revenues ($M)
Makena revenue CBR revenue Feraheme/MuGard revenue
5

Q2-2017 Financial Highlights
$18.1
$3.6
Q2-2016 Q2-2017
Investing in new
product launch and
development while
maintaining strong
cash flows
Ended Q2-2017 with
~$400M in cash and
investments
$50.1
Q2-2016 Q2-2017
GAAP Operating Income
($M)
Non-GAAP Adj. EBITDA1
($M)
1 See slide 37 for reconciliation of GAAP to non-GAAP financial results.
$64.6
6

Strong Execution in Q2-2017
Highlights and Recent Events
Closed Endoceutics licensing transaction, hired and trained new sales
team, and launched Intrarosa
Drove record quarterly Makena sales to over $102M and received FDA
acceptance for review of Makena subcutaneous (sub-q) auto-injector sNDA
Achieved record quarterly Feraheme sales and completed submission to
FDA to broaden Feraheme label
Generated strong new family enrollments at Cord Blood Registry
Advanced bremelanotide development and regulatory activities to support
the planned NDA submission in early 2018
Strengthened balance sheet and ended Q2-2017 with ~$400M of cash and
investments
7

AMAG’s Expanding Portfolio of Products
Feraheme
Treatment of iron
deficiency anemia (IDA)
in adult patients with
chronic kidney disease
(CKD)
The only FDA-approved
therapy to reduce
recurrent preterm birth
in certain at-risk women
World’s largest umbilical
cord stem cell collection
and storage company
Candidate for the
treatment of severe
preeclampsia
An investigational
product for the on-
demand treatment of
hypoactive sexual desire
disorder (HSDD)
MuGard
Management of oral
mucositis, a common
side effect of radiation or
chemotherapy
Maternal and Women’s Health Hematology /
Oncology Pregnancy
& Birth
Wellness
Post-Menopausal
Health
Makena
Velo
Option
Cord Blood
Registry
Bremelanotide Intrarosa
FDA-approved non-
estrogen product to
treat moderate-to-
severe dyspareunia
(pain during sex), a
common symptom of
VVA, due to
menopause, which
does not carry a boxed
warning in its label
8

Product Portfolio
Commercial Overview
Nik Grund
Chief Commercial Officer
9

Launched July 24, 2017
W O M E N ’ S H E A L T H : I N T R A R O S A
10

Affected, but not currently seeking treatment
Utilizing OTC treatments
Dyspareunia: Sizable Untapped Treatment Market
Currently
on Rx estrogen
therapy
Local (intra-vaginal)
estrogen therapies = sales
of >$1B per year1
1.7M
women2
~6M
women2
~12M
women2
W O M E N ’ S H E A L T H : I N T R A R O S A
~20M women in U.S. suffer from dyspareunia, a symptom of VVA
New potential
patients represent a
market opportunity
of ~$14B/year3
11
1 Based on IMS SMART Tool NSP and NPA data for total VVA prescriptions. See slide 8 for Intrarosa’s indication.
2 AMAG estimates based on:
a) Wysocki et al. Management of Vaginal Atrophy: Implications from the REVIVE Survey. Clinical Medicine Insights: Reproductive
Health 2014:8 23–30;
b) Kingsberg et al. Vulvar and Vaginal Atrophy in Postmenopausal Women: Findings from the REVIVE Survey. J Sex Med 2013;101790-1799; and
c) F. Palma et al: Vaginal atrophy of women in postmenopause. Results from a multicentric observational study: The AGATA study.
3 Company estimated based on IMS SMART Tool NSP and NPA data.

Full HCP
Campaign
NAMS
October 2017
Phase 3
Well-Planned Phased Approach for Commercial Launch
Coming
Soon
ACOG
May 2017
Phase 1
Now Available
Launch Day 1
July 2017
Phase 2
Patient
Engagement
Programs
1H-2018
Phase 4
Time
Sales
W O M E N ’ S H E A L T H : I N T R A R O S A
12

Inventory broadly available in
wholesaler distribution network
Product available at more than
5,000 retail pharmacies
Samples being distributed to HCP
offices to facilitate new patient
starts
Commercial insurance coverage
and copay savings program in
place
Launch Day 1 – Now Available
W O M E N ’ S H E A L T H : I N T R A R O S A
INTRAROSA has no FDA
boxed warning
13

Commercial Lives Covered for Intrarosa
Approximately 2/3 of
prescriptions for VVA are
commercial pay1
– Top 18 accounts represent
>85% of covered lives2
Unrestricted coverage 14%
and growing
W O M E N ’ S H E A L T H : I N T R A R O S A
1 IMS FIA data, last 24 months, July 2017.
2 Market research sponsored by AMAG and conducted Insight Strategy Advisors.
3 MMIT data as of 7/24/17.
62%
14%
24% Not covered
Covered (unrestricted)
Covered (PA/ST)
Today
Year end 2017 goal 65% unrestricted coverage
Working with Medicare on potential reimbursement
Tomorrow
Commercial Lives Covered3
14

Commercial Copay Savings Program in Place
Remove Cost as a Barrier in Order to Maximize Launch Uptake
W O M E N ’ S H E A L T H : I N T R A R O S A
Comprehensive commercial copay savings program
– $0 copay first month on therapy (regardless of formulary access)
– Refill copays are no greater than $25 (regardless of formulary access)
– No activation of card required
– Distributed to HCPs via sales force (printed cards) and downloadable via
Intrarosa.com
15

62%
14%
24%
Not covered
Covered (unrestricted)
Covered (PA/ST)
AMAG Well Positioned for a Successful Launch
Launch Priorities to Watch
M A T E R N A L H E A L T H : I N T R A R O S A
Commercial Lives Covered1
Create affordable access for
patients
‒ Increase percentage of covered
lives
1
Increase physician prescribing
‒ Market share
‒ # of HCPs prescribing
‒ NRx and TRx (growth)
3
1 MMIT Data as of 7/24/17.
Today: 14% covered (unrestricted)
Y/E 2017 goal: 65% covered (unrestricted)
Increase market awareness
‒ # of first time prescribers
2
16

Differentiated mechanism of action
Only FDA-approved non-estrogen local product1 for moderate-
to-severe dyspareunia due to menopause
– Only product without a boxed warning
Well-planned launch strategy to quickly capture market share
Significant market opportunity with sizeable revenue potential
In Summary
W O M E N ’ S H E A L T H : I N T R A R O S A
1 Locally converted to estrogens and androgens.
17

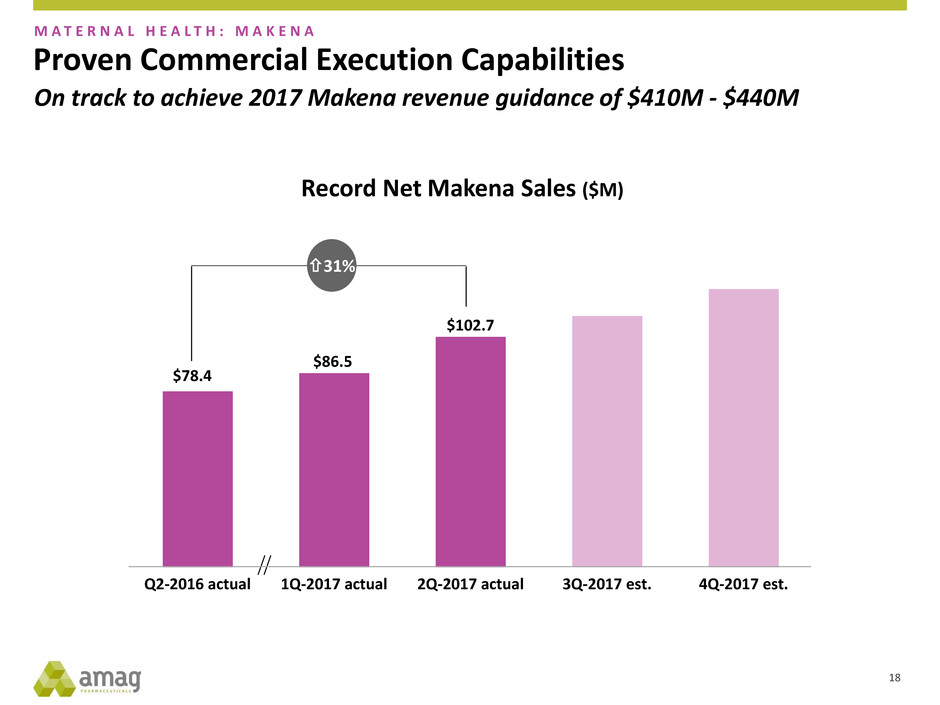
Proven Commercial Execution Capabilities
$78.4
$86.5
$102.7
Q2-2016 actual 1Q-2017 actual 2Q-2017 actual 3Q-2017 est. 4Q-2017 est.
Record Net Makena Sales ($M)
31%
M A T E R N A L H E A L T H : M A K E N A
On track to achieve 2017 Makena revenue guidance of $410M - $440M
18

Makena: Continued Growth
2017 Makena Growth Drivers
M A T E R N A L H E A L T H : M A K E N A
1 Company estimates Makena market share based on distributor dispensing data and all other market share based on physician market
research data conducted by AMAG.
2 AMAG estimates market opportunity based on 140,000 patients, >16 injections/patient and net revenue of ~$425-$450/injection.
3 Off guidance represents patients treated outside guidance of Society for Maternal Fetal Medicine, including patients treated with
unapproved therapies and untreated patients.
4 If regulatory approval is received.
Off Guidance3
30%
At June 30, 2017
Makena
47%
Compounded
Hydroxyprogesterone
Caproate
23%
$1B Market Opportunity2
Estimated Makena market share1 up 3 percentage points over Q1-2017
Continue share gains from
compounders and grow Makena
@Home administration
1
Expand use in late preterm birth
segment 2
Prepare for Q1-2018 launch of
sub-q auto-injector4 3
Prepare for potential competitive
threat in 2018 4
19

$24.4
$28.0
Q2-2016 Q2-2017
$29.4 $29.4
Q2-2016 Q2-2017
GAAP CBR Revenue ($M) Non-GAAP CBR Revenue1 ($M)
CBR: Attractive Recurring Revenue Stream
M A T E R N A L H E A L T H : C O R D B L O O D R E G I S T R Y
1 Non-GAAP CBR revenue includes purchase accounting adjustments related to CBR
deferred revenue of $5.1M and $1.4M for Q2-2016 and Q2-2017, respectively.
20

CBR 2017 Growth Drivers
Differentiate CBR’s offerings
– Increase/stabilize first time enrollments 1
Build value proposition on storing newborn
stem cells
– Harmonizing annual storage price
– Stabilized new enrollment pricing
2
Leverage advancements in stem cell research
with OB/GYN’s and pregnant families 3
M A T E R N A L H E A L T H : C O R D B L O O D R E G I S T R Y
21

Solid Financial Performance; Expected Future Growth
$24.3
$27.5
Q2-2016 Q2-2017
Feraheme Revenue1 ($M)
13%
H E M A T O L O G Y / O N C O L O G Y : F E R A H E M E
2017 Growth Drivers
Continued growth in key segments
Pull through recent GPO access wins
Optimize net revenue per gram
Prepare for expanded label to include all
IDA patients2
– Completed submission to FDA with
approval and launch anticipated in 1H-2018
– Would double addressable market, if
approved3
– Minimal expansion required from current
commercial footprint
1 Represents Feraheme revenues only. Excludes MuGard revenues as reported on financial statements.
2 If regulatory approval is received.
3 AMAG estimates market opportunity using ~$600/gram and 1.3M grams (Q2-2017 IMS data annualized).
22

Large IV Iron Market Opportunity of $780M1,2
Feraheme
25%3
Other IV irons
75%3
Current
Addressable
Market:
$390M3
Additional
Addressable
Market:
$390M
‒ Iron deficiency anemia
caused by other diseases
– Iron deficiency anemia caused
by chronic kidney disease
Label expansion
doubles
our addressable
market1
Non-dialysis IV iron market
H E M A T O L O G Y / O N C O L O G Y : F E R A H E M E
23
1 If regulatory approval is received for broad IDA indication.
2 AMAG estimates market opportunity using ~$600/gram and 1.3M grams (Q2-2017 IMS data annualized).
3 AMAG estimates current market using IMS data and internal analytics.

IV Iron Market Represents Small Subset of Patients Who
Suffer from IDA
Opportunity to convert from oral to IV treatments
IDA-CKD Patients
Majority under the care
of current AMAG call
points; hematology /
oncology & hospital
infusion centers
Diagnosed IDA Patients
Under the care of
other physician
specialists, including
1.5M in women’s
health
700,0002
IV Patients
H E M A T O L O G Y / O N C O L O G Y : F E R A H E M E
4.5M Total U.S. Patients Diagnosed with Iron Deficiency Anemia1
24
1 Global Intravenous (I.V.) Iron Drugs Market Report: 2015 Edition.
2 AMAG estimates number of IV patients using 1.3M grams (Q2-2017 IMS data annualized) and an estimated average dose per course
of therapy.

Financial Update and
Guidance
Ted Myles
Chief Financial Officer
25

$236.4
$297.8
$25.5
$(36.4)
1
1
$127.4
$158.4
$3.6
$18.1
Q2-2016 Q2-2017
Makena revenue CBR revenue Feraheme/MuGard revenue GAAP Operating income (loss)
24%
1H-2016 1H-2017
26%
GAAP Financials for the
3-months Ended June 30
($M)
GAAP Financials for the
6-months Ended June 30
($M)
1 Excludes $273,000 and $53,000 of “License fee, collaboration and other revenues” in 1H-2016 and 1H-2017, respectively.
Continued Revenue Growth and Portfolio Investments
26

Continued Revenue Growth and Portfolio Investments
$250.3
$112.1
$300.6
$107.7
1H-2016 1H-2017
20%
Makena revenue CBR revenue Feraheme/MuGard revenue Non-GAAP adjusted EBITDA
$132.5
$64.6
$159.8
$50.1
Q2-2016 Q2-2017
21%
1 See slide 37 for a reconciliation of GAAP to non-GAAP financial results.
Non-GAAP Financials for the
3-months Ended June 30
($M)
Non-GAAP Financials for the
6-months Ended June 30
($M)
1 1
27

Affirming 2017 Financial Guidance
($M) 2017 GAAP
Guidance
2017 Non-GAAP
Guidance1
Makena sales $410 - $440 $410 - $440
Feraheme/MuGard sales $100 - $110 $100 - $110
CBR revenue $110 - $120 $115 - $1252
Intrarosa $5 - $15 $5 - $15
Total revenue $625 - $685 $630 - $690
Net income (loss) ($62) - ($31)1 N/A
Operating income (loss) ($23) - $271 N/A
Adjusted EBITDA N/A $210 - $260
1 See slide 38 for a reconciliation of 2017 financial guidance.
2 Revenue includes purchase accounting adjustments related to CBR deferred revenue. 28

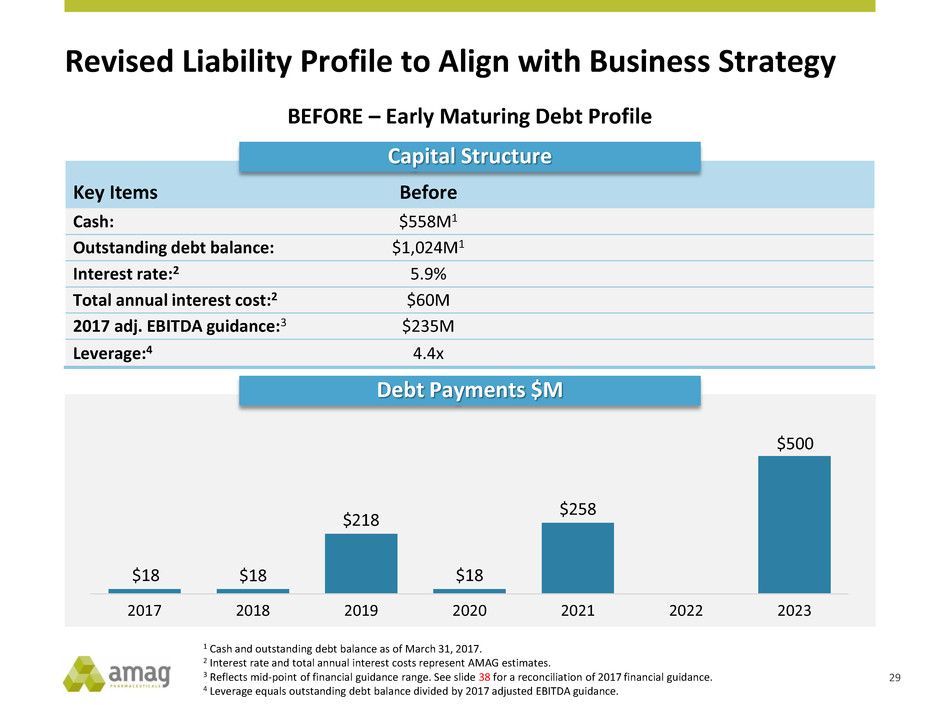
Revised Liability Profile to Align with Business Strategy
BEFORE – Early Maturing Debt Profile
Key Items Before
Cash: $558M1
Outstanding debt balance: $1,024M1
Interest rate:2 5.9%
Total annual interest cost:2 $60M
2017 adj. EBITDA guidance:3 $235M
Leverage:4 4.4x
Capital Structure
$18 $18
$218
$18
$258
$500
2017 2018 2019 2020 2021 2022 2023
Debt Payments $M
29
1 Cash and outstanding debt balance as of March 31, 2017.
2 Interest rate and total annual interest costs represent AMAG estimates.
3 Reflects mid-point of financial guidance range. See slide 38 for a reconciliation of 2017 financial guidance.
4 Leverage equals outstanding debt balance divided by 2017 adjusted EBITDA guidance.

Revised Liability Profile to Align with Business Strategy
AFTER – Extended Debt Maturity Profile
Key Items Before After
Cash: $558M $399M1
Outstanding debt balance: $1,024M $861M1
Interest rate:2 5.9% 5.9%
Total annual interest cost:2 $60M $50.8M
2017 adj. EBITDA guidance:3 $235M $235M
Leverage:4 4.4x 3.7x
Capital Structure
Debt Payments $M
$41
$320
$500
2H-2017 2018 2019 2020 2021 2022 2023
30
1 Cash and outstanding debt balance as of June 30, 2017.
2 Interest rate and total annual interest costs represent AMAG estimates.
3 Reflects mid-point of financial guidance range. See slide 38 for a reconciliation of 2017 financial guidance.
4 Leverage equals outstanding debt balance divided by 2017 adjusted EBITDA guidance.

Debt maturities now align with business strategy
Strong cash balance of $400M and positive EBITDA generation
supportive of investments in:
– Next generation products in current portfolio
– Advancement of new product portfolio (Intrarosa and bremelanotide)
– Expansion of portfolio through business development
Financial Results and Revamped Balance Sheet Support
Evolving Business Model
31

2017 Key Priorities &
Closing Remarks
Bill Heiden
President & CEO
32

AMAG Portfolio: Multiple Value Drivers
Milestone 2017 2018
INTRAROSA Q1 Q2 Q3 Q4 Q1 Q2 Q3 Q4
Commercial launch in dyspareunia
Initiate Phase 3 female sexual dysfunction study
MAKENA AUTO-INJECTOR PROGRAM Q1 Q2 Q3 Q4 Q1 Q2 Q3 Q4
Topline PK data
sNDA submission
Expected FDA action and commercial launch
FERAHEME IDA LABEL EXPANSION Q1 Q2 Q3 Q4 Q1 Q2 Q3 Q4
Enrollment completed
Topline data
Regulatory submission
Expected FDA action and commercial launch
BREMELANOTIDE Q1 Q2 Q3 Q4 Q1 Q2 Q3 Q4
NDA submission
Expected FDA action and commercial launch
VELO – SEVERE PREECLAMPSIA
Initiate Phase 2b/3a study
33

2H-2017 Key Priorities
Intrarosa
Drive successful launch
‒ Continue to increase the number of covered lives
‒ Market share
‒ NRx and TRx (growth)
Makena
Increase patient market share and adherence to therapy
Prepare for launch of sub-q auto-injector in Q1-20181
Prepare for potential competitive threat in 2018
CBR Continue to grow new enrollments
Feraheme
Hold/increase market share and grow market
Prepare for launch of broad IDA (all causes) label in 1H-20181
Bremelanotide Conclude all work in preparation for Q1-2018 NDA filing
Portfolio
Expansion
Expand and diversify product portfolio with longer-lived, durable assets
through licensing or acquisition transactions
Financial
Continue to drive toward net product sales of $660M (midpoint of guidance)
Grow adjusted EBITDA to $235M (midpoint of guidance)
1 If regulatory approval is received.
34

AMAG Pharmaceuticals
Q&A
35

Appendix
36

Reconciliation of GAAP to Non-GAAP Financial Results
($M)
GAAP operating income (loss)
Purchase accounting adjustments related to CBR
deferred revenue
Depreciation and intangible asset amortization
Non-cash inventory step-up adjustments
Stock-based compensation
Adjustments to contingent consideration
Restructuring costs
Transaction- / acquisition-related costs
Acquired IPR&D
Impairment of intangible assets
Non-GAAP adjusted EBITDA
Q2-2017 Q2-2016 1H-2017 1H-2016
$3.6 $18.1 ($36.4) $25.5
1.4 5.1 2.7 13.6
31.5 21.5 58.6 40.4
0.2 2.3 1.0 3.1
5.9 5.2 11.7 11.4
1.7 (3.7) 2.8 1.4
-- 0.1 -- 0.7
-- -- 1.5 --
5.8 -- 65.8 --
-- 16.0 -- 16.0
$50.1 $64.6 $107.7 $112.1
37

Reconciliation of GAAP to Non-GAAP 2017 Financial Guidance
2017 Financial Guidance
($M)
GAAP net loss ($62) – ($31)
Adjustments:
Interest expense, net 66
Loss on debt extinguishment 10
Provision for income tax benefit (37) – (18)
Operating income (loss) ($23) – $27
Purchase accounting adjustments related to CBR deferred revenue 6
Depreciation & intangible asset amortization 127
Non-cash inventory step-up adjustments 2
Stock-based compensation 27
Adjustments to contingent consideration 5
Acquired IPR&D1 66
Non-GAAP adjusted EBITDA $210 - $260
1 Reflects final transaction accounting treatment for Endoceutics license transaction that closed April 3, 2017.
38

Share Count Reconciliation
1 Employee equity incentive awards, convertible notes and warrants would be anti-dilutive in this period.
2 Reflects the Non-GAAP dilutive impact of employee equity incentive awards.
(M) Q2-2017 Q2-2016 YTD 2017 YTD 2016
Weighted average basic shares
outstanding
35.1 34.2 34.8 34.5
Employee equity incentive awards --1 --1 --1 --1
Convertible notes --1 --1 --1 --1
Warrants --1 --1 --1 --1
GAAP diluted shares outstanding 35.1 34.2 34.8 34.5
Employee equity incentive awards 0.42 0.42 0.52 0.32
Non-GAAP diluted shares outstanding 35.5 34.6 35.3 34.8
39

AMAG Pharmaceuticals
Q2-2017 Financial Results &
Corporate Update
August 3, 2017
40
