Attached files
| file | filename |
|---|---|
| EX-99.1 - Q2 2017 EARNINGS RELEASE - Sabra Health Care REIT, Inc. | sbraex9912017q2.htm |
| 8-K - 8-K - Sabra Health Care REIT, Inc. | sbra8-k2017q2.htm |
Disclaimer
Certain statements in this supplement contain “forward-looking” information as that term is defined by the Private Securities Litigation Reform Act of 1995. Any statements that do not relate to historical or current facts or matters are forward-looking statements. Examples of forward-looking statements include all statements regarding our proposed merger transaction with Care Capital Properties, Inc. (“CCP”), expected future financial position, results of operations, cash flows, liquidity, business strategy, growth opportunities, potential investments, and plans and objectives for future operations. You can identify some of the forward-looking statements by the use of forward-looking words such as “anticipate,” “believe,” “plan,” “estimate,” “expect,” “intend,” “should,” “may” and other similar expressions, although not all forward-looking statements contain these identifying words.
Our actual results may differ materially from those projected or contemplated by our forward-looking statements as a result of various factors, including among others, the following: our dependence on Genesis Healthcare, Inc. (“Genesis”) and certain wholly owned subsidiaries of Holiday AL Holdings LP until we are able to further diversify our portfolio; our dependence on the operating success of our tenants; the significant amount of and our ability to service our indebtedness; covenants in our debt agreements that may restrict our ability to pay dividends, make investments, incur additional indebtedness and refinance indebtedness on favorable terms; increases in market interest rates; changes in foreign currency exchange rates; our ability to raise capital through equity and debt financings; the impact of required regulatory approvals of transfers of healthcare properties; the effect of changing healthcare regulation and enforcement on our tenants and the dependence of our tenants on reimbursement from governmental and other third-party payors; the relatively illiquid nature of real estate investments; competitive conditions in our industry; the loss of key management personnel or other employees; the impact of litigation and rising insurance costs on the business of our tenants; the effect of our tenants declaring bankruptcy or becoming insolvent; uninsured or underinsured losses affecting our properties and the possibility of environmental compliance costs and liabilities; the ownership limits and anti-takeover defenses in our governing documents and Maryland law, which may restrict change of control or business combination opportunities; the impact of a failure or security breach of information technology in our operations; our ability to find replacement tenants and the impact of unforeseen costs in acquiring new properties; our ability to maintain our status as a real estate investment trust (“REIT”); changes in tax laws and regulations affecting REITs; and compliance with REIT requirements and certain tax and tax regulatory matters related to our status as a REIT. There are also risks that are inherent in the nature of the transaction with CCP, including the possibility that the parties may be unable to obtain required stockholder approvals or regulatory approvals or that other conditions to closing the transaction may not be satisfied, such that the transaction will not close or that the closing may be delayed; the potential adverse effect on tenant and vendor relationships, operating results and business generally resulting from the proposed transaction; the proposed transaction will require significant time, attention and resources, potentially diverting attention from the conduct of our business; the amount of debt that will need to be refinanced or amended in connection with the proposed merger and the ability to do so on acceptable terms; changes in healthcare regulation and political or economic conditions; the anticipated benefits of the proposed transaction may not be realized; the anticipated and unanticipated costs, fees, expenses and liabilities related to the transaction; the outcome of any legal proceedings related to the transaction; and the occurrence of any event, change or other circumstances that could give rise to the termination of the merger agreement.
Additional information concerning risks and uncertainties that could affect our business can be found in our filings with the Securities and Exchange Commission (the “SEC”), including Item 1A of our Annual Report on Form 10-K for the year ended December 31, 2016 and Item 1A of our Quarterly Report on Form 10-Q for the quarter ended June 30, 2017. Additional information concerning risks and uncertainties that could affect CCP’s business can be found in CCP’s filings with the SEC, including Item 1A of its Annual Report on Form 10-K for the year ended December 31, 2016. We do not intend, and we undertake no obligation, to update any forward-looking information to reflect events or circumstances after the date of this supplement or to reflect the occurrence of unanticipated events, unless required by law to do so.
Note Regarding Non-GAAP Financial Measures
This supplement includes the following financial measures defined as non-GAAP financial measures by the SEC: net operating income (“NOI”), Cash NOI, funds from operations attributable to common stockholders (“FFO”), Normalized FFO, Adjusted FFO (“AFFO”), Normalized AFFO, FFO per diluted common share, Normalized FFO per diluted common share, AFFO per diluted common share and Normalized AFFO per diluted common share. These measures may be different than non-GAAP financial measures used by other companies, and the presentation of these measures is not intended to be considered in isolation or as a substitute for financial information prepared and presented in accordance with U.S. generally accepted accounting principles. An explanation of these non-GAAP financial measures is included under “Reporting Definitions” in this supplement and reconciliations of these non-GAAP financial measures to the GAAP financial measures we consider most
comparable are included under “Reconciliations of NOI and Cash NOI" and "Reconciliations of FFO, Normalized FFO, AFFO and Normalized AFFO” in this supplement.
Tenant and Borrower Information
This supplement includes information regarding certain of our tenants that lease properties from us and our borrowers, most of which are not subject to SEC reporting requirements. This release also includes certain information regarding tenants who lease properties from CCP and their borrowers, most of which are also not subject to SEC reporting requirements. Genesis is subject to the reporting requirements of the SEC and is required to file with the SEC annual reports containing audited financial information and quarterly reports containing unaudited financial information. The information related to our tenants and borrowers that is provided in this supplement has been provided by, or derived solely from information provided by, such tenants and borrowers; and the information related to CCP’s tenants and borrowers that is provided in this release has been provided by CCP based on information it has obtained from its tenants and borrowers. We have not independently verified this information. We have no reason to believe that such information is inaccurate in any material respect. We are providing this data for informational purposes only. Genesis's filings with the SEC can be found at www.sec.gov.
Table of Contents
Real Estate Portfolio Geographic Concentrations | |
Company Information
Board of Directors
Richard K. Matros Chairman of the Board, President and Chief Executive Officer Sabra Health Care REIT, Inc. | Michael J. Foster Managing Director RFE Management Corp. | |
Milton J. Walters President Tri-River Capital | Robert A. Ettl Chief Operating Officer Harvard Management Company | |
Craig A. Barbarosh Partner Katten Muchin Rosenman LLP | ||
Senior Management
Richard K. Matros Chairman of the Board, President and Chief Executive Officer | Harold W. Andrews, Jr. Executive Vice President, Chief Financial Officer and Secretary | |
Talya Nevo-Hacohen Executive Vice President, Chief Investment Officer and Treasurer | ||
Other Information
Corporate Headquarters 18500 Von Karman Avenue, Suite 550 Irvine, CA 92612 | Transfer Agent American Stock Transfer and Trust Company 6201 15th Avenue Brooklyn, NY 11219 | |
www.sabrahealth.com
The information in this supplemental information package should be read in conjunction with the Company’s Annual Report on Form 10-K, Quarterly Reports on Form 10-Q, Current Reports on Form 8-K and other information filed with the SEC. The Reporting Definitions and Reconciliations of Non-GAAP Measures are an integral part of the information presented herein.
On Sabra's website, www.sabrahealth.com, you can access, free of charge, Sabra’s Annual Report on Form 10-K, Quarterly Reports on Form 10-Q, Current Reports on Form 8-K, and amendments to those reports filed or furnished pursuant to Sections 13(a) or 15(d) of the Securities Exchange Act of 1934, as amended, as soon as reasonably practicable after such material is filed with, or furnished to, the SEC. The information contained on Sabra’s website is not incorporated by reference into, and should not be considered a part of, this supplemental information package. All material filed with the SEC can also be accessed through its website, www.sec.gov.
For more information, contact Harold W. Andrews, Jr., Executive Vice President, Chief Financial Officer and Secretary at (949) 679-0243.
 | 1 | |
SABRA HEALTH CARE REIT, INC.
COMPANY FACT SHEET
Company Profile
Sabra Health Care REIT, Inc., a Maryland corporation (“Sabra,” the “Company” or “we”), operates as a self-administered, self-managed REIT that, through its subsidiaries, owns and invests in real estate serving the healthcare industry. Sabra primarily generates revenues by leasing properties to tenants and operators throughout the United States and Canada.
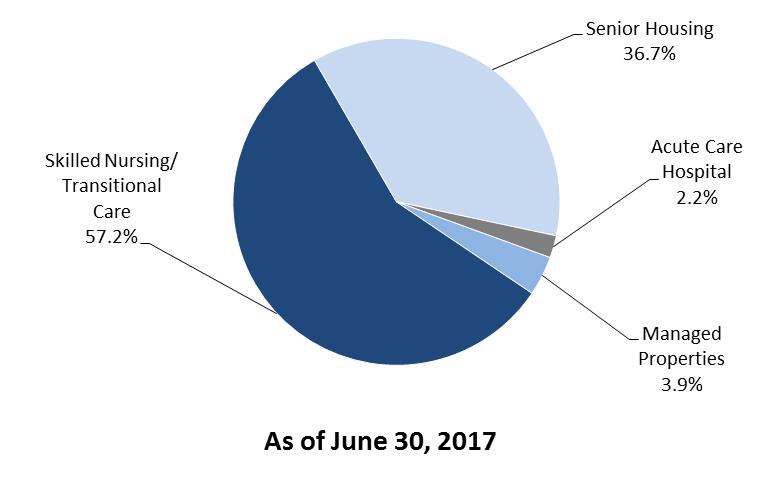
As of June 30, 2017, Sabra’s investment portfolio included 183 real estate properties held for investment (consisting of (i) 96 Skilled Nursing/Transitional Care facilities, (ii) 75 Senior Housing facilities, (iii) 11 Senior Housing facilities operated by third-party property managers pursuant to property management agreements (“Managed Properties”) and (iv) one Acute Care Hospital), eight investments in loans receivable (consisting of (i) four mortgage loans, (ii) two construction loans, (iii) one mezzanine loan, and (iv) one pre-development loan), and 12 preferred equity investments. As of June 30, 2017, Sabra’s real estate properties held for investment included 18,830 beds/units, spread across the United States and Canada.
Objectives and Strategies
Our objectives are to grow our investment portfolio while diversifying our portfolio by tenant, asset class and geography within the healthcare sector. We plan to achieve these objectives primarily through making investments directly or indirectly in healthcare real estate. We may also achieve our objective of diversifying our portfolio by tenant and asset class through select asset sales and other arrangements with Genesis and other tenants. We have entered into memoranda of understanding with Genesis to market for sale 35 skilled nursing facilities and we have made certain other lease and corporate guarantee amendments for the remaining 43 facilities leased to Genesis. Upon completion of the sales, these asset sales and amendments will have the benefit of reducing our net operating income concentration in Genesis and skilled nursing facilities, as well as strengthening our remaining Genesis-operated portfolio through the lease term extensions and guarantee enhancements; provided, however, that there can be no assurances that we will successfully complete these sales on the terms or timing contemplated by the memoranda of understanding, or at all, in which event we may not achieve the anticipated benefits from such sales. As of June 30, 2017, we completed the sale of one of these facilities and subsequent to June 30, 2017, we completed the sale of one additional facility. Marketing of the remaining 33 facilities is ongoing and is expected to be completed in the second half of 2017.
We expect to continue to grow our portfolio primarily through the acquisition of assisted living, independent living and memory care facilities in the U.S. and Canada and through the acquisition of Skilled Nursing/Transitional Care facilities in the U.S. We have and will continue to opportunistically acquire other types of healthcare real estate, originate financing secured directly or indirectly by healthcare facilities and invest in the development of Senior Housing and Skilled Nursing/Transitional Care facilities. We also expect to expand our portfolio through the development of purpose-built healthcare facilities through pipeline agreements and other arrangements with select developers. We further expect to work with existing operators to identify strategic development opportunities. These opportunities may involve replacing or renovating facilities in our portfolio that may have become less competitive and new development opportunities that present attractive risk-adjusted returns. In addition to pursuing acquisitions with triple-net leases, we expect to continue to pursue other forms of investment, including investments in Managed Properties, mezzanine and secured debt investments, and joint ventures for Senior Housing and Skilled Nursing/Transitional Care facilities.
In general, we originate loans and make preferred equity investments when an attractive investment opportunity is presented and either (a) the property is in or near the development phase or (b) the development of the property is completed but the operations of the facility are not yet stabilized. A key component of our strategy related to loan originations and preferred equity investments is our having the option to purchase the underlying real estate that is owned by our borrowers (and that directly or indirectly secures our loan investment) or by the entity in which we have an investment. These options become exercisable upon the occurrence of various criteria, such as the passage of time or the achievement of certain operating goals, and the method to determine the purchase price upon exercise of the option is set in advance based on the same valuation methods we use to value our investments in healthcare real estate. This strategy allows us to diversify our revenue streams and build relationships with operators and developers, and provides us with the option to add new properties to our existing real estate portfolio if we determine that those properties enhance our investment portfolio and stockholder value at the time the options are exercisable.
SABRA HEALTH CARE REIT, INC.
COMPANY FACT SHEET (CONTINUED)
As of June 30, 2017
Market Facts | Credit Ratings | |||
Common Stock Information | ||||
Closing Price | $24.10 | Moody's | ||
52-Week range | $19.30 - $29.10 | Corporate Rating | Ba3 (review for upgrade) | |
Common Equity Market Capitalization: | $1.6 billion | Unsecured Notes Rating | Ba3 (review for upgrade) | |
Outstanding Shares | 65.4 million | Preferred Equity Rating | B2 (review for upgrade) | |
Enterprise Value: | $2.9 billion | S&P | ||
Corporate Rating | BB- (CreditWatch positive) | |||
Ticker symbols: | Unsecured Notes/Unsecured Credit Facility | BB (CreditWatch positive) | ||
Common Stock | SBRA | Preferred Equity Rating | B- (CreditWatch positive) | |
Preferred Stock | SBRAP | Fitch | ||
Stock Exchange: | NASDAQ | Corporate Rating | BB+ (Rating Watch Positive) | |
Governance | Unsecured Notes/Unsecured Credit Facility | BB+ (Rating Watch Positive) | ||
(As of July 1, 2017) | Preferred Equity Rating | BB- (Rating Watch Positive) | ||
ISS Governance QuickScore | 4 | |||
Portfolio Information | ||||||
Investment in Real Estate Properties | Real Estate Property Bed/Unit Count | |||||
Skilled Nursing/Transitional Care | 96 | Skilled Nursing/Transitional Care | 10,689 | |||
Senior Housing | 75 | Senior Housing | 7,070 | |||
Managed Properties | 11 | Managed Properties | 1,001 | |||
Acute Care Hospital | 1 | Acute Care Hospital | 70 | |||
Total Equity Investments | 183 | Total Beds/Units | 18,830 | |||
Investments in Loans Receivable (1) | 8 | Countries | 2 | |||
Preferred Equity Investments (2) | 12 | U.S. States | 37 | |||
Total Investments | 203 | Relationships | 34 | |||
(1) Our investments in Loans Receivable include investments secured directly or indirectly by one Skilled Nursing/Transitional Care facility with 141 beds/units, six Senior Housing developments with 409 beds/units, and land for one future Senior Housing development.
(2) Our Preferred Equity Investments include investments in entities owning 11 Senior Housing developments with 1,162 beds/units and one Skilled Nursing/Transitional Care facility with 140 beds/units.
 | See reporting definitions. | 2 |
SABRA HEALTH CARE REIT, INC.
FINANCIAL HIGHLIGHTS
(dollars in thousands, except per share data)
Three Months Ended June 30, | Six Months Ended June 30, | ||||||||||||||
2017 | 2016 | 2017 | 2016 | ||||||||||||
Revenues | $ | 64,736 | $ | 74,249 | $ | 127,386 | $ | 136,808 | |||||||
Net operating income | 60,329 | 72,809 | 120,559 | 133,956 | |||||||||||
Net income attributable to common stockholders | 17,960 | 34,915 | 34,222 | 16,643 | |||||||||||
FFO attributable to common stockholders | 31,148 | 51,372 | 66,547 | 85,279 | |||||||||||
Normalized FFO attributable to common stockholders | 36,407 | 39,763 | 72,768 | 81,133 | |||||||||||
AFFO attributable to common stockholders | 36,134 | 49,423 | 72,321 | 84,248 | |||||||||||
Normalized AFFO attributable to common stockholders | 35,244 | 38,354 | 70,457 | 77,686 | |||||||||||
Per common share data attributable to common stockholders: | |||||||||||||||
Diluted EPS | $ | 0.27 | $ | 0.53 | $ | 0.52 | $ | 0.25 | |||||||
Diluted FFO | 0.47 | 0.78 | 1.01 | 1.30 | |||||||||||
Diluted Normalized FFO | 0.55 | 0.61 | 1.11 | 1.24 | |||||||||||
Diluted AFFO | 0.55 | 0.75 | 1.10 | 1.28 | |||||||||||
Diluted Normalized AFFO | 0.53 | 0.58 | 1.07 | 1.18 | |||||||||||
Net cash flow from operations | $ | 22,433 | $ | 69,768 | $ | 53,871 | $ | 94,494 | |||||||
Investment Portfolio | June 30, 2017 | December 31, 2016 | |||||||||||||
Real Estate Properties held for investment (1) | 183 | 183 | |||||||||||||
Real Estate Properties held for investment, gross ($) | $ | 2,309,596 | $ | 2,292,345 | |||||||||||
Total Beds/Units | 18,830 | 18,878 | |||||||||||||
Weighted Average Remaining Lease Term (in months) | 112 | 112 | |||||||||||||
Total Investments in Loans Receivable (#) | 8 | 10 | |||||||||||||
Total Investments in Loans Receivable, gross ($) (2) | $ | 49,635 | $ | 51,432 | |||||||||||
Total Preferred Equity Investments (#) | 12 | 12 | |||||||||||||
Total Preferred Equity Investments, gross ($) | $ | 45,345 | $ | 45,190 | |||||||||||
Debt | June 30, 2017 | December 31, 2016 | |||||||||||||
Principal Balance | |||||||||||||||
Fixed Rate Debt | $ | 862,195 | $ | 863,638 | |||||||||||
Variable Rate Debt - Swapped (3) | 341,287 | 338,000 | |||||||||||||
Variable Rate Debt - Floating | 32,000 | 26,000 | |||||||||||||
Total Debt | 1,235,482 | 1,227,638 | |||||||||||||
Cash | (13,235 | ) | (25,663 | ) | |||||||||||
Net Debt (4) | $ | 1,222,247 | $ | 1,201,975 | |||||||||||
Weighted Average Effective Interest Rate | |||||||||||||||
Fixed Rate Debt | 5.16 | % | 5.16 | % | |||||||||||
Variable Rate Debt - Swapped (3) | 2.99 | % | 2.99 | % | |||||||||||
Variable Rate Debt - Floating | 3.22 | % | 2.77 | % | |||||||||||
Total Debt | 4.51 | % | 4.51 | % | |||||||||||
% of Total | |||||||||||||||
Fixed Rate Debt | 69.8 | % | 70.3 | % | |||||||||||
Variable Rate Debt - Swapped (3) | 27.6 | % | 27.5 | % | |||||||||||
Variable Rate Debt - Floating | 2.6 | % | 2.2 | % | |||||||||||
Availability Under Revolving Credit Facility | $ | 468,000 | $ | 474,000 | |||||||||||
Available Liquidity (5) | $ | 480,989 | $ | 499,547 | |||||||||||
(1) Real Estate Properties held for investment include Managed Properties.
(2) Total Investments in Loans Receivable consists of principal plus capitalized origination fees net of loan loss reserves.
(3) As of June 30, 2017, variable rate debt - swapped includes $245.0 million subject to swap agreements that fix LIBOR at 0.90%, $69.3 million (CAD $90.0 million) and $27.0 million (CAD $35.0 million) subject to swap agreements that fix the Canadian Offer Dollar Rate (“CDOR”) at 1.59% and 0.93%, respectively.
(4) Net Debt excludes deferred financing costs and discounts.
(5) Available liquidity represents unrestricted cash, excluding cash associated with a consolidated joint venture, and availability under the revolving credit facility.
| See reporting definitions. | 3 |
SABRA HEALTH CARE REIT, INC.
CONDENSED CONSOLIDATED STATEMENTS OF INCOME
(dollars in thousands, except per share data)
Three Months Ended June 30, | Six Months Ended June 30, | ||||||||||||||
2017 | 2016 | 2017 | 2016 | ||||||||||||
Revenues: | |||||||||||||||
Rental income | $ | 55,904 | $ | 55,297 | $ | 113,128 | $ | 110,609 | |||||||
Interest and other income | 2,027 | 16,993 | 3,972 | 22,325 | |||||||||||
Resident fees and services | 6,805 | 1,959 | 10,286 | 3,874 | |||||||||||
Total revenues | 64,736 | 74,249 | 127,386 | 136,808 | |||||||||||
Expenses: | |||||||||||||||
Depreciation and amortization | 17,220 | 16,405 | 36,357 | 34,171 | |||||||||||
Interest | 15,862 | 16,427 | 31,650 | 33,345 | |||||||||||
Operating expenses | 4,407 | 1,440 | 6,827 | 2,852 | |||||||||||
General and administrative | 11,149 | 4,636 | 18,022 | 9,350 | |||||||||||
Provision for doubtful accounts and loan losses | 535 | 223 | 2,305 | 2,746 | |||||||||||
Impairment of real estate | — | — | — | 29,811 | |||||||||||
Total expenses | 49,173 | 39,131 | 95,161 | 112,275 | |||||||||||
Other income (expense): | |||||||||||||||
Loss on extinguishment of debt | — | — | — | (556 | ) | ||||||||||
Other income | 941 | 2,400 | 3,070 | 2,400 | |||||||||||
Net gain (loss) on sale of real estate | 4,032 | (52 | ) | 4,032 | (4,654 | ) | |||||||||
Total other income (expense) | 4,973 | 2,348 | 7,102 | (2,810 | ) | ||||||||||
Net income | 20,536 | 37,466 | 39,327 | 21,723 | |||||||||||
Net (income) loss attributable to noncontrolling interests | (16 | ) | 9 | 16 | 41 | ||||||||||
Net income attributable to Sabra Health Care REIT, Inc. | 20,520 | 37,475 | 39,343 | 21,764 | |||||||||||
Preferred stock dividends | (2,560 | ) | (2,560 | ) | (5,121 | ) | (5,121 | ) | |||||||
Net income attributable to common stockholders | $ | 17,960 | $ | 34,915 | $ | 34,222 | $ | 16,643 | |||||||
Net income attributable to common stockholders, per: | |||||||||||||||
Basic common share | $ | 0.27 | $ | 0.53 | $ | 0.52 | $ | 0.25 | |||||||
Diluted common share | $ | 0.27 | $ | 0.53 | $ | 0.52 | $ | 0.25 | |||||||
Weighted-average number of common shares outstanding, basic | 65,438,739 | 65,303,057 | 65,396,146 | 65,274,845 | |||||||||||
Weighted-average number of common shares outstanding, diluted | 65,670,853 | 65,503,383 | 65,694,019 | 65,454,337 | |||||||||||
| See reporting definitions. | 4 |
SABRA HEALTH CARE REIT, INC.
CONDENSED CONSOLIDATED BALANCE SHEETS
(dollars in thousands, except per share data)
June 30, 2017 | December 31, 2016 | ||||||
(unaudited) | |||||||
Assets | |||||||
Real estate investments, net of accumulated depreciation of $314,103 and $282,812 as of June 30, 2017 and December 31, 2016, respectively | $ | 1,995,911 | $ | 2,009,939 | |||
Loans receivable and other investments, net | 94,208 | 96,036 | |||||
Cash and cash equivalents | 13,235 | 25,663 | |||||
Restricted cash | 9,413 | 9,002 | |||||
Prepaid expenses, deferred financing costs and other assets, net | 141,193 | 125,279 | |||||
Total assets | $ | 2,253,960 | $ | 2,265,919 | |||
Liabilities | |||||||
Mortgage notes, net | $ | 159,366 | $ | 160,752 | |||
Revolving credit facility | 32,000 | 26,000 | |||||
Term loans, net | 339,248 | 335,673 | |||||
Senior unsecured notes, net | 689,508 | 688,246 | |||||
Accounts payable and accrued liabilities | 37,123 | 39,639 | |||||
Total liabilities | 1,257,245 | 1,250,310 | |||||
Equity | |||||||
Preferred stock, $.01 par value; 10,000,000 shares authorized, 5,750,000 shares issued and outstanding as of June 30, 2017 and December 31, 2016 | 58 | 58 | |||||
Common stock, $.01 par value; 125,000,000 shares authorized, 65,425,434 and 65,285,614 shares issued and outstanding as of June 30, 2017 and December 31, 2016, respectively | 654 | 653 | |||||
Additional paid-in capital | 1,210,895 | 1,208,862 | |||||
Cumulative distributions in excess of net income | (214,078 | ) | (192,201 | ) | |||
Accumulated other comprehensive loss | (833 | ) | (1,798 | ) | |||
Total Sabra Health Care REIT, Inc. stockholders’ equity | 996,696 | 1,015,574 | |||||
Noncontrolling interests | 19 | 35 | |||||
Total equity | 996,715 | 1,015,609 | |||||
Total liabilities and equity | $ | 2,253,960 | $ | 2,265,919 | |||
| See reporting definitions. | 5 |
SABRA HEALTH CARE REIT, INC.
CONDENSED CONSOLIDATED STATEMENTS OF CASH FLOWS
(in thousands)
Six Months Ended June 30, | |||||||
2017 | 2016 | ||||||
Cash flows from operating activities: | |||||||
Net income | $ | 39,327 | $ | 21,723 | |||
Adjustments to reconcile net income to net cash provided by operating activities: | |||||||
Depreciation and amortization | 36,357 | 34,171 | |||||
Non-cash interest income adjustments | 51 | 443 | |||||
Amortization of deferred financing costs | 2,558 | 2,494 | |||||
Stock-based compensation expense | 4,319 | 3,652 | |||||
Amortization of debt discount | 57 | 54 | |||||
Loss on extinguishment of debt | — | 556 | |||||
Straight-line rental income adjustments | (9,578 | ) | (11,117 | ) | |||
Provision for doubtful accounts and loan losses | 2,305 | 2,746 | |||||
Change in fair value of contingent consideration | (822 | ) | (50 | ) | |||
Net (gain) loss on sales of real estate | (4,032 | ) | 4,654 | ||||
Impairment of real estate | — | 29,811 | |||||
Changes in operating assets and liabilities: | |||||||
Prepaid expenses and other assets | (15,129 | ) | 3,265 | ||||
Accounts payable and accrued liabilities | 327 | 4,324 | |||||
Restricted cash | (1,869 | ) | (2,232 | ) | |||
Net cash provided by operating activities | 53,871 | 94,494 | |||||
Cash flows from investing activities: | |||||||
Acquisition of real estate | (14,456 | ) | — | ||||
Origination and fundings of loans receivable | (927 | ) | (6,283 | ) | |||
Origination and fundings of preferred equity investments | (76 | ) | (6,172 | ) | |||
Additions to real estate | (1,294 | ) | (874 | ) | |||
Repayment of loans receivable | 1,547 | 193,893 | |||||
Repayments of preferred equity investments | 2,766 | — | |||||
Net proceeds from the sales of real estate | 6,099 | 75,456 | |||||
Net cash (used in) provided by investing activities | (6,341 | ) | 256,020 | ||||
Cash flows from financing activities: | |||||||
Net borrowing (repayments) of revolving credit facility | 6,000 | (255,000 | ) | ||||
Proceeds from term loans | — | 69,360 | |||||
Principal payments on mortgage notes | (2,049 | ) | (2,060 | ) | |||
Payments of deferred financing costs | (124 | ) | (5,931 | ) | |||
Issuance of common stock, net | (3,224 | ) | (1,289 | ) | |||
Dividends paid on common and preferred stock | (60,691 | ) | (59,288 | ) | |||
Net cash used in financing activities | (60,088 | ) | (254,208 | ) | |||
Net (decrease) increase in cash and cash equivalents | (12,558 | ) | 96,306 | ||||
Effect of foreign currency translation on cash and cash equivalents | 130 | 128 | |||||
Cash and cash equivalents, beginning of period | 25,663 | 7,434 | |||||
Cash and cash equivalents, end of period | $ | 13,235 | $ | 103,868 | |||
Supplemental disclosure of cash flow information: | |||||||
Interest paid | $ | 28,944 | $ | 30,581 | |||
| See reporting definitions. | 6 |
SABRA HEALTH CARE REIT, INC.
CAPITALIZATION
(dollars in thousands, except per share data)
Debt | June 30, 2017 | December 31, 2016 | |||||
Mortgage notes | $ | 162,195 | $ | 163,638 | |||
Revolving credit facility | 32,000 | 26,000 | |||||
Term loans | 341,287 | 338,000 | |||||
Senior unsecured notes | 700,000 | 700,000 | |||||
Total Principal Balance | 1,235,482 | 1,227,638 | |||||
Deferred financing costs and discounts | (15,360 | ) | (16,967 | ) | |||
Total Debt, net | $ | 1,220,122 | $ | 1,210,671 | |||
Revolving Credit Facility | June 30, 2017 | December 31, 2016 | |||||
Credit facility availability | $ | 468,000 | $ | 474,000 | |||
Credit facility capacity | 500,000 | 500,000 | |||||
Enterprise Value | ||||||||||
As of June 30, 2017 | Shares Outstanding | Price | Value | |||||||
Common stock | 65,425,434 | $ | 24.10 | $ | 1,576,753 | |||||
Preferred stock | 5,750,000 | 25.59 | 147,143 | |||||||
Total debt | 1,235,482 | |||||||||
Cash and cash equivalents | (13,235 | ) | ||||||||
Total Enterprise Value | $ | 2,946,143 | ||||||||
As of December 31, 2016 | Shares Outstanding | Price | Value | |||||||
Common stock | 65,285,614 | $ | 24.42 | $ | 1,594,275 | |||||
Preferred stock | 5,750,000 | 25.15 | 144,613 | |||||||
Total debt | 1,227,638 | |||||||||
Cash and cash equivalents | (25,663 | ) | ||||||||
Total Enterprise Value | $ | 2,940,863 | ||||||||
Common Stock and Equivalents | Weighted Average Common Shares | ||||||||||
Three Months Ended June 30, 2017 | Six Months Ended June 30, 2017 | ||||||||||
EPS, FFO and Normalized FFO | AFFO and Normalized AFFO | EPS, FFO and Normalized FFO | EPS, AFFO and Normalized AFFO | ||||||||
Common stock | 65,412,425 | 65,412,425 | 65,370,524 | 65,370,524 | |||||||
Common equivalents | 26,314 | 26,314 | 25,622 | 25,622 | |||||||
Basic common and common equivalents | 65,438,739 | 65,438,739 | 65,396,146 | 65,396,146 | |||||||
Dilutive securities: | |||||||||||
Restricted stock and units | 232,114 | 547,201 | 297,873 | 612,956 | |||||||
Diluted common and common equivalents | 65,670,853 | 65,985,940 | 65,694,019 | 66,009,102 | |||||||
| See reporting definitions. | 7 |
SABRA HEALTH CARE REIT, INC.
INDEBTEDNESS
June 30, 2017
(dollars in thousands)
Principal | Weighted Average Effective Rate (1) | % of Total | |||||||
Fixed Rate Debt | |||||||||
Secured mortgage debt | $ | 162,195 | 3.87 | % | 13.1 | % | |||
Unsecured senior notes | 700,000 | 5.46 | % | 56.7 | % | ||||
Total fixed rate debt | 862,195 | 5.16 | % | 69.8 | % | ||||
Variable Rate Debt | |||||||||
Revolving credit facility (2) | 32,000 | 3.22 | % | 2.6 | % | ||||
Term loans (2) | 341,287 | 2.99 | % | 27.6 | % | ||||
Total variable rate debt | 373,287 | 3.01 | % | 30.2 | % | ||||
Total Debt | $ | 1,235,482 | 4.51 | % | 100.0 | % | |||
Secured Debt | |||||||||
Secured mortgage debt | $ | 162,195 | 3.87 | % | 13.1 | % | |||
Unsecured Debt | |||||||||
Unsecured senior notes | 700,000 | 5.46 | % | 56.7 | % | ||||
Revolving credit facility (2) | 32,000 | 3.22 | % | 2.6 | % | ||||
Term loans (2) | 341,287 | 2.99 | % | 27.6 | % | ||||
Total unsecured debt | 1,073,287 | 4.61 | % | 86.9 | % | ||||
Total Debt | $ | 1,235,482 | 4.51 | % | 100.0 | % | |||
(1) Weighted average effective interest rate includes private mortgage insurance and impact of interest rate swap agreements.
(2) Includes $245.0 million subject to swap agreements that fix LIBOR at 0.90%, $69.3 million (CAD $90.0 million) and $27.0 million (CAD $35.0 million) subject to swap agreements that fix CDOR at 1.59% and 0.93%, respectively. Excluding these amounts, variable rate debt was 2.6% of total debt as of June 30, 2017.
Maturities | Secured Mortgage Debt | Unsecured Senior Notes | Term Loans | Revolving Credit Facility (1) | Total | |||||||||||||||||||||||||||||
Principal | Rate (2) | Principal | Rate (2) | Principal | Rate (2) | Principal | Rate (2) | Principal | Rate (2) | |||||||||||||||||||||||||
7/1/17-12/31/17 | $ | 2,090 | 3.45 | % | $ | — | — | $ | — | — | $ | — | — | $ | 2,090 | 3.45 | % | |||||||||||||||||
2018 | 4,283 | 3.45 | % | — | — | — | — | — | — | 4,283 | 3.45 | % | ||||||||||||||||||||||
2019 | 4,426 | 3.45 | % | — | — | — | — | — | — | 4,426 | 3.45 | % | ||||||||||||||||||||||
2020 | 4,575 | 3.46 | % | — | — | — | — | 32,000 | 3.22 | % | 36,575 | 3.25 | % | |||||||||||||||||||||
2021 | 19,941 | 3.46 | % | 500,000 | 5.50 | % | 341,287 | 3.07 | % | — | — | 861,228 | 4.49 | % | ||||||||||||||||||||
2022 | 4,285 | 3.44 | % | — | — | — | — | — | — | 4,285 | 3.44 | % | ||||||||||||||||||||||
2023 | 4,427 | 3.45 | % | 200,000 | 5.38 | % | — | — | — | — | 204,427 | 5.34 | % | |||||||||||||||||||||
2024 | 4,573 | 3.45 | % | — | — | — | — | — | — | 4,573 | 3.45 | % | ||||||||||||||||||||||
2025 | 4,725 | 3.46 | % | — | — | — | — | — | — | 4,725 | 3.46 | % | ||||||||||||||||||||||
2026 | 4,882 | 3.47 | % | — | — | — | — | — | — | 4,882 | 3.47 | % | ||||||||||||||||||||||
Thereafter | 103,988 | 3.60 | % | — | — | — | — | — | — | 103,988 | 3.60 | % | ||||||||||||||||||||||
Total principal balance | 162,195 | 700,000 | 341,287 | 32,000 | 1,235,482 | |||||||||||||||||||||||||||||
Discount | — | (458 | ) | — | — | (458 | ) | |||||||||||||||||||||||||||
Deferred financing costs | (2,829 | ) | (10,034 | ) | (2,039 | ) | — | (14,902 | ) | |||||||||||||||||||||||||
Total debt, net | $ | 159,366 | $ | 689,508 | $ | 339,248 | $ | 32,000 | $ | 1,220,122 | ||||||||||||||||||||||||
Wtd. avg. maturity/years | 23.9 | 4.3 | 3.5 | 2.5 | 6.6 | |||||||||||||||||||||||||||||
Wtd. avg. effective interest rate(3) | 3.87 | % | 5.46 | % | 2.99 | % | 3.22 | % | 4.51 | % | ||||||||||||||||||||||||
(1) Revolving Credit Facility is subject to two six-month extension options.
(2) Represents actual contractual interest rates excluding private mortgage insurance and impact of interest rate swap agreements.
(3) Weighted average effective interest rate includes private mortgage insurance and impact of interest rate swap agreements.
| See reporting definitions. | 8 |
SABRA HEALTH CARE REIT, INC.
KEY CREDIT STATISTICS (1)
June 30, 2017 | December 31, 2016 | |||||
Net Debt to Adjusted EBITDA (2) | 5.35x | 5.22x | ||||
Interest Coverage | 3.91x | 4.00x | ||||
Fixed Charge Coverage Ratio | 3.16x | 3.20x | ||||
Total Debt/Asset Value | 43 | % | 43 | % | ||
Secured Debt/Asset Value | 6 | % | 6 | % | ||
Unencumbered Assets/Unsecured Debt | 247 | % | 247 | % | ||
Cost of Permanent Debt (3) | 4.55 | % | 4.55 | % | ||
Corporate Ratings (Moody's, S&P, Fitch) | Ba3 / BB- / BB+ | Ba3 / BB- / BB+ | ||||
(1) Key credit statistics are calculated in accordance with the credit agreement (excluding net debt to adjusted EBITDA) relating to the revolving credit facility and the indentures relating to our unsecured senior notes.
(2) Adjusted EBITDA is calculated as earnings before interest, taxes, depreciation and amortization ("EBITDA") excluding the impact of stock-based compensation expense under the Company's long-term equity award program, asset-specific loan loss reserves, and out of period reserves and is further adjusted to give effect to acquisitions and dispositions completed as of and subsequent to the date reported as though such acquisitions and dispositions occurred at the beginning of the period. Net Debt excludes deferred financing costs and discounts.
(3) Excludes revolving credit facility balance, if any, which had an interest rate of 3.22% and 2.77% as of June 30, 2017 and December 31, 2016, respectively.
| See reporting definitions. | 9 |
SABRA HEALTH CARE REIT, INC.
PORTFOLIO SUMMARY
June 30, 2017
(dollars in thousands)
Total Property Portfolio | GAAP Rental Income (1) | Net Operating Income (1) | Number of Beds/Units | |||||||||||||||||||||||
Number of Properties | Three Months Ended June 30, | |||||||||||||||||||||||||
Facility Type | Investment | 2017 | 2016 | 2017 | 2016 | |||||||||||||||||||||
Skilled Nursing/Transitional Care | 96 | $ | 1,038,958 | $ | 34,598 | $ | 34,156 | $ | 34,598 | $ | 34,156 | 10,689 | ||||||||||||||
Senior Housing | 75 | 1,044,664 | 19,930 | 19,768 | 19,930 | 19,768 | 7,070 | |||||||||||||||||||
Managed Properties | 11 | 164,334 | — | — | 2,398 | 519 | 1,001 | |||||||||||||||||||
Acute Care Hospital | 1 | 61,640 | 1,376 | 1,373 | 1,376 | 1,373 | 70 | |||||||||||||||||||
Total | 183 | $ | 2,309,596 | $ | 55,904 | $ | 55,297 | $ | 58,302 | $ | 55,816 | 18,830 | ||||||||||||||
Same Store Property Portfolio (2) | Cash Rent | Cash Net Operating Income | |||||||||||||||||
Three Months Ended June 30, | |||||||||||||||||||
Facility Type | Number of Properties | 2017 | 2016 | 2017 | 2016 | ||||||||||||||
Skilled Nursing/Transitional Care | 85 | $ | 31,149 | $ | 30,238 | $ | 31,149 | $ | 30,238 | ||||||||||
Senior Housing | 61 | 15,431 | 15,580 | 15,431 | 15,580 | ||||||||||||||
Managed Properties | 2 | — | — | 563 | 519 | ||||||||||||||
Acute Care Hospital | 1 | 1,281 | 1,256 | 1,281 | 1,256 | ||||||||||||||
Total | 149 | $ | 47,861 | $ | 47,074 | $ | 48,424 | $ | 47,593 | ||||||||||
Tenant Facility Statistics (3) | Coverage | |||||||||||||||||||
EBITDAR | EBITDARM | Occupancy Percentage | Skilled Mix | |||||||||||||||||
Twelve Months Ended June 30, | ||||||||||||||||||||
Facility Type | 2017 | 2016 | 2017 | 2016 | 2017 | 2016 | 2017 | 2016 | ||||||||||||
Skilled Nursing/Transitional Care | 1.56x | 1.45x | 1.86x | 1.75x | 88.4 | % | 86.9 | % | 43.1 | % | 41.4 | % | ||||||||
Senior Housing | 1.16x | 1.17x | 1.34x | 1.34x | 88.3 | % | 89.7 | % | NA | NA | ||||||||||
Managed Properties | NA | NA | NA | NA | 89.7 | % | 75.3 | % | NA | NA | ||||||||||
Twelve Months Ended June 30, | ||||
Fixed Charge Coverage Ratio (4) | 2017 | 2016 | ||
Genesis Healthcare, Inc. | 1.18x | 1.27x | ||
Tenet Health Care Corporation | 2.04x | 2.18x | ||
Holiday AL Holdings LP | 1.13x | 1.18x | ||
Same Store Tenant Facility Statistics (5) | Coverage | |||||||||||||||||||
EBITDAR | EBITDARM | Occupancy Percentage | Skilled Mix | |||||||||||||||||
Twelve Months Ended June 30, | ||||||||||||||||||||
Facility Type | 2017 | 2016 | 2017 | 2016 | 2017 | 2016 | 2017 | 2016 | ||||||||||||
Skilled Nursing/Transitional Care | 1.33x | 1.31x | 1.67x | 1.64x | 87.3 | % | 87.6 | % | 40.5 | % | 41.9 | % | ||||||||
Senior Housing | 1.33x | 1.35x | 1.52x | 1.55x | 88.9 | % | 90.2 | % | NA | NA | ||||||||||
Managed Properties | NA | NA | NA | NA | 61.4 | % | 68.1 | % | NA | NA | ||||||||||
(1) GAAP Rental Income and Net Operating Income include $5.0 million and $5.5 million of straight-line rental income adjustments for the three months ended June 30, 2017 and 2016, respectively.
(2) Same store property portfolio includes all facilities owned for the full period in both comparison periods.
(3) Occupancy Percentage, Skilled Mix and EBITDARM/EBITDAR coverages (collectively, “Facility Statistics”) for each period presented include only Stabilized Facilities owned by the Company as of the end of the respective period. Facility Statistics are only included in periods subsequent to our acquisition. EBITDARM Coverage and EBITDAR Coverage exclude tenants with significant corporate guarantees. Facility Statistics are presented one quarter in arrears, except for Managed Properties which are presented as of the latest quarter.
(4) Fixed Charge Coverage Ratio is presented one quarter in arrears for tenants with significant corporate guarantees. See Reporting Definitions for definition of Fixed Charge Coverage Ratio.
(5) Same store Facility Statistics are presented for Stabilized Facilities owned for the full period in both comparison periods.
SABRA HEALTH CARE REIT, INC.
PORTFOLIO SUMMARY (CONTINUED)
PRO FORMA FOR CCP MERGER
June 30, 2017
(dollars in thousands)
Lease Coverage (1) | ||||||
Twelve Months Ended June 30, 2017 | ||||||
Facility Type | Sabra | CCP | Combined | |||
Skilled Nursing/Transitional Care | 1.56x | 1.19x | 1.31x | |||
Senior Housing | 1.16x | 0.92x | 1.12x | |||
Acute Care Hospital | NA | 6.43x | 6.43x | |||
Tenants with Significant Corporate Guarantees (1) | ||||||
Genesis Healthcare, Inc. | 1.18x | NA | 1.18x | |||
Tenet Health Care Corporation | 2.04x | NA | 2.04x | |||
Holiday AL Holdings LP | 1.13x | NA | 1.13x | |||
CCP (4 Tenants) | NA | 1.10x | 1.10x | |||
Pro Forma Top 10 Tenants (2) | ||||||||||||
Twelve Months Ended June 30, 2017 | ||||||||||||
Facility Type | Number of Facilities (3) | Lease Coverage (1) | Annualized Cash NOI (3) | % of Annualized Cash NOI | ||||||||
Genesis Healthcare, Inc. | 77 | 1.18x | $ | 78,441 | 13.9 | % | ||||||
Senior Care Centers | 38 | 1.08x | 56,819 | 10.1 | % | |||||||
Signature Healthcare | 49 | 0.91x | 49,627 | 8.8 | % | |||||||
Avamere Family of Companies | 29 | 1.35x | 40,052 | 7.1 | % | |||||||
Holiday AL Holdings LP | 21 | 1.13x | 32,718 | 5.8 | % | |||||||
Signature Behavioral | 6 | 1.57x | (4) | 30,288 | 5.4 | % | ||||||
NMS Healthcare | 5 | 1.91x | 25,362 | 4.5 | % | |||||||
Magnolia Health Systems | 24 | 1.50x | 15,608 | 2.8 | % | |||||||
The McGuire Group | 7 | 1.91x | 14,891 | 2.6 | % | |||||||
Wingate Healthcare | 11 | 0.80x | 14,253 | 2.5 | % | |||||||
(1) Lease Coverage is defined as the EBITDAR coverage for the facilities operated by the applicable tenant unless there is a corporate guaranty and the guarantor level fixed charge coverage is a more meaningful indicator of the tenants’ ability to make rent payments on stabilized facilities. Tenants with significant corporate guarantees represent 47.0% of the combined pro forma annualized Cash NOI. Lease Coverage is presented one quarter in arrears.
(2) Includes all acquisitions through June 30, 2017.
(3) Includes all stable, non-stable and held for sale facilities.
(4) Signature Behavioral was acquired subsequent to the Lease Coverage period presented. Accordingly, the coverage is presented here at the underwritten stabilized Lease Coverage level.
SABRA HEALTH CARE REIT, INC.
PORTFOLIO SUMMARY (CONTINUED)
June 30, 2017
(dollars in thousands)
Loans Receivable and Other Investments
Loan Type | Number of Loans | Facility Type | Principal Balance as of June 30, 2017 | Book Value as of June 30, 2017 | Weighted Average Contractual Interest Rate | Weighted Average Annualized Effective Interest Rate | Interest Income Three Months Ended June 30, 2017 (1) | Maturity Date | |||||||||||||||||
Mortgage | 4 | Skilled Nursing / Senior Housing | $ | 38,336 | $ | 38,361 | 9.1 | % | 8.9 | % | $ | 215 | 11/07/16- 04/30/18 | ||||||||||||
Construction | 2 | Senior Housing | 1,736 | 1,798 | 8.0 | % | 7.7 | % | 32 | 03/31/21- 05/31/22 | |||||||||||||||
Mezzanine | 1 | Senior Housing | 9,640 | 9,646 | 11.0 | % | 10.8 | % | 268 | 08/31/17 | |||||||||||||||
Pre-development | 1 | Senior Housing | 2,304 | 2,306 | 9.0 | % | 8.4 | % | 52 | 09/09/17 | |||||||||||||||
8 | $ | 52,016 | $ | 52,111 | 9.4 | % | 9.3 | % | $ | 567 | |||||||||||||||
Loan loss reserve | — | (3,248 | ) | ||||||||||||||||||||||
$ | 52,016 | $ | 48,863 | ||||||||||||||||||||||
Other Investment Type | Number of Investments | Facility Type | Total Funding Commitments | Amount Funded as of June 30, 2017 | Book Value as of June 30, 2017 | Rate of Return | Other Income Three Months Ended June 30, 2017 | ||||||||||||||||
Preferred Equity | 12 | Skilled Nursing / Senior Housing | $ | 36,706 | $ | 36,706 | $ | 45,345 | 12.9 | % | $ | 1,428 | |||||||||||
(1) Includes interest income related to loans receivable investments held as of June 30, 2017.
SABRA HEALTH CARE REIT, INC.
PORTFOLIO SUMMARY (CONTINUED)
June 30, 2017
(dollars in thousands)
Proprietary Development Pipeline (1)
Investment Type | Facility Type | Investment Amount (2) | Estimated Real Estate Value Upon Completion | Weighted Average Initial Cash Lease Yield | Certificate of Occupancy Timing(3) | |||||||||||||||||||||||||||||||
State | Loan | Preferred Equity | Forward Commitment | Skilled Nursing/ Transitional Care | Senior Housing | Skilled Nursing/ Transitional Care | Senior Housing | Skilled Nursing/ Transitional Care | Senior Housing | |||||||||||||||||||||||||||
Colorado | 1 | 1 | — | — | 2 | $ | — | $ | 7,252 | $ | — | $ | 54,000 | 7.8 | % | Q3 2016- Q4 2017 | ||||||||||||||||||||
Florida | — | — | 1 | — | 1 | — | — | — | 24,365 | 7.5 | % | Q4 2017 | ||||||||||||||||||||||||
Indiana | — | 4 | — | — | 4 | — | 15,099 | — | 116,800 | 7.3 | % | Q1 2017- Q4 2017 | ||||||||||||||||||||||||
Kentucky | — | 1 | — | — | 1 | — | 5,434 | — | 27,000 | 7.4 | % | Q4 2015 | ||||||||||||||||||||||||
Ohio | 1 | 1 | — | — | 2 | — | 4,957 | — | 59,100 | 7.4 | % | Q4 2016- Q1 2018 | ||||||||||||||||||||||||
Tennessee | — | 1 | — | — | 1 | — | 4,050 | — | 17,800 | 8.3 | % | Q2 2017 | ||||||||||||||||||||||||
Texas | 2 | 4 | — | 1 | 5 | 4,421 | 13,206 | 18,100 | 65,900 | 8.0 | % | Q4 2015- Q3 2018 | ||||||||||||||||||||||||
4 | 12 | 1 | 1 | 16 | $ | 4,421 | $ | 49,998 | $ | 18,100 | $ | 364,965 | 7.6 | % | ||||||||||||||||||||||
New Assets in Real Estate Portfolio (4)
Facility Type | Beds/Units | Gross Book Value | % of Total Real Estate Invested | ||||||||||||||||
State | Skilled Nursing/Transitional Care | Senior Housing | Skilled Nursing/Transitional Care | Senior Housing | |||||||||||||||
Arizona | — | 1 | — | 48 | $ | 10,212 | 0.4 | % | |||||||||||
Colorado | — | 1 | — | 48 | 10,700 | 0.5 | % | ||||||||||||
Illinois | — | 1 | — | 53 | 5,571 | 0.2 | % | ||||||||||||
Indiana | — | 1 | — | 172 | 26,587 | 1.1 | % | ||||||||||||
Nevada | — | 1 | — | 68 | 23,670 | 1.0 | % | ||||||||||||
Texas | 1 | 4 | 125 | 195 | 55,802 | 2.4 | % | ||||||||||||
Virginia | — | 1 | — | 68 | 23,000 | 1.0 | % | ||||||||||||
Wisconsin | — | 1 | — | 60 | 10,099 | 0.4 | % | ||||||||||||
Canada | — | 1 | — | 74 | 26,961 | 1.2 | % | ||||||||||||
1 | 12 | 125 | 786 | $ | 192,602 | 8.2 | % | ||||||||||||
(1) Includes projects invested in or committed to as of June 30, 2017.
(2) Investment amount excludes accrued and unpaid interest receivable.
(3) Certificate of occupancy timing represents the period in which the certificate of occupancy has been received for a development project where construction has been completed
or when the certificate of occupancy is expected to be received for a development project that is currently under construction.
(4) Includes properties built since 2010 and included in real estate investments as of June 30, 2017.
| See reporting definitions. | 10 |
SABRA HEALTH CARE REIT, INC.
YEAR TO DATE INVESTMENT ACTIVITY
For the Six Months Ended June 30, 2017
(dollars in thousands)
Initial Investment Date | Facility Type | Number of Properties | Beds/Units | 2017 Amounts Invested (1) | Rate of Return/Initial Cash Yield | |||||||||||
Real Estate Investments | ||||||||||||||||
Poet's Walk of Cedar Park | 06/01/17 | Senior Housing | 1 | 68 | $ | 14,456 | 7.50 | % | ||||||||
Additions to Real Estate | Various | Multiple | N/A | N/A | 1,110 | 8.07 | % | |||||||||
Total Real Estate Investments | 15,566 | 7.54 | % | |||||||||||||
Loans Receivable | ||||||||||||||||
McKinney Construction Loan | 03/14/16 | Senior Housing | 1 | 27 | 893 | 8.00 | % | |||||||||
All Investments | $ | 16,459 | 7.57 | % | ||||||||||||
(1) Real estate investments include capitalized acquisition costs.
| See reporting definitions. | 11 |
SABRA HEALTH CARE REIT, INC.
PORTFOLIO CONCENTRATIONS (1)
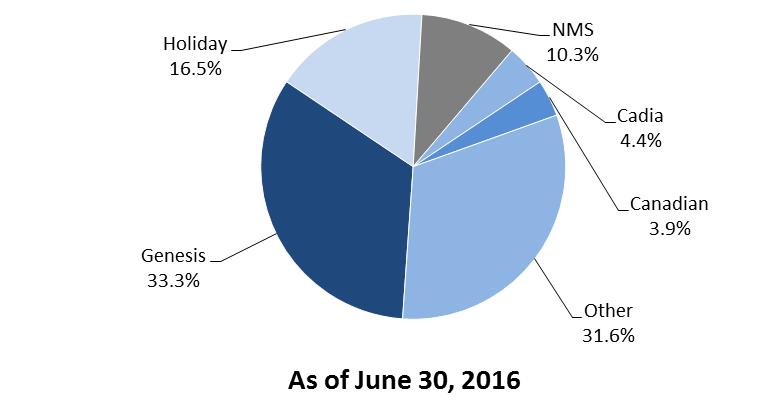
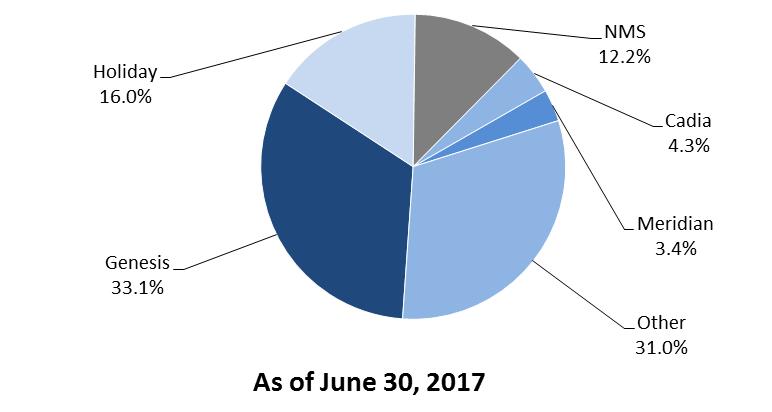
Relationship Concentration
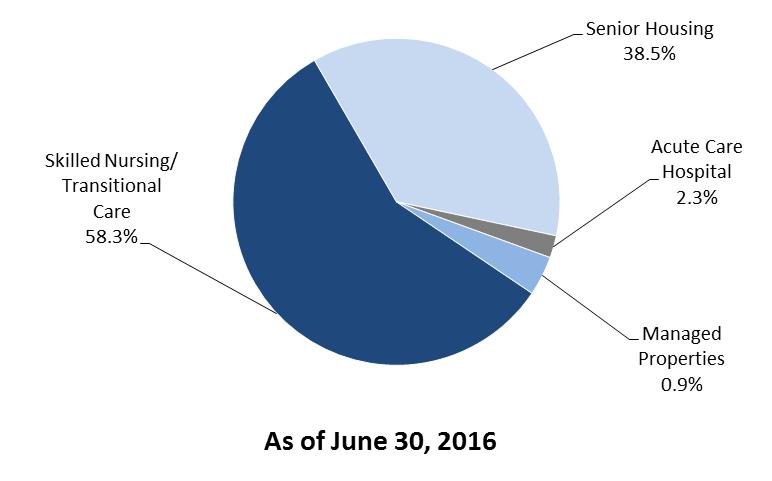
Asset Class Concentration
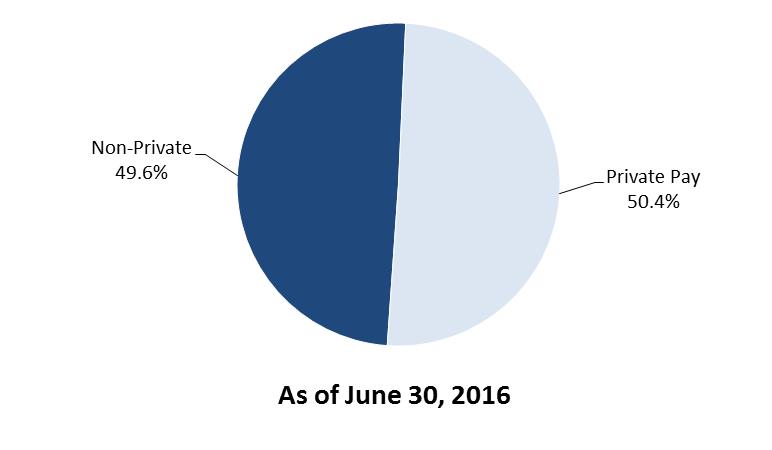
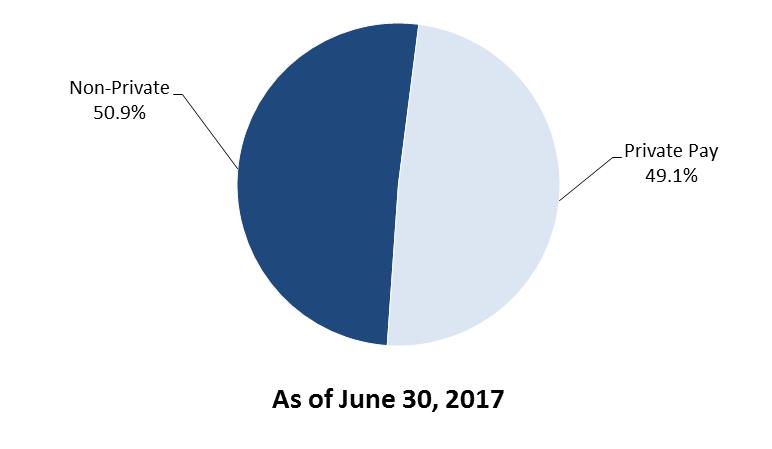
Payor Source Concentration (2)
(1) Concentrations are calculated using Annualized Revenue for real estate investments, investments in loans receivable and other investments while annualized Net Operating
Income is used for investments in Managed Properties.
(2) Tenant and borrower revenue presented one quarter in arrears.
| See reporting definitions. | 12 |
SABRA HEALTH CARE REIT, INC.
REAL ESTATE PORTFOLIO GEOGRAPHIC CONCENTRATIONS
June 30, 2017
Property Type
Location | Skilled Nursing/Transitional Care | Senior Housing | Managed Properties | Acute Care Hospital | Total | % of Total | ||||||||||||
Texas | 4 | 13 | — | 1 | 18 | 9.8 | % | |||||||||||
New Hampshire | 10 | 6 | — | — | 16 | 8.7 | ||||||||||||
Kentucky | 13 | 1 | — | — | 14 | 7.7 | ||||||||||||
Connecticut | 9 | 2 | — | — | 11 | 6.0 | ||||||||||||
Canada | — | — | 10 | — | 10 | 5.5 | ||||||||||||
Florida | 5 | 5 | — | — | 10 | 5.5 | ||||||||||||
Michigan | — | 10 | — | — | 10 | 5.5 | ||||||||||||
Ohio | 8 | — | — | — | 8 | 4.4 | ||||||||||||
Oklahoma | 6 | 1 | — | — | 7 | 3.8 | ||||||||||||
Maryland | 5 | 1 | — | — | 6 | 3.3 | ||||||||||||
Other (28 states) | 36 | 36 | 1 | — | 73 | 39.8 | ||||||||||||
Total | 96 | 75 | 11 | 1 | 183 | 100.0 | % | |||||||||||
% of Total properties | 52.5 | % | 41.0 | % | 6.0 | % | 0.5 | % | 100.0 | % | ||||||||
Distribution of Beds/Units
Total Number of Properties | Facility Type | ||||||||||||||||||||
Location | Skilled Nursing/Transitional Care | Senior Housing | Managed Properties | Acute Care Hospital | Total | % of Total | |||||||||||||||
Texas | 18 | 485 | 1,220 | — | 70 | 1,775 | 9.4 | % | |||||||||||||
New Hampshire | 16 | 904 | 838 | — | — | 1,742 | 9.3 | ||||||||||||||
Connecticut | 11 | 1,350 | 140 | — | — | 1,490 | 7.9 | ||||||||||||||
Florida | 10 | 660 | 617 | — | — | 1,277 | 6.8 | ||||||||||||||
Kentucky | 14 | 1,044 | 68 | — | — | 1,112 | 5.9 | ||||||||||||||
Canada | 10 | — | — | 941 | — | 941 | 5.0 | ||||||||||||||
Ohio | 8 | 900 | — | — | — | 900 | 4.8 | ||||||||||||||
Maryland | 6 | 782 | 68 | — | — | 850 | 4.5 | ||||||||||||||
Nebraska | 6 | 400 | 296 | — | — | 696 | 3.7 | ||||||||||||||
Colorado | 5 | 509 | 132 | — | — | 641 | 3.4 | ||||||||||||||
Other (28 states) | 79 | 3,655 | 3,691 | 60 | — | 7,406 | 39.3 | ||||||||||||||
Total | 183 | 10,689 | 7,070 | 1,001 | 70 | 18,830 | 100.0 | % | |||||||||||||
% of Total beds/units | 56.8 | % | 37.5 | % | 5.3 | % | 0.4 | % | 100.0 | % | |||||||||||
| See reporting definitions. | 13 |
SABRA HEALTH CARE REIT, INC.
REAL ESTATE PORTFOLIO GEOGRAPHIC CONCENTRATIONS
June 30, 2017
(dollars in thousands)
Investment
Location | Total Number of Properties | Skilled Nursing/Transitional Care | Senior Housing | Managed Properties | Acute Care Hospital | Total | % of Total | |||||||||||||||||||
Texas | 18 | $ | 54,549 | $ | 215,435 | $ | — | $ | 61,640 | $ | 331,624 | 14.4 | % | |||||||||||||
Maryland | 6 | 278,569 | 6,566 | — | — | 285,135 | 12.3 | |||||||||||||||||||
Canada (1) | 10 | — | — | 154,957 | — | 154,957 | 6.7 | |||||||||||||||||||
Connecticut | 11 | 115,833 | 29,124 | — | — | 144,957 | 6.3 | |||||||||||||||||||
Florida | 10 | 29,418 | 92,843 | — | — | 122,261 | 5.3 | |||||||||||||||||||
Delaware | 4 | 95,780 | — | — | — | 95,780 | 4.1 | |||||||||||||||||||
Nebraska | 6 | 63,088 | 28,297 | — | — | 91,385 | 4.0 | |||||||||||||||||||
New Hampshire | 16 | 46,839 | 40,898 | — | — | 87,737 | 3.8 | |||||||||||||||||||
North Carolina | 3 | 9,318 | 67,272 | — | — | 76,590 | 3.3 | |||||||||||||||||||
Michigan | 10 | — | 74,413 | — | — | 74,413 | 3.2 | |||||||||||||||||||
Other (28 states) | 89 | 345,564 | 489,816 | 9,377 | — | 844,757 | 36.6 | |||||||||||||||||||
Total | 183 | $ | 1,038,958 | $ | 1,044,664 | $ | 164,334 | $ | 61,640 | $ | 2,309,596 | 100.0 | % | |||||||||||||
% of Total Properties | 45.0 | % | 45.2 | % | 7.1 | % | 2.7 | % | 100.0 | % | ||||||||||||||||
(1) Investment balance in Canada is based on the exchange rate as of June 30, 2017 of $0.7703 per CAD $1.00.
| See reporting definitions. | 14 |
SABRA HEALTH CARE REIT, INC.
PORTFOLIO LEASE EXPIRATIONS (1)
June 30, 2017
(dollars in thousands)
2020 | 2021 | 2022 | 2023 | 2024 | 2025 | 2026 | Thereafter | Total | |||||||||||||||||||||||||||
Skilled Nursing/Transitional Care | |||||||||||||||||||||||||||||||||||
Properties | 9 | 8 | 26 | 13 | 19 | 2 | 4 | 15 | 96 | ||||||||||||||||||||||||||
Beds/Units | 963 | 1,041 | 2,457 | 1,605 | 2,047 | 222 | 500 | 1,854 | 10,689 | ||||||||||||||||||||||||||
Annualized Revenues | $ | 6,275 | $ | 7,213 | $ | 34,462 | $ | 12,860 | $ | 22,310 | $ | 2,007 | $ | 10,578 | $ | 42,611 | $ | 138,316 | |||||||||||||||||
Senior Housing | |||||||||||||||||||||||||||||||||||
Properties | — | 2 | 13 | 2 | 9 | 13 | 1 | 33 | 73 | ||||||||||||||||||||||||||
Beds/Units | — | 163 | 912 | 215 | 667 | 932 | 100 | 3,949 | 6,938 | ||||||||||||||||||||||||||
Annualized Revenues | — | 1,070 | 9,285 | 1,487 | 7,087 | 10,442 | 628 | 53,819 | 83,818 | ||||||||||||||||||||||||||
Acute Care Hospital | |||||||||||||||||||||||||||||||||||
Properties | — | — | — | — | — | — | — | 1 | 1 | ||||||||||||||||||||||||||
Beds/Units | — | — | — | — | — | — | — | 70 | 70 | ||||||||||||||||||||||||||
Annualized Revenues | — | — | — | — | — | — | — | 5,501 | 5,501 | ||||||||||||||||||||||||||
Total Properties | 9 | 10 | 39 | 15 | 28 | 15 | 5 | 49 | 170 | ||||||||||||||||||||||||||
Total Beds/Units | 963 | 1,204 | 3,369 | 1,820 | 2,714 | 1,154 | 600 | 5,873 | 17,697 | ||||||||||||||||||||||||||
Total Annualized Revenues | $ | 6,275 | $ | 8,283 | $ | 43,747 | $ | 14,347 | $ | 29,397 | $ | 12,449 | $ | 11,206 | $ | 101,931 | $ | 227,635 | |||||||||||||||||
% of Revenue | 2.8 | % | 3.6 | % | 19.2 | % | 6.3 | % | 12.9 | % | 5.5 | % | 4.9 | % | 44.8 | % | 100.0 | % | |||||||||||||||||
(1) Excludes Managed Properties and two Senior Housing facilities transitioned to new operators that are not subject to leases.
| See reporting definitions. | 15 |
SABRA HEALTH CARE REIT, INC.
RECENT INVESTMENT ACTIVITY
Poet's Walk of Cedar Park
•Investment Date: | June 1, 2017 | |
•Investment Amount: | $14.5 million | |
•Investment Type: | Real Estate | |
•Number of Properties: | 1 | |
•Location: | Cedar Park, TX | |
•Available Beds/Units: | 68 | |
•Property Type: | Senior Housing | |
•Annualized GAAP Income: | $1.3 million | |
•Initial Cash Yield: | 7.5% | |
| See reporting definitions. | 16 |
SABRA HEALTH CARE REIT, INC.
RECONCILIATIONS OF FFO, NORMALIZED FFO, AFFO AND NORMALIZED AFFO
(dollars in thousands, except per share data)
Three Months Ended June 30, | Six Months Ended June 30, | ||||||||||||||
2017 | 2016 | 2017 | 2016 | ||||||||||||
Net income attributable to common stockholders | $ | 17,960 | $ | 34,915 | $ | 34,222 | $ | 16,643 | |||||||
Add: | |||||||||||||||
Depreciation of real estate assets | 17,220 | 16,405 | 36,357 | 34,171 | |||||||||||
Net (gain) loss on sales of real estate | (4,032 | ) | 52 | (4,032 | ) | 4,654 | |||||||||
Impairment of real estate | — | — | — | 29,811 | |||||||||||
FFO attributable to common stockholders | $ | 31,148 | $ | 51,372 | $ | 66,547 | $ | 85,279 | |||||||
Additional default interest income | — | (8,850 | ) | — | (4,212 | ) | |||||||||
Lease termination fee | (916 | ) | (2,098 | ) | (2,283 | ) | (2,098 | ) | |||||||
CCP merger costs | 5,876 | — | 6,407 | — | |||||||||||
Loss on extinguishment of debt | — | — | — | 556 | |||||||||||
Provision for doubtful accounts and loan losses, net (1) | 258 | (409 | ) | 1,985 | 1,860 | ||||||||||
Other normalizing items (2) | 41 | (252 | ) | 112 | (252 | ) | |||||||||
Normalized FFO attributable to common stockholders | $ | 36,407 | $ | 39,763 | $ | 72,768 | $ | 81,133 | |||||||
FFO | $ | 31,148 | $ | 51,372 | $ | 66,547 | $ | 85,279 | |||||||
Expensed acquisition pursuit costs (3) | 5,888 | 82 | 6,451 | 171 | |||||||||||
Stock-based compensation expense | 1,731 | 1,834 | 4,319 | 3,652 | |||||||||||
Straight-line rental income adjustments | (4,971 | ) | (5,524 | ) | (9,578 | ) | (11,117 | ) | |||||||
Amortization of deferred financing costs | 1,281 | 1,273 | 2,558 | 2,494 | |||||||||||
Non-cash portion of loss on extinguishment of debt | — | — | — | 556 | |||||||||||
Change in fair value of contingent consideration | — | (50 | ) | (822 | ) | (50 | ) | ||||||||
Provision for doubtful straight-line rental income, loan losses and other reserves | 534 | 92 | 1,924 | 2,615 | |||||||||||
Other non-cash adjustments (4) | 523 | 344 | 922 | 648 | |||||||||||
AFFO attributable to common stockholders | $ | 36,134 | $ | 49,423 | $ | 72,321 | $ | 84,248 | |||||||
Additional default interest income | — | (8,850 | ) | — | (4,212 | ) | |||||||||
Lease termination fee | (916 | ) | (2,098 | ) | (2,283 | ) | (2,098 | ) | |||||||
Provision for doubtful cash income (1) | — | 131 | 381 | — | |||||||||||
Other normalizing items (2) | 26 | (252 | ) | 38 | (252 | ) | |||||||||
Normalized AFFO attributable to common stockholders | $ | 35,244 | $ | 38,354 | $ | 70,457 | $ | 77,686 | |||||||
Amounts per diluted common share attributable to common stockholders: | |||||||||||||||
Net income | $ | 0.27 | $ | 0.53 | $ | 0.52 | $ | 0.25 | |||||||
FFO | $ | 0.47 | $ | 0.78 | $ | 1.01 | $ | 1.30 | |||||||
Normalized FFO | $ | 0.55 | $ | 0.61 | $ | 1.11 | $ | 1.24 | |||||||
AFFO | $ | 0.55 | $ | 0.75 | $ | 1.10 | $ | 1.28 | |||||||
Normalized AFFO | $ | 0.53 | $ | 0.58 | $ | 1.07 | $ | 1.18 | |||||||
Weighted average number of common shares outstanding, diluted: | |||||||||||||||
Net income, FFO and Normalized FFO | 65,670,853 | 65,503,383 | 65,694,019 | 65,454,337 | |||||||||||
AFFO and Normalized AFFO | 65,985,940 | 65,784,776 | 66,009,102 | 65,783,312 | |||||||||||
(1) See Reporting Definitions for definition of Normalized FFO and Normalized AFFO for further information.
(2) Other normalizing items for FFO includes non-Managed Properties operating expenses and ineffectiveness loss related to our LIBOR interest rate swaps. Other normalizing items for AFFO includes non-Managed Properties operating expenses.
(3) On October 1, 2016 we early adopted Accounting Standards Update 2017-01, Business Combinations (Topic 805), which clarifies the definition of a business with the objective of adding guidance to assist entities with evaluating whether transactions should be accounted for as business acquisitions. All real estate acquisitions completed subsequent to October 1, 2016 were considered asset acquisitions and we have capitalized acquisition pursuit costs associated with these acquisitions, including those incurred prior to October 1, 2016. Acquisitions completed prior to October 1, 2016 were deemed business combinations and the related acquisition pursuit costs were expensed as incurred. Acquisition costs incurred during the three and six months ended June 30, 2017 primarily relate to the pending Merger transaction.
(4) Other non-cash adjustments include amortization of debt premiums/discounts, non-cash interest income adjustments and amortization expense related to our interest rate hedges.
| See reporting definitions. | 17 |
SABRA HEALTH CARE REIT, INC.
RECONCILIATIONS OF NOI AND SAME STORE CASH NOI
(dollars in thousands)
Three Months Ended June 30, | |||||||||||||||||||||||||||||||||||||||||||||||
2017 | 2016 | ||||||||||||||||||||||||||||||||||||||||||||||
Skilled Nursing/ Transitional Care | Senior Housing | Managed Properties | Acute Care Hospital | Other | Total | Skilled Nursing/ Transitional Care | Senior Housing | Managed Properties | Acute Care Hospital | Other | Total | ||||||||||||||||||||||||||||||||||||
Net income (loss) | $ | 29,477 | $ | 12,063 | $ | 1,259 | $ | 901 | $ | (23,164 | ) | $ | 20,536 | $ | 24,832 | $ | 11,781 | $ | 241 | $ | 844 | $ | (232 | ) | $ | 37,466 | |||||||||||||||||||||
Adjustments: | |||||||||||||||||||||||||||||||||||||||||||||||
Depreciation and amortization | 7,994 | 7,396 | 1,139 | 475 | 216 | 17,220 | 7,961 | 7,488 | 278 | 477 | 201 | 16,405 | |||||||||||||||||||||||||||||||||||
Interest | 1,159 | 471 | — | — | 14,232 | 15,862 | 1,363 | 499 | — | — | 14,565 | 16,427 | |||||||||||||||||||||||||||||||||||
General and administrative | — | — | — | — | 11,149 | 11,149 | — | — | — | — | 4,636 | 4,636 | |||||||||||||||||||||||||||||||||||
Provision for doubtful accounts and loan losses | — | — | — | — | 535 | 535 | — | — | — | — | 223 | 223 | |||||||||||||||||||||||||||||||||||
Impairment of real estate | — | — | — | — | — | — | — | — | — | — | — | — | |||||||||||||||||||||||||||||||||||
Loss on extinguishment of debt | — | — | — | — | — | — | — | — | — | — | — | — | |||||||||||||||||||||||||||||||||||
Other income | — | — | — | — | (941 | ) | (941 | ) | — | — | — | — | (2,400 | ) | (2,400 | ) | |||||||||||||||||||||||||||||||
Net (gain) loss on sale of real estate | (4,032 | ) | — | — | — | — | (4,032 | ) | — | — | — | 52 | — | 52 | |||||||||||||||||||||||||||||||||
Total net operating income | $ | 34,598 | $ | 19,930 | $ | 2,398 | $ | 1,376 | $ | 2,027 | $ | 60,329 | $ | 34,156 | $ | 19,768 | $ | 519 | $ | 1,373 | $ | 16,993 | $ | 72,809 | |||||||||||||||||||||||
Net operating income not included in same-store | (1,308 | ) | (2,439 | ) | (1,835 | ) | — | (1,630 | ) | (1,445 | ) | — | — | ||||||||||||||||||||||||||||||||||
Total same store net operating income (1) | $ | 33,290 | $ | 17,491 | $ | 563 | $ | 1,376 | $ | 32,526 | $ | 18,323 | $ | 519 | $ | 1,373 | |||||||||||||||||||||||||||||||
Straight-line rental income adjustments | (2,141 | ) | (2,060 | ) | — | (95 | ) | (2,288 | ) | (2,743 | ) | — | (117 | ) | |||||||||||||||||||||||||||||||||
Same store cash net operating income (1) | $ | 31,149 | $ | 15,431 | $ | 563 | $ | 1,281 | $ | 30,238 | $ | 15,580 | $ | 519 | $ | 1,256 | |||||||||||||||||||||||||||||||
(1) Same store includes all real estate facilities owned for the full period in both comparison periods.
| See reporting definitions. | 18 |
SABRA HEALTH CARE REIT, INC.
RECONCILIATIONS OF NOI AND SAME STORE CASH NOI (CONTINUED)
(dollars in thousands)
Six Months Ended June 30, | |||||||||||||||||||||||||||||||||||||||||||||||
2017 | 2016 | ||||||||||||||||||||||||||||||||||||||||||||||
Skilled Nursing/ Transitional Care | Senior Housing | Managed Properties | Acute Care Hospital | Other | Total | Skilled Nursing/ Transitional Care | Senior Housing | Managed Properties | Acute Care Hospital | Other | Total | ||||||||||||||||||||||||||||||||||||
Net income (loss) | $ | 54,543 | $ | 23,308 | $ | 1,769 | $ | 1,799 | $ | (42,092 | ) | $ | 39,327 | $ | 54,481 | $ | 23,482 | $ | 480 | $ | (29,811 | ) | $ | (26,909 | ) | $ | 21,723 | ||||||||||||||||||||
Adjustments: | |||||||||||||||||||||||||||||||||||||||||||||||
Depreciation and amortization | 16,038 | 17,245 | 1,690 | 952 | 432 | 36,357 | 15,940 | 14,938 | 542 | 2,367 | 384 | 34,171 | |||||||||||||||||||||||||||||||||||
Interest | 2,328 | 953 | — | — | 28,369 | 31,650 | 2,736 | 992 | — | — | 29,617 | 33,345 | |||||||||||||||||||||||||||||||||||
General and administrative | — | — | — | — | 18,022 | 18,022 | — | — | — | — | 9,350 | 9,350 | |||||||||||||||||||||||||||||||||||
Provision for doubtful accounts and loan losses | — | — | — | — | 2,305 | 2,305 | — | — | — | — | 2,746 | 2,746 | |||||||||||||||||||||||||||||||||||
Impairment of real estate | — | — | — | — | — | — | — | — | — | 29,811 | — | 29,811 | |||||||||||||||||||||||||||||||||||
Loss on extinguishment of debt | — | — | — | — | — | — | — | — | — | — | 556 | 556 | |||||||||||||||||||||||||||||||||||
Other income | — | — | — | — | (3,070 | ) | (3,070 | ) | — | — | — | — | (2,400 | ) | (2,400 | ) | |||||||||||||||||||||||||||||||
Net (gain) loss on sale of real estate | (4,026 | ) | (6 | ) | — | — | — | (4,032 | ) | 4,602 | — | — | 52 | — | 4,654 | ||||||||||||||||||||||||||||||||
Total net operating income | $ | 68,883 | $ | 41,500 | $ | 3,459 | $ | 2,751 | $ | 3,966 | $ | 120,559 | $ | 77,759 | $ | 39,412 | $ | 1,022 | $ | 2,419 | $ | 13,344 | $ | 133,956 | |||||||||||||||||||||||
| See reporting definitions. | 19 |
SABRA HEALTH CARE REIT, INC.
REPORTING DEFINITIONS
Acute Care Hospital. A facility designed to provide extended medical and rehabilitation care for patients who are clinically complex and have multiple acute or chronic conditions.
Annualized Revenues. The annual straight-line rental revenues under leases and interest and other income generated by the Company's loans receivable and other investments based on amounts invested and applicable terms as of the end of the period presented. Annualized Revenues do not include tenant recoveries or additional rents. The Company uses Annualized Revenues for the purpose of determining revenue concentrations and lease expirations.
Cash Net Operating Income (“Cash NOI”). The Company believes that net income attributable to common stockholders as defined by GAAP is the most appropriate earnings measure. We consider Cash NOI an important supplemental measure because it allows investors, analysts and our management to evaluate the operating performance of our investments. We define Cash NOI as total revenues less operating expenses and non-cash revenues. Cash NOI excludes all other financial statement amounts included in net income.
EBITDAR. Earnings before interest, taxes, depreciation, amortization and rent (“EBITDAR”) for a particular facility accruing to the operator/tenant of the property (not the Company) for the period presented. The Company uses EBITDAR in determining EBITDAR Coverage. EBITDAR has limitations as an analytical tool. EBITDAR does not reflect historical cash expenditures or future cash requirements for facility capital expenditures or contractual commitments. In addition, EBITDAR does not represent a property's net income or cash flow from operations and should not be considered an alternative to those indicators. The Company utilizes EBITDAR as a supplemental measure of the ability of the Company's operators/tenants and relevant guarantors to generate sufficient liquidity to meet related obligations to the Company.
EBITDAR Coverage. Represents the ratio of EBITDAR to contractual rent for owned facilities (excluding Managed Properties). EBITDAR Coverage is a supplemental measure of an operator/tenant's ability to meet their cash rent and other obligations to the Company. However, its usefulness is limited by, among other things, the same factors that limit the usefulness of EBITDAR.
EBITDARM. Earnings before interest, taxes, depreciation, amortization, rent and management fees (“EBITDARM”) for a particular facility accruing to the operator/tenant of the property (not the Company), for the period presented. The Company uses EBITDARM in determining EBITDARM Coverage. The usefulness of EBITDARM is limited by the same factors that limit the usefulness of EBITDAR. Together with EBITDAR, the Company utilizes EBITDARM to evaluate the core operations of the properties by eliminating management fees, which vary based on operator/tenant and its operating structure.
EBITDARM Coverage. Represents the ratio of EBITDARM to contractual rent for owned facilities (excluding Managed Properties). EBITDARM coverage is a supplemental measure of a property's ability to generate cash flows for the operator/tenant (not the Company) to meet the operator's/tenant's related cash rent and other obligations to the Company. However, its usefulness is limited by, among other things, the same factors that limit the usefulness of EBITDARM.
Enterprise Value. The Company believes Enterprise Value is an important measurement as it is a measure of a company’s value. We calculate Enterprise Value as market equity capitalization plus debt. Market equity capitalization is calculated as the number of shares of common stock multiplied by the closing price of our common stock on the last day of the period presented. Total Enterprise Value includes our market equity capitalization and consolidated debt, less cash and cash equivalents.
Fixed Charge Coverage Ratio. EBITDAR (including adjustments for one-time and pro forma items) for the period indicated (one quarter in arrears) for all operations of any entities that guarantee the tenants' lease obligations to the Company divided by the same period cash rent expense, interest expense and mandatory principal payments for operations of any entity that guarantees the tenants' lease obligation to the Company. Fixed Charge Coverage is a supplemental measure of a guarantor's ability to meet the operator/tenant's cash rent and other obligations to the Company should the operator/tenant be unable to do so itself. However, its usefulness is limited by, among other things, the same factors that limit the usefulness of EBITDAR. Fixed Charge Coverage is calculated by the Company as described above based on information provided by guarantors without independent verification by the Company and may differ from similar metrics calculated by the guarantors.
Funds From Operations Attributable to Common Stockholders (“FFO”) and Adjusted Funds from Operations Attributable to Common Stockholders (“AFFO”). The Company believes that net income attributable to common stockholders as defined by GAAP is the most appropriate earnings measure. The Company also believes that Funds From Operations, or FFO, as defined in accordance with the definition used by the National Association of Real Estate Investment Trusts (“NAREIT”), and Adjusted Funds from Operations, or AFFO (and related per share amounts) are important non-GAAP supplemental measures of the Company's operating performance. Because the historical cost accounting convention used for real estate assets requires straight-line depreciation (except on land), such accounting presentation implies that the value of real estate assets diminishes predictably over time. However, since real estate values have historically risen or fallen with market and other conditions, presentations of operating results for a real estate investment trust that uses historical cost accounting for depreciation could be less informative. Thus, NAREIT created FFO as a supplemental measure of operating performance for real estate investment trusts that excludes historical cost depreciation and amortization, among other items, from net income attributable to common stockholders, as defined by GAAP. FFO is defined as net income attributable to common stockholders, computed in accordance with GAAP, excluding gains or losses from real estate dispositions, plus real estate depreciation and amortization and real estate impairment charges. AFFO is defined as FFO excluding straight-line rental income adjustments, stock-based compensation expense, amortization of deferred financing costs, acquisition pursuit costs, as well as other non-cash revenue and expense items (including provisions and write-offs related to
| 20 | |
SABRA HEALTH CARE REIT, INC.
REPORTING DEFINITIONS
straight-line rental income, provision for loan losses, changes in fair value of contingent consideration, amortization of debt premiums/discounts and non-cash interest income adjustments). The Company believes that the use of FFO and AFFO (and the related per share amounts), combined with the required GAAP presentations, improves the understanding of the Company's operating results among investors and makes comparisons of operating results among real estate investment trusts more meaningful. The Company considers FFO and AFFO to be useful measures for reviewing comparative operating and financial performance because, by excluding the applicable items listed above, FFO and AFFO can help investors compare the operating performance of the Company between periods or as compared to other companies. While FFO and AFFO are relevant and widely used measures of operating performance of real estate investment trusts, they do not represent cash flows from operations or net income attributable to common stockholders as defined by GAAP and should not be considered an alternative to those measures in evaluating the Company’s liquidity or operating performance. FFO and AFFO also do not consider the costs associated with capital expenditures related to the Company’s real estate assets nor do they purport to be indicative of cash available to fund the Company’s future cash requirements. Further, the Company’s computation of FFO and AFFO may not be comparable to FFO and AFFO reported by other real estate investment trusts that do not define FFO in accordance with the current NAREIT definition or that interpret the current NAREIT definition or define AFFO differently than the Company does.
Investment. Represents the carrying amount of real estate assets after adding back accumulated depreciation and amortization.
Market Capitalization. Total common shares of Sabra outstanding multiplied by the closing price per common share as of a given period.
Net Operating Income (“NOI”). The Company believes that net income attributable to common stockholders as defined by GAAP is the most appropriate earnings measure. We consider NOI an important supplemental measure because it allows investors, analysts and our management to evaluate the operating performance of our investments. We define NOI as total revenues less operating expenses. NOI excludes all other financial statement amounts included in net income.
Normalized FFO and Normalized AFFO. Normalized FFO and Normalized AFFO represent FFO and AFFO, respectively, adjusted for certain income and expense items that the Company does not believe are indicative of its ongoing operating results. The Company considers Normalized FFO and Normalized AFFO to be useful measures to evaluate the Company’s operating results excluding these income and expense items to help investors compare the operating performance of the Company between periods or as compared to other companies. Normalized FFO and Normalized AFFO do not represent cash flows from operations or net income as defined by GAAP and should not be considered an alternative to those measures in evaluating the Company’s liquidity or operating performance. Normalized FFO and Normalized AFFO also do not consider the costs associated with capital expenditures related to the Company’s real estate assets nor do they purport to be indicative of cash available to fund the Company’s future cash requirements. Further, the Company’s computation of Normalized FFO and Normalized AFFO may not be comparable to Normalized FFO and Normalized AFFO reported by other REITs that do not define FFO in accordance with the current NAREIT definition or that interpret the current NAREIT definition or define FFO and AFFO or Normalized FFO and Normalized AFFO differently than the Company does.
Occupancy Percentage. Occupancy Percentage represents the facilities’ average operating occupancy for the period indicated. The percentages are calculated by dividing the actual census from the period presented by the available beds/units for the same period. Occupancy for independent living facilities can be greater than 100% for a given period as multiple residents could occupy a single unit.
Senior Housing. Senior housing facilities include independent living, assisted living, continuing care retirement community and memory care facilities.
Skilled Mix. Skilled Mix is defined as the total Medicare and non-Medicaid managed care patient revenue at Skilled Nursing/Transitional Care facilities divided by the total revenues at Skilled Nursing/Transitional Care facilities for the period indicated.
Skilled Nursing/Transitional Care. Skilled nursing/transitional care facilities include skilled nursing, transitional care, multi-license designation and mental health facilities.
Stabilized Facility. At the time of acquisition, the Company classifies each facility as either stabilized or pre-stabilized. In addition, the Company may classify a facility as pre-stabilized after acquisition. Circumstances that could result in a facility being classified as pre-stabilized include newly completed developments, facilities undergoing major renovations or additions, facilities being repositioned or transitioned to new operators, and significant transitions within the tenants’ business model. Such facilities will be reclassified to stabilized upon maintaining consistent occupancy (85% for Skilled Nursing/Transitional Care and 90% for Senior Housing Facilities) but in no event beyond 24 months after the date of classification as pre-stabilized. Stabilized Facilities exclude (i) Managed Properties, (ii) facilities held for sale, (iii) facilities being positioned to be sold, (iv) facilities being transitioned from leased by the Company to being operated by the Company, and (v) facilities acquired during the three months preceding the period presented.
Total Debt. The carrying amount of the Company’s revolving credit facility, term loan, senior unsecured notes, and mortgage indebtedness, as reported in the Company’s condensed consolidated financial statements.
| 21 | |