Attached files
| file | filename |
|---|---|
| EX-99.1 - EX-99.1 - Inovalon Holdings, Inc. | a17-18541_1ex99d1.htm |
| 8-K - 8-K - Inovalon Holdings, Inc. | a17-18541_18k.htm |
Exhibit 99.2
Second Quarter 2017 Earnings Presentation Supplement August 2, 2017

2 This presentation contains forward-looking statements. All statements other than statements of historical facts contained in this presentation, including, but not limited to, statements regarding future results of the operations and financial position of Inovalon Holdings, Inc. (“Inovalon”), and its financial targets, business strategy, and plans and objectives for future operations, are forward-looking statements. The words ‘‘believe,’’ ‘‘may,’’ “see”, ‘‘will,’’ ‘‘target,” “estimate,’’ ‘‘continue,’’ ‘‘anticipate,’’ ‘‘intend,’’ ‘‘expect,’’ “growth” and variations of these words or similar expressions are intended to identify forward-looking statements. Inovalon has based these forward-looking statements on its estimates of its financial results and its current expectations and projections about future events and financial trends that it believes may affect its financial condition, results of operations, business strategy, short-term and long-term business operations and objectives, and financial needs as of the date of this presentation. These forward-looking statements are subject to a number of significant business, economic, regulatory and competitive risks, uncertainties and contingencies, many of which are beyond the control of Inovalon and its management, and are based upon assumptions with respect to future events or decisions, which are subject to change. Moreover, because Inovalon operates in a very competitive and rapidly changing environment, new risks emerge from time to time. It is not possible for Inovalon’s management to predict all risks, nor can Inovalon assess the impact of all factors on its business or the extent to which any factor, or combination of factors, may cause actual results to differ materially from those contained in any forward-looking statements. In light of these risks, uncertainties and assumptions, the forward-looking events and circumstances discussed in this presentation may not occur and actual results, including, but not limited to, the timing of and investment in technological advancements and developments, as well as Inovalon’s ability to enter into new agreements with existing or new platforms, products and solutions in the timeframes expected, or at all, could differ materially and adversely from those anticipated or implied in the forward-looking statements. For a discussion of the risks and uncertainties that may cause Inovalon’s actual results, performance or achievements to differ materially from those expressed or implied by forward-looking statements, you should read Inovalon’s most recent Annual Report on Form 10-K, including the sections entitled “Risk Factors” and “Special Note Regarding Forward Looking Statements,” as well as the other documents that Inovalon may file from time to time in the future with the Securities and Exchange Commission. You should not rely upon forward-looking statements as predictions of future events. Although Inovalon believes that the expectations reflected in the forward-looking statements are reasonable, Inovalon cannot guarantee and provides no assurance that the future results, levels of activity, performance or events and circumstances reflected in the forward-looking statements will be achieved or occur. In addition, certain information included in this presentation is presented strictly for illustrative or educational purposes, and such information should not be viewed as a representation regarding management’s expectations or actual results. Management’s expectations and actual results could differ materially from information presented solely for illustrative or educational purposes. Except as required by law, Inovalon undertakes no obligation to update publicly any forward-looking statements for any reason after the date of this presentation, to conform these statements to actual results or to changes in Inovalon’s expectations, and nothing in this presentation should be regarded as a representation by any person that any financial targets, business strategy or plans and objectives for future operations suggested by any forward-looking statements will be achieved or realized. In addition, this presentation may include certain non-GAAP financial measures. These non-GAAP measures are in addition to, not a substitute for or necessarily superior to, measures of financial performance prepared in accordance with U.S. GAAP. The GAAP financial measure most directly comparable to each non-GAAP financial measure used or discussed, and a reconciliation of the differences between each non-GAAP financial measure and the comparable GAAP financial measure, is available herein and within our public filings with the Securities and Exchange Commission, available on the Company’s investor website at http://investors.inovalon.com. Note Regarding Forward-Looking Statements INOV Q2 2017 Earnings Presentation Supplement (8.2.17) v1.0.0
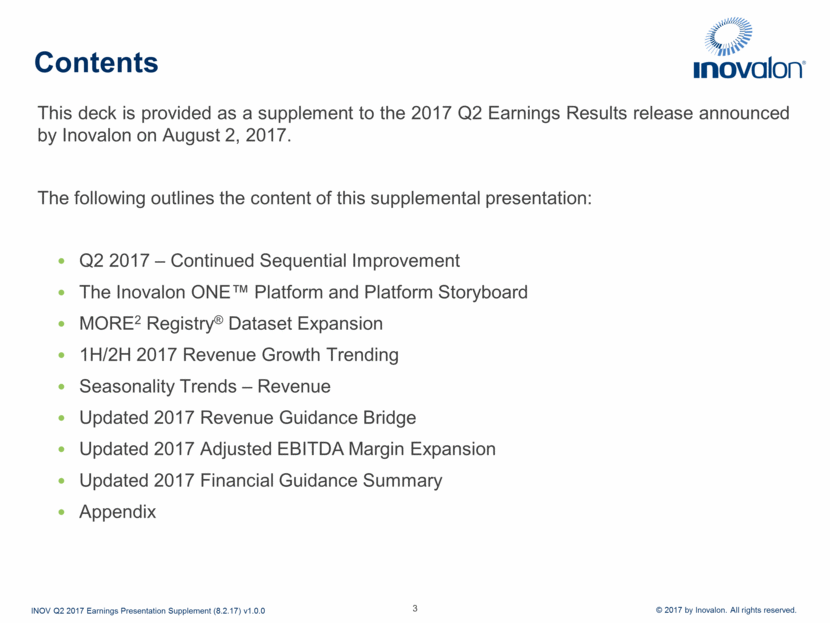
3 This deck is provided as a supplement to the 2017 Q2 Earnings Results release announced by Inovalon on August 2, 2017. The following outlines the content of this supplemental presentation: Q2 2017 – Continued Sequential Improvement The Inovalon ONE™ Platform and Platform Storyboard MORE2 Registry® Dataset Expansion 1H/2H 2017 Revenue Growth Trending Seasonality Trends – Revenue Updated 2017 Revenue Guidance Bridge Updated 2017 Adjusted EBITDA Margin Expansion Updated 2017 Financial Guidance Summary Appendix Contents INOV Q2 2017 Earnings Presentation Supplement (8.2.17) v1.0.0
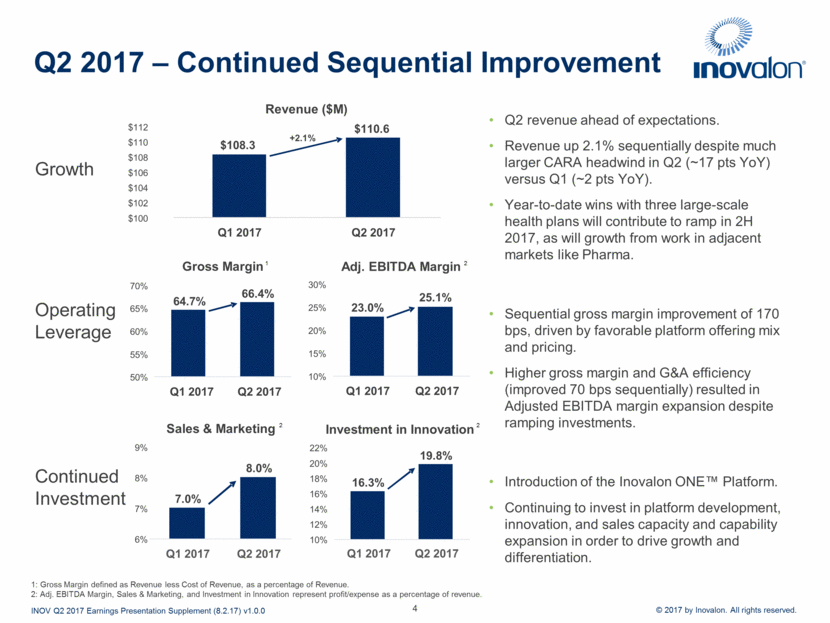
16.3% 19.8% 10% 12% 14% 16% 18% 20% 22% Q1 2017 Q2 2017 Investment in Innovation 7.0% 8.0% 6% 7% 8% 9% Q1 2017 Q2 2017 Sales & Marketing 23.0% 25.1% 10% 15% 20% 25% 30% Q1 2017 Q2 2017 Adj. EBITDA Margin 64.7% 66.4% 50% 55% 60% 65% 70% Q1 2017 Q2 2017 Gross Margin Q2 2017 – Continued Sequential Improvement Q2 revenue ahead of expectations. Revenue up 2.1% sequentially despite much larger CARA headwind in Q2 (~17 pts YoY) versus Q1 (~2 pts YoY). Year-to-date wins with three large-scale health plans will contribute to ramp in 2H 2017, as will growth from work in adjacent markets like Pharma. Sequential gross margin improvement of 170 bps, driven by favorable platform offering mix and pricing. Higher gross margin and G&A efficiency (improved 70 bps sequentially) resulted in Adjusted EBITDA margin expansion despite ramping investments. Introduction of the Inovalon ONE™ Platform. Continuing to invest in platform development, innovation, and sales capacity and capability expansion in order to drive growth and differentiation. 4 INOV Q2 2017 Earnings Presentation Supplement (8.2.17) v1.0.0 1: Gross Margin defined as Revenue less Cost of Revenue, as a percentage of Revenue. 2: Adj. EBITDA Margin, Sales & Marketing, and Investment in Innovation represent profit/expense as a percentage of revenue. 1 2 2 $108.3 $110.6 $100 $102 $104 $106 $108 $110 $112 Q1 2017 Q2 2017 Revenue ($M) +2.1% Growth Operating Leverage Continued Investment 2
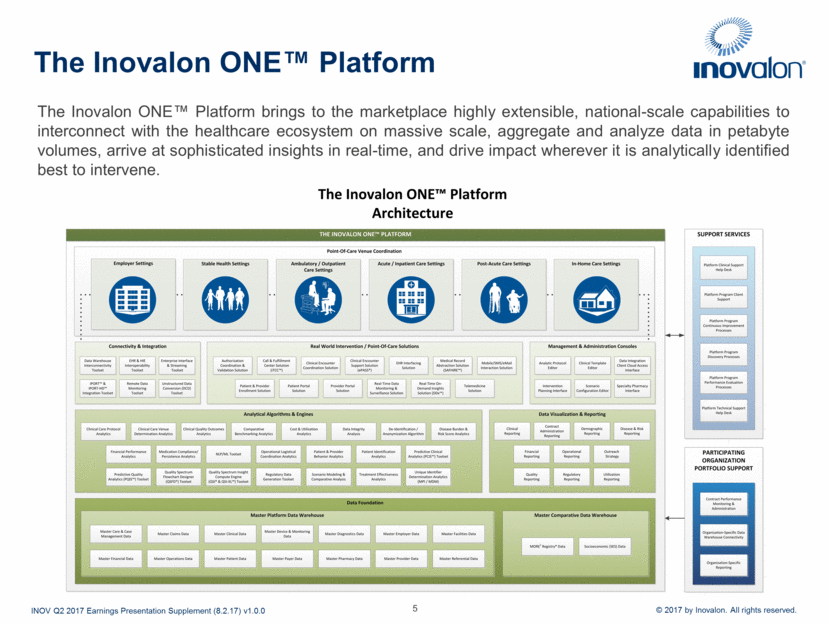
5 The Inovalon ONE™ Platform brings to the marketplace highly extensible, national-scale capabilities to interconnect with the healthcare ecosystem on massive scale, aggregate and analyze data in petabyte volumes, arrive at sophisticated insights in real-time, and drive impact wherever it is analytically identified best to intervene. The Inovalon ONE™ Platform INOV Q2 2017 Earnings Presentation Supplement (8.2.17) v1.0.0
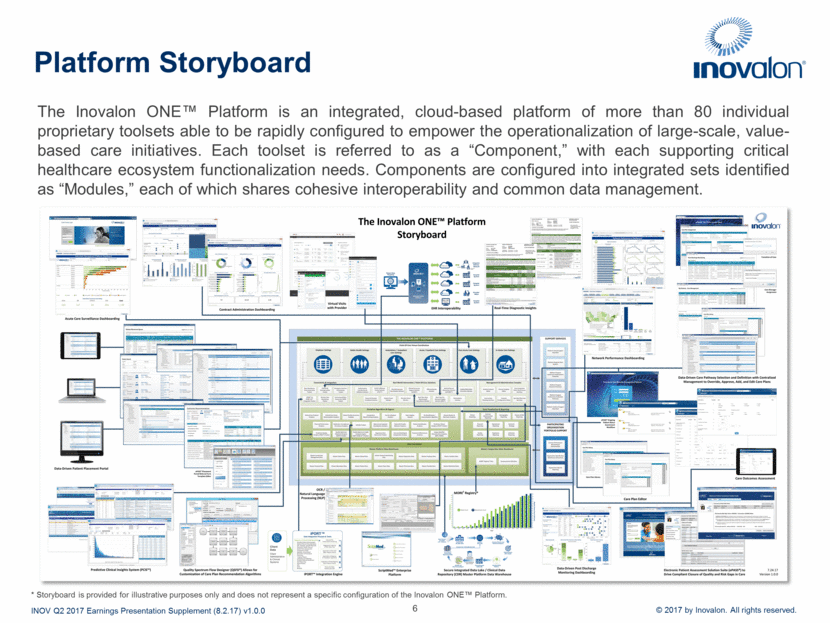
6 The Inovalon ONE™ Platform is an integrated, cloud-based platform of more than 80 individual proprietary toolsets able to be rapidly configured to empower the operationalization of large-scale, value-based care initiatives. Each toolset is referred to as a “Component,” with each supporting critical healthcare ecosystem functionalization needs. Components are configured into integrated sets identified as “Modules,” each of which shares cohesive interoperability and common data management. Platform Storyboard INOV Q2 2017 Earnings Presentation Supplement (8.2.17) v1.0.0 * Storyboard is provided for illustrative purposes only and does not represent a specific configuration of the Inovalon ONE™ Platform.
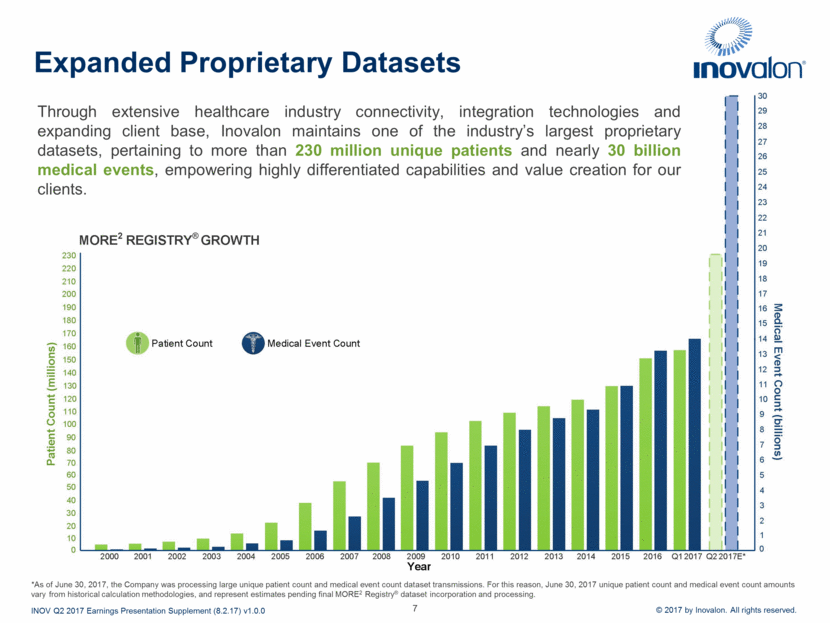
Expanded Proprietary Datasets 7 *As of June 30, 2017, the Company was processing large unique patient count and medical event count dataset transmissions. For this reason, June 30, 2017 unique patient count and medical event count amounts vary from historical calculation methodologies, and represent estimates pending final MORE2 Registry® dataset incorporation and processing. Through extensive healthcare industry connectivity, integration technologies and expanding client base, Inovalon maintains one of the industry’s largest proprietary datasets, pertaining to more than 230 million unique patients and nearly 30 billion medical events, empowering highly differentiated capabilities and value creation for our clients. INOV Q2 2017 Earnings Presentation Supplement (8.2.17) v1.0.0
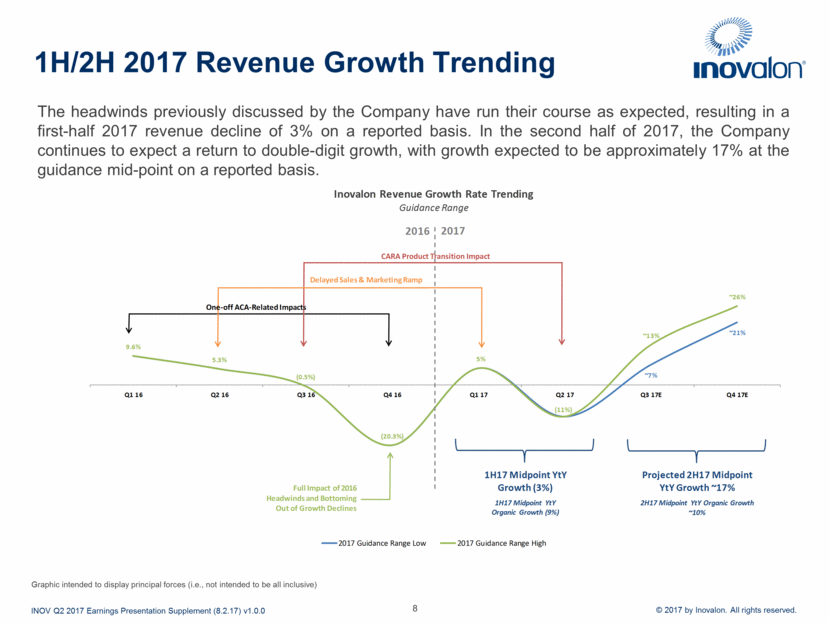
8 The headwinds previously discussed by the Company have run their course as expected, resulting in a first-half 2017 revenue decline of 3% on a reported basis. In the second half of 2017, the Company continues to expect a return to double-digit growth, with growth expected to be approximately 17% at the guidance mid-point on a reported basis. 1H/2H 2017 Revenue Growth Trending Graphic intended to display principal forces (i.e., not intended to be all inclusive) INOV Q2 2017 Earnings Presentation Supplement (8.2.17) v1.0.0 115.5 ~7% ~21% 9.6% 5.3% (0.5%) (20.3%) 5% (11%) ~13% ~26% Q1 16 Q2 16 Q3 16 Q4 16 Q1 17 Q2 17 Q3 17E Q4 17E 2017 Guidance Range Low 2017 Guidance Range High Projected 2H17 Midpoint YtY Growth ~17% 2H17 Midpoint YtY Organic Growth ~10% 1H17 Midpoint YtY Growth (3%) 1H17 Midpoint YtY Organic Growth (9%) CARA Product Transition Impact Delayed Sales & Marketing Ramp One - off ACA - Related Impacts Inovalon Revenue Growth Rate Trending Guidance Range 2016 2017 Full Impact of 2016 Headwinds and Bottoming Out of Growth Declines
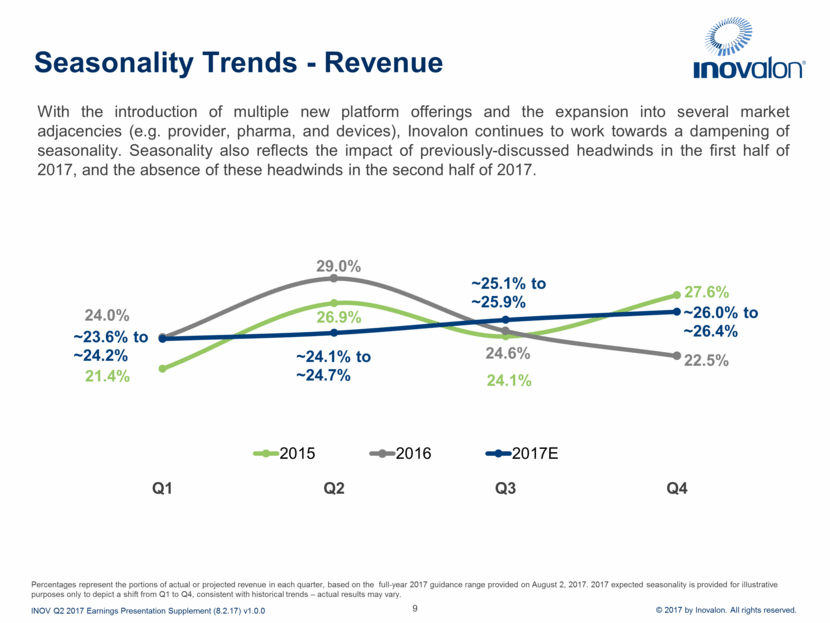
Seasonality Trends - Revenue With the introduction of multiple new platform offerings and the expansion into several market adjacencies (e.g. provider, pharma, and devices), Inovalon continues to work towards a dampening of seasonality. Seasonality also reflects the impact of previously-discussed headwinds in the first half of 2017, and the absence of these headwinds in the second half of 2017. 9 INOV Q2 2017 Earnings Presentation Supplement (8.2.17) v1.0.0 Percentages represent the portions of actual or projected revenue in each quarter, based on the full-year 2017 guidance range provided on August 2, 2017. 2017 expected seasonality is provided for illustrative purposes only to depict a shift from Q1 to Q4, consistent with historical trends – actual results may vary. 21.4% 26.9% 24.1% 27.6% 24.0% 29.0% 24.6% 22.5% ~23.6% to ~24.2% ~24.1% to ~24.7% ~25.1% to ~25.9% ~26.0% to ~26.4% Q1 Q2 Q3 Q4 2015 2016 2017E
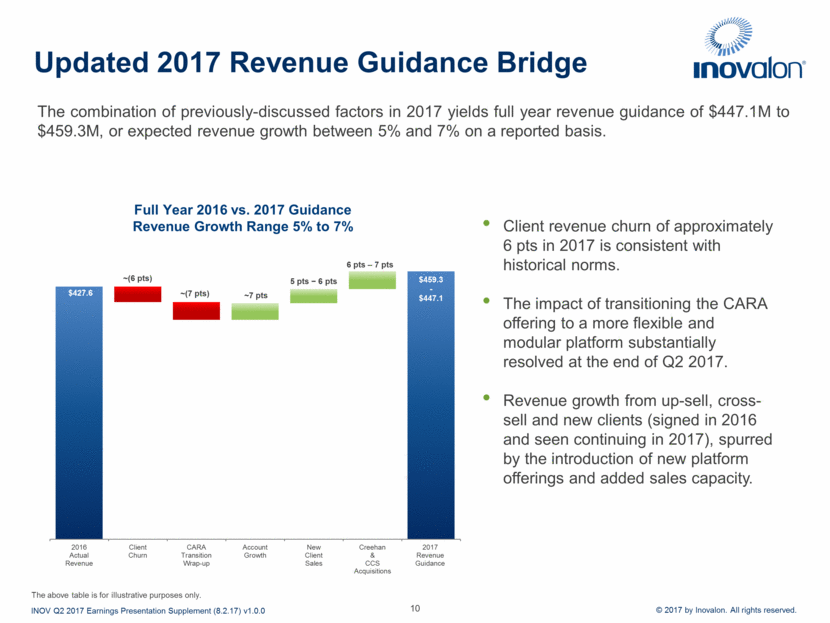
Updated 2017 Revenue Guidance Bridge The combination of previously-discussed factors in 2017 yields full year revenue guidance of $447.1M to $459.3M, or expected revenue growth between 5% and 7% on a reported basis. 10 Client revenue churn of approximately 6 pts in 2017 is consistent with historical norms. The impact of transitioning the CARA offering to a more flexible and modular platform substantially resolved at the end of Q2 2017. Revenue growth from up-sell, cross-sell and new clients (signed in 2016 and seen continuing in 2017), spurred by the introduction of new platform offerings and added sales capacity. Full Year 2016 vs. 2017 Guidance Revenue Growth Range 5% to 7% INOV Q2 2017 Earnings Presentation Supplement (8.2.17) v1.0.0 The above table is for illustrative purposes only. $427.6 ~(6 pts) ~(7 pts) ~7 pts 5 pts ? 6 pts 6 pts – 7 pts $459.3 - $447.1 2016 Actual Revenue Client Churn CARA Transition Wrap-up Account Growth New Client Sales Creehan & CCS Acquisitions 2017 Revenue Guidance
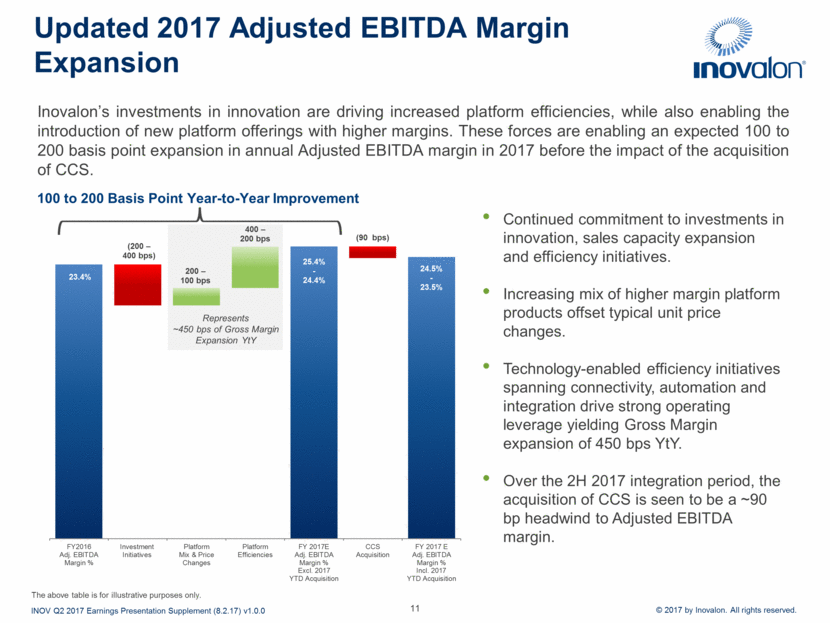
Updated 2017 Adjusted EBITDA Margin Expansion Inovalon’s investments in innovation are driving increased platform efficiencies, while also enabling the introduction of new platform offerings with higher margins. These forces are enabling an expected 100 to 200 basis point expansion in annual Adjusted EBITDA margin in 2017 before the impact of the acquisition of CCS. 11 Continued commitment to investments in innovation, sales capacity expansion and efficiency initiatives. Increasing mix of higher margin platform products offset typical unit price changes. Technology-enabled efficiency initiatives spanning connectivity, automation and integration drive strong operating leverage yielding Gross Margin expansion of 450 bps YtY. Over the 2H 2017 integration period, the acquisition of CCS is seen to be a ~90 bp headwind to Adjusted EBITDA margin. Represents ~450 bps of Gross Margin Expansion YtY INOV Q2 2017 Earnings Presentation Supplement (8.2.17) v1.0.0 The above table is for illustrative purposes only. 100 to 200 Basis Point Year-to-Year Improvement 25.4% - 24.4% 24.5% - 23.5% 200 – 100 bps (90 bps) (200 – 400 bps) 400 – 200 bps 23.4% FY2016 Adj. EBITDA Margin % Investment Initiatives Platform Mix & Price Changes Platform Efficiencies FY 2017E Adj. EBITDA Margin % Excl. 2017 YTD Acquisition CCS Acquisition FY 2017 E Adj. EBITDA Margin % Incl. 2017 YTD Acquisition
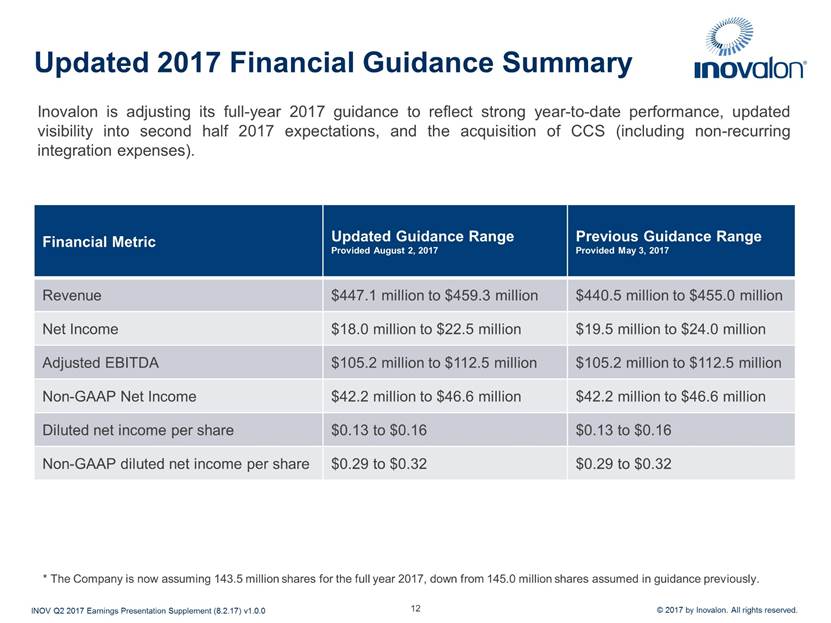
Updated 2017 Financial Guidance Summary Inovalon is adjusting its full-year 2017 guidance to reflect strong year-to-date performance, updated visibility into second half 2017 expectations, and the acquisition of CCS (including non-recurring integration expenses). 12 INOV Q2 2017 Earnings Presentation Supplement (8.2.17) v1.0.0 Financial Metric Updated Guidance Range Provided August 2, 2017 Previous Guidance Range Provided May 3, 2017 Revenue $447.1 million to $459.3 million $440.5 million to $455.0 million Net Income $18.0 million to $22.5 million $19.5 million to $24.0 million Adjusted EBITDA $105.2 million to $112.5 million $105.2 million to $112.5 million Non-GAAP Net Income $42.2 million to $46.6 million $42.2 million to $46.6 million Diluted net income per share $0.13 to $0.16 $0.13 to $0.16 Non-GAAP diluted net income per share $0.29 to $0.32 $0.29 to $0.32 * The Company is now assuming 143.5 million shares for the full year 2017, down from 145.0 million shares assumed in guidance previously.
Appendix

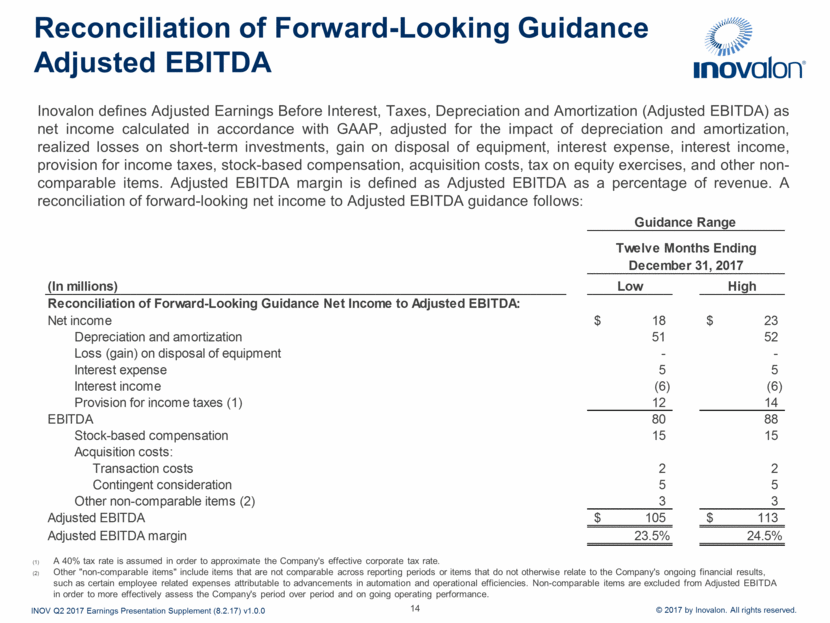
14 Inovalon defines Adjusted Earnings Before Interest, Taxes, Depreciation and Amortization (Adjusted EBITDA) as net income calculated in accordance with GAAP, adjusted for the impact of depreciation and amortization, realized losses on short-term investments, gain on disposal of equipment, interest expense, interest income, provision for income taxes, stock-based compensation, acquisition costs, tax on equity exercises, and other non-comparable items. Adjusted EBITDA margin is defined as Adjusted EBITDA as a percentage of revenue. A reconciliation of forward-looking net income to Adjusted EBITDA guidance follows: Reconciliation of Forward-Looking Guidance Adjusted EBITDA A 40% tax rate is assumed in order to approximate the Company's effective corporate tax rate. Other "non-comparable items" include items that are not comparable across reporting periods or items that do not otherwise relate to the Company's ongoing financial results, such as certain employee related expenses attributable to advancements in automation and operational efficiencies. Non-comparable items are excluded from Adjusted EBITDA in order to more effectively assess the Company's period over period and on going operating performance. INOV Q2 2017 Earnings Presentation Supplement (8.2.17) v1.0.0 (In millions) Low High Reconciliation of Forward-Looking Guidance Net Income to Adjusted EBITDA: Net income 18 $ 23 $ Depreciation and amortization 51 52 Loss (gain) on disposal of equipment - - Interest expense 5 5 Interest income (6) (6) Provision for income taxes (1) 12 14 EBITDA 80 88 Stock-based compensation 15 15 Acquisition costs: Transaction costs 2 2 Contingent consideration 5 5 Other non-comparable items (2) 3 3 Adjusted EBITDA 105 $ 113 $ Adjusted EBITDA margin 23.5% 24.5% Twelve Months Ending December 31, 2017 Guidance Range
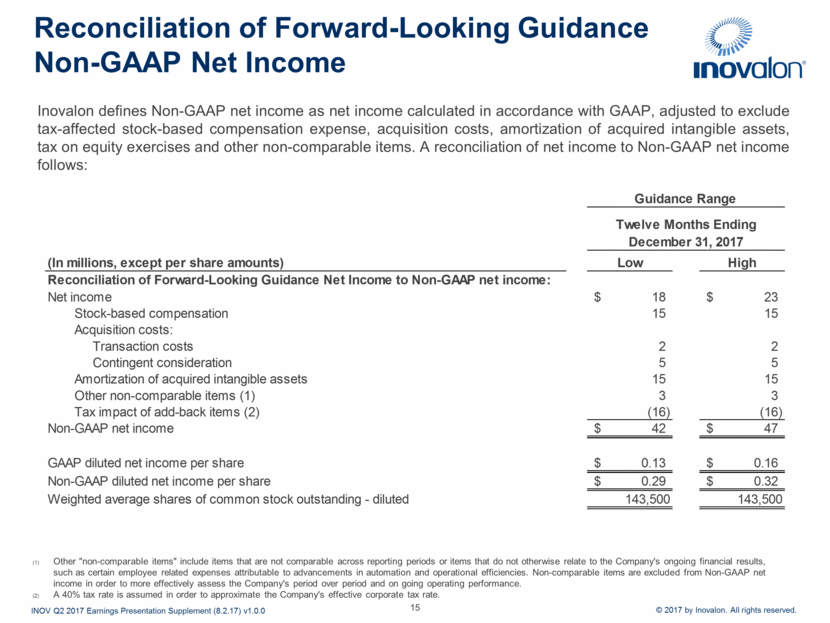
15 Inovalon defines Non-GAAP net income as net income calculated in accordance with GAAP, adjusted to exclude tax-affected stock-based compensation expense, acquisition costs, amortization of acquired intangible assets, tax on equity exercises and other non-comparable items. A reconciliation of net income to Non-GAAP net income follows: Reconciliation of Forward-Looking Guidance Non-GAAP Net Income Other "non-comparable items" include items that are not comparable across reporting periods or items that do not otherwise relate to the Company's ongoing financial results, such as certain employee related expenses attributable to advancements in automation and operational efficiencies. Non-comparable items are excluded from Non-GAAP net income in order to more effectively assess the Company's period over period and on going operating performance. A 40% tax rate is assumed in order to approximate the Company's effective corporate tax rate. INOV Q2 2017 Earnings Presentation Supplement (8.2.17) v1.0.0 (In millions, except per share amounts) Low High Reconciliation of Forward-Looking Guidance Net Income to Non-GAAP net income: Net income 18 $ 23 $ Stock-based compensation 15 15 Acquisition costs: Transaction costs 2 2 Contingent consideration 5 5 Amortization of acquired intangible assets 15 15 Other non-comparable items (1) 3 3 Tax impact of add-back items (2) (16) (16) Non-GAAP net income 42 $ 47 $ GAAP diluted net income per share 0.13 $ 0.16 $ Non-GAAP diluted net income per share 0.29 $ 0.32 $ Weighted average shares of common stock outstanding - diluted 143,500 143,500 Guidance Range Twelve Months Ending December 31, 2017
[LOGO]