Attached files
| file | filename |
|---|---|
| EX-15 - LETTER RE: UNAUDITED INTERIM FINANCIAL INFORMATION - AVISTA CORP | ava-20170630xex15.htm |
| EX-32 - CERTIFICATION OF CORPORATE OFFICERS - AVISTA CORP | ava-20170630xex32.htm |
| EX-31.2 - CERTIFICATION OF CFO - AVISTA CORP | ava-20170630xex312.htm |
| EX-31.1 - CERTIFICATION OF CEO - AVISTA CORP | ava-20170630xex311.htm |
| EX-12 - COMPUTATION OF RATIO OF EARNINGS TO FIXED CHARGES - AVISTA CORP | ava-20170630xex12.htm |
UNITED STATES
SECURITIES AND EXCHANGE COMMISSION
Washington, D.C. 20549
__________________________________________________________________________________________
Form 10-Q
(Mark One)
x | QUARTERLY REPORT PURSUANT TO SECTION 13 OR 15(d) OF THE SECURITIES EXCHANGE ACT OF 1934 |
FOR THE QUARTERLY PERIOD ENDED June 30, 2017 OR
¨ | TRANSITION REPORT PURSUANT TO SECTION 13 OR 15(d) OF THE SECURITIES EXCHANGE ACT OF 1934 |
FOR THE TRANSITION PERIOD FROM TO
Commission file number 1-3701
__________________________________________________________________________________________
AVISTA CORPORATION |
(Exact name of Registrant as specified in its charter) |
Washington | 91-0462470 | |
(State or other jurisdiction of incorporation or organization) | (I.R.S. Employer Identification No.) | |
1411 East Mission Avenue, Spokane, Washington | 99202-2600 | |
(Address of principal executive offices) | (Zip Code) | |
Registrant’s telephone number, including area code: 509-489-0500
Web site: http://www.avistacorp.com
None |
(Former name, former address and former fiscal year, if changed since last report) |
Indicate by check mark whether the registrant (1) has filed all reports required to be filed by Section 13 or 15(d) of the Securities Exchange Act of 1934 during the preceding 12 months (or for such shorter period that the Registrant was required to file such reports), and (2) has been subject to such filing requirements for the past 90 days: Yes x No ¨
Indicate by check mark whether the registrant has submitted electronically and posted on its corporate Web site, if any, every Interactive Data File required to be submitted and posted pursuant to Rule 405 of Regulation S-T (§232.405 of this chapter) during the preceding 12 months (or for such shorter period that the registrant was required to submit and post such files). Yes x No ¨
Indicate by check mark whether the registrant is a large accelerated filer, an accelerated filer, a non-accelerated filer, smaller reporting company, or an emerging growth company. See the definitions of “large accelerated filer,” “accelerated filer,” “smaller reporting company,” and "emerging growth company" in Rule 12b-2 of the Exchange Act.
Large accelerated filer | x | Accelerated filer | ¨ |
Non-accelerated filer | ¨ (Do not check if a smaller reporting company) | Smaller reporting company | ¨ |
Emerging growth company | ¨ | ||
If an emerging growth company, indicate by check mark if the registrant has elected not to use the extended transition period for complying with any new or revised financial accounting standards provided pursuant to Section 13(a) of the
Exchange Act ¨
Indicate by check mark whether the Registrant is a shell company (as defined in Rule 12b-2 of the Exchange Act): Yes ¨ No x
As of July 31, 2017, 64,411,244 shares of Registrant’s Common Stock, no par value (the only class of common stock), were outstanding.
AVISTA CORPORATION
INDEX
Item No. | Page No. | ||
Item 1. | |||
Item 2. | |||
i
Item 3. | |||
Item 4. | |||
Item 1. | |||
Item 1A. | |||
Item 2. | |||
Item 4. | |||
Item 6. | |||
ii
Forward-Looking Statements
From time to time, we make forward-looking statements such as statements regarding projected or future:
• | financial performance; |
• | cash flows; |
• | capital expenditures; |
• | dividends; |
• | capital structure; |
• | other financial items; |
• | strategic goals and objectives; |
• | business environment; and |
• | plans for operations. |
These statements are based upon underlying assumptions (many of which are based, in turn, upon further assumptions). Such statements are made both in our reports filed under the Securities Exchange Act of 1934, as amended (including this Quarterly Report on Form 10-Q), and elsewhere. Forward-looking statements are all statements except those of historical fact including, without limitation, those that are identified by the use of words that include “will,” “may,” “could,” “should,” “intends,” “plans,” “seeks,” “anticipates,” “estimates,” “expects,” “forecasts,” “projects,” “predicts,” and similar expressions.
Forward-looking statements (including those made in this Quarterly Report on Form 10-Q) are subject to a variety of risks, uncertainties and other factors. Most of these factors are beyond our control and may have a significant effect on our operations, results of operations, financial condition or cash flows, which could cause actual results to differ materially from those anticipated in our statements. Such risks, uncertainties and other factors include, among others:
Financial Risk
• | weather conditions (temperatures, precipitation levels and wind patterns), which affect both energy demand and electric generating capability, including the effect of precipitation and temperature on hydroelectric resources, the effect of wind patterns on wind-generated power, weather-sensitive customer demand, and similar effects on supply and demand in the wholesale energy markets; |
• | our ability to obtain financing through the issuance of debt and/or equity securities, which can be affected by various factors including our credit ratings, interest rates and other capital market conditions and the global economy; |
• | changes in interest rates that affect borrowing costs, our ability to effectively hedge interest rates for anticipated debt issuances, variable interest rate borrowing and the extent to which we recover interest costs through retail rates collected from customers; |
• | changes in actuarial assumptions, interest rates and the actual return on plan assets for our pension and other postretirement benefit plans, which can affect future funding obligations, pension and other postretirement benefit expense and the related liabilities; |
• | deterioration in the creditworthiness of our customers; |
• | the outcome of legal proceedings and other contingencies; |
• | economic conditions in our service areas, including the economy's effects on customer demand for utility services; |
• | declining energy demand related to customer energy efficiency and/or conservation measures; |
• | changes in the long-term global and our utilities' service area climates, which can affect, among other things, customer demand patterns and the volume and timing of streamflows to our hydroelectric resources; |
Utility Regulatory Risk
• | state and federal regulatory decisions or related judicial decisions that affect our ability to recover costs and earn a reasonable return including, but not limited to, disallowance or delay in the recovery of capital investments, operating costs and commodity costs and discretion over allowed return on investment; |
• | possibility that our integrated resource plans for electric and natural gas will not be acknowledged by the state commissions; |
1
Energy Commodity Risk
• | volatility and illiquidity in wholesale energy markets, including the availability of willing buyers and sellers, changes in wholesale energy prices that can affect operating income, cash requirements to purchase electricity and natural gas, value received for wholesale sales, collateral required of us by counterparties in wholesale energy transactions and credit risk to us from such transactions, and the market value of derivative assets and liabilities; |
• | default or nonperformance on the part of any parties from whom we purchase and/or sell capacity or energy; |
• | potential environmental regulations affecting our ability to utilize or resulting in the obsolescence of our power supply resources; |
Operational Risk
• | severe weather or natural disasters, including, but not limited to, avalanches, wind storms, wildfires, earthquakes, snow and ice storms, that can disrupt energy generation, transmission and distribution, as well as the availability and costs of materials, equipment, supplies and support services; |
• | explosions, fires, accidents, mechanical breakdowns or other incidents that may impair assets and may disrupt operations of any of our generation facilities, transmission, and electric and natural gas distribution systems or other operations and may require us to purchase replacement power; |
• | wildfires caused by our electric transmission or distribution systems that may result in public injuries or property damage; |
• | public injuries or damage arising from or allegedly arising from our operations; |
• | blackouts or disruptions of interconnected transmission systems (the regional power grid); |
• | terrorist attacks, cyber attacks or other malicious acts that may disrupt or cause damage to our utility assets or to the national or regional economy in general, including any effects of terrorism, cyber attacks or vandalism that damage or disrupt information technology systems; |
• | work force issues, including changes in collective bargaining unit agreements, strikes, work stoppages, the loss of key executives, availability of workers in a variety of skill areas, and our ability to recruit and retain employees; |
• | increasing costs of insurance, more restrictive coverage terms and our ability to obtain insurance; |
• | delays or changes in construction costs, and/or our ability to obtain required permits and materials for present or prospective facilities; |
• | increasing health care costs and cost of health insurance provided to our employees and retirees; |
• | third party construction of buildings, billboard signs, towers or other structures within our rights of way, or placement of fuel receptacles within close proximity to our transformers or other equipment, including overbuild atop natural gas distribution lines; |
• | the loss of key suppliers for materials or services or disruptions to the supply chain; |
• | adverse impacts to our Alaska operations that could result from an extended outage of its hydroelectric generating resources or their inability to deliver energy, due to their lack of interconnectivity to any other electrical grids and the extensive cost of replacement power (diesel); |
• | changing river regulation at hydroelectric facilities not owned by us, which could impact our hydroelectric facilities downstream; |
Compliance Risk
• | compliance with extensive federal, state and local legislation and regulation, including numerous environmental, health, safety, infrastructure protection, reliability and other laws and regulations that affect our operations and costs; |
• | the ability to comply with the terms of the licenses and permits for our hydroelectric or thermal generating facilities at cost-effective levels; |
Technology Risk
• | cyber attacks on us or our vendors or other potential lapses that result in unauthorized disclosure of private information, which could result in liabilities against us, costs to investigate, remediate and defend, and damage to our reputation; |
2
• | disruption to or breakdowns of information systems, automated controls and other technologies that we rely on for our operations, communications and customer service; |
• | changes in costs that impede our ability to effectively implement new information technology systems or to operate and maintain current production technology; |
• | changes in technologies, possibly making some of the current technology we utilize obsolete or the introduction of new technology that may create new cyber security risk; |
• | insufficient technology skills, which could lead to the inability to develop, modify or maintain our information systems; |
Strategic Risk
• | growth or decline of our customer base and the extent to which new uses for our services may materialize or existing uses may decline, including, but not limited to, the effect of the trend toward distributed generation at customer sites; |
• | the potential effects of negative publicity regarding business practices, whether true or not, which could result in litigation or a decline in our common stock price; |
• | changes in our strategic business plans, which may be affected by any or all of the foregoing, including the entry into new businesses and/or the exit from existing businesses and the extent of our business development efforts where potential future business is uncertain; |
• | non-regulated activities may increase earnings volatility; |
• | failure to complete the proposed merger transaction could negatively impact the market price of Avista Corp.'s common stock or result in termination fees that could have a material adverse effect on our results of operations, financial condition, and cash flows; |
• | the announced merger transaction could result in shareholder class action lawsuits against the Company, its management team and board of directors; |
External Mandates Risk
• | changes in environmental laws, regulations, decisions and policies, including present and potential environmental remediation costs and our compliance with these matters; |
• | the potential effects of legislation or administrative rulemaking at the federal, state or local levels, including possible effects on our generating resources of restrictions on greenhouse gas emissions to mitigate concerns over global climate changes; |
• | political pressures or regulatory practices that could constrain or place additional cost burdens on our distribution systems through accelerated adoption of distributed generation or electric-powered transportation or on our energy supply sources, such as campaigns to halt coal-fired power generation and opposition to other thermal generation, wind turbines or hydroelectric facilities; |
• | wholesale and retail competition including alternative energy sources, growth in customer-owned power resource technologies that displace utility-supplied energy or that may be sold back to the utility, and alternative energy suppliers and delivery arrangements; |
• | failure to identify changes in legislation, taxation and regulatory issues which are detrimental or beneficial to our overall business; |
• | policy and/or legislative changes resulting from the new presidential administration in various regulated areas, including, but not limited to, potential tax reform, environmental regulation and healthcare regulations; and |
• | the risk of municipalization in any of our service territories. |
Our expectations, beliefs and projections are expressed in good faith. We believe they are reasonable based on, without limitation, an examination of historical operating trends, our records and other information available from third parties. There can be no assurance that our expectations, beliefs or projections will be achieved or accomplished. Furthermore, any forward-looking statement speaks only as of the date on which such statement is made. We undertake no obligation to update any forward-looking statement or statements to reflect events or circumstances that occur after the date on which such statement is made or to reflect the occurrence of unanticipated events. New risks, uncertainties and other factors emerge from time to time, and it is not possible for us to predict all such factors, nor can we assess the effect of each such factor on our business or the
3
extent that any such factor or combination of factors may cause actual results to differ materially from those contained in any forward-looking statement.
Available Information
Our website address is www.avistacorp.com. We make annual, quarterly and current reports available at our website as soon as practicable after electronically filing these reports with the U.S. Securities and Exchange Commission. Information contained on our website is not part of this report.
4
PART I. Financial Information
Item 1. Condensed Consolidated Financial Statements
CONDENSED CONSOLIDATED STATEMENTS OF INCOME
Avista Corporation |
Dollars in thousands, except per share amounts
(Unaudited)
Three months ended June 30, | Six months ended June 30, | ||||||||||||||
2017 | 2016 | 2017 | 2016 | ||||||||||||
Operating Revenues: | |||||||||||||||
Utility revenues | $ | 308,729 | $ | 312,888 | $ | 739,266 | $ | 725,681 | |||||||
Non-utility revenues | 5,772 | 5,950 | 11,705 | 11,330 | |||||||||||
Total operating revenues | 314,501 | 318,838 | 750,971 | 737,011 | |||||||||||
Operating Expenses: | |||||||||||||||
Utility operating expenses: | |||||||||||||||
Resource costs | 102,751 | 109,815 | 268,337 | 271,534 | |||||||||||
Other operating expenses | 81,965 | 78,666 | 156,449 | 154,445 | |||||||||||
Depreciation and amortization | 42,643 | 39,678 | 84,628 | 78,870 | |||||||||||
Taxes other than income taxes | 23,802 | 22,615 | 56,464 | 52,000 | |||||||||||
Non-utility operating expenses: | |||||||||||||||
Other operating expenses | 7,086 | 6,281 | 13,265 | 12,106 | |||||||||||
Depreciation and amortization | 157 | 192 | 345 | 380 | |||||||||||
Total operating expenses | 258,404 | 257,247 | 579,488 | 569,335 | |||||||||||
Income from operations | 56,097 | 61,591 | 171,483 | 167,676 | |||||||||||
Interest expense | 23,670 | 21,318 | 47,215 | 42,591 | |||||||||||
Interest expense to affiliated trusts | 200 | 154 | 385 | 292 | |||||||||||
Capitalized interest | (890 | ) | (837 | ) | (1,614 | ) | (1,751 | ) | |||||||
Other income-net | (1,656 | ) | (3,041 | ) | (4,757 | ) | (5,463 | ) | |||||||
Income before income taxes | 34,773 | 43,997 | 130,254 | 132,007 | |||||||||||
Income tax expense | 13,051 | 16,710 | 46,395 | 47,055 | |||||||||||
Net income | 21,722 | 27,287 | 83,859 | 84,952 | |||||||||||
Net loss (income) attributable to noncontrolling interests | 49 | (33 | ) | 28 | (49 | ) | |||||||||
Net income attributable to Avista Corp. shareholders | $ | 21,771 | $ | 27,254 | $ | 83,887 | $ | 84,903 | |||||||
Weighted-average common shares outstanding (thousands), basic | 64,401 | 63,386 | 64,382 | 62,995 | |||||||||||
Weighted-average common shares outstanding (thousands), diluted | 64,553 | 63,783 | 64,511 | 63,368 | |||||||||||
Earnings per common share attributable to Avista Corp. shareholders: | |||||||||||||||
Basic | $ | 0.34 | $ | 0.43 | $ | 1.30 | $ | 1.35 | |||||||
Diluted | $ | 0.34 | $ | 0.43 | $ | 1.30 | $ | 1.34 | |||||||
Dividends declared per common share | $ | 0.3575 | $ | 0.3425 | $ | 0.7150 | $ | 0.6850 | |||||||
The Accompanying Notes are an Integral Part of These Statements.
5
CONDENSED CONSOLIDATED STATEMENTS OF COMPREHENSIVE INCOME
Avista Corporation |
Dollars in thousands
(Unaudited)
Three months ended June 30, | Six months ended June 30, | ||||||||||||||
2017 | 2016 | 2017 | 2016 | ||||||||||||
Net income | $ | 21,722 | $ | 27,287 | $ | 83,859 | $ | 84,952 | |||||||
Other Comprehensive Income (Loss): | |||||||||||||||
Change in unfunded benefit obligation for pension and other postretirement benefit plans - net of taxes of $99, $76, $197 and $(587) respectively | 183 | 140 | 366 | (1,089 | ) | ||||||||||
Total other comprehensive income (loss) | 183 | 140 | 366 | (1,089 | ) | ||||||||||
Comprehensive income | 21,905 | 27,427 | 84,225 | 83,863 | |||||||||||
Comprehensive loss (income) attributable to noncontrolling interests | 49 | (33 | ) | 28 | (49 | ) | |||||||||
Comprehensive income attributable to Avista Corporation shareholders | $ | 21,954 | $ | 27,394 | $ | 84,253 | $ | 83,814 | |||||||
The Accompanying Notes are an Integral Part of These Statements.
6
CONDENSED CONSOLIDATED BALANCE SHEETS
Avista Corporation |
Dollars in thousands
(Unaudited)
June 30, | December 31, | ||||||
2017 | 2016 | ||||||
Assets: | |||||||
Current Assets: | |||||||
Cash and cash equivalents | $ | 13,410 | $ | 8,507 | |||
Accounts and notes receivable-less allowances of $5,607 and $5,026, respectively | 133,946 | 180,265 | |||||
Regulatory asset for energy commodity derivatives | 13,982 | 11,365 | |||||
Materials and supplies, fuel stock and stored natural gas | 61,187 | 53,314 | |||||
Income taxes receivable | 35,808 | 48,265 | |||||
Other current assets | 62,403 | 49,625 | |||||
Total current assets | 320,736 | 351,341 | |||||
Net Utility Property: | |||||||
Utility plant in service | 5,617,233 | 5,506,499 | |||||
Construction work in progress | 169,000 | 150,474 | |||||
Total | 5,786,233 | 5,656,973 | |||||
Less: Accumulated depreciation and amortization | 1,558,773 | 1,509,473 | |||||
Total net utility property | 4,227,460 | 4,147,500 | |||||
Other Non-current Assets: | |||||||
Investment in affiliated trusts | 11,547 | 11,547 | |||||
Goodwill | 57,672 | 57,672 | |||||
Other property and investments-net and other non-current assets | 79,487 | 72,224 | |||||
Total other non-current assets | 148,706 | 141,443 | |||||
Deferred Charges: | |||||||
Regulatory assets for deferred income tax | 118,984 | 109,853 | |||||
Regulatory assets for pensions and other postretirement benefits | 234,046 | 240,114 | |||||
Other regulatory assets | 134,533 | 135,751 | |||||
Regulatory asset for interest rate swaps | 168,084 | 161,508 | |||||
Non-current regulatory asset for energy commodity derivatives | 15,023 | 16,919 | |||||
Other deferred charges | 5,432 | 5,326 | |||||
Total deferred charges | 676,102 | 669,471 | |||||
Total assets | $ | 5,373,004 | $ | 5,309,755 | |||
The Accompanying Notes are an Integral Part of These Statements.
7
CONDENSED CONSOLIDATED BALANCE SHEETS (continued)
Avista Corporation |
Dollars in thousands
(Unaudited)
June 30, | December 31, | ||||||
2017 | 2016 | ||||||
Liabilities and Equity: | |||||||
Current Liabilities: | |||||||
Accounts payable | $ | 69,165 | $ | 115,545 | |||
Current portion of long-term debt and capital leases | 277,814 | 3,287 | |||||
Short-term borrowings | 136,398 | 120,000 | |||||
Energy commodity derivative liabilities | 8,308 | 7,035 | |||||
Accrued interest | 16,128 | 15,869 | |||||
Accrued taxes other than income taxes | 33,169 | 33,374 | |||||
Deferred natural gas costs | 28,973 | 30,820 | |||||
Current portion of pensions and other postretirement benefits | 11,235 | 10,994 | |||||
Current interest rate swap derivative liabilities | 36,507 | 6,025 | |||||
Other current liabilities | 64,417 | 64,579 | |||||
Total current liabilities | 682,114 | 407,528 | |||||
Long-term debt and capital leases | 1,403,064 | 1,678,717 | |||||
Long-term debt to affiliated trusts | 51,547 | 51,547 | |||||
Regulatory liability for utility plant retirement costs | 280,580 | 273,983 | |||||
Pensions and other postretirement benefits | 219,584 | 226,552 | |||||
Deferred income taxes | 886,727 | 840,928 | |||||
Non-current interest rate swap derivative liabilities | 336 | 28,705 | |||||
Other non-current liabilities, regulatory liabilities and deferred credits | 162,158 | 153,319 | |||||
Total liabilities | 3,686,110 | 3,661,279 | |||||
Commitments and Contingencies (See Notes to Condensed Consolidated Financial Statements) | |||||||
Equity: | |||||||
Avista Corporation Shareholders’ Equity: | |||||||
Common stock, no par value; 200,000,000 shares authorized; 64,408,983 and 64,187,934 shares issued and outstanding as of June 30, 2017 and December 31, 2016, respectively | 1,075,667 | 1,075,281 | |||||
Accumulated other comprehensive loss | (7,202 | ) | (7,568 | ) | |||
Retained earnings | 618,708 | 581,014 | |||||
Total Avista Corporation shareholders’ equity | 1,687,173 | 1,648,727 | |||||
Noncontrolling Interests | (279 | ) | (251 | ) | |||
Total equity | 1,686,894 | 1,648,476 | |||||
Total liabilities and equity | $ | 5,373,004 | $ | 5,309,755 | |||
The Accompanying Notes are an Integral Part of These Statements.
8
CONDENSED CONSOLIDATED STATEMENTS OF CASH FLOWS
Avista Corporation |
For the Six Months Ended June 30
Dollars in thousands
(Unaudited)
2017 | 2016 | ||||||
Operating Activities: | |||||||
Net income | $ | 83,859 | $ | 84,952 | |||
Non-cash items included in net income: | |||||||
Depreciation and amortization | 86,790 | 81,071 | |||||
Deferred income tax provision and investment tax credits | 36,169 | 56,652 | |||||
Power and natural gas cost amortizations, net | 6,366 | 9,958 | |||||
Amortization of debt expense | 1,627 | 1,742 | |||||
Amortization of investment in exchange power | 1,225 | 1,225 | |||||
Stock-based compensation expense | 2,643 | 4,236 | |||||
Equity-related Allowance for Funds Used During Construction (AFUDC) | (3,292 | ) | (4,368 | ) | |||
Pension and other postretirement benefit expense | 18,539 | 19,315 | |||||
Amortization of Spokane Energy contract | — | 7,192 | |||||
Other regulatory assets and liabilities and deferred debits and credits | (8,831 | ) | (13,169 | ) | |||
Change in decoupling regulatory deferral | 10,365 | (24,787 | ) | ||||
Other | 420 | 5,032 | |||||
Contributions to defined benefit pension plan | (14,800 | ) | (8,000 | ) | |||
Changes in certain current assets and liabilities: | |||||||
Accounts and notes receivable | 45,375 | 50,062 | |||||
Materials and supplies, fuel stock and stored natural gas | (7,879 | ) | 2,510 | ||||
Collateral posted for derivative instruments | (5,460 | ) | (83,499 | ) | |||
Income taxes receivable | 12,457 | (1,450 | ) | ||||
Other current assets | (3,825 | ) | (4,436 | ) | |||
Accounts payable | (29,435 | ) | (31,484 | ) | |||
Other current liabilities | (3,787 | ) | 3,197 | ||||
Net cash provided by operating activities | 228,526 | 155,951 | |||||
Investing Activities: | |||||||
Utility property capital expenditures (excluding equity-related AFUDC) | (177,714 | ) | (182,815 | ) | |||
Issuance of notes receivable at subsidiaries | (2,500 | ) | (9,668 | ) | |||
Equity and property investments made by subsidiaries | (10,347 | ) | (6,988 | ) | |||
Distributions received from investments | 1,915 | — | |||||
Other | (943 | ) | (7,153 | ) | |||
Net cash used in investing activities | (189,589 | ) | (206,624 | ) | |||
The Accompanying Notes are an Integral Part of These Statements.
9
CONDENSED CONSOLIDATED STATEMENTS OF CASH FLOWS (continued)
Avista Corporation |
For the Six Months Ended June 30
Dollars in thousands
(Unaudited)
2017 | 2016 | ||||||
Financing Activities: | |||||||
Net increase in short-term borrowings | $ | 16,000 | $ | 55,000 | |||
Maturity of long-term debt and capital leases | (1,643 | ) | (1,583 | ) | |||
Issuance of common stock, net of issuance costs | 1,247 | 47,173 | |||||
Cash dividends paid | (46,193 | ) | (43,267 | ) | |||
Other | (3,445 | ) | (3,612 | ) | |||
Net cash provided by (used in) financing activities | (34,034 | ) | 53,711 | ||||
Net increase in cash and cash equivalents | 4,903 | 3,038 | |||||
Cash and cash equivalents at beginning of period | 8,507 | 10,484 | |||||
Cash and cash equivalents at end of period | $ | 13,410 | $ | 13,522 | |||
The Accompanying Notes are an Integral Part of These Statements.
10
CONDENSED CONSOLIDATED STATEMENTS OF EQUITY
Avista Corporation |
For the Six Months Ended June 30
Dollars in thousands
(Unaudited)
2017 | 2016 | ||||||
Common Stock, Shares: | |||||||
Shares outstanding at beginning of period | 64,187,934 | 62,312,651 | |||||
Shares issued | 221,049 | 1,391,644 | |||||
Shares outstanding at end of period | 64,408,983 | 63,704,295 | |||||
Common Stock, Amount: | |||||||
Balance at beginning of period | $ | 1,075,281 | $ | 1,004,336 | |||
Equity compensation expense | 2,559 | 3,708 | |||||
Issuance of common stock, net of issuance costs | 1,247 | 47,173 | |||||
Payment of minimum tax withholdings for share-based payment awards | (3,420 | ) | (3,027 | ) | |||
Balance at end of period | 1,075,667 | 1,052,190 | |||||
Accumulated Other Comprehensive Loss: | |||||||
Balance at beginning of period | (7,568 | ) | (6,650 | ) | |||
Other comprehensive income (loss) | 366 | (1,089 | ) | ||||
Balance at end of period | (7,202 | ) | (7,739 | ) | |||
Retained Earnings: | |||||||
Balance at beginning of period | 581,014 | 530,940 | |||||
Net income attributable to Avista Corporation shareholders | 83,887 | 84,903 | |||||
Cash dividends paid on common stock | (46,193 | ) | (43,267 | ) | |||
Balance at end of period | 618,708 | 572,576 | |||||
Total Avista Corporation shareholders’ equity | 1,687,173 | 1,617,027 | |||||
Noncontrolling Interests: | |||||||
Balance at beginning of period | (251 | ) | (339 | ) | |||
Net income (loss) attributable to noncontrolling interests | (28 | ) | 49 | ||||
Balance at end of period | (279 | ) | (290 | ) | |||
Total equity | $ | 1,686,894 | $ | 1,616,737 | |||
The Accompanying Notes are an Integral Part of These Statements.
11
NOTES TO CONDENSED CONSOLIDATED FINANCIAL STATEMENTS (Unaudited) |
The accompanying condensed consolidated financial statements of Avista Corporation (Avista Corp. or the Company) as of and for the interim periods ended June 30, 2017 and June 30, 2016 are unaudited; however, in the opinion of management, the statements reflect all adjustments necessary for a fair statement of the results for the interim periods. All such adjustments are of a normal recurring nature. The condensed consolidated financial statements have been prepared in accordance with accounting principles generally accepted in the United States of America (GAAP) for interim financial information and with the instructions to Form 10-Q and Rule 10-01 of Regulation S-X. The Condensed Consolidated Statements of Income for the interim periods are not necessarily indicative of the results to be expected for the full year. These condensed consolidated financial statements do not contain the detail or footnote disclosure concerning accounting policies and other matters which would be included in full fiscal year consolidated financial statements; therefore, they should be read in conjunction with the Company's audited consolidated financial statements included in the Company's Annual Report on Form 10-K for the year ended December 31, 2016 (2016 Form 10-K). Please refer to the section “Acronyms and Terms” in the 2016 Form 10-K for definitions of certain terms not defined herein. The acronyms and terms are an integral part of these condensed consolidated financial statements.
NOTE 1. SUMMARY OF SIGNIFICANT ACCOUNTING POLICIES
Nature of Business
Avista Corp. is primarily an electric and natural gas utility with certain other business ventures. Avista Utilities is an operating division of Avista Corp., comprising the regulated utility operations in the Pacific Northwest. Avista Utilities provides electric distribution and transmission, and natural gas distribution services in parts of eastern Washington and northern Idaho. Avista Utilities also provides natural gas distribution service in parts of northeastern and southwestern Oregon. Avista Utilities has electric generating facilities in Washington, Idaho, Oregon and Montana. Avista Utilities also supplies electricity to a small number of customers in Montana, most of whom are employees who operate Avista Utilities' Noxon Rapids generating facility.
Alaska Energy and Resources Company (AERC) is a wholly-owned subsidiary of Avista Corp. The primary subsidiary of AERC is Alaska Electric Light and Power Company (AEL&P), which comprises Avista Corp.'s regulated utility operations in Alaska. Avista Capital, Inc. (Avista Capital), a wholly owned non-regulated subsidiary of Avista Corp., is the parent company of all of the subsidiary companies in the non-utility businesses, with the exception of AJT Mining Properties, Inc., which is a subsidiary of AERC.
Basis of Reporting
The condensed consolidated financial statements include the assets, liabilities, revenues and expenses of the Company and its subsidiaries and other majority owned subsidiaries and variable interest entities for which the Company or its subsidiaries are the primary beneficiaries. Intercompany balances were eliminated in consolidation. The accompanying condensed consolidated financial statements include the Company’s proportionate share of utility plant and related operations resulting from its interests in jointly owned plants.
Taxes Other Than Income Taxes
Taxes other than income taxes include state excise taxes, city occupational and franchise taxes, real and personal property taxes and certain other taxes not based on income. These taxes are generally based on revenues or the value of property. Utility related taxes collected from customers (primarily state excise taxes and city utility taxes) are recorded as operating revenue and expense. Taxes other than income taxes consisted of the following items for the three and six months ended June 30 (dollars in thousands):
Three months ended June 30, | Six months ended June 30, | ||||||||||||||
2017 | 2016 | 2017 | 2016 | ||||||||||||
Utility related taxes | $ | 13,552 | $ | 12,573 | $ | 35,136 | $ | 30,938 | |||||||
Property taxes | 9,432 | 9,290 | 19,838 | 19,710 | |||||||||||
Other taxes | 818 | 752 | 1,490 | 1,352 | |||||||||||
Total | $ | 23,802 | $ | 22,615 | $ | 56,464 | $ | 52,000 | |||||||
12
Materials and Supplies, Fuel Stock and Stored Natural Gas
Inventories of materials and supplies, fuel stock and stored natural gas are recorded at average cost for our regulated operations and the lower of cost or net realizable value for our non-regulated operations and consisted of the following as of June 30, 2017 and December 31, 2016 (dollars in thousands):
June 30, | December 31, | ||||||
2017 | 2016 | ||||||
Materials and supplies | $ | 41,492 | $ | 40,700 | |||
Fuel stock | 5,921 | 4,585 | |||||
Stored natural gas | 13,774 | 8,029 | |||||
Total | $ | 61,187 | $ | 53,314 | |||
Derivative Assets and Liabilities
Derivatives are recorded as either assets or liabilities on the Condensed Consolidated Balance Sheets measured at estimated fair value.
The Washington Utilities and Transportation Commission (UTC) and the Idaho Public Utilities Commission (IPUC) issued accounting orders authorizing Avista Corp. to offset energy commodity derivative assets or liabilities with a regulatory asset or liability. This accounting treatment is intended to defer the recognition of mark-to-market gains and losses on energy commodity transactions until the period of delivery. Realized benefits and costs result in adjustments to retail rates through purchased gas cost adjustments, the Energy Recovery Mechanism (ERM) in Washington, the Power Cost Adjustment (PCA) mechanism in Idaho, and periodic general rate cases. The resulting regulatory assets have been concluded to be probable of recovery through future rates.
Substantially all forward contracts to purchase or sell power and natural gas are recorded as derivative assets or liabilities at estimated fair value with an offsetting regulatory asset or liability. Contracts that are not considered derivatives are accounted for on the accrual basis until they are settled or realized unless there is a decline in the fair value of the contract that is determined to be other-than-temporary.
For interest rate swap derivatives, Avista Corp. records all mark-to-market gains and losses in each accounting period as assets and liabilities, as well as offsetting regulatory assets and liabilities, such that there is no income statement impact. The interest rate swap derivatives are risk management tools similar to energy commodity derivatives. Upon settlement of interest rate swap derivatives, the regulatory asset or liability is amortized as a component of interest expense over the term of the associated debt. The Company records an offset of interest rate swap derivative assets and liabilities with regulatory assets and liabilities, based on the prior practice of the commissions to provide recovery through the ratemaking process.
As of June 30, 2017, the Company has multiple master netting agreements with a variety of entities that allow for cross-commodity netting of derivative agreements with the same counterparty (i.e. power derivatives can be netted with natural gas derivatives). In addition, some master netting agreements allow for the netting of commodity derivatives and interest rate swap derivatives for the same counterparty. The Company does not have any agreements which allow for cross-affiliate netting among multiple affiliated legal entities. The Company nets all derivative instruments when allowed by the agreement for presentation in the Condensed Consolidated Balance Sheets.
Fair Value Measurements
Fair value represents the price that would be received when selling an asset or paid to transfer a liability (an exit price) in an orderly transaction between market participants at the measurement date. Energy commodity derivative assets and liabilities, deferred compensation assets, as well as derivatives related to interest rate swaps and foreign currency exchange contracts, are reported at estimated fair value on the Condensed Consolidated Balance Sheets. See Note 8 for the Company’s fair value disclosures.
13
Accumulated Other Comprehensive Loss
Accumulated other comprehensive loss, net of tax, consisted of the following as of June 30, 2017 and December 31, 2016 (dollars in thousands):
June 30, | December 31, | ||||||
2017 | 2016 | ||||||
Unfunded benefit obligation for pensions and other postretirement benefit plans - net of taxes of $3,878 and $4,075, respectively | $ | 7,202 | $ | 7,568 | |||
The following table details the reclassifications out of accumulated other comprehensive loss by component for the three and six months ended June 30 (dollars in thousands).
Amounts Reclassified from Accumulated Other Comprehensive Loss | ||||||||||||||||||
Three months ended June 30, | Six months ended June 30, | |||||||||||||||||
Details about Accumulated Other Comprehensive Loss Components | 2017 | 2016 | 2017 | 2016 | Affected Line Item in Statement of Income | |||||||||||||
Amortization of defined benefit pension items | ||||||||||||||||||
Amortization of net prior service cost | $ | (299 | ) | $ | (311 | ) | $ | (598 | ) | $ | (622 | ) | (a) | |||||
Amortization of net loss | 3,638 | 3,642 | $ | 7,276 | $ | 7,284 | (a) | |||||||||||
Adjustment due to effects of regulation | (3,057 | ) | (3,115 | ) | (6,115 | ) | (8,338 | ) | (a) (b) | |||||||||
282 | 216 | 563 | (1,676 | ) | Total before tax | |||||||||||||
(99 | ) | (76 | ) | (197 | ) | 587 | Tax benefit (expense) | |||||||||||
$ | 183 | $ | 140 | $ | 366 | $ | (1,089 | ) | Net of tax | |||||||||
(a) | These accumulated other comprehensive loss components are included in the computation of net periodic pension cost (see Note 4 for additional details). |
(b) | The adjustment for the effects of regulation during the six months ended June 30, 2016 includes approximately $2.1 million related to the reclassification of a pension regulatory asset associated with one of our jurisdictions into accumulated other comprehensive loss. |
Contingencies
The Company has unresolved regulatory, legal and tax issues which have inherently uncertain outcomes. The Company accrues a loss contingency if it is probable that a liability has been incurred and the amount of the loss or impairment can be reasonably estimated. The Company also discloses loss contingencies that do not meet these conditions for accrual if there is a reasonable possibility that a material loss may be incurred. As of June 30, 2017, the Company has not recorded any significant amounts related to unresolved contingencies. See Note 11 for further discussion of the Company's commitments and contingencies.
NOTE 2. NEW ACCOUNTING STANDARDS
ASU No. 2014-09, “Revenue from Contracts with Customers (Topic 606)”
In May 2014, the FASB issued ASU No. 2014-09, which outlines a single comprehensive model for entities to use in accounting for revenue arising from contracts with customers and supersedes most current revenue recognition guidance, including industry-specific guidance. The core principle of the revenue model is that an entity should identify the various performance obligations in a contract, allocate the transaction price among the performance obligations and recognize revenue when (or as) the entity satisfies each performance obligation. This ASU is effective for periods beginning after December 15, 2017.
The Company has a revenue recognition standard implementation team that is working through implementation issues. The Company has evaluated this standard and is planning to adopt this standard in 2018 upon its effective date. The Company is expecting to use a modified retrospective method of adoption, which would require a cumulative adjustment to opening retained earnings, as opposed to a full retrospective application. Based on work performed to date, the Company has not identified any material cumulative adjustments necessary.
14
Since the majority of Avista Corp.’s revenue is from rate-regulated sales of electricity and natural gas to retail customers and revenue is recognized as energy is delivered to these customers, the Company does not expect a significant change in operating revenues or net income. The Company is in the process of reviewing and analyzing certain contracts with customers (most of which are related to wholesale sales of power and natural gas) and has not yet identified any significant differences in revenue recognition between current GAAP and ASU No. 2014-09.
During the implementation process, the Company has identified several issues, the most significant of which are as follows based on our current assessment:
Contributions in Aid of Construction – There was the potential that contributions in aid of construction (CIAC) could be recognized as revenue upon the adoption of ASU No. 2014-09. Under current GAAP, CIACs are accounted for as an offset to the cost of utility plant in service. Current preliminary implementation guidance indicates that CIACs will continue to be accounted for as an offset to utility plant in service.
Utility-Related Taxes Collected from Customers – There were questions on the presentation of utility related taxes collected from customers (primarily state excise taxes and city utility taxes) on a gross basis. Under current GAAP, the Company is allowed to record these utility related taxes on a gross basis in revenue when billed to customers with an offset included in taxes other than income taxes in operating expenses. The Company evaluated whether this gross presentation is appropriate under ASU 2014-09 and the Company's preliminary assessment indicates that there will be no material changes to current presentation.
Collectibility - There were questions regarding the requirement that collection of a sale be probable and how, or if, utilities should consider bad debt collection mechanisms (riders, base rate adjustments, etc.) in assessing probability of collection on sales to low income customers. Current preliminary implementation guidance indicates that bad debt collection mechanisms should be considered; therefore, the Company does not expect a change to its current presentation going forward.
The Company is monitoring utility industry implementation guidance as it relates to certain issues to determine if there will be an industry consensus regarding accounting and presentation of these items.
In addition to the issues described above, the Company also expects significant changes to its revenue-related footnote disclosures. The Company continues to evaluate what information would be most useful for users of the financial statements, including information already provided elsewhere in the document outside the footnote disclosures. These additional disclosures could include the disaggregation of revenues by geographic location, type of service, source of revenue or customer class. Also, the Company expects enhanced disclosures regarding its revenue recognition policies and elections.
ASU No. 2016-02 “Leases (Topic 842).”
In February 2016, the FASB issued ASU No. 2016-02. This ASU introduces a new lessee model that requires most leases to be capitalized and shown on the balance sheet with corresponding lease assets and liabilities. The standard also aligns certain of the underlying principles of the new lessor model with those in Topic 606, the FASB’s new revenue recognition standard. Furthermore, this ASU addresses other issues that arise under the current lease model; for example, eliminating the required use of bright-line tests in current GAAP for determining lease classification (operating leases versus capital leases). This ASU also includes enhanced disclosures surrounding leases. This ASU is effective for periods beginning on or after December 15, 2018; however, early adoption is permitted. Upon adoption, this ASU must be applied using a modified retrospective approach to the earliest period presented, which will likely require restatements of previously issued financial statements. The modified retrospective approach includes a number of optional practical expedients that entities may elect to apply. The Company evaluated this standard and determined that it will most likely not early adopt this standard before its effective date in 2019. The Company has formed a lease standard implementation team that is working through the implementation process. The most significant implementation challenge identified thus far relates to identifying a complete population of leases and potential leases under the new lease standard. Also, the Company is monitoring utility industry implementation guidance as it relates to several unresolved issues to determine if there will be an industry consensus, including whether right-of-ways are considered leases. The Company has not yet estimated the potential impact on its future financial condition, results of operations and cash flows.
ASU No. 2016-09 “Compensation—Stock Compensation (Topic 718): Improvements to Employee Share-Based Payment Accounting.”
In March 2016, the FASB issued ASU No. 2016-09. This ASU simplified several aspects of the accounting for employee share-based payment transactions including:
15
• | allowing excess tax benefits or tax deficiencies to be recognized as income tax benefits or expenses in the Condensed Consolidated Statements of Income rather than in Additional Paid in Capital (APIC), |
• | excess tax benefits no longer represent a financing cash inflow on the Condensed Consolidated Statements of Cash Flows and instead will be included as an operating activity, |
• | requiring excess tax benefits and tax deficiencies to be excluded from the calculation of diluted earnings per share, whereas under previous accounting guidance, these amounts had to be estimated and included in the calculation, |
• | allowing forfeitures to be accounted for as they occur, instead of estimating forfeitures, and |
• | changing the statutory tax withholding requirements for share-based payments. |
The Company early adopted this standard during the second quarter of 2016, with a retrospective effective date of January 1, 2016. The adoption of this standard resulted in a recognized income tax benefit of $1.6 million in 2016 associated with excess tax benefits on settled share-based employee payments. Because this standard was adopted in the second quarter of 2016, but had a retrospective effective date of January 1, 2016, the effects from the adoption were reflected in the first quarter of 2016 and the Condensed Consolidated Financial Statements for that quarter were recast from those presented when the financial statements were originally issued.
ASU No. 2017-07 “Compensation-Retirement Benefits (Topic 715): Improving the Presentation of Net Periodic Pension Cost and Net Periodic Postretirement Benefit Cost”
In March 2017, the FASB issued ASU No. 2017-07, which amends the income statement presentation of the components of net period benefit cost for an entity’s defined benefit pension and other postretirement plans. Under current GAAP, net benefit cost consists of several components that reflect different aspects of an employer’s financial arrangements as well as the cost of benefits earned by employees. These components are aggregated and reported net in the financial statements. ASU No. 2017-07 requires entities to (1) disaggregate the current service-cost component from the other components of net benefit cost (other components) and present it with other current compensation costs for related employees in the income statement and (2) present the other components elsewhere in the income statement and outside of income from operations.
In addition, only the service-cost component of net benefit cost is eligible for capitalization (e.g., as part of utility plant). This is a change from current practice, under which entities capitalize the aggregate net benefit cost to utility plant when applicable, in accordance with Federal Energy and Regulatory Commission (FERC) accounting guidance. Avista Corp. is a rate-regulated entity and all components of net benefit cost are currently recovered from rate payers as a component of utility plant and under the new ASU these costs will continue to be recovered from rate payers in the same manner over the depreciable lives of utility plant. As all such costs are expected to continue to be recoverable, the components that are no longer eligible to be recorded as a component of plant for GAAP will be recorded as regulatory assets.
This ASU is effective for periods beginning after December 15, 2017 and early adoption is permitted. Upon adoption, entities must use a retrospective transition method to adopt the requirement for separate presentation in the income statement and a prospective transition method to adopt the requirement to limit the capitalization of benefit costs to the service-cost component. The Company does not expect to early adopt this standard and does not expect a material impact on its future financial condition, results of operations or cash flows upon adoption of this standard.
NOTE 3. DERIVATIVES AND RISK MANAGEMENT
The disclosures below in Note 3 apply only to Avista Corp. and its operating division Avista Utilities; AERC and its primary subsidiary AEL&P do not enter into derivative instruments.
Energy Commodity Derivatives
Avista Corp. is exposed to market risks relating to changes in electricity and natural gas commodity prices and certain other fuel prices. Market risk is, in general, the risk of fluctuation in the market price of the commodity being traded and is influenced primarily by supply and demand. Market risk includes the fluctuation in the market price of associated derivative commodity instruments. Avista Corp. utilizes derivative instruments, such as forwards, futures, swap derivatives and options in order to manage the various risks relating to these commodity price exposures. Avista Corp. has an energy resources risk policy and control procedures to manage these risks.
As part of Avista Corp.'s resource procurement and management operations in the electric business, Avista Corp. engages in an ongoing process of resource optimization, which involves the economic selection from available energy resources to serve Avista Corp.'s load obligations and the use of these resources to capture available economic value. Avista Corp. transacts in wholesale markets by selling and purchasing electric capacity and energy, fuel for electric generation, and derivative contracts related to capacity, energy and fuel. Such transactions are part of the process of matching resources with load obligations and hedging a portion of the related financial risks. These transactions range from terms of intra-hour up to multiple years.
16
As part of its resource procurement and management of its natural gas business, Avista Corp. makes continuing projections of its natural gas loads and assesses available natural gas resources including natural gas storage availability. Natural gas resource planning typically includes peak requirements, low and average monthly requirements and delivery constraints from natural gas supply locations to Avista Corp.’s distribution system. However, daily variations in natural gas demand can be significantly different than monthly demand projections. On the basis of these projections, Avista Corp. plans and executes a series of transactions to hedge a portion of its projected natural gas requirements through forward market transactions and derivative instruments. These transactions may extend as much as four natural gas operating years (November through October) into the future. Avista Corp. also leaves a significant portion of its natural gas supply requirements unhedged for purchase in short-term and spot markets.
Avista Corp. plans for sufficient natural gas delivery capacity to serve its retail customers for a theoretical peak day event. Avista Corp. generally has more pipeline and storage capacity than what is needed during periods other than a peak day. Avista Corp. optimizes its natural gas resources by using market opportunities to generate economic value that helps mitigate fixed costs. Avista Corp. also optimizes its natural gas storage capacity by purchasing and storing natural gas when prices are traditionally lower, typically in the summer, and withdrawing during higher priced months, typically during the winter. However, if market conditions and prices indicate that Avista Corp. should buy or sell natural gas at other times during the year, Avista Corp. engages in optimization transactions to capture value in the marketplace. Natural gas optimization activities include, but are not limited to, wholesale market sales of surplus natural gas supplies, purchases and sales of natural gas to optimize use of pipeline and storage capacity, and participation in the transportation capacity release market.
The following table presents the underlying energy commodity derivative volumes as of June 30, 2017 that are expected to be delivered in each respective year (in thousands of MWhs and mmBTUs):
Purchases | Sales | ||||||||||||||||||||||
Electric Derivatives | Gas Derivatives | Electric Derivatives | Gas Derivatives | ||||||||||||||||||||
Year | Physical (1) MWH | Financial (1) MWH | Physical (1) mmBTUs | Financial (1) mmBTUs | Physical (1) MWH | Financial (1) MWH | Physical (1) mmBTUs | Financial (1) mmBTUs | |||||||||||||||
Remainder 2017 | 185 | 999 | 7,418 | 63,423 | 154 | 1,129 | 3,378 | 43,940 | |||||||||||||||
2018 | 397 | 307 | — | 78,488 | 254 | 1,244 | 1,360 | 46,805 | |||||||||||||||
2019 | 235 | 737 | 610 | 42,775 | 158 | 982 | 1,345 | 26,590 | |||||||||||||||
2020 | — | — | 910 | 3,635 | — | — | 1,430 | — | |||||||||||||||
2021 | — | — | — | — | — | — | 1,049 | — | |||||||||||||||
Thereafter | — | — | — | — | — | — | — | — | |||||||||||||||
The following table presents the underlying energy commodity derivative volumes as of December 31, 2016 that are expected to be delivered in each respective year (in thousands of MWhs and mmBTUs):
Purchases | Sales | ||||||||||||||||||||||
Electric Derivatives | Gas Derivatives | Electric Derivatives | Gas Derivatives | ||||||||||||||||||||
Year | Physical (1) MWH | Financial (1) MWH | Physical (1) mmBTUs | Financial (1) mmBTUs | Physical (1) MWH | Financial (1) MWH | Physical (1) mmBTUs | Financial (1) mmBTUs | |||||||||||||||
2017 | 510 | 907 | 15,475 | 110,380 | 316 | 1,552 | 4,165 | 73,110 | |||||||||||||||
2018 | 397 | — | — | 52,755 | 286 | 1,244 | 1,360 | 15,113 | |||||||||||||||
2019 | 235 | — | 610 | 29,475 | 158 | 982 | 1,345 | 4,020 | |||||||||||||||
2020 | — | — | 910 | 2,725 | — | — | 1,430 | — | |||||||||||||||
2021 | — | — | — | — | — | — | 1,060 | — | |||||||||||||||
Thereafter | — | — | — | — | — | — | — | — | |||||||||||||||
(1) | Physical transactions represent commodity transactions in which Avista Corp. will take or make delivery of either electricity or natural gas; financial transactions represent derivative instruments with delivery of cash in the amount of the benefit or cost but with no physical delivery of the commodity, such as futures, swap derivatives, options, or forward contracts. |
The electric and natural gas derivative contracts above will be included in either power supply costs or natural gas supply costs during the period they are delivered and will be included in the various recovery mechanisms (ERM, PCA, and Purchased Gas Adjustments (PGA)), or in the general rate case process, and are expected to be collected through retail rates from customers.
17
Foreign Currency Exchange Derivatives
A significant portion of Avista Corp.’s natural gas supply (including fuel for power generation) is obtained from Canadian sources. Most of those transactions are executed in U.S. dollars, which avoids foreign currency risk. A portion of Avista Corp.’s short-term natural gas transactions and long-term Canadian transportation contracts are committed based on Canadian currency prices and settled within 60 days with U.S. dollars. Avista Corp. hedges a portion of the foreign currency risk by purchasing Canadian currency exchange derivatives when such commodity transactions are initiated. The foreign currency exchange derivatives and the unhedged foreign currency risk have not had a material effect on Avista Corp.’s financial condition, results of operations or cash flows and these differences in cost related to currency fluctuations are included with natural gas supply costs for ratemaking.
The following table summarizes the foreign currency exchange derivatives that Avista Corp. has outstanding as of June 30, 2017 and December 31, 2016 (dollars in thousands):
June 30, | December 31, | ||||||
2017 | 2016 | ||||||
Number of contracts | 24 | 21 | |||||
Notional amount (in United States dollars) | $ | 7,588 | $ | 2,819 | |||
Notional amount (in Canadian dollars) | 10,075 | 3,754 | |||||
Interest Rate Derivatives
Avista Corp. is affected by fluctuating interest rates related to a portion of its existing debt, and future borrowing requirements. Avista Corp. hedges a portion of its interest rate risk with financial derivative instruments, which may include interest rate swap derivatives and U.S. Treasury lock agreements. These interest rate swap derivatives and U.S. Treasury lock agreements are considered economic hedges against fluctuations in future cash flows associated with anticipated debt issuances.
The following table summarizes the unsettled interest rate swap derivatives that Avista Corp. has outstanding as of June 30, 2017 and December 31, 2016 (dollars in thousands):
Balance Sheet Date | Number of Contracts | Notional Amount | Mandatory Cash Settlement Date | |||||
June 30, 2017 | 6 | $ | 75,000 | 2017 | ||||
14 | 275,000 | 2018 | ||||||
6 | 70,000 | 2019 | ||||||
3 | 30,000 | 2020 | ||||||
5 | 60,000 | 2022 | ||||||
December 31, 2016 | 6 | $ | 75,000 | 2017 | ||||
14 | 275,000 | 2018 | ||||||
6 | 70,000 | 2019 | ||||||
2 | 20,000 | 2020 | ||||||
5 | 60,000 | 2022 | ||||||
The fair value of outstanding interest rate swap derivatives can vary significantly from period to period depending on the total notional amount of swap derivatives outstanding and fluctuations in market interest rates compared to the interest rates fixed by the swaps. Avista Corp. is required to make cash payments to settle the interest rate swap derivatives when the fixed rates are higher than prevailing market rates at the date of settlement. Conversely, Avista Corp. receives cash to settle its interest rate swap derivatives when prevailing market rates at the time of settlement exceed the fixed swap rates. Upon settlement of interest rate swaps, the cash payments made or received are recorded as a regulatory asset or liability and are amortized as a component of interest expense over the life of the associated debt. The settled interest rate swaps are also included as a part of the Company's cost of debt calculation for ratemaking purposes.
18
Summary of Outstanding Derivative Instruments
The amounts recorded on the Condensed Consolidated Balance Sheet as of June 30, 2017 and December 31, 2016 reflect the offsetting of derivative assets and liabilities where a legal right of offset exists.
The following table presents the fair values and locations of derivative instruments recorded on the Condensed Consolidated Balance Sheet as of June 30, 2017 (in thousands):
Fair Value as of June 30, 2017 | ||||||||||||||||
Derivative and Balance Sheet Location | Gross Asset | Gross Liability | Collateral Netted | Net Asset (Liability) on Balance Sheet | ||||||||||||
Foreign currency exchange derivatives | ||||||||||||||||
Other current assets | $ | 187 | $ | — | $ | — | $ | 187 | ||||||||
Interest rate swap derivatives | ||||||||||||||||
Other current assets | 5,626 | (208 | ) | — | 5,418 | |||||||||||
Other property and investments-net and other non-current assets | 5,676 | (1,645 | ) | — | 4,031 | |||||||||||
Current interest rate swap derivative liabilities | — | (78,077 | ) | 41,570 | (36,507 | ) | ||||||||||
Non-current interest rate swap derivative liabilities | — | (336 | ) | — | (336 | ) | ||||||||||
Energy commodity derivatives | ||||||||||||||||
Other current assets | 168 | (11 | ) | — | 157 | |||||||||||
Current energy commodity derivative liabilities | 22,577 | (36,716 | ) | 5,831 | (8,308 | ) | ||||||||||
Other non-current liabilities, regulatory liabilities and deferred credits | 12,532 | (27,555 | ) | 3,936 | (11,087 | ) | ||||||||||
Total derivative instruments recorded on the balance sheet | $ | 46,766 | $ | (144,548 | ) | $ | 51,337 | $ | (46,445 | ) | ||||||
The following table presents the fair values and locations of derivative instruments recorded on the Condensed Consolidated Balance Sheet as of December 31, 2016 (in thousands):
Fair Value as of December 31, 2016 | ||||||||||||||||
Derivative and Balance Sheet Location | Gross Asset | Gross Liability | Collateral Netted | Net Asset (Liability) on Balance Sheet | ||||||||||||
Foreign currency exchange derivatives | ||||||||||||||||
Other current liabilities | $ | 5 | $ | (28 | ) | $ | — | $ | (23 | ) | ||||||
Interest rate swap derivatives | ||||||||||||||||
Other current assets | 3,393 | — | — | 3,393 | ||||||||||||
Other property and investments-net and other non-current assets | 5,754 | (397 | ) | — | 5,357 | |||||||||||
Current interest rate swap derivative liabilities | — | (15,756 | ) | 9,731 | (6,025 | ) | ||||||||||
Non-current interest rate swap derivative liabilities | 3,951 | (57,825 | ) | 25,169 | (28,705 | ) | ||||||||||
Energy commodity derivatives | ||||||||||||||||
Other current assets | 18,682 | (16,787 | ) | — | 1,895 | |||||||||||
Current energy commodity derivative liabilities | 16,335 | (29,598 | ) | 6,228 | (7,035 | ) | ||||||||||
Other non-current liabilities, regulatory liabilities and deferred credits | 13,071 | (29,990 | ) | 3,630 | (13,289 | ) | ||||||||||
Total derivative instruments recorded on the balance sheet | $ | 61,191 | $ | (150,381 | ) | $ | 44,758 | $ | (44,432 | ) | ||||||
Exposure to Demands for Collateral
Avista Corp.'s derivative contracts often require collateral (in the form of cash or letters of credit) or other credit enhancements, or reductions or terminations of a portion of the contract through cash settlement. In the event of a downgrade in Avista Corp.'s credit ratings or changes in market prices, additional collateral may be required. In periods of price volatility, the level of exposure can change significantly. As a result, sudden and significant demands may be made against Avista Corp.'s credit
19
facilities and cash. Avista Corp. actively monitors the exposure to possible collateral calls and takes steps to mitigate capital requirements.
The following table presents Avista Corp.'s collateral outstanding related to its derivative instruments as of June 30, 2017 and December 31, 2016 (in thousands):
June 30, | December 31, | ||||||
2017 | 2016 | ||||||
Energy commodity derivatives | |||||||
Cash collateral posted | $ | 15,924 | $ | 17,134 | |||
Letters of credit outstanding | 37,250 | 24,400 | |||||
Balance sheet offsetting (cash collateral against net derivative positions) | 9,767 | 9,858 | |||||
Interest rate swap derivatives | |||||||
Cash collateral posted | 41,570 | 34,900 | |||||
Letters of credit outstanding | 13,100 | 3,600 | |||||
Balance sheet offsetting (cash collateral against net derivative positions) | 41,570 | 34,900 | |||||
Certain of Avista Corp.’s derivative instruments contain provisions that require Avista Corp. to maintain an "investment grade" credit rating from the major credit rating agencies. If Avista Corp.’s credit ratings were to fall below "investment grade," it would be in violation of these provisions, and the counterparties to the derivative instruments could request immediate payment or demand immediate and ongoing collateralization on derivative instruments in net liability positions.
The following table presents the aggregate fair value of all derivative instruments with credit-risk-related contingent features that are in a liability position and the amount of additional collateral Avista Corp. could be required to post as of June 30, 2017 and December 31, 2016 (in thousands):
June 30, | December 31, | ||||||
2017 | 2016 | ||||||
Energy commodity derivatives | |||||||
Liabilities with credit-risk-related contingent features | $ | 648 | $ | 1,124 | |||
Additional collateral to post | 648 | 1,046 | |||||
Interest rate swap derivatives | |||||||
Liabilities with credit-risk-related contingent features | 80,266 | 73,978 | |||||
Additional collateral to post | 11,210 | 21,100 | |||||
NOTE 4. PENSION PLANS AND OTHER POSTRETIREMENT BENEFIT PLANS
Avista Utilities
Avista Utilities’ pension and other postretirement plans have not changed during the six months ended June 30, 2017. The Company’s funding policy is to contribute at least the minimum amounts that are required to be funded under the Employee Retirement Income Security Act, but not more than the maximum amounts that are currently deductible for income tax purposes. The Company contributed $14.8 million in cash to the pension plan for the six months ended June 30, 2017 and expects to contribute a total of $22.0 million in 2017. The Company contributed $12.0 million in cash to the pension plan in 2016.
20
The Company uses a December 31 measurement date for its defined benefit pension and other postretirement benefit plans. The following table sets forth the components of net periodic benefit costs for the three and six months ended June 30 (dollars in thousands):
Pension Benefits | Other Post-retirement Benefits | ||||||||||||||
2017 | 2016 | 2017 | 2016 | ||||||||||||
Three months ended June 30: | |||||||||||||||
Service cost | $ | 5,092 | $ | 4,569 | $ | 799 | $ | 804 | |||||||
Interest cost | 6,976 | 6,900 | 1,374 | 1,534 | |||||||||||
Expected return on plan assets | (7,900 | ) | (6,875 | ) | (475 | ) | (475 | ) | |||||||
Amortization of prior service cost | — | — | (312 | ) | (312 | ) | |||||||||
Net loss recognition | 2,317 | 2,201 | 1,320 | 1,494 | |||||||||||
Net periodic benefit cost | $ | 6,485 | $ | 6,795 | $ | 2,706 | $ | 3,045 | |||||||
Six months ended June 30: | |||||||||||||||
Service cost | $ | 10,134 | $ | 9,088 | $ | 1,623 | $ | 1,583 | |||||||
Interest cost | 13,927 | 13,800 | 2,773 | 3,093 | |||||||||||
Expected return on plan assets | (15,800 | ) | (13,625 | ) | (950 | ) | (950 | ) | |||||||
Amortization of prior service cost | — | — | (624 | ) | (624 | ) | |||||||||
Net loss recognition | 4,863 | 4,091 | 2,593 | 2,859 | |||||||||||
Net periodic benefit cost | $ | 13,124 | $ | 13,354 | $ | 5,415 | $ | 5,961 | |||||||
Total net periodic benefit costs in the table above are recorded to the same accounts as labor expense. Labor and benefits expense is recorded to various projects based on whether the work is a capital project or an operating expense. Approximately 40 percent of all labor and benefits is capitalized to utility property and 60 percent is expensed to other operating expenses.
NOTE 5. COMMITTED LINES OF CREDIT
Avista Corp.
Avista Corp. has a committed line of credit with various financial institutions in the total amount of $400.0 million that expires in April 2021. The committed line of credit is secured by non-transferable first mortgage bonds of the Company issued to the agent bank that would only become due and payable in the event, and then only to the extent, that the Company defaults on its obligations under the committed line of credit.
Borrowings outstanding and interest rates of borrowings (excluding letters of credit) under the Company’s revolving committed line of credit were as follows as of June 30, 2017 and December 31, 2016 (dollars in thousands):
June 30, | December 31, | ||||||
2017 | 2016 | ||||||
Borrowings outstanding at end of period | $ | 136,000 | $ | 120,000 | |||
Letters of credit outstanding at end of period | $ | 56,703 | $ | 34,353 | |||
Average interest rates at end of period | 1.99 | % | 1.50 | % | |||
As of June 30, 2017 and December 31, 2016, the borrowings outstanding under Avista Corp.'s committed line of credit were classified as short-term borrowings on the Condensed Consolidated Balance Sheet. The additional short-term borrowings outstanding as of June 30, 2017 on the Condensed Consolidated Balance Sheet relate to a short-term note payable by a subsidiary for the acquisition of land that will be repaid in early 2018.
AEL&P
AEL&P has a committed line of credit in the amount of $25.0 million that expires in November 2019. As of June 30, 2017 and December 31, 2016, there were no borrowings or letters of credit outstanding under this committed line of credit. The committed line of credit is secured by non-transferable first mortgage bonds of AEL&P issued to the agent bank that would only become due and payable in the event, and then only to the extent, that AEL&P defaults on its obligations under the committed line of credit.
21
NOTE 6. LONG-TERM DEBT AND CAPITAL LEASES
The following details long-term debt outstanding as of June 30, 2017 and December 31, 2016 (dollars in thousands):
Maturity Year | Description | Interest Rate | June 30, 2017 | December 31, 2016 | ||||||||
Avista Corp. Secured Long-Term Debt | ||||||||||||
2018 | First Mortgage Bonds | 5.95% | $ | 250,000 | $ | 250,000 | ||||||
2018 | Secured Medium-Term Notes | 7.39%-7.45% | 22,500 | 22,500 | ||||||||
2019 | First Mortgage Bonds | 5.45% | 90,000 | 90,000 | ||||||||
2020 | First Mortgage Bonds | 3.89% | 52,000 | 52,000 | ||||||||
2022 | First Mortgage Bonds | 5.13% | 250,000 | 250,000 | ||||||||
2023 | Secured Medium-Term Notes | 7.18%-7.54% | 13,500 | 13,500 | ||||||||
2028 | Secured Medium-Term Notes | 6.37% | 25,000 | 25,000 | ||||||||
2032 | Secured Pollution Control Bonds (1) | (1) | 66,700 | 66,700 | ||||||||
2034 | Secured Pollution Control Bonds (1) | (1) | 17,000 | 17,000 | ||||||||
2035 | First Mortgage Bonds | 6.25% | 150,000 | 150,000 | ||||||||
2037 | First Mortgage Bonds | 5.70% | 150,000 | 150,000 | ||||||||
2040 | First Mortgage Bonds | 5.55% | 35,000 | 35,000 | ||||||||
2041 | First Mortgage Bonds | 4.45% | 85,000 | 85,000 | ||||||||
2044 | First Mortgage Bonds | 4.11% | 60,000 | 60,000 | ||||||||
2045 | First Mortgage Bonds | 4.37% | 100,000 | 100,000 | ||||||||
2047 | First Mortgage Bonds | 4.23% | 80,000 | 80,000 | ||||||||
2051 | First Mortgage Bonds | 3.54% | 175,000 | 175,000 | ||||||||
Total Avista Corp. secured long-term debt | 1,621,700 | 1,621,700 | ||||||||||
Alaska Electric Light and Power Company Secured Long-Term Debt | ||||||||||||
2044 | First Mortgage Bonds | 4.54% | 75,000 | 75,000 | ||||||||
Total secured long-term debt | 1,696,700 | 1,696,700 | ||||||||||
Alaska Energy and Resources Company Unsecured Long-Term Debt | ||||||||||||
2019 | Unsecured Term Loan | 3.85% | 15,000 | 15,000 | ||||||||
Total secured and unsecured long-term debt | 1,711,700 | 1,711,700 | ||||||||||
Other Long-Term Debt Components | ||||||||||||
Capital lease obligations | 63,791 | 65,435 | ||||||||||
Unamortized debt discount | (709 | ) | (792 | ) | ||||||||
Unamortized long-term debt issuance costs | (10,204 | ) | (10,639 | ) | ||||||||
Total | 1,764,578 | 1,765,704 | ||||||||||
Secured Pollution Control Bonds held by Avista Corporation (1) | (83,700 | ) | (83,700 | ) | ||||||||
Current portion of long-term debt and capital leases | (277,814 | ) | (3,287 | ) | ||||||||
Total long-term debt and capital leases | $ | 1,403,064 | $ | 1,678,717 | ||||||||
(1) | In December 2010, $66.7 million and $17.0 million of the City of Forsyth, Montana Pollution Control Revenue Refunding Bonds (Avista Corporation Colstrip Project) due in 2032 and 2034, respectively, which had been held by Avista Corp. since 2008 and 2009, respectively, were refunded by new variable rate bond issues (Series 2010A and Series 2010B). The new bonds were not offered to the public and were purchased by Avista Corp. due to market conditions. The Company expects that at a later date, subject to market conditions, these bonds may be remarketed to unaffiliated investors. So long as Avista Corp. is the holder of these bonds, the bonds will not be reflected as an asset or a liability on Avista Corp.'s Consolidated Balance Sheets. |
22
NOTE 7. LONG-TERM DEBT TO AFFILIATED TRUSTS
In 1997, the Company issued Floating Rate Junior Subordinated Deferrable Interest Debentures, Series B, with a principal amount of $51.5 million to Avista Capital II, an affiliated business trust formed by the Company. Avista Capital II issued $50.0 million of Preferred Trust Securities with a floating distribution rate of LIBOR plus 0.875 percent, calculated and reset quarterly.
The distribution rates paid were as follows during the six months ended June 30, 2017 and the year ended December 31, 2016:
June 30, | December 31, | ||||
2017 | 2016 | ||||
Low distribution rate | 1.81 | % | 1.29 | % | |
High distribution rate | 2.08 | % | 1.81 | % | |
Distribution rate at the end of the period | 2.08 | % | 1.81 | % | |
Concurrent with the issuance of the Preferred Trust Securities, Avista Capital II issued $1.5 million of Common Trust Securities to the Company. These debt securities may be redeemed at the option of Avista Capital II at any time and mature on June 1, 2037. In December 2000, the Company purchased $10.0 million of these Preferred Trust Securities.
The Company owns 100 percent of Avista Capital II and has solely and unconditionally guaranteed the payment of distributions on, and redemption price and liquidation amount for, the Preferred Trust Securities to the extent that Avista Capital II has funds available for such payments from the respective debt securities. Upon maturity or prior redemption of such debt securities, the Preferred Trust Securities will be mandatorily redeemed. The Company does not include these capital trusts in its consolidated financial statements as Avista Corp. is not the primary beneficiary. As such, the sole assets of the capital trusts are $51.5 million of junior subordinated deferrable interest debentures of Avista Corp., which are reflected on the Condensed Consolidated Balance Sheets. Interest expense to affiliated trusts in the Condensed Consolidated Statements of Income represents interest expense on these debentures.
NOTE 8. FAIR VALUE
The carrying values of cash and cash equivalents, accounts and notes receivable, accounts payable, and short-term borrowings are reasonable estimates of their fair values. Long-term debt (including current portion and material capital leases) and long-term debt to affiliated trusts are reported at carrying value on the Condensed Consolidated Balance Sheets.
The fair value hierarchy prioritizes the inputs used to measure fair value. The hierarchy gives the highest priority to unadjusted quoted prices in active markets for identical assets or liabilities (Level 1 measurement) and the lowest priority to fair values derived from unobservable inputs (Level 3 measurement).
The three levels of the fair value hierarchy are defined as follows:
Level 1 – Quoted prices are available in active markets for identical assets or liabilities. Active markets are those in which transactions for the asset or liability occur with sufficient frequency and volume to provide pricing information on an ongoing basis.
Level 2 – Pricing inputs are other than quoted prices in active markets included in Level 1, but which are either directly or indirectly observable as of the reporting date. Level 2 includes those financial instruments that are valued using models or other valuation methodologies. These models are primarily industry-standard models that consider various assumptions, including quoted forward prices for commodities, time value, volatility factors, and current market and contractual prices for the underlying instruments, as well as other relevant economic measures. Substantially all of these assumptions are observable in the marketplace throughout the full term of the instrument, can be derived from observable data or are supported by observable levels at which transactions are executed in the marketplace.
Level 3 – Pricing inputs include significant inputs that are generally unobservable from objective sources. These inputs may be used with internally developed methodologies that result in management’s best estimate of fair value.
Financial assets and liabilities are classified in their entirety based on the lowest level of input that is significant to the fair value measurement. The Company’s assessment of the significance of a particular input to the fair value measurement requires judgment, and may affect the valuation of fair value assets and liabilities and their placement within the fair value hierarchy levels. The determination of the fair values incorporates various factors that not only include the credit standing of the counterparties involved and the impact of credit enhancements (such as cash deposits and letters of credit), but also the impact of Avista Corp.’s nonperformance risk on its liabilities.
23
The following table sets forth the carrying value and estimated fair value of the Company’s financial instruments not reported at estimated fair value on the Condensed Consolidated Balance Sheets as of June 30, 2017 and December 31, 2016 (dollars in thousands):
June 30, 2017 | December 31, 2016 | ||||||||||||||
Carrying Value | Estimated Fair Value | Carrying Value | Estimated Fair Value | ||||||||||||
Long-term debt (Level 2) | $ | 951,000 | $ | 1,076,925 | $ | 951,000 | $ | 1,048,661 | |||||||
Long-term debt (Level 3) | 677,000 | 701,924 | 677,000 | 675,251 | |||||||||||
Snettisham capital lease obligation (Level 3) | 60,953 | 62,600 | 62,160 | 62,800 | |||||||||||
Long-term debt to affiliated trusts (Level 3) | 51,547 | 43,042 | 51,547 | 38,660 | |||||||||||
These estimates of fair value of long-term debt and long-term debt to affiliated trusts were primarily based on available market information, which generally consists of estimated market prices from third party brokers for debt with similar risk and terms. The price ranges obtained from the third party brokers consisted of par values of 83.50 to 128.87, where a par value of 100.0 represents the carrying value recorded on the Condensed Consolidated Balance Sheets. Level 2 long-term debt represents publicly issued bonds with quoted market prices; however, due to their limited trading activity, they are classified as Level 2 because brokers must generate quotes and make estimates if there is no trading activity near a period end. Level 3 long-term debt consists of private placement bonds and debt to affiliated trusts, which typically have no secondary trading activity. Fair values in Level 3 are estimated based on market prices from third party brokers using secondary market quotes for debt with similar risk and terms to generate quotes for Avista Corp. bonds. Due to the unique nature of the Snettisham capital lease obligation, the estimated fair value of these items was determined based on a discounted cash flow model using available market information. The Snettisham capital lease obligation was discounted to present value using the Morgan Markets A Ex-Fin discount rate as published on June 30, 2017.
The following table discloses by level within the fair value hierarchy the Company’s assets and liabilities measured and reported on the Condensed Consolidated Balance Sheets as of June 30, 2017 and December 31, 2016 at fair value on a recurring basis (dollars in thousands):
Level 1 | Level 2 | Level 3 | Counterparty and Cash Collateral Netting (1) | Total | |||||||||||||||
June 30, 2017 | |||||||||||||||||||
Assets: | |||||||||||||||||||
Energy commodity derivatives | $ | — | $ | 35,198 | $ | — | $ | (35,041 | ) | $ | 157 | ||||||||
Level 3 energy commodity derivatives: | |||||||||||||||||||
Natural gas exchange agreement | — | — | 79 | (79 | ) | — | |||||||||||||
Foreign currency exchange derivatives | — | 187 | — | — | 187 | ||||||||||||||
Interest rate swap derivatives | — | 11,302 | — | (1,853 | ) | 9,449 | |||||||||||||
Deferred compensation assets: | |||||||||||||||||||
Fixed income securities (2) | 1,716 | — | — | — | 1,716 | ||||||||||||||
Equity securities (2) | 6,067 | — | — | — | 6,067 | ||||||||||||||
Total | $ | 7,783 | $ | 46,687 | $ | 79 | $ | (36,973 | ) | $ | 17,576 | ||||||||
Liabilities: | |||||||||||||||||||
Energy commodity derivatives | $ | — | $ | 46,203 | $ | — | $ | (44,808 | ) | $ | 1,395 | ||||||||
Level 3 energy commodity derivatives: | |||||||||||||||||||
Natural gas exchange agreement | — | — | 4,252 | (79 | ) | 4,173 | |||||||||||||
Power exchange agreement | — | — | 13,784 | — | 13,784 | ||||||||||||||
Power option agreement | — | — | 43 | — | 43 | ||||||||||||||
Interest rate swap derivatives | — | 80,266 | — | (43,423 | ) | 36,843 | |||||||||||||
Total | $ | — | $ | 126,469 | $ | 18,079 | $ | (88,310 | ) | $ | 56,238 | ||||||||
24
Level 1 | Level 2 | Level 3 | Counterparty and Cash Collateral Netting (1) | Total | |||||||||||||||
December 31, 2016 | |||||||||||||||||||
Assets: | |||||||||||||||||||
Energy commodity derivatives | $ | — | $ | 47,994 | $ | — | $ | (46,099 | ) | $ | 1,895 | ||||||||
Level 3 energy commodity derivatives: | |||||||||||||||||||
Natural gas exchange agreement | — | — | 69 | (69 | ) | — | |||||||||||||
Power exchange agreement | — | — | 25 | (25 | ) | — | |||||||||||||
Foreign currency exchange derivatives | — | 5 | — | (5 | ) | — | |||||||||||||
Interest rate swap derivatives | — | 13,098 | — | (4,348 | ) | 8,750 | |||||||||||||
Deferred compensation assets: | |||||||||||||||||||
Fixed income securities (2) | 1,789 | — | — | — | 1,789 | ||||||||||||||
Equity securities (2) | 5,481 | — | — | — | 5,481 | ||||||||||||||
Total | $ | 7,270 | $ | 61,097 | $ | 94 | $ | (50,546 | ) | $ | 17,915 | ||||||||
Liabilities: | |||||||||||||||||||
Energy commodity derivatives | $ | — | $ | 56,871 | $ | — | $ | (55,957 | ) | $ | 914 | ||||||||
Level 3 energy commodity derivatives: | |||||||||||||||||||
Natural gas exchange agreement | — | — | 5,954 | (69 | ) | 5,885 | |||||||||||||
Power exchange agreement | — | — | 13,474 | (25 | ) | 13,449 | |||||||||||||
Power option agreement | — | — | 76 | — | 76 | ||||||||||||||
Foreign currency exchange derivatives | — | 28 | — | (5 | ) | 23 | |||||||||||||
Interest rate swap derivatives | — | 73,978 | — | (39,248 | ) | 34,730 | |||||||||||||
Total | $ | — | $ | 130,877 | $ | 19,504 | $ | (95,304 | ) | $ | 55,077 | ||||||||
(1) | The Company is permitted to net derivative assets and derivative liabilities with the same counterparty when a legally enforceable master netting agreement exists. In addition, the Company nets derivative assets and derivative liabilities against any payables and receivables for cash collateral held or placed with these same counterparties. |
(2) | These assets are trading securities and are included in other property and investments-net and other non-current assets on the Condensed Consolidated Balance Sheets. |
The difference between the amount of derivative assets and liabilities disclosed in respective levels in the table above and the amount of derivative assets and liabilities disclosed on the Condensed Consolidated Balance Sheets is due to netting arrangements with certain counterparties. See Note 3 for additional discussion of derivative netting.
To establish fair value for energy commodity derivatives, the Company uses quoted market prices and forward price curves to estimate the fair value of energy commodity derivative instruments included in Level 2. In particular, electric derivative valuations are performed using market quotes, adjusted for periods in between quotable periods. Natural gas derivative valuations are estimated using New York Mercantile Exchange (NYMEX) pricing for similar instruments, adjusted for basin differences, using market quotes. Where observable inputs are available for substantially the full term of the contract, the derivative asset or liability is included in Level 2.
To establish fair values for interest rate swap derivatives, the Company uses forward market curves for interest rates for the term of the swaps and discounts the cash flows back to present value using an appropriate discount rate. The discount rate is calculated by third party brokers according to the terms of the swap derivatives and evaluated by the Company for reasonableness, with consideration given to the potential non-performance risk by the Company. Future cash flows of the interest rate swap derivatives are equal to the fixed interest rate in the swap compared to the floating market interest rate multiplied by the notional amount for each period.
To establish fair value for foreign currency derivatives, the Company uses forward market curves for Canadian dollars against the US dollar and multiplies the difference between the locked-in price and the market price by the notional amount of the derivative. Forward foreign currency market curves are provided by third party brokers. The Company's credit spread is factored into the locked-in price of the foreign exchange contracts.
25
Deferred compensation assets and liabilities represent funds held by the Company in a Rabbi Trust for an executive deferral plan. These funds consist of actively traded equity and bond funds with quoted prices in active markets. The balance disclosed in the table above excludes cash and cash equivalents of $0.2 million as of June 30, 2017 and $0.4 million as of December 31, 2016.
Level 3 Fair Value
Under the power exchange agreement the Company purchases power at a price that is based on the average operating and maintenance (O&M) charges from three surrogate nuclear power plants around the country. To estimate the fair value of this agreement the Company estimates the difference between the purchase price based on the future O&M charges and forward prices for energy. The Company compares the Level 2 brokered quotes and forward price curves described above to an internally developed forward price which is based on the average O&M charges from the three surrogate nuclear power plants for the current year. Because the nuclear power plant O&M charges are only known for one year, all forward years are estimated assuming an annual escalation. In addition to the forward price being estimated using unobservable inputs, the Company also estimates the volumes of the transactions that will take place in the future based on historical average transaction volumes per delivery year (November to April). Significant increases or decreases in any of these inputs in isolation would result in a significantly higher or lower fair value measurement. Generally, a change in the current year O&M charges for the surrogate plants is accompanied by a directionally similar change in O&M charges in future years. There is generally not a correlation between external market prices and the O&M charges used to develop the internal forward price.
For the power commodity option agreement, the Company uses the Black-Scholes-Merton valuation model to estimate the fair value, and this model includes significant inputs not observable or corroborated in the market. These inputs include: 1) the strike price (which is an internally derived price based on a combination of generation plant heat rate factors, natural gas market pricing, delivery and other O&M charges) and 2) estimated delivery volumes. Significant increases or decreases in these inputs in isolation would result in a significantly higher or lower fair value measurement. Generally, changes in overall commodity market prices are accompanied by directionally similar changes in the strike price assumptions used in the calculation.
For the natural gas commodity exchange agreement, the Company uses the same Level 2 brokered quotes described above; however, the Company also estimates the purchase and sales volumes (within contractual limits) as well as the timing of those transactions. Changing the timing of volume estimates changes the timing of purchases and sales, impacting which brokered quote is used. Because the brokered quotes can vary significantly from period to period, the unobservable estimates of the timing and volume of transactions can have a significant impact on the calculated fair value. The Company currently estimates volumes and timing of transactions based on a most likely scenario using historical data. Historically, the timing and volume of transactions have not been highly correlated with market prices and market volatility.
The following table presents the quantitative information which was used to estimate the fair values of the Level 3 assets and liabilities above as of June 30, 2017 (dollars in thousands):
Fair Value (Net) at | ||||||||||
June 30, 2017 | Valuation Technique | Unobservable Input | Range | |||||||
Power exchange agreement | $ | (13,784 | ) | Surrogate facility pricing | O&M charges | $33.59-$49.15/MWh (1) | ||||
Escalation factor | 3% - 2017 to 2019 | |||||||||
Transaction volumes | 396,984 MWhs | |||||||||
Power option agreement | $ | (43 | ) | Black-Scholes- Merton | Strike price | $35.92/MWh - 2019 | ||||
$48.39/MWh - 2018 | ||||||||||
Delivery volumes | 128,611 - 254,363 MWhs | |||||||||
Natural gas exchange agreement | $ | (4,173 | ) | Internally derived weighted average cost of gas | Forward purchase prices | $1.66 - $2.38/mmBTU | ||||
Forward sales prices | $1.67 - $3.29/mmBTU | |||||||||
Purchase volumes | 115,000 - 310,000 mmBTUs | |||||||||
Sales volumes | 60,000 - 310,000 mmBTUs | |||||||||
(1) The average O&M charges for the delivery year beginning in November 2016 are $39.22 per MWh. For ratemaking purposes the average O&M charges to be included for recovery in retail rates vary slightly between regulatory jurisdictions. The average O&M charges for the delivery year beginning in 2016 are $44.33 for Washington and $39.22 for Idaho.
26
The valuation methods, significant inputs and resulting fair values described above were developed by the Company's management and are reviewed on at least a quarterly basis to ensure they provide a reasonable estimate of fair value each reporting period.
The following table presents activity for energy commodity derivative assets (liabilities) measured at fair value using significant unobservable inputs (Level 3) for the three and six months ended June 30 (dollars in thousands):
Natural Gas Exchange Agreement | Power Exchange Agreement | Power Option Agreement | Total | ||||||||||||
Three months ended June 30, 2017: | |||||||||||||||
Balance as of April 1, 2017 | $ | (4,278 | ) | $ | (14,419 | ) | $ | (266 | ) | $ | (18,963 | ) | |||
Total gains or (losses) (realized/unrealized): | |||||||||||||||
Included in regulatory assets/liabilities (1) | (195 | ) | (672 | ) | 223 | (644 | ) | ||||||||
Settlements | 300 | 1,307 | — | 1,607 | |||||||||||
Ending balance as of June 30, 2017 (2) | $ | (4,173 | ) | $ | (13,784 | ) | $ | (43 | ) | $ | (18,000 | ) | |||
Three months ended June 30, 2016: | |||||||||||||||
Balance as of April 1, 2016 | $ | (6,006 | ) | $ | (20,193 | ) | $ | (97 | ) | $ | (26,296 | ) | |||
Total gains or (losses) (realized/unrealized): | |||||||||||||||
Included in regulatory assets/liabilities (1) | (1,551 | ) | 4,400 | (8 | ) | 2,841 | |||||||||
Settlements | 700 | 1,179 | — | 1,879 | |||||||||||
Ending balance as of June 30, 2016 (2) | $ | (6,857 | ) | $ | (14,614 | ) | $ | (105 | ) | $ | (21,576 | ) | |||
Six months ended June 30, 2017: | |||||||||||||||
Balance as of January 1, 2017 | $ | (5,885 | ) | $ | (13,449 | ) | $ | (76 | ) | $ | (19,410 | ) | |||
Total gains or (losses) (realized/unrealized): | |||||||||||||||
Included in regulatory assets/liabilities (1) | 1,817 | (5,165 | ) | 33 | (3,315 | ) | |||||||||
Settlements | (105 | ) | 4,830 | — | 4,725 | ||||||||||
Ending balance as of June 30, 2017 (2) | $ | (4,173 | ) | $ | (13,784 | ) | $ | (43 | ) | $ | (18,000 | ) | |||
Six months ended June 30, 2016: | |||||||||||||||
Balance as of January 1, 2016 | $ | (5,039 | ) | $ | (21,961 | ) | $ | (124 | ) | $ | (27,124 | ) | |||
Total gains or (losses) (realized/unrealized): | |||||||||||||||
Included in regulatory assets/liabilities (1) | (3,296 | ) | 1,968 | 19 | (1,309 | ) | |||||||||
Settlements | 1,478 | 5,379 | — | 6,857 | |||||||||||
Ending balance as of June 30, 2016 (2) | $ | (6,857 | ) | $ | (14,614 | ) | $ | (105 | ) | $ | (21,576 | ) | |||
(1) | All gains and losses are included in other regulatory assets and liabilities. There were no gains and losses included in either net income or other comprehensive income during any of the periods presented in the table above. |
(2) | There were no purchases, issuances or transfers from other categories of any derivatives instruments during the periods presented in the table above. |
NOTE 9. COMMON STOCK
In March 2016, the Company entered into four separate sales agency agreements under which Avista Corp.'s sales agents may offer and sell up to 3.8 million new shares of Avista Corp.'s common stock, no par value, from time to time. The sales agency agreements expire on February 29, 2020. As of June 30, 2017, 1.6 million shares have been issued under these agreements, leaving 2.2 million shares remaining to be issued. No shares were issued under these agreements in the six months ended June 30, 2017.
In the six months ended June 30, 2017, Avista Corp. issued 0.2 million shares of common stock, most of which were under employee incentive plans. The Company also issued a small number of shares under the 401(k) employee investment plan. Total net proceeds for all issuances were $1.2 million.
27
NOTE 10. EARNINGS PER COMMON SHARE ATTRIBUTABLE TO AVISTA CORP. SHAREHOLDERS
The following table presents the computation of basic and diluted earnings per common share attributable to Avista Corp. shareholders for the three and six months ended June 30 (in thousands, except per share amounts):
Three months ended June 30, | Six months ended June 30, | ||||||||||||||
2017 | 2016 | 2017 | 2016 | ||||||||||||
Numerator: | |||||||||||||||
Net income attributable to Avista Corp. shareholders | $ | 21,771 | $ | 27,254 | $ | 83,887 | $ | 84,903 | |||||||
Denominator: | |||||||||||||||
Weighted-average number of common shares outstanding-basic | 64,401 | 63,386 | 64,382 | 62,995 | |||||||||||
Effect of dilutive securities: | |||||||||||||||
Performance and restricted stock awards | 152 | 397 | 129 | 373 | |||||||||||
Weighted-average number of common shares outstanding-diluted | 64,553 | 63,783 | 64,511 | 63,368 | |||||||||||
Earnings per common share attributable to Avista Corp. shareholders: | |||||||||||||||
Basic | $ | 0.34 | $ | 0.43 | $ | 1.30 | $ | 1.35 | |||||||
Diluted | $ | 0.34 | $ | 0.43 | $ | 1.30 | $ | 1.34 | |||||||
There were no shares excluded from the calculation because they were antidilutive.
NOTE 11. COMMITMENTS AND CONTINGENCIES
In the course of its business, the Company becomes involved in various claims, controversies, disputes and other contingent matters, including the items described in this Note. Some of these claims, controversies, disputes and other contingent matters involve litigation or other contested proceedings. For all such matters, the Company intends to vigorously protect and defend its interests and pursue its rights. However, no assurance can be given as to the ultimate outcome of any particular matter because litigation and other contested proceedings are inherently subject to numerous uncertainties. For matters that affect Avista Utilities’ or AEL&P's operations, the Company intends to seek, to the extent appropriate, recovery of incurred costs through the ratemaking process.
California Refund Proceeding
In February 2016, APX, a market maker in the California Refund Proceedings in whose markets Avista Energy participated in the summer of 2000, asserted that Avista Energy and its other customer/participants may be responsible for a share of the disgorgement penalty APX may be found to owe to the California Parties (as defined in the 2016 Form 10-K). The penalty arises as a result of the Federal Energy and Regulatory Commission's (FERC) finding that APX committed violations in the California market in the summer of 2000. APX is making these assertions despite Avista Energy having been dismissed in FERC Opinion No. 536 from the on-going administrative proceeding at the FERC regarding potential wrongdoing in the California markets in the summer of 2000. APX has identified Avista Energy’s share of APX’s exposure to be as much as $16.0 million even though no wrongdoing allegations are specifically attributable to Avista Energy. Avista Energy believes its 2014 settlement with the California Parties insulates it from any such liability and that as a dismissed party it cannot be drawn back into the litigation. Avista Energy intends to vigorously dispute APX’s assertions of indirect liability, but cannot at this time predict the eventual outcome.
Cabinet Gorge Total Dissolved Gas Abatement Plan
Dissolved atmospheric gas levels (referred to as "Total Dissolved Gas" or "TDG") in the Clark Fork River exceed state of Idaho and federal water quality numeric standards downstream of Cabinet Gorge particularly during periods when excess river flows must be diverted over the spillway. Under the terms of the Clark Fork Settlement Agreement (CFSA) as incorporated in Avista Corp.’s FERC license for the Clark Fork Project, Avista Corp. has worked in consultation with agencies, tribes and other stakeholders to address this issue. Under the terms of a gas supersaturation mitigation plan, Avista is reducing TDG by constructing spill crest modifications on spill gates at the dam, and the Company expects to continue spill crest modifications over the next several years, in ongoing consultation with key stakeholders. Avista Corp. cannot at this time predict the outcome or estimate a range of costs associated with this contingency; however, the Company will continue to seek recovery, through the ratemaking process, of all operating and capitalized costs related to this issue.
28
Fish Passage at Cabinet Gorge and Noxon Rapids
In 1999, the United States Fish and Wildlife Service (USFWS) listed bull trout as threatened under the Endangered Species Act. In 2010, the USFWS issued a revised designation of critical habitat for bull trout, which includes the lower Clark Fork River. The USFWS issued a final recovery plan in October 2015.
The CFSA describes programs intended to help restore bull trout populations in the project area. Using the concept of adaptive management and working closely with the USFWS, the Company evaluated the feasibility of fish passage at Cabinet Gorge and Noxon Rapids. The results of these studies led, in part, to the decision to move forward with development of permanent facilities, among other bull trout enhancement efforts. Parties to the CFSA are working to resolve several issues. The Company believes its ongoing efforts through the CFSA continue to effectively address issues related to bull trout. Avista Corp. cannot at this time predict the outcome or estimate a range of costs associated with this contingency; however, the Company will continue to seek recovery, through the ratemaking process, of all operating and capitalized costs related to fish passage at Cabinet Gorge and Noxon Rapids.
Other Contingencies
In the normal course of business, the Company has various other legal claims and contingent matters outstanding. The Company believes that any ultimate liability arising from these actions will not have a material impact on its financial condition, results of operations or cash flows. It is possible that a change could occur in the Company’s estimates of the probability or amount of a liability being incurred. Such a change, should it occur, could be significant. See "Note 19 of the Notes to Consolidated Financial Statements" in the 2016 Form 10-K for additional discussion regarding other contingencies.
NOTE 12. INFORMATION BY BUSINESS SEGMENTS
The business segment presentation reflects the basis used by the Company's management to analyze performance and determine the allocation of resources. The Company's management evaluates performance based on income (loss) from operations before income taxes as well as net income (loss) attributable to Avista Corp. shareholders. The accounting policies of the segments are the same as those described in the summary of significant accounting policies. Avista Utilities' business is managed based on the total regulated utility operation; therefore, it is considered one segment. AEL&P is a separate reportable business segment as it has separate financial reports that are reviewed in detail by the Chief Operating Decision Maker and its operations and risks are sufficiently different from Avista Utilities and the other businesses at AERC that it cannot be aggregated with any other operating segments. The Other category, which is not a reportable segment, includes other investments and operations of various subsidiaries, as well as certain other operations of Avista Capital.
The following table presents information for each of the Company’s business segments (dollars in thousands):
Avista Utilities | Alaska Electric Light and Power Company | Total Utility | Other | Intersegment Eliminations (1) | Total | ||||||||||||||||||
For the three months ended June 30, 2017: | |||||||||||||||||||||||
Operating revenues | $ | 296,747 | $ | 11,982 | $ | 308,729 | $ | 5,772 | $ | — | $ | 314,501 | |||||||||||
Resource costs | 99,461 | 3,290 | 102,751 | — | — | 102,751 | |||||||||||||||||
Other operating expenses | 78,970 | 2,995 | 81,965 | 7,086 | — | 89,051 | |||||||||||||||||
Depreciation and amortization | 41,195 | 1,448 | 42,643 | 157 | — | 42,800 | |||||||||||||||||
Income (loss) from operations | 53,971 | 3,597 | 57,568 | (1,471 | ) | — | 56,097 | ||||||||||||||||
Interest expense (2) | 22,826 | 895 | 23,721 | 176 | (27 | ) | 23,870 | ||||||||||||||||
Income taxes | 12,892 | 1,075 | 13,967 | (916 | ) | — | 13,051 | ||||||||||||||||
Net income (loss) attributable to Avista Corp. shareholders | 21,765 | 1,681 | 23,446 | (1,675 | ) | — | 21,771 | ||||||||||||||||
Capital expenditures (3) | 88,612 | 2,339 | 90,951 | 134 | — | 91,085 | |||||||||||||||||
29
Avista Utilities | Alaska Electric Light and Power Company | Total Utility | Other | Intersegment Eliminations (1) | Total | ||||||||||||||||||
For the three months ended June 30, 2016: | |||||||||||||||||||||||
Operating revenues | $ | 302,641 | $ | 10,247 | $ | 312,888 | $ | 5,950 | $ | — | $ | 318,838 | |||||||||||
Resource costs | 106,607 | 3,208 | 109,815 | — | — | 109,815 | |||||||||||||||||
Other operating expenses | 75,790 | 2,876 | 78,666 | 6,281 | — | 84,947 | |||||||||||||||||
Depreciation and amortization | 38,351 | 1,327 | 39,678 | 192 | — | 39,870 | |||||||||||||||||
Income (loss) from operations | 59,862 | 2,252 | 62,114 | (523 | ) | — | 61,591 | ||||||||||||||||
Interest expense (2) | 20,462 | 895 | 21,357 | 149 | (34 | ) | 21,472 | ||||||||||||||||
Income taxes | 16,349 | 676 | 17,025 | (315 | ) | — | 16,710 | ||||||||||||||||
Net income (loss) attributable to Avista Corp. shareholders | 26,771 | 1,058 | 27,829 | (575 | ) | — | 27,254 | ||||||||||||||||
Capital expenditures (3) | 88,048 | 5,889 | 93,937 | 46 | — | 93,983 | |||||||||||||||||
For the six months ended June 30, 2017: | |||||||||||||||||||||||
Operating revenues | $ | 712,128 | $ | 27,138 | $ | 739,266 | $ | 11,705 | $ | — | $ | 750,971 | |||||||||||
Resource costs | 262,074 | 6,263 | 268,337 | — | — | 268,337 | |||||||||||||||||
Other operating expenses | 150,682 | 5,767 | 156,449 | 13,265 | — | 169,714 | |||||||||||||||||
Depreciation and amortization | 81,733 | 2,895 | 84,628 | 345 | — | 84,973 | |||||||||||||||||
Income (loss) from operations | 162,606 | 10,782 | 173,388 | (1,905 | ) | — | 171,483 | ||||||||||||||||
Interest expense (2) | 45,509 | 1,789 | 47,298 | 343 | (41 | ) | 47,600 | ||||||||||||||||
Income taxes | 43,909 | 3,538 | 47,447 | (1,052 | ) | — | 46,395 | ||||||||||||||||
Net income (loss) attributable to Avista Corp. shareholders | 80,204 | 5,534 | 85,738 | (1,851 | ) | — | 83,887 | ||||||||||||||||
Capital expenditures (3) | 174,015 | 3,699 | 177,714 | 169 | — | 177,883 | |||||||||||||||||
For the six months ended June 30, 2016: | |||||||||||||||||||||||
Operating revenues | $ | 702,788 | $ | 22,893 | $ | 725,681 | $ | 11,330 | $ | — | $ | 737,011 | |||||||||||
Resource costs | 265,685 | 5,849 | 271,534 | — | — | 271,534 | |||||||||||||||||
Other operating expenses | 149,046 | 5,399 | 154,445 | 12,106 | — | 166,551 | |||||||||||||||||
Depreciation and amortization | 76,217 | 2,653 | 78,870 | 380 | — | 79,250 | |||||||||||||||||
Income (loss) from operations | 161,107 | 7,725 | 168,832 | (1,156 | ) | — | 167,676 | ||||||||||||||||
Interest expense (2) | 40,880 | 1,790 | 42,670 | 310 | (97 | ) | 42,883 | ||||||||||||||||
Income taxes | 45,021 | 2,571 | 47,592 | (537 | ) | — | 47,055 | ||||||||||||||||
Net income (loss) attributable to Avista Corp. shareholders | 81,758 | 4,019 | 85,777 | (874 | ) | — | 84,903 | ||||||||||||||||
Capital expenditures (3) | 172,483 | 10,332 | 182,815 | 165 | — | 182,980 | |||||||||||||||||
Total Assets: | |||||||||||||||||||||||
As of June 30, 2017: | $ | 5,034,778 | $ | 278,470 | $ | 5,313,248 | $ | 59,756 | $ | — | $ | 5,373,004 | |||||||||||
As of December 31, 2016: | $ | 4,975,555 | $ | 273,770 | $ | 5,249,325 | $ | 60,430 | $ | — | $ | 5,309,755 | |||||||||||
(1) | Intersegment eliminations reported as interest expense represent intercompany interest. |
(2) | Including interest expense to affiliated trusts. |
(3) | The capital expenditures for the other businesses are included in other investing activities on the Condensed Consolidated Statements of Cash Flows. |
30
NOTE 13. SUBSEQUENT EVENT
On July 19, 2017, Avista Corp. entered into an Agreement and Plan of Merger (Merger Agreement), by and among Hydro One Limited (Hydro One), Olympus Holding Corp., a wholly owned subsidiary of Hydro One (US parent), and Olympus Corp., a wholly owned subsidiary of US parent (Merger Sub). Hydro One, based in Toronto, is Ontario’s largest electricity transmission and distribution provider with more than 1.3 million customers, C$25.0 billion in assets and annual revenues of over C$6.5 billion.
The Merger Agreement provides for Avista Corp. to become an indirect, wholly-owned subsidiary of Hydro One. At the effective time of the merger, each share of Avista Corp. Common Stock issued and outstanding, other than Dissenting Shareholder Shares (as defined in the Merger Agreement) and shares of Avista Corp. Common Stock that are owned by Hydro One, US Parent or Merger Sub or any of their respective subsidiaries, will be converted automatically into the right to receive an amount in cash equal to $53.00, without interest.
Consummation of the merger is subject to the satisfaction or waiver of specified closing conditions, including, but not limited to, (i) the approval of the merger by the holders of a majority of the outstanding shares of Avista Corp. Common Stock, (ii) the receipt of regulatory approvals required to consummate the Merger, including approval from the FERC, the Committee on Foreign Investment in the United States (CFIUS), the Federal Communications Commission (FCC), the UTC, IPUC, Public Service Commission of the State of Montana (MPSC), OPUC, and the RCA, and (iii) the expiration or termination of the applicable waiting period under the Hart-Scott-Rodino Antitrust Improvements Act of 1976, as amended. Avista Corp. expects to file for all necessary approvals within 45 to 60 days from the date of the Merger Agreement and the merger is expected to close during the second half of 2018.
The Merger Agreement also contains customary representations, warranties and covenants of Avista Corp., Hydro One, US Parent and Merger Sub. These covenants include, among others, an obligation on behalf of Avista Corp. to operate its business in the ordinary course until the Merger is consummated, subject to certain exceptions. In addition, the parties are required to use reasonable best efforts to obtain any required regulatory approvals.
Avista Corp. has made certain additional customary covenants, including, among others, and subject to certain exceptions, (a) causing a meeting of Avista Corp.’s shareholders to be held to consider approval of the Merger Agreement and (b) a customary non-solicitation covenant prohibiting Avista Corp. from soliciting, providing non-public information or entering into discussions or negotiations concerning proposals relating to alternative business combination transactions, except as and to the extent permitted under the Merger Agreement with respect to an unsolicited written Takeover Proposal (as defined in the Merger Agreement) made prior to the approval of the Merger by Avista Corp.'s shareholders if, among other things, Avista Corp.'s board of directors determines in good faith that such Takeover Proposal is or could be reasonably expected to lead to a Superior Proposal (as defined in the Merger Agreement) and that failure to take such actions would reasonably be expected to be inconsistent with its fiduciary duties under applicable law.
The Merger Agreement may be terminated by Avista Corp. and Hydro One by mutual consent and by either Avista Corp. or Hydro One under certain circumstances, including if the Merger is not consummated by September 30, 2018 (subject to an extension of up to six months by either party if all of the conditions to closing, other than the conditions related to obtaining required regulatory approvals, the absence of a law or injunction preventing the consummation of the Merger and the absence of a Burdensome Condition (as defined in the Merger Agreement) in any required regulatory approval, have been satisfied). The Merger Agreement also provides for certain additional termination rights for each of Avista Corp. and Hydro One. Upon termination of the Merger Agreement under certain specified circumstances, including (i) termination by Avista Corp. in order to enter into a definitive agreement with respect to a Superior Proposal, or (ii) termination by Hydro One following a withdrawal by Avista Corp.'s board or directors of its recommendation of the Merger Agreement, Avista Corp. will be required to pay Hydro One a termination fee of $103.0 million (Company Termination Fee). Avista Corp. will also be required to pay Hydro One the Company Termination Fee in the event Avista Corp. signs or consummates any specified alternative transaction within twelve months following the termination of the Merger Agreement under certain circumstances. In addition, if the Merger Agreement is terminated under certain circumstances due to the failure to obtain required regulatory approvals, the imposition of a Burdensome Condition with respect to a required regulatory approval, or the breach by Hydro One, US Parent or Merger Sub of their obligations in respect of obtaining regulatory approvals, Hydro One will be required to pay Avista Corp. a termination fee of $103.0 million.
31
REPORT OF INDEPENDENT REGISTERED PUBLIC ACCOUNTING FIRM
To the Board of Directors and Shareholders of
Avista Corporation
Spokane, Washington
We have reviewed the accompanying condensed consolidated balance sheet of Avista Corporation and subsidiaries (the “Company”) as of June 30, 2017, and the related condensed consolidated statements of income and comprehensive income for the three-month and six-month periods ended June 30, 2017 and 2016 and the related condensed consolidated statements of equity and cash flows for the six-month periods ended June 30, 2017 and 2016. These interim financial statements are the responsibility of the Company’s management.
We conducted our reviews in accordance with the standards of the Public Company Accounting Oversight Board (United States). A review of interim financial information consists principally of applying analytical procedures and making inquiries of persons responsible for financial and accounting matters. It is substantially less in scope than an audit conducted in accordance with the standards of the Public Company Accounting Oversight Board (United States), the objective of which is the expression of an opinion regarding the financial statements taken as a whole. Accordingly, we do not express such an opinion.
Based on our reviews, we are not aware of any material modifications that should be made to such condensed consolidated interim financial statements for them to be in conformity with accounting principles generally accepted in the United States of America.
We have previously audited, in accordance with the standards of the Public Company Accounting Oversight Board (United States), the consolidated balance sheet of Avista Corporation and subsidiaries as of December 31, 2016, and the related consolidated statements of income, comprehensive income, equity and redeemable noncontrolling interests, and cash flows for the year then ended (not presented herein); and in our report dated February 21, 2017, we expressed an unqualified opinion on those consolidated financial statements. In our opinion, the information set forth in the accompanying condensed consolidated balance sheet as of December 31, 2016 is fairly stated, in all material respects, in relation to the consolidated balance sheet from which it has been derived.
/s/ Deloitte & Touche LLP
Seattle, Washington
August 1, 2017
32
Item 2. Management’s Discussion and Analysis of Financial Condition and Results of Operations
Management’s Discussion and Analysis of Financial Condition and Results of Operations has been prepared in accordance with GAAP for interim financial information and with the instructions to Form 10-Q. The interim Management’s Discussion and Analysis of Financial Condition and Results of Operations does not contain the full detail or analysis which would be included in a full fiscal year Form 10-K; therefore, it should be read in conjunction with the Company's 2016 Form 10-K.
Business Segments
Our business segments have not changed during the six months ended June 30, 2017. See the 2016 Form 10-K as well as “Note 12 of the Notes to Condensed Consolidated Financial Statements” for further information regarding our business segments.
The following table presents net income (loss) attributable to Avista Corp. shareholders for each of our business segments (and the other businesses) for the three and six months ended June 30 (dollars in thousands):
Three months ended June 30, | Six months ended June 30, | ||||||||||||||
2017 | 2016 | 2017 | 2016 | ||||||||||||
Avista Utilities | $ | 21,765 | $ | 26,771 | $ | 80,204 | $ | 81,758 | |||||||
AEL&P | 1,681 | 1,058 | 5,534 | 4,019 | |||||||||||
Other | (1,675 | ) | (575 | ) | (1,851 | ) | (874 | ) | |||||||
Net income attributable to Avista Corp. shareholders | $ | 21,771 | $ | 27,254 | $ | 83,887 | $ | 84,903 | |||||||
Executive Level Summary
Overall Results
Net income attributable to Avista Corp. shareholders was $21.8 million for the three months ended June 30, 2017, a decrease from $27.3 million for the three months ended June 30, 2016. Net income attributable to Avista Corp. shareholders was $83.9 million for the six months ended June 30, 2017, a decrease from $84.9 million for the six months ended June 30, 2016.
The decrease in earnings for both the second quarter and first half of 2017 was due to a decrease in earnings at Avista Utilities and an increase in losses at our other businesses, partially offset by an increase in earnings at AEL&P.
Avista Utilities' earnings decreased for both the second quarter and year-to-date 2017 due to an increase in other operating expenses, primarily due to an increase in generation, transmission and distribution maintenance costs, and increased depreciation and amortization and interest expense. As previously discussed, our 2016 requests for general rate increases in Washington were denied; therefore, we are not receiving regulatory recovery of the increase in expenses. In addition, there were also merger transaction costs incurred during the second quarter of 2017, which are not being passed through to customers. The increase in costs was partially offset by an increase in gross margin (operating revenues less resource costs) as a result of general rate increases in Idaho and Oregon, customer growth and lower electric resource costs. See "Results of Operations – Overall – Non-GAAP Financial Measures" for further discussion of gross margin.
AEL&P earnings increased for the second quarter and year-to-date 2017 primarily as a result of an increase in electric gross margin (operating revenues less resource costs), due to an interim general rate increase and higher loads due to colder weather in the first quarter, partially offset by an increase in operating expenses and a decrease in AFUDC and capitalized interest due to the construction of an additional back-up generation plant in 2016.
The increase in losses at our other businesses for both the second quarter and year-to-date 2017 was primarily related to renovation expenses and increased compliance costs at one of our subsidiaries and additional losses on investments as compared to 2016.
More detailed explanations of the fluctuations are provided in the results of operations and business segment discussions (Avista Utilities, AEL&P, and the other businesses) that follow this section.
Recent Development
On July 19, 2017, Avista Corp. entered into a Merger Agreement that provides for Avista Corp. to become an indirect, wholly-owned subsidiary of Hydro One. Subject to the satisfaction or waiver of specified closing conditions, the merger is expected to close during the second half of 2018. At the effective time of the merger, each share of Avista Corp. Common Stock issued and outstanding other than Dissenting Shareholder Shares (as defined in the Merger Agreement) and shares of Avista Corp. Common Stock that are owned by Hydro One, US Parent or Merger Sub or any of their respective subsidiaries, will be converted automatically into the right to receive an amount in cash equal to $53.00, without interest. For further information, see “Note 13 of the Notes to Condensed Consolidated Financial Statements” and Avista Corp.’s Current Report on Form 8-K filed with the SEC on July 19, 2017.
33
Regulatory Matters
General Rate Cases
We regularly review the need for electric and natural gas rate changes in each state in which we provide service. We expect to continue to file for rate adjustments to:
• | seek recovery of operating costs and capital investments, and |
• | seek the opportunity to earn reasonable returns as allowed by regulators. |
With regards to the timing and plans for future filings, the assessment of our need for rate relief and the development of rate case plans takes into consideration short-term and long-term needs, as well as specific factors that can affect the timing of rate filings. Such factors include, but are not limited to, in-service dates of major capital investments and the timing of changes in major revenue and expense items.
Avista Utilities
Washington General Rate Cases
2015 General Rate Cases
In January 2016, we received an order (Order 05) that concluded our electric and natural gas general rate cases that were originally filed with the UTC in February 2015. New electric and natural gas rates were effective on January 11, 2016.
The UTC-approved rates were designed to provide a 1.6 percent, or $8.1 million decrease in electric base revenue, and a 7.4 percent, or $10.8 million increase in natural gas base revenue. The UTC also approved a rate of return (ROR) on rate base of 7.29 percent, with a common equity ratio of 48.5 percent and a 9.5 percent return on equity (ROE).
UTC Order Denying Industrial Customers of Northwest Utilities / Public Counsel Joint Motion for Clarification, UTC Staff Motion to Reconsider and UTC Staff Motion to Reopen Record
On January 19, 2016, the Industrial Customers of Northwest Utilities (ICNU) and the Public Counsel Unit of the Washington State Office of the Attorney General (PC) filed a Joint Motion for Clarification with the UTC. In the Motion for Clarification, ICNU and PC requested that the UTC clarify the calculation of the electric attrition adjustment and the end-result revenue decrease of $8.1 million. ICNU and PC provided their own calculations in their Motion, and suggested that the revenue decrease should have been $19.8 million based on their reading of the UTC’s Order.
On January 19, 2016, the UTC Staff, which is a separate party in the general rate case proceedings from the UTC Advisory Staff, filed a Motion to Reconsider with the UTC. In its Motion to Reconsider, the Staff provided calculations and explanations that suggested that the electric revenue decrease should have been a revenue decrease of $27.4 million instead of $8.1 million, based on its reading of the UTC's Order. Further, on February 4, 2016, the UTC Staff filed a Motion to Reopen Record for the Limited Purpose of Receiving into Evidence Instruction on Use and Application of Staff’s Attrition Model, and sought to supplement the record “to incorporate all aspects of the Company’s Power Cost Update.” Within this Motion, UTC Staff updated its suggested electric revenue decrease to $19.6 million.
None of the parties in their Motions raised issues with the UTC’s decision on the natural gas revenue increase of $10.8 million.
On February 19, 2016, the UTC issued an order (Order 06) denying the Motions summarized above and affirming Order 05, including an $8.1 million decrease in electric base revenue.
PC Petition for Judicial Review
On March 18, 2016, PC filed in Thurston County Superior Court a Petition for Judicial Review of the UTC's Order 05 and Order 06 described above that concluded our 2015 electric and natural gas general rate cases. In its Petition for Judicial Review, PC seeks judicial review of five aspects of Order 05 and Order 06, alleging, among other things, that (1) the UTC exceeded its statutory authority by setting rates for our natural gas and electric services based on amounts for utility plant and facilities that are not "used and useful" in providing utility service to customers; (2) the UTC acted arbitrarily and capriciously in granting an attrition adjustment for our electric operations after finding that the we did not meet the newly articulated standard regarding attrition adjustments; (3) the UTC erred in applying the "end results test" to set rates for our electric operations that are not supported by the record; (4) the UTC did not correct its calculation of our electric rates after significant errors were brought to its attention; and (5) the UTC's calculation of our electric rates lacks substantial evidence.
34
PC is requesting that the Court (1) vacate or set aside portions of the UTC’s orders; (2) identify the errors contained in the UTC’s orders; (3) find that the rates approved in Order 05 and reaffirmed in Order 06 are unlawful and not fair, just and reasonable; (4) remand the matter to the UTC for further proceedings consistent with these rulings, including a determination of our revenue requirement for electric and natural gas services; and (5) find the customers are entitled to a refund.
On April 18, 2016, PC filed an application with the Thurston County Superior Court to certify this matter for review directly by the Court of Appeals, an intermediate appellate court in the State of Washington. The matter was certified on April 29, 2016 and accepted by the Court of Appeals on July 29, 2016. The parties provide briefs to the Court, after which the Court will set the matter for argument. On July 7, 2017, ICNU filed a brief in support of PC. The UTC and Avista Corp. will respond on or before August 7, 2017. Oral argument has been set for September 12, 2017 before the court. A decision from the Court is not expected until late 2017, at the earliest.
In its brief to the Court, the UTC, while defending the use of its attrition adjustment nevertheless requested a partial remand back to the UTC to reevaluate the implementation of our power cost update as part of the general rate case on appeal, doing so by means of a supplemental evidentiary hearing. The power cost update at issue represents approximately $12.0 million of costs.
The new rates established by Order 05 will continue in effect while the Petition for Judicial Review is being considered. We believe the UTC's Order 05 and Order 06 finalizing the electric and natural gas general rate cases provide a reasonable end result for all parties. If the outcome of the judicial review were to result in an electric rate reduction greater than the decrease ordered by the UTC, it may result in a refund liability to customers of up to $9.5 million, which is net of an approximately $2.5 million refund for Washington electric customers related to the 2016 provision for earnings sharing that we have already accrued.
2016 General Rate Cases
On December 15, 2016, the UTC issued an order related to our Washington electric and natural gas general rate cases that were originally filed with the UTC in February 2016. The UTC order denied the Company's proposed electric and natural gas rate increase requests of $38.6 million and $4.4 million, respectively. Accordingly, our current electric and natural gas retail rates remained unchanged in Washington State, following the order.
Our original requests were based on a proposed ROR of 7.64 percent with a common equity ratio of 48.5 percent and a 9.9 percent ROE.
On December 23, 2016 we filed a Petition for Reconsideration or, in the alternative, Rehearing (Petition) with the UTC related to our 2016 general rate cases. On February 27, 2017, we received an order from the UTC denying our Petition and confirming its previous order in the case. In its order denying the Petition, the UTC generally referred back to its prior findings and conclusions. See the 2016 Form 10-K for a detailed discussion surrounding UTC's prior findings and the information included in our Petition.
We determined that an appeal of the UTC’s decision to the courts would involve a significant amount of uncertainty regarding the level of success of such an appeal, as well as the timing of any value that might come following a process that would take between one and two years. The Company believes greater long-term value can be achieved through focusing on new general rate cases than through appealing the UTC's decision in the courts.
Following the conclusion of the 2016 case, we met with the Commissioners to better understand their concerns and their expectations going forward. The Company also met with members of the Commission Staff and other parties to discuss needs and expectations prior to filing the next general rate case. While these meetings with the Commissioners and Staff were constructive, there can be no assurance as to the outcome of any future general rate case.
2017 General Rate Cases
On May 26, 2017, we filed two requests with the UTC to recover costs related to power supply and system maintenance as well as capital investments made since the last determination of our rate base in the 2015 Washington general rate cases.
The two filings are summarized as follows:
Power Cost Rate Adjustment
The first filing is an electric only power cost rate adjustment that would update and reset power supply costs, effective September 1, 2017. We requested an overall increase in billed electric rates of 2.9 percent (designed to increase annual electric revenues by $15.0 million). The key drivers behind this request are related to the expiration of a capacity sales
35
agreement with another utility and an increase in the price of natural gas to fuel our generating plants. Any new rates resulting from the power cost rate adjustment would expire upon the conclusion of the electric general rate case (discussed in further detail below), if approved.
On June 16, 2017, ICNU filed a Motion with the UTC to dismiss the power cost rate adjustment filing, or in the alternative, consolidate the filing with the pending general rate case filing. The UTC Staff and PC filed responses supporting ICNU’s Motion. We expect the UTC to address the power cost rate adjustment by August 10, 2017, at which time they will either approve or deny the request or indicate additional steps that may be necessary.
General Rate Requests
The second request relates to electric and natural gas general rate cases. We filed three-year rate plans for electric and natural gas and have requested the following for each year (dollars in millions):
Electric | Natural Gas | |||||||||||||
Effective Date | Proposed Revenue Increase | Proposed Base Rate Increase | Proposed Revenue Increase | Proposed Base Rate Increase | ||||||||||
May 1, 2018 (1) | $ | 61.4 | 12.5 | % | $ | 8.3 | 9.3 | % | ||||||
May 1, 2019 (2) | $ | 14.0 | 2.5 | % | $ | 4.2 | 4.4 | % | ||||||
May 1, 2020 (2) | $ | 14.4 | 2.5 | % | $ | 4.4 | 4.4 | % | ||||||
(1) | The $61.4 million electric revenue increase includes the $15.0 million power cost rate adjustment discussed above. |
(2) | As a part of the electric rate plan, we have proposed to update power supply costs through a Power Supply Update, the effects of which would also go into effect on May 1, 2019 and May 1, 2020. The requested revenue increases for 2019 and 2020 do not include any power supply adjustments. |
Our request is based on a proposed ROR of 7.76 percent with a common equity ratio of 50.0 percent and a 9.9 percent ROE.
As a part of the three-year rate plan, if approved, we would not file another general rate case until June 1, 2020, with new rates effective no earlier than May 1, 2021.
The major drivers of these general rate case requests is to recover the costs associated with our capital investments to replace infrastructure that has reached the end of its useful life, as well as respond to the need for reliability and technology investments required to maintain our integrated energy services grid. Among the capital investments included in the filings are:
• | Major hydroelectric investments at the Little Falls and Nine Mile hydroelectric plants. |
• | Generator maintenance at the Kettle Falls biomass plant that will ensure efficient generation and operations. |
• | The ongoing project to systematically replace portions of natural gas distribution pipe in our service area that were installed prior to 1987, as well as replacement of other natural gas service equipment. |
• | Transmission and distribution system and asset maintenance, such as wood pole replacements, feeder upgrades, and substation and transmission line rebuilds to maintain reliability for our customers. |
• | Technology upgrades that support necessary business processes and operational efficiencies that allow us to effectively manage the utility and serve customers. |
• | A refresh of the customer-facing website, providing relevant information, greater accessibility on mobile devices, easier navigation, and a streamlined payment experience. |
The UTC has up to 11 months to review the general rate case filings and issue a decision.
AMI Project in Washington State
In March 2016, the UTC granted our Petition for an Accounting Order to defer and include in a regulatory asset the undepreciated value of our existing Washington electric meters for the opportunity for later recovery. This accounting treatment is related to our plans to replace approximately 253,000 of our existing electric meters with new two-way digital meters and the related software and support services through our AMI project in Washington State. Replacement of the meters is expected to
36
begin in the second half of 2018. As of June 30, 2017, the estimated undepreciated value for the existing meters is $19.8 million.
In April 2017, we identified approximately 70,000 natural gas encoder receiver transmitters (ERTs) that will need to be replaced as part of the AMI project. In May 2017, we filed a Petition with the UTC requesting deferred accounting treatment for the investment costs associated with the Washington AMI project, including components such as meter communication networks, information management systems and the natural gas ERTs. The Petition requests the deferral and inclusion in a regulatory asset of all AMI investment costs over the multi-year implementation period, until the costs can be reviewed for prudence in a future regulatory proceeding and recovered in retail rates. The undepreciated value of the natural gas ERTS is approximately $3.7 million.
Idaho General Rate Cases
2016 General Rate Case
In December 2016, the IPUC approved a settlement agreement between us and other parties in our electric general rate case, concluding our Idaho electric general rate case originally filed in May 2016. New rates took effect on January 1, 2017 under the settlement agreement. We did not file a natural gas general rate case in 2016.
The settlement agreement increased annual electric base rates by 2.6 percent (designed to increase annual electric revenues by $6.3 million). The settlement revenue increase is based on a ROR of 7.58 percent with a common equity ratio of 50 percent and a 9.5 percent ROE.
In addition to the agreed upon increase in electric revenues to recover costs primarily driven by our increased capital investments in infrastructure to serve customers, the settlement agreement includes the continued recovery of approximately $4.1 million in costs related to the Palouse Wind Project through the Power Cost Adjustment (PCA) mechanism rather than through base rates.
In our original request we requested an overall increase in base electric rates of 6.3 percent (designed to increase annual electric revenues by $15.4 million), effective January 1, 2017.
Our original request was based on a proposed ROR of 7.78 percent with a common equity ratio of 50 percent and a 9.9 percent ROE.
2017 General Rate Cases
On June 9, 2017, we filed electric and natural gas general rate requests with the IPUC to recover increased power supply costs and capital investments made since the last determination of our rate base in the 2016 Idaho electric general rate case and the 2015 Idaho natural gas general rate case.
We filed two-year rate plans for electric and natural gas and have requested the following for each year (dollars in millions):
Electric | Natural Gas | |||||||||||||
Effective Date | Proposed Revenue Increase | Proposed Base Rate Increase | Proposed Revenue Increase | Proposed Base Rate Increase | ||||||||||
January 1, 2018 | $ | 18.6 | 7.5 | % | $ | 3.5 | 8.8 | % | ||||||
January 1, 2019 (1) | $ | 9.9 | 3.7 | % | $ | 2.1 | 5.0 | % | ||||||
(1) | We are not proposing to update base power supply costs for year two of the rate plan, but rather have any differences flow through the PCA mechanism. |
Our requests are based on a proposed ROR of 7.81 percent with a common equity ratio of 50.0 percent and a 9.9 percent ROE.
As a part of the two-year rate plan, if approved, we would not file a new general rate case for a new rate plan to be effective prior to January 1, 2020.
The major drivers of these general rate case requests is to recover the costs associated with our capital investments to replace infrastructure that has reached the end of its useful life, as well as respond to the need for reliability and technology investments required to maintain our integrated energy services grid. Among the capital investments included in the filings are:
• | Generator maintenance at the Kettle Falls biomass plant that will ensure efficient generation and operations. |
• | The ongoing project to systematically replace portions of natural gas distribution pipe in our service area that were installed prior to 1987, as well as replacement of other natural gas service equipment. |
37
• | Transmission and distribution system and asset maintenance, such as wood pole replacements, feeder upgrades, and substation and transmission line rebuilds to maintain reliability for our customers. |
• | Technology upgrades that support necessary business processes and operational efficiencies that allow us to effectively manage the utility and serve customers. |
• | A refresh of the customer-facing website, providing relevant information, greater accessibility on mobile devices, easier navigation, and a streamlined payment experience. |
A procedural schedule has been agreed to by the parties in the case, and recommended to the IPUC, which would result in an IPUC decision on or before January 1, 2018.
Oregon General Rate Cases
2015 General Rate Case
On February 29, 2016, the OPUC issued a preliminary order (and a final order on March 15, 2016) concluding our natural gas general rate case, which was originally filed with the OPUC in May 2015. The OPUC order approved rates designed to increase overall billed natural gas rates by 4.9 percent (designed to increase annual natural gas revenues by $4.5 million). New rates went into effect on March 1, 2016. The final OPUC order incorporated two partial settlement agreements which were entered into during November 2015 and January 2016.
The OPUC order provides for an overall authorized ROR of 7.46 percent with a common equity ratio of 50 percent and a 9.4 percent ROE.
The November 2015 partial settlement agreement, approved by the OPUC, included a provision for the implementation of a decoupling mechanism, similar to the Washington and Idaho mechanisms described below. See further description and a summary of the balances recorded under this mechanism below.
2016 General Rate Case
On May 16, 2017, an all-party settlement agreement was filed with the OPUC, which, if approved by the OPUC, would resolve all issues in the case and new rates would take effect on October 1, 2017.
The settlement proposes that, effective October 1, 2017, we would receive an increase in rates designed to increase annual base revenues by 5.9 percent or $3.5 million. In addition, in the settlement agreement, we agreed to non-recovery of certain utility plant expenditures, which resulted in a write-off of approximately $0.8 million in the second quarter of 2017.
The proposed settlement agreement reflects a 7.35 ROR with a common equity ratio of 50 percent and a 9.4 percent ROE.
Alaska Electric Light and Power Company
Alaska General Rate Case
In September 2016, AEL&P filed an electric general rate case with the RCA. AEL&P was granted a refundable interim base rate increase of 3.86 percent (designed to increase electric revenues by $1.3 million), which took effect in November 2016. AEL&P has also requested a permanent base rate increase of an additional 4.24 percent (designed to increase electric revenues by $1.5 million), which, if approved, could take effect in February 2018. This represents a combined total rate increase of 8.1 percent (designed to increase electric revenues by $2.8 million).
Included in the general rate case are additional annual revenues of $2.9 million from the Greens Creek Mine, which offsets a portion of the rate increase to retail customers that would otherwise occur.
The RCA must rule on permanent rate increase requests within 450 days (approximately 15 months) from the date of filing, unless otherwise extended by consent of the parties. The timeline for the AEL&P general rate case, with the consent of the parties, was extended to February 8, 2018.
The rate request is based largely on the addition of a new backup generation plant (Industrial Blvd. Plant) to rate base.
Avista Utilities
Purchased Gas Adjustments
PGAs are designed to pass through changes in natural gas costs to Avista Utilities' customers with no change in gross margin or net income. In Oregon, we absorb (cost or benefit) 10 percent of the difference between actual and projected gas costs included in retail rates for supply that is not hedged. Total net deferred natural gas costs among all jurisdictions were a liability of $29.0 million as of June 30, 2017 and a liability of $30.8 million as of December 31, 2016. These balances represent amounts due to customers.
38
Power Cost Deferrals and Recovery Mechanisms
The ERM is an accounting method used to track certain differences between Avista Utilities' actual power supply costs, net of wholesale sales and sales of fuel, and the amount included in base retail rates for our Washington customers and defer these differences (over the $4.0 million deadband and sharing bands) for future surcharge or rebate to customers. See the 2016 Form 10-K for a full discussion of the mechanics of the ERM and the various sharing bands. Total net deferred power costs under the ERM was a liability of $23.5 million as of June 30, 2017, compared to a liability of $21.3 million as of December 31, 2016. These deferred power cost balances represent amounts due to customers.
Avista Utilities has a PCA mechanism in Idaho that allows us to modify electric rates on October 1 of each year with IPUC approval. Under the PCA mechanism, we defer 90 percent of the difference between certain actual net power supply expenses and the amount included in base retail rates for our Idaho customers for future surcharge or rebate to customers. The October 1 rate adjustments recover or rebate power supply costs deferred during the preceding July-June twelve-month period. Total net power supply costs deferred under the PCA mechanism were a liability of $7.4 million as of June 30, 2017 and a liability of $2.2 million as of December 31, 2016. These deferred power cost balances represent amounts due to customers.
Decoupling and Earnings Sharing Mechanisms
Decoupling is a mechanism designed to sever the link between a utility's revenues and consumers' energy usage. In each of Avista Utilities' jurisdictions, each month Avista Utilities' electric and natural gas revenues are adjusted so as to be based on the number of customers in certain customer rate classes and assumed "normal" kilowatt hour and therm sales, rather than being based on actual kilowatt hour and therm sales. The difference between revenues based on the number of customers and revenues based on actual usage is deferred and either surcharged or rebated to customers beginning in the following year. Only the residential and commercial customer classes are included in our decoupling mechanisms described below.
Washington Decoupling and Earnings Sharing Mechanisms
In Washington, the UTC approved our decoupling mechanisms for electric and natural gas for a five-year period beginning January 1, 2015. Electric and natural gas decoupling surcharge rate adjustments to customers are limited to a 3 percent increase on an annual basis, with any remaining surcharge balance carried forward for recovery in a future period. There is no limit on the level of rebate rate adjustments.
The decoupling mechanisms each include an after-the-fact earnings test. At the end of each calendar year, separate electric and natural gas earnings calculations are made for the calendar year just ended. These earnings tests reflect actual decoupled revenues, normalized power supply costs and other normalizing adjustments. The operation of the Washington decoupling and earnings sharing mechanisms has not changed for the six months ended June 30, 2017. These decoupling and earnings sharing mechanisms are more fully described in the 2016 Form 10-K. See below for a summary of cumulative balances under the decoupling and earnings sharing mechanisms.
Idaho Fixed Cost Adjustment (FCA) and Earnings Sharing Mechanisms
In Idaho, the IPUC approved the implementation of FCAs for electric and natural gas (similar in operation and effect to the Washington decoupling mechanisms) for an initial term of three years, beginning January 1, 2016.
For the period 2013 through 2015, we had an after-the-fact earnings test such that if Avista Corp., on a consolidated basis for electric and natural gas operations in Idaho, earned more than a 9.8 percent ROE, we were required to share with customers 50 percent of any earnings above the 9.8 percent. This after-the-fact earnings test was discontinued, effective January 1, 2016, as part of the settlement of our 2015 Idaho electric and natural gas general rates cases. See below for a summary of cumulative balances under the decoupling and earnings sharing mechanisms.
Oregon Decoupling Mechanism
In February 2016, the OPUC approved the implementation of a decoupling mechanism for natural gas, similar to the Washington and Idaho mechanisms described above. The decoupling mechanism became effective on March 1, 2016. There will be an opportunity for interested parties to review the mechanism and recommend changes, if any, by September 2019. An earnings review is conducted on an annual basis, which is filed by us with the OPUC on or before June 1 of each year for the prior calendar year. In the annual earnings review, if we earn more than 100 basis points above our allowed return on equity, one-third of the earnings above the 100 basis points would be deferred and later returned to customers. See below for a summary of cumulative balances under the decoupling and earnings sharing mechanisms.
39
Cumulative Decoupling and Earnings Sharing Mechanism Balances
As of June 30, 2017 and December 31, 2016, we had the following cumulative balances outstanding related to decoupling and earnings sharing mechanisms in our various jurisdictions (dollars in thousands):
June 30, | December 31, | ||||||
2017 | 2016 | ||||||
Washington | |||||||
Decoupling surcharge | $ | 24,031 | $ | 30,408 | |||
Provision for earnings sharing rebate | (5,860 | ) | (5,113 | ) | |||
Idaho | |||||||
Decoupling surcharge | $ | 6,345 | $ | 8,292 | |||
Provision for earnings sharing rebate | (3,731 | ) | (5,184 | ) | |||
Oregon | |||||||
Decoupling surcharge (rebate) | $ | (19 | ) | $ | 2,021 | ||
See "Results of Operations - Avista Utilities" for further discussion of the amounts recorded to operating revenues in 2017 and 2016 related to the decoupling and earnings sharing mechanisms.
Results of Operations - Overall
The following provides an overview of changes in our Condensed Consolidated Statements of Income. More detailed explanations are provided, particularly for operating revenues and operating expenses, in the business segment discussions (Avista Utilities, AEL&P, and the other businesses) that follow this section.
The balances included below for utility operations reconcile to the Condensed Consolidated Statements of Income.
Three months ended June 30, 2017 compared to the three months ended June 30, 2016
The following graph shows the total change in net income attributable to Avista Corp. shareholders for the second quarter of 2016 to the second quarter of 2017, as well as the various factors that caused such change (dollars in millions):
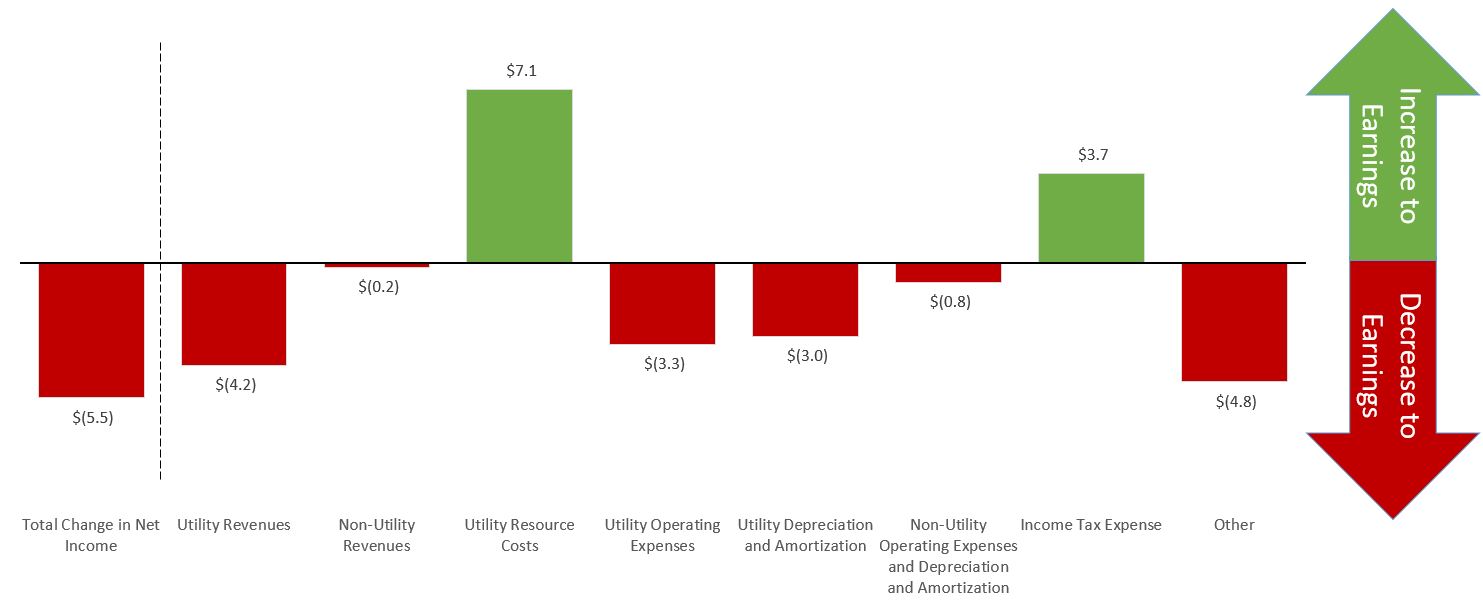
Utility revenues decreased due to a decrease at Avista Utilities, partially offset by an increase at AEL&P. Avista Utilities' revenues decreased primarily due to a decrease in electric and natural gas wholesale sales and a change in the electric provision for earnings sharing. These revenue decreases were partially offset by an electric general rate increase in Idaho, a natural gas general rate increase in Oregon and higher retail electric and natural gas heating loads due to customer growth and weather that was cooler than the prior year. There were electric decoupling surcharges during both the second quarter of 2017 and 2016 and natural gas decoupling surcharges during the second quarter of 2016, but there was a natural gas decoupling rebate during the second quarter of 2017. The surcharges were larger in 2016 because weather was warmer than normal during that period. AEL&P's revenues increased primarily due to a general rate increase and higher retail heating loads due to weather that was cooler than the prior year. There was also a slight increase in the number of customers at AEL&P.
Utility resource costs decreased due to a decrease at Avista Utilities, partially offset by a slight increase at AEL&P. Avista
40
Utilities' electric resource costs decreased due to a decrease in purchased power, resulting from a decrease in volumes and a decrease in wholesale prices, as well as a decrease in fuel for generation resulting from higher hydroelectric generation and lower thermal generation.
The increase in utility other operating expenses was due to an increase at Avista Utilities and a slight increase at AEL&P. The increase at Avista Utilities' was the result of an increase in generation, transmission and distribution maintenance costs, as well as a write-off in Oregon of utility plant associated with a general rate case settlement. There were also merger transaction costs incurred during the second quarter of 2017, which are not being passed through to customers. The increased costs were partially offset by decreases in pension, other postretirement benefit and medical expenses.
Utility depreciation and amortization increased due to additions to utility plant.
Non-utility other operating expenses increased primarily due to renovation expenses and increased compliance costs at one of our subsidiaries.
Income taxes decreased due to a decrease in income before income taxes. Our effective tax rate was 37.5 percent for the second quarter of 2017 compared to 38.0 percent for the second quarter of 2016.
Other was primarily related to an increase in interest expense, due to additional debt being outstanding during 2017 as compared to 2016 and partially due to an increase in the overall interest rate. Also, there was an increase in utility taxes other than income taxes primarily due to revenue related taxes and property taxes. Lastly, there was an increase in losses on investments at our subsidiaries.
Six months ended June 30, 2017 compared to the six months ended June 30, 2016
The following graph shows the total change in net income attributable to Avista Corp. shareholders for the six months ended June 30, 2016 to the six months ended June 30, 2017, as well as the various factors that caused such change (dollars in millions):
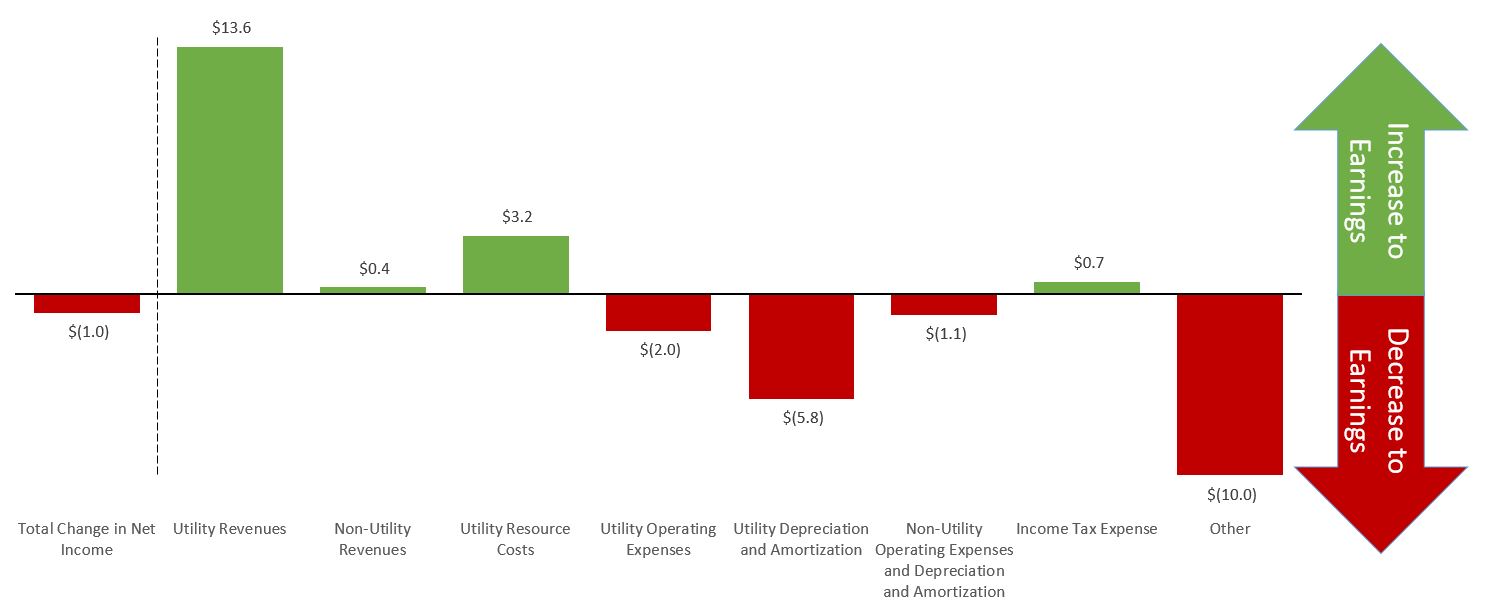
Utility revenues increased due to increases at both Avista Utilities and AEL&P. Avista Utilities' revenues increased primarily due to an electric general rate increase in Idaho, a natural gas general rate increase in Oregon and higher retail electric and natural gas heating loads due to customer growth and weather that was cooler than the prior year. The increased utility revenues were partially offset by decoupling rebates in the first half of 2017 due to weather that was cooler than normal. This compares to decoupling surcharges during the first half of 2016. These increases were partially offset by a change in the electric provision for earnings sharing, which increased revenue during 2016 (due to a reduction to the 2015 provisions in Washington and Idaho recorded in 2016). AEL&P's revenues increased primarily due to a general rate increase and higher retail heating loads due to weather that was cooler than the prior year.
Utility resource costs decreased due to a decrease at Avista Utilities, partially offset by a slight increase at AEL&P. Avista Utilities' electric resource costs decreased due to a decrease in purchased power, resulting from a decrease in wholesale prices, partially offset by an increase in volumes, and a decrease in fuel for generation resulting from higher hydroelectric generation and lower thermal generation.
The increase in utility other operating expenses was due to an increase at Avista Utilities and a slight increase at AEL&P. The increase at Avista Utilities' was the result of an increase in generation, transmission and distribution maintenance costs, as well
41
as a write-off in Oregon of utility plant associated with a general rate case settlement. There were also merger transaction costs incurred during the second quarter of 2017, which are not being passed through to customers. The increased costs were partially offset by decreases in pension, other postretirement benefit and medical expenses.
Utility depreciation and amortization increased due to additions to utility plant.
Non-utility other operating expenses increased primarily due to renovation expenses and increased compliance costs at one of our subsidiaries.
Income taxes decreased primarily due to a decrease in income before income taxes. Our effective tax rate was 35.6 percent for the first six months of 2017 and 2016.
Other was primarily related to an increase in interest expense, due to additional debt being outstanding during 2017 as compared to 2016 and partially due to an increase in the overall interest rate. Also, there was an increase in utility taxes other than income taxes primarily due to revenue related taxes and property taxes. Lastly, there was an increase in losses on investments at our subsidiaries.
Non-GAAP Financial Measures
The following discussion for Avista Utilities includes two financial measures that are considered “non-GAAP financial measures,” electric gross margin and natural gas gross margin. In the AEL&P section, we include a discussion of electric gross margin, which is also a non-GAAP financial measure.
Generally, a non-GAAP financial measure is a numerical measure of a company's financial performance, financial position or cash flows that excludes (or includes) amounts that are included (excluded) in the most directly comparable measure calculated and presented in accordance with GAAP. The presentation of electric gross margin and natural gas gross margin is intended to supplement an understanding of operating performance. We use these measures to determine whether the appropriate amount of revenue is being collected from our customers to allow for the recovery of energy resource costs and operating costs, as well as to analyze how changes in loads (due to weather, economic or other conditions), rates, supply costs and other factors impact our results of operations. In addition, we present electric and natural gas gross margin separately below for Avista Utilities since each business has different cost sources, cost recovery mechanisms and jurisdictions, such that separate analysis is beneficial. These measures are not intended to replace income from operations as determined in accordance with GAAP as an indicator of operating performance. The calculations of electric and natural gas gross margins are presented below.
Results of Operations - Avista Utilities
Three months ended June 30, 2017 compared to the three months ended June 30, 2016
The following table presents Avista Utilities' operating revenues, resource costs and resulting gross margin for the three months ended June 30 (dollars in thousands):
Electric | Natural Gas | Intracompany | Total | ||||||||||||||||||||||||||||
2017 | 2016 | 2017 | 2016 | 2017 | 2016 | 2017 | 2016 | ||||||||||||||||||||||||
Operating revenues | $ | 230,558 | $ | 234,791 | $ | 80,430 | $ | 80,955 | $ | (14,241 | ) | $ | (13,105 | ) | $ | 296,747 | $ | 302,641 | |||||||||||||
Resource costs | 69,427 | 73,350 | 44,275 | 46,362 | (14,241 | ) | (13,105 | ) | 99,461 | 106,607 | |||||||||||||||||||||
Gross margin | $ | 161,131 | $ | 161,441 | $ | 36,155 | $ | 34,593 | $ | — | $ | — | $ | 197,286 | $ | 196,034 | |||||||||||||||
The gross margin on electric sales decreased $0.3 million and the gross margin on natural gas sales increased $1.6 million in the second quarter of 2017 compared to the second quarter of 2016. The slight decrease in electric gross margin was primarily due to a change in the provision for earnings sharing (which reduced electric gross margin by $2.0 million for 2017 as compared to 2016), mostly offset by a general rate increase in Idaho, customer growth and lower resource costs. For the second quarter of 2017, we had a $0.6 million pre-tax benefit under the ERM in Washington, compared to a $0.2 million pre-tax expense for the second quarter of 2016. For the full year of 2017, we expect to be in an expense position under the ERM within the $4 million deadband because power supply costs were not reset for 2017 since our 2016 request for a general electric rate increase in Washington was denied. If power supply costs are reset in our Power Cost Rate Adjustment request, we would expect to be in a benefit position under the ERM within the $4 million deadband for the full year of 2017. See further discussion of the Washington order in "Item 2. Management's Discussion and Analysis – Regulatory Matters."
The increase in natural gas gross margin was primarily due to a general rate increase in Oregon and customer growth.
Intracompany revenues and resource costs represent purchases and sales of natural gas between our natural gas distribution operations and our electric generation operations (as fuel for our generation plants). These transactions are eliminated in the presentation of total results for Avista Utilities and in the condensed consolidated financial statements but are included in the separate results for electric and natural gas presented below.
42
The following graphs present Avista Utilities' utility electric operating revenues and megawatt-hour (MWh) sales for the three months ended June 30 (dollars in millions and MWhs in thousands):
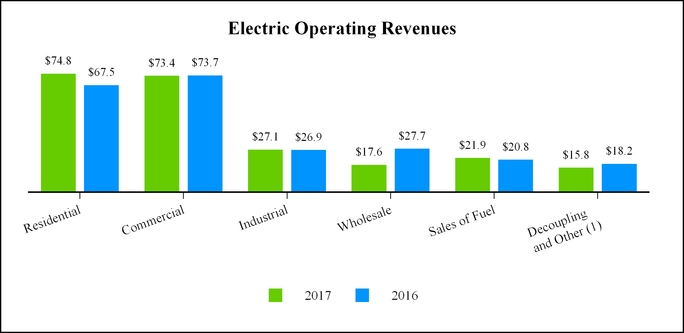
(1) | This balance includes public street and highway lighting, which is considered part of retail electric revenues and it also includes revenues and rebates from decoupling. |
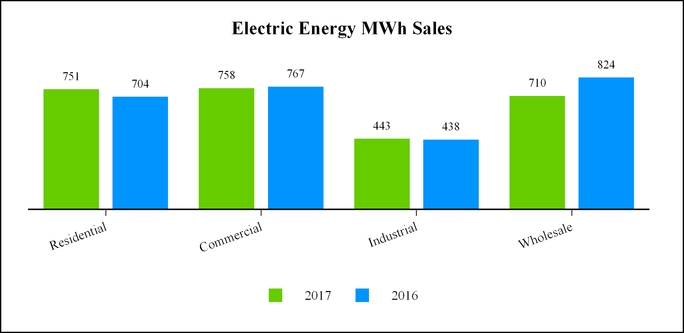
43
The following table presents Avista Utilities' decoupling and customer earnings sharing mechanisms by jurisdiction that are reflected in utility electric operating revenues for the three months ended June 30 (dollars in thousands):
Electric Operating Revenues | |||||||
2017 | 2016 | ||||||
Washington | |||||||
Decoupling surcharge | $ | 3,661 | $ | 4,553 | |||
Provision for earnings sharing (1) | (130 | ) | 1,119 | ||||
Idaho | |||||||
Decoupling surcharge | $ | 862 | $ | 2,651 | |||
Provision for earnings sharing (2) | n/a | 711 | |||||
(1) | The provision for earnings sharing in Washington for the second quarter of 2017 represents an adjustment of the 2016 provision for earnings sharing. We are not expecting a provision for earnings sharing in Washington relating to 2017 earnings. The provision for earnings sharing in Washington in the second quarter of 2016 resulted from a $1.2 million reduction in the 2015 provision for earnings sharing (which increased 2016 revenues), partially offset by a $0.1 million provision for the second quarter of 2016. |
(2) | The provision for earnings sharing in Idaho in the second quarter of 2016 resulted from a reduction in the 2015 provision for earnings sharing (which increased 2016 revenues). Beginning in 2016 there is no longer an earnings sharing mechanism in Idaho. |
Total electric revenues decreased $4.2 million for the second quarter of 2017 as compared to the second quarter of 2016 primarily reflecting the following:
• | a $7.0 million increase in retail electric revenue due to an increase in total MWhs sold (increased revenues $3.8 million) and an increase in revenue per MWh (increased revenues $3.2 million). |
◦ | The increase in total retail MWhs sold was the result of weather that was cooler than the prior year (which increased electric heating loads, partially offset by a decrease in cooling loads), as well as customer growth. Compared to the second quarter of 2016, residential electric use per customer increased 6 percent and commercial use per customer decreased 2 percent. Heating degree days in Spokane were 12 percent below normal, but 45 percent above the second quarter of 2016. Cooling degree days in Spokane were 54 percent above normal, but 12 percent below the second quarter of 2016. |
◦ | The increase in revenue per MWh was primarily due to a general rate increase in Idaho and a greater portion of retail revenues from residential customers in the second quarter of 2017. |
• | a $10.1 million decrease in wholesale electric revenues due to a decrease in sales prices (decreased revenues $7.2 million) and a decrease in sales volumes (decreased revenues $2.9 million). The fluctuation in volumes and prices was primarily the result of our optimization activities. |
• | a $1.1 million increase in sales of fuel due to an increase in sales of natural gas fuel as part of thermal generation resource optimization activities. For the second quarter of 2017, $5.3 million of these sales were made to our natural gas operations and are included as intracompany revenues and resource costs. For the second quarter of 2016, $8.0 million of these sales were made to our natural gas operations. |
• | a $2.7 million decrease in electric revenue due to decoupling. Weather was generally warmer than normal in both periods, which resulted in decoupling surcharges for both the second quarter of 2017 and 2016; however, the surcharges were larger during 2016 since the weather differed more from normal in 2016 than it did in 2017. Decoupling mechanisms are not impacted by fluctuations in weather compared to prior year, they are only impacted by weather fluctuations as compared to normal weather. |
44
The following graphs present our utility natural gas operating revenues and therms delivered for the three months ended June 30 (dollars in millions and therms in thousands):
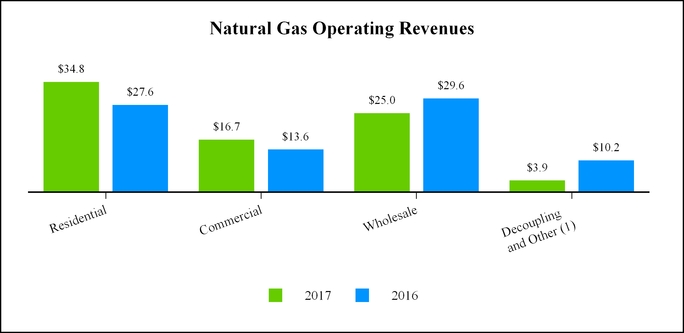
(1) | This balance includes interruptible and industrial revenues, which are considered part of retail natural gas revenues and it also includes revenues and rebates from decoupling. |
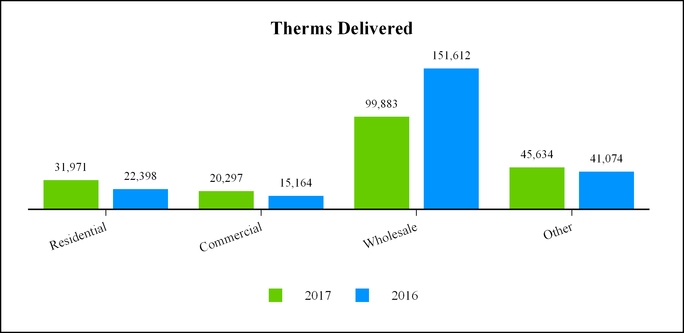
45
The following table presents Avista Utilities' decoupling and customer earnings sharing mechanisms by jurisdiction that are reflected in utility natural gas operating revenues for the three months ended June 30 (dollars in thousands):
Natural Gas Operating Revenues | |||||||
2017 | 2016 | ||||||
Washington | |||||||
Decoupling surcharge | $ | 30 | $ | 3,595 | |||
Provision for earnings sharing | (617 | ) | (320 | ) | |||
Idaho | |||||||
Decoupling surcharge (rebate) | $ | (106 | ) | $ | 589 | ||
Oregon | |||||||
Decoupling surcharge (rebate) | $ | (121 | ) | $ | 1,690 | ||
Total natural gas revenues decreased $0.5 million for the second quarter of 2017 as compared to the second quarter of 2016 primarily reflecting the following:
• | a $10.3 million increase in natural gas retail revenues due an increase in volumes (increased revenues $14.4 million), partially offset by lower retail rates (decreased revenues $4.1 million). |
◦ | We sold more retail natural gas in the second quarter of 2017 as compared to the second quarter of 2016 due to weather that was cooler than the prior year. Compared to the second quarter of 2016, residential natural gas use per customer increased 39 percent and commercial use per customer increased 33 percent. Heating degree days in Spokane were 12 percent below normal, but 45 percent above the second quarter of 2016. Heating degree days in Medford were 11 percent below normal, but 60 percent above the second quarter of 2016. |
◦ | Lower retail rates were due to PGAs, partially offset by a general rate increase in Oregon. |
• | a $4.7 million decrease in wholesale natural gas revenues due to a decrease in volumes (decreased revenues $13.0 million), partially offset by an increase in market prices (increased revenues $8.3 million). In the second quarter of 2017, $9.0 million of these sales were made to our electric generation operations and are included as intracompany revenues and resource costs. In the second quarter of 2016, $5.1 million of these sales were made to our electric generation operations. Differences between revenues and costs from sales of resources in excess of retail load requirements and from resource optimization are accounted for through the PGA mechanisms. |
• | a $6.1 million decrease in natural gas revenue due to decoupling. Weather was generally warmer than normal during the second quarter 2017; however, due to the shape of the normal usage curve for natural gas in the decoupling mechanism, this resulted in a small rebate during the second quarter in Idaho and Oregon and a small net surcharge in Washington. This compares to significant decoupling surcharges in the second quarter of 2016. Decoupling mechanisms are not impacted by fluctuations in weather compared to prior year, they are only impacted by weather fluctuations as compared to normal weather. |
The following table presents our average number of electric and natural gas retail customers for the three months ended June 30:
Electric Customers | Natural Gas Customers | ||||||||||
2017 | 2016 | 2017 | 2016 | ||||||||
Residential | 333,465 | 329,551 | 306,238 | 299,860 | |||||||
Commercial | 42,074 | 41,732 | 35,197 | 34,867 | |||||||
Interruptible | — | — | 38 | 37 | |||||||
Industrial (1) | 1,328 | 1,346 | 250 | 255 | |||||||
Public street and highway lighting | 558 | 559 | — | — | |||||||
Total retail customers | 377,425 | 373,188 | 341,723 | 335,019 | |||||||
(1) | The decrease in electric industrial customers as compared to the second quarter of 2016 is primarily related to a decrease in Washington irrigation customers. |
46
The following graphs present our utility resource costs for the three months ended June 30 (dollars in millions):
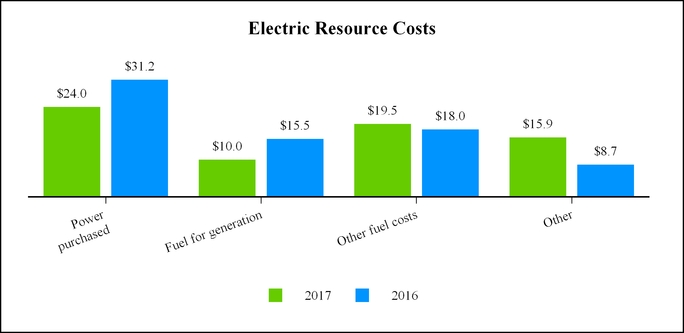
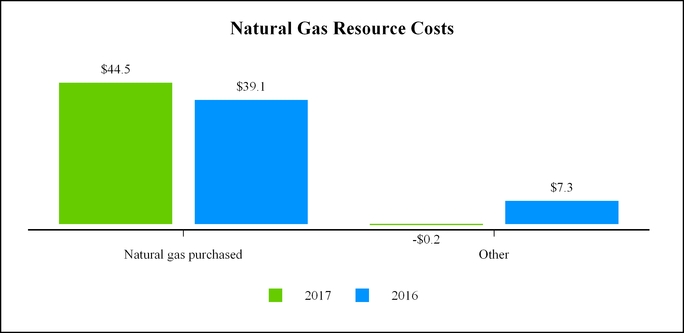
Total resource costs in the graphs above include intracompany resource costs of $14.2 million and $13.1 million for the three months ended June 30, 2017 and June 30, 2016, respectively.
Total electric resource costs decreased $3.9 million for the second quarter of 2017 as compared to the second quarter of 2016 reflecting the following:
• | a $7.3 million decrease in purchased power due to a decrease in the volume of power purchases (decreased costs $1.1 million) and a decrease in wholesale prices (decreased costs $6.2 million). The fluctuation in volumes and prices was primarily the result of our optimization activities during the quarter. |
• | a $5.5 million decrease in fuel for generation primarily due to a decrease in thermal generation (due in part to increased hydroelectric generation). |
• | a $1.5 million increase in other fuel costs. This represents fuel and the related derivative instruments that were purchased for generation but were later sold when conditions indicated that it was more economical to sell the fuel as |
47
part of the resource optimization process. When the fuel or related derivative instruments are sold, that revenue is included in sales of fuel.
• | a $7.0 million increase from amortizations and deferrals of power costs. This change was primarily to result of lower net power supply costs. |
• | a $0.2 million net increase from other regulatory amortizations and other electric resource costs. |
Total natural gas resource costs decreased $2.1 million for the second quarter of 2017 as compared to the second quarter of 2016 reflecting the following:
• | a $5.4 million increase in natural gas purchased due to an increase in the market price of natural gas (increased costs $16.0 million), partially offset by a decrease in total therms purchased (decreased costs $10.6 million). Total therms purchased decreased due to a decrease in wholesale sales, partially offset by an increase in retail sales. |
• | a $0.8 million increase in other regulatory amortizations. |
• | an $8.3 million decrease from amortizations and deferrals of natural gas costs. This reflects lower natural gas prices compared to our authorized PGA rates and the deferral of these lower costs, which occurred in the current quarter for future rebate to customers. |
Six months ended June 30, 2017 compared to the six months ended June 30, 2016
The following table presents our operating revenues, resource costs and resulting gross margin for the six months ended June 30 (dollars in thousands):
Electric | Natural Gas | Intracompany | Total | ||||||||||||||||||||||||||||
2017 | 2016 | 2017 | 2016 | 2017 | 2016 | 2017 | 2016 | ||||||||||||||||||||||||
Operating revenues | $ | 494,276 | $ | 497,593 | $ | 250,642 | $ | 236,365 | $ | (32,790 | ) | $ | (31,170 | ) | $ | 712,128 | $ | 702,788 | |||||||||||||
Resource costs | 160,302 | 167,702 | 134,562 | 129,153 | (32,790 | ) | (31,170 | ) | 262,074 | 265,685 | |||||||||||||||||||||
Gross margin | $ | 333,974 | $ | 329,891 | $ | 116,080 | $ | 107,212 | $ | — | $ | — | $ | 450,054 | $ | 437,103 | |||||||||||||||
The gross margin on electric sales increased $4.1 million and the gross margin on natural gas sales increased $8.9 million. The increase in electric gross margin was primarily due to a general rate increase in Idaho, customer growth and lower resource costs, partially offset by a change in the provision for earnings sharing (which reduced electric gross margin by $3.0 million for 2017 as compared to 2016). For the six months ended June 30, 2017, we recognized a pre-tax benefit of $4.6 million under the ERM in Washington compared to a benefit of $4.2 million for the six months ended June 30, 2016.
The increase in natural gas gross margin was primarily due to a general rate increase in Oregon and customer growth.
Intracompany revenues and resource costs represent purchases and sales of natural gas between our natural gas distribution operations and our electric generation operations (as fuel for our generation plants). These transactions are eliminated in the presentation of total results for Avista Utilities and in the condensed consolidated financial statements but are included in the separate results for electric and natural gas presented below.
48
The following graphs present our utility electric operating revenues and megawatt-hour (MWh) sales for the six months ended June 30 (dollars in millions and MWhs in thousands):
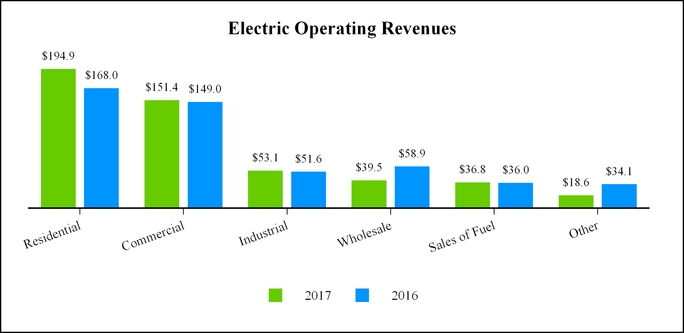
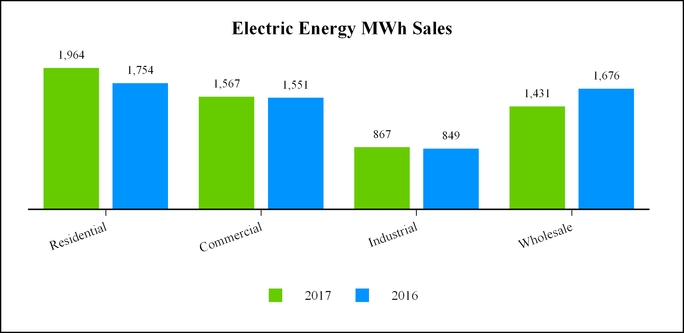
49
The following table presents Avista Utilities' decoupling and customer earnings sharing mechanisms by jurisdiction that are reflected in utility electric operating revenues for the six months ended June 30 (dollars in thousands):
Electric Operating Revenues | |||||||
2017 | 2016 | ||||||
Washington | |||||||
Decoupling surcharge (rebate) | $ | (1,461 | ) | $ | 8,634 | ||
Provision for earnings sharing (1) | (130 | ) | 2,169 | ||||
Idaho | |||||||
Decoupling surcharge (rebate) | $ | (1,096 | ) | $ | 5,031 | ||
Provision for earnings sharing (2) | n/a | 711 | |||||
(1) | The provision for earnings sharing in Washington for the six months ended June 30, 2017 represents an adjustment of the 2016 provision for earnings sharing. We are not expecting a provision for earnings sharing in Washington relating to 2017 earnings. The provision for earnings sharing in Washington in the six months ended June 30, 2016 resulted from a $2.5 million reduction in the 2015 provision for earnings sharing (which increased 2016 revenues), partially offset by $0.3 million provision for the six months ended June 30, 2016. |
(2) | The provision for earnings sharing in Idaho in the six months ended June 30, 2016 resulted from a reduction in the 2015 provision for earnings sharing (which increased 2016 revenues). Beginning in 2016 there is no longer an earnings sharing mechanism in Idaho. |
(n/a) | This mechanism did not exist during this time period. |
Total electric revenues decreased $3.3 million for the six months ended June 30, 2017 as compared to the six months ended June 30, 2016 primarily reflecting the following:
• | a $30.6 million increase in retail electric revenue due to an increase in total MWhs sold (increased revenues $22.2 million) and an increase in revenue per MWh (increased revenues $8.4 million). |
◦ | The increase in total retail MWhs sold was the result of weather that was cooler than the prior year (which increased electric heating loads, partially offset by a decrease in cooling loads), as well as customer growth. Compared to the six months ended June 30, 2016, residential electric use per customer increased 10.6 percent and commercial use per customer increased 0.1 percent. Heating degree days in Spokane were 6 percent above normal and 29 percent above the first six months of 2016. Year-to-date 2016 cooling degree days were 54 percent above normal (mostly in June). However, cooling degree days were 12 percent below the prior year. |
◦ | The increase in revenue per MWh was primarily due to a general rate increase in Idaho and a greater portion of retail revenues from residential customers in 2017. |
• | a $19.4 million decrease in wholesale electric revenues due to a decrease in sales volumes (decreased revenues $6.8 million) and a decrease in sales prices (decreased revenues $12.6 million). The fluctuation in volumes and prices was primarily the result of our optimization activities. |
• | a $0.8 million increase in sales of fuel due to an increase in sales of natural gas fuel as part of thermal generation resource optimization activities. For the six months ended June 30, 2017, $13.3 million of these sales were made to our natural gas operations and are included as intracompany revenues and resource costs. For the six months ended June 30, 2016, $16.3 million of these sales were made to our natural gas operations. |
• | a $16.2 million decrease in electric revenue due to decoupling. For the year-to-date, weather was overall cooler than normal in 2017, which resulted in decoupling rebates for the first half of 2017. Weather was warmer than normal in the first half of 2016, which resulted in significant decoupling surcharges. Decoupling mechanisms are not impacted by fluctuations in weather compared to prior year, they are only impacted by weather fluctuations as compared to normal weather. |
50
The following graphs present our utility natural gas operating revenues and therms delivered for the six months ended June 30 (dollars in millions and therms in thousands):
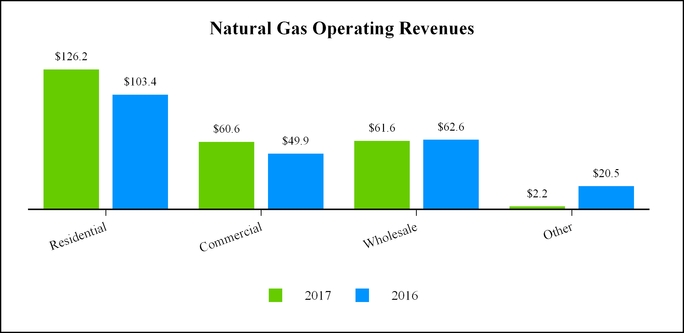
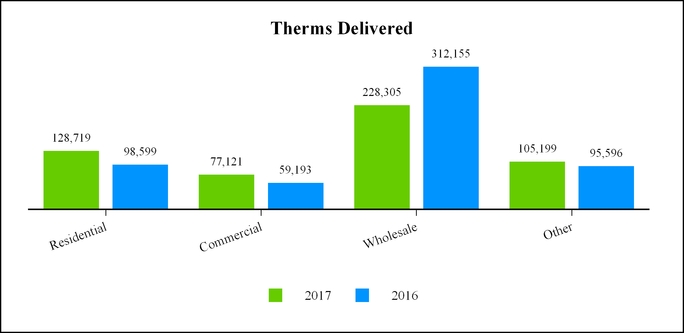
51
The following table presents Avista Utilities' decoupling and customer earnings sharing mechanisms by jurisdiction that are reflected in utility natural gas operating revenues for the six months ended June 30 (dollars in thousands):
Natural Gas Operating Revenues | |||||||
2017 | 2016 | ||||||
Washington | |||||||
Decoupling surcharge (rebate) | $ | (5,221 | ) | $ | 6,766 | ||
Provision for earnings sharing | (617 | ) | (536 | ) | |||
Idaho | |||||||
Decoupling surcharge (rebate) | $ | (883 | ) | $ | 2,126 | ||
Oregon | |||||||
Decoupling surcharge (rebate) | $ | (2,050 | ) | $ | 1,858 | ||
Total natural gas revenues increased $14.3 million for the six months ended June 30, 2017 as compared to the six months ended June 30, 2016 primarily reflecting the following:
• | a $33.5 million increase in natural gas retail revenues due to an increase in volumes (increased revenues $43.3 million), partially offset by lower retail rates (decreased revenues $9.8 million). |
◦ | We sold more retail natural gas in the six months ended June 30, 2017 as compared to the six months ended June 30, 2016 due to cooler weather and customer growth. Compared to the first six months of 2016, residential natural gas use per customer increased 28 percent and commercial use per customer increased 29 percent. Heating degree days in Spokane were 6 percent above normal and 29 percent above the first six months of 2016. Heating degree days in Medford were 3 percent below normal, but 24 percent above the first six months of 2016. |
◦ | Lower retail rates were due to PGAs, partially offset by a general rate increase in Oregon. |
• | a $1.0 million decrease in wholesale natural gas revenues due to a decrease in volumes (decreased revenues $22.6 million), mostly offset by an increase in prices (increased revenues $21.6 million). In the six months ended June 30, 2017, $19.5 million of these sales were made to our electric generation operations and are included as intracompany revenues and resource costs. In the six months ended June 30, 2016, $14.9 million of these sales were made to our electric generation operations. Differences between revenues and costs from sales of resources in excess of retail load requirements and from resource optimization are accounted for through the PGA mechanisms. |
• | an $18.9 million decrease in natural gas revenue due to decoupling. For the year-to-date, weather was overall cooler than normal in 2017, which resulted in decoupling rebates for the first half of 2017. Weather was warmer than normal in the first half of 2016, which resulted in significant decoupling surcharges. Decoupling mechanisms are not impacted by fluctuations in weather compared to prior year, they are only impacted by weather fluctuations as compared to normal weather. |
The following table presents our average number of electric and natural gas retail customers for the six months ended June 30:
Electric Customers | Natural Gas Customers | ||||||||||
2017 | 2016 | 2017 | 2016 | ||||||||
Residential | 333,885 | 329,810 | 306,231 | 299,966 | |||||||
Commercial | 42,070 | 41,698 | 35,217 | 34,874 | |||||||
Interruptible | — | — | 37 | 38 | |||||||
Industrial (1) | 1,327 | 1,347 | 251 | 256 | |||||||
Public street and highway lighting | 562 | 555 | — | — | |||||||
Total retail customers | 377,844 | 373,410 | 341,736 | 335,134 | |||||||
(1) | The decrease in electric industrial customers as compared to the first half of 2016 is primarily related to a decrease in Washington irrigation customers. |
52
The following graphs present our utility resource costs for the six months ended June 30 (dollars in millions):
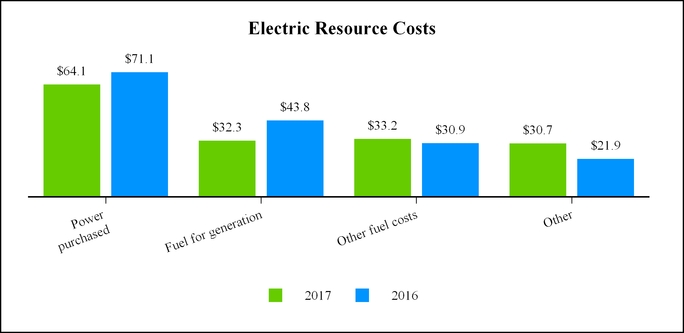
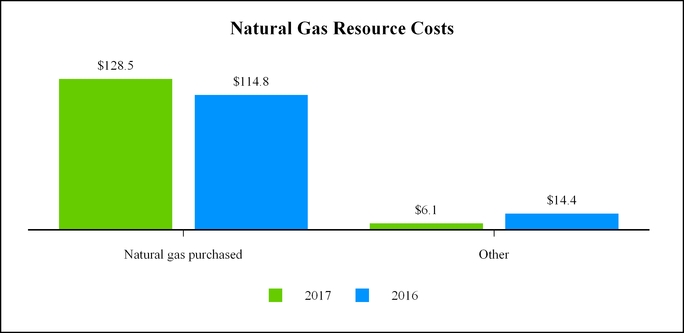
Total resource costs in the graphs above include intracompany resource costs of $32.8 million and $31.2 million for the six months ended June 30, 2017 and June 30, 2016, respectively.
Total electric resource costs decreased $7.4 million for the six months ended June 30, 2017 as compared to the six months ended June 30, 2016 reflecting the following:
• | a $7.0 million decrease in purchased power due to a decrease in wholesale prices (decreased costs $7.5 million), partially offset by an increase in the volume of power purchases (increased costs $0.5 million). The fluctuation in volumes and prices was primarily the result of our optimization activities during the period. |
• | an $11.5 million decrease in fuel for generation primarily due to a decrease in thermal generation (due in part to increased hydroelectric generation). |
• | a $2.3 million increase in other fuel costs. |
• | an $8.2 million increase from amortizations and deferrals of power costs. This change was primarily to result of lower |
53
net power supply costs.
• | a $0.6 million increase in other regulatory amortizations and other electric resource costs. |
Total natural gas resource costs increased $5.4 million for the six months ended June 30, 2017 as compared to the six months ended June 30, 2016 reflecting the following:
• | a $13.7 million increase in natural gas purchased due to an increase in the price of natural gas (increased costs $24.0 million), partially offset by a decrease in total therms purchased (decreased costs $10.3 million). Total therms purchased decreased due to a decrease in wholesale sales, partially offset by an increase in retail sales. |
• | an $11.8 million decrease from amortizations and deferrals of natural gas costs. This reflects lower natural gas prices compared to our authorized PGA rates and the deferral of these lower costs, which occurred in the current period for future rebate to customers. |
• | a $3.5 million increase in other regulatory amortizations. |
Results of Operations - Alaska Electric Light and Power Company
Three months ended June 30, 2017 compared to the three months ended June 30, 2016 and six months ended June 30, 2017 compared to the six months ended June 30, 2016
Net income for AEL&P was $1.7 million for the three months ended June 30, 2017 compared to $1.1 million for the three months ended June 30, 2016. Net income was $5.5 million for the six months ended June 30, 2017 compared to $4.0 million for the six months ended June 30, 2016.
The increase in earnings for both the second quarter and year-to-date was primarily due to an increase in electric gross margin which was $8.7 million for the second quarter of 2017, compared to $7.0 million for the second quarter of 2016. For the year-to-date, electric gross margin was $20.9 million for the six months ended June 30, 2017, compared to $17.0 million for the six months ended June 30, 2016. The increase in electric gross margin was partially offset by an increase in operating expenses and a decrease in equity-related AFUDC due to the construction of an additional back-up generation plant in 2016.
The increase in electric gross margin was primarily related to an interim general rate increase, effective in November 2016, and increases in electric heating loads due to weather that was cooler than the prior year. There were also slight increases in residential and commercial customers. This was partially offset by an increase in resource costs primarily due to purchased power expense, deferred power supply expenses and fuel expense.
While the cooler weather did have some effect on AEL&P revenues during 2017, AEL&P has a relatively stable load profile as it does not have a large population of customers in its service territory with electric heating and cooling requirements; therefore, its revenues are not as sensitive to weather fluctuations as Avista Utilities. However, AEL&P does have higher winter rates for its customers during the peak period of November through May of each year, which drives higher revenues during those periods.
Operating expenses increased primarily due to supplies expense for the new back-up generation plant, which went into service at the end of 2016.
Results of Operations - Other Businesses
Net losses for our other businesses were $1.7 million for the three months ended June 30, 2017 compared to $0.6 million for the three months ended June 30, 2016. Net losses were $1.9 million for the six months ended June 30, 2017 compared to $0.9 million for the six months ended June 30, 2016.
Net losses for the second quarter 2017 and the six months ended June 30, 2017 were primarily related to renovation expenses and increased compliance costs at one of our subsidiaries and additional losses on investments as compared to 2016. These were partially offset by a decrease in corporate costs (including costs associated with exploring strategic opportunities).
Critical Accounting Policies and Estimates
The preparation of our consolidated financial statements in conformity with GAAP requires us to make estimates and assumptions that affect amounts reported in the consolidated financial statements. Changes in these estimates and assumptions are considered reasonably possible and may have a material effect on our consolidated financial statements and thus actual results could differ from the amounts reported and disclosed herein. Our critical accounting policies that require the use of estimates and assumptions were discussed in detail in the 2016 Form 10-K and have not changed materially from that discussion.
54
Liquidity and Capital Resources
Overall Liquidity
Our sources of overall liquidity and the requirements for liquidity have not materially changed in the six months ended June 30, 2017. See the 2016 Form 10-K for further discussion.
As of June 30, 2017, we had $207.3 million of available liquidity under the Avista Corp. committed line of credit and $25.0 million under the AEL&P committed line of credit. With our $400.0 million credit facility that expires in April 2021 and AEL&P's $25.0 million credit facility that expires in November 2019, we believe that we have adequate liquidity to meet our needs for the next 12 months.
Review of Cash Flow Statement
Overall
During the six months ended June 30, 2017, positive cash flows from operating activities were $228.5 million, which included contributions to our pension plan of $14.8 million. Other cash requirements included utility capital expenditures of $177.7 million, dividends of $46.2 million.
Operating Activities
Net cash provided by operating activities was $228.5 million for the six months ended June 30, 2017 compared to $156.0 million for the six months ended June 30, 2016. The increase in net cash provided by operating activities was primarily related to the amount of collateral posted for derivative instruments where we posted $5.5 million in the first half of 2017, compared to $83.5 million posted in the first half of 2016. Our collateral increased in 2016 due to a decrease in the fair value of outstanding interest rate swap derivatives at that time and also due to fewer counterparties accepting letters of credit as collateral. In 2017, more counterparties are accepting letters of credit as collateral rather than cash. In addition for the first half of 2017, we had increased net income (after consideration of non-cash items included in net income) of $235.5 million, compared to $224.0 million in 2016.
We also increased our pension contributions from $8.0 million in the first half of 2016 to $14.8 million in the first half of 2017.
Investing Activities
Net cash used in investing activities was $189.6 million for the six months ended June 30, 2017, compared to $206.6 million for the six months ended June 30, 2016. During the first half of 2017, we paid $177.7 million for utility capital expenditures compared to $182.8 million for the first half of 2016. Also, during the first half of 2017, our subsidiaries invested $10.3 million in equity and property, compared to $7.0 million invested during the first half of 2016.
Financing Activities
Net cash used by financing activities was $34.0 million for the six months ended June 30, 2017, compared to net cash provided of $53.7 million for the six months ended June 30, 2016. We had the following significant transactions:
• | short-term borrowings increased by $16.0 million in the first half of 2017, compared to an increase of $55.0 million in 2016, |
• | cash dividends paid to Avista Corp. shareholders increased to $46.2 million (or $0.715 per share) for the first half of 2017 from $43.3 million (or $0.685 per share) for the first half of 2016, and |
• | issuance of $1.2 million (net of issuance costs) under share-based compensation plans. In 2016, we issued $47.2 million of common stock under sales agency agreements. |
55
Capital Resources
Our consolidated capital structure, including the current portion of long-term debt and short-term borrowings, and excluding noncontrolling interests, consisted of the following as of June 30, 2017 and December 31, 2016 (dollars in thousands):
June 30, 2017 | December 31, 2016 | ||||||||||||
Amount | Percent of total | Amount | Percent of total | ||||||||||
Current portion of long-term debt and capital leases | $ | 277,814 | 7.8 | % | $ | 3,287 | 0.1 | % | |||||
Short-term borrowings | 136,398 | 3.8 | % | 120,000 | 3.4 | % | |||||||
Long-term debt to affiliated trusts | 51,547 | 1.5 | % | 51,547 | 1.5 | % | |||||||
Long-term debt and capital leases | 1,403,064 | 39.5 | % | 1,678,717 | 47.9 | % | |||||||
Total debt | 1,868,823 | 52.6 | % | 1,853,551 | 52.9 | % | |||||||
Total Avista Corporation shareholders’ equity | 1,687,173 | 47.4 | % | 1,648,727 | 47.1 | % | |||||||
Total | $ | 3,555,996 | 100.0 | % | $ | 3,502,278 | 100.0 | % | |||||
Our shareholders’ equity increased $38.4 million during the first six months of 2017 primarily due to net income, partially offset by dividends.
We need to finance capital expenditures and acquire additional funds for operations from time to time. The cash requirements needed to service our indebtedness, both short-term and long-term, reduce the amount of cash flow available to fund capital expenditures, purchased power, fuel and natural gas costs, dividends and other requirements.
Committed Lines of Credit
Avista Corp. has a committed line of credit with various financial institutions in the total amount of $400.0 million that expires in April 2021. As of June 30, 2017, there were $136.0 million of cash borrowings and $56.7 million in letters of credit outstanding (which were primarily issued as collateral for our energy commodity and interest rate swap derivatives), leaving $207.3 million of available liquidity under this line of credit.
The Avista Corp. credit facility contains customary covenants and default provisions, including a covenant which does not permit our ratio of “consolidated total debt” to “consolidated total capitalization” to be greater than 65 percent at any time. As of June 30, 2017, we were in compliance with this covenant with a ratio of 52.6 percent.
AEL&P has a $25.0 million committed line of credit that expires in November 2019. As of June 30, 2017, there were no borrowings or letters of credit outstanding under this committed line of credit.
The AEL&P credit facility contains customary covenants and default provisions including a covenant which does not permit the ratio of “consolidated total debt at AEL&P” to “consolidated total capitalization at AEL&P,” (including the impact of the Snettisham obligation) to be greater than 67.5 percent at any time. As of June 30, 2017, AEL&P was in compliance with this covenant with a ratio of 54.1 percent.
Balances outstanding and interest rates of borrowings (excluding letters of credit) under Avista Corp.'s committed line of credit were as follows as of and for the six months ended June 30 (dollars in thousands):
2017 | 2016 | ||||||
Borrowings outstanding at end of period | $ | 136,000 | $ | 160,000 | |||
Letters of credit outstanding at end of period | $ | 56,703 | $ | 45,795 | |||
Maximum borrowings outstanding during the period | $ | 136,000 | $ | 160,000 | |||
Average borrowings outstanding during the period | $ | 105,157 | $ | 118,832 | |||
Average interest rate on borrowings during the period | 1.67 | % | 1.22 | % | |||
Average interest rate on borrowings at end of period | 1.99 | % | 1.22 | % | |||
There were no borrowings outstanding under AEL&P's committed line of credit as of June 30, 2017 and June 30, 2016.
As of June 30, 2017, Avista Corp. and its subsidiaries were in compliance with all of the covenants of their financing agreements, and none of Avista Corp.'s subsidiaries constituted a “significant subsidiary” as defined in Avista Corp.'s committed line of credit.
Equity Issuances
See "Note 9 of the Notes to Condensed Consolidated Financial Statements" for a discussion of our equity issuances during 2016 and 2017.
56
2017 Liquidity Expectations
In the second half of 2017, we expect to issue up to $90.0 million of long-term debt and up to $70.0 million of common stock in order to fund planned capital expenditures and maintain an appropriate capital structure.
After considering the expected issuances of long-term debt and common stock during 2017, we expect net cash flows from operating activities, together with cash available under our committed line of credit agreements, to provide adequate resources to fund capital expenditures, dividends, and other contractual commitments.
Capital Expenditures
We are making capital investments in generation, transmission and distribution systems to preserve and enhance service reliability for our customers and replace aging infrastructure. Our estimated capital expenditures for 2017, 2018 and 2019 have not materially changed during the six months ended June 30, 2017. See the 2016 Form 10-K for further information.
Off-Balance Sheet Arrangements
As of June 30, 2017, we had $56.7 million in letters of credit outstanding under our $400.0 million committed line of credit, compared to $34.4 million as of December 31, 2016. The increase in outstanding letters of credit is partially related to negotiations with interest rate swap counterparties to accept letters of credit as collateral rather than cash collateral and also due to issuing additional letters of credit as collateral based on changes in the fair value of interest rate swap and energy commodity derivatives during the six months ended June 30, 2017.
Pension Plan
Avista Utilities
In the six months ended June 30, 2017 we contributed $14.8 million to the pension plan and we expect to contribute a total of $22.0 million in 2017. We expect to contribute a total of $110.0 million to the pension plan in the period 2017 through 2021, with annual contributions of $22.0 million over that period.
The final determination of pension plan contributions for future periods is subject to multiple variables, most of which are beyond our control, including changes to the fair value of pension plan assets, changes in actuarial assumptions (in particular the discount rate used in determining the benefit obligation), or changes in federal legislation. We may change our pension plan contributions in the future depending on changes to any variables, including those listed above.
See "Note 4 of the Notes to Condensed Consolidated Financial Statements" for additional information regarding the pension plan.
Contractual Obligations
Our future contractual obligations have not materially changed during the six months ended June 30, 2017. See the 2016 Form 10-K for our contractual obligations.
Environmental Issues and Contingencies
Our environmental issues and contingencies disclosures have not materially changed except for the following during the six months ended June 30, 2017. See the 2016 Form 10-K for all other environmental issues and contingencies.
Climate Change - Federal Regulatory Actions
The Environmental Protection Agency (EPA) released the final rules for the Clean Power Plan (Final CPP) and the Carbon Pollution Standards (Final CPS) on August 3, 2015. The Final CPP and the Final CPS are both intended to reduce the carbon dioxide (CO2) emissions from certain coal-fired and natural gas electric generating units (EGUs). These rules were published in the Federal Register on October 23, 2015 and were immediately challenged via lawsuits by other parties.
In a separate but related rulemaking, the EPA finalized CO2 new source performance standards (NSPS) for new, modified and reconstructed fossil fuel-fired EGUs under CAA section 111(b). These EGUs fall into the same two categories of sources regulated by the Final CPP: steam generating units (also known as “utility boilers and IGCC units”), which primarily burn coal, and stationary combustion turbines, which primarily burn natural gas.
The promulgated and proposed greenhouse gas rulemakings mentioned above have been legally challenged in multiple venues. On February 9, 2016, the U.S. Supreme Court granted a request for stay, halting implementation of the CPP. On March 28, 2017, the Department of Justice has filed a motion with the U.S. Court of Appeals for the District of Columbia Circuit (D.C. Circuit) requesting that the Court hold the cases challenging the CPP in abeyance while the EPA reviews the final rules applicable to existing, as well as to new, modified, and reconstructed electric generating units pursuant to an Executive Order issued by President Trump. The Executive Order also instructed the EPA to review the CPP rule. On April 28, 2017 the D.C.
57
Circuit issued orders to hold the litigation regarding the Clean Air Act §111(d) Clean Power Plan and the §111(b) New Source Performance Standards for power plants in abeyance for a period of 60 days with status reports due from the EPA every 30 days. The EPA has continued to ask the Court to hold the rules in abeyance, and, as a result of its ongoing review of the Final CPP, in June 2017 transmitted a draft proposed rule to the Office of Management and Budget. The contents of that proposed rule have not been made public. Given these ongoing developments, we cannot fully predict the outcome or estimate the extent to which our facilities may be impacted by these regulations at this time. We intend to seek recovery of any costs related to compliance with these requirements through the ratemaking process.
Enterprise Risk Management
The material risks to our businesses were discussed in our 2016 Form 10-K and have not materially changed during the six months ended June 30, 2017. Refer to the 2016 Form 10-K for further discussion of our risks and the mitigation of those risks.
Financial Risk
Our financial risks have not materially changed during the six months ended June 30, 2017. Refer to the 2016 Form 10-K. The financial risks included below are required interim disclosures, even if they have not materially changed from December 31, 2016.
Interest Rate Risk
We use a variety of techniques to manage our interest rate risks. We have an interest rate risk policy and have established a policy to limit our variable rate exposures to a percentage of total capitalization. Additionally, interest rate risk is managed by monitoring market conditions when timing the issuance of long-term debt and optional debt redemptions and establishing fixed rate long-term debt with varying maturities. See "Note 3 of the Notes to Condensed Consolidated Financial Statements" for a summary of our interest rate swap derivatives outstanding as of June 30, 2017 and December 31, 2016.
Credit Risk
Avista Utilities' contracts for the purchase and sale of energy commodities can require collateral in the form of cash or letters of credit. As of June 30, 2017, we had cash deposited as collateral in the amount of $15.9 million and letters of credit of $37.3 million outstanding related to our energy derivative contracts. Price movements and/or a downgrade in our credit ratings could impact further the amount of collateral required. See “Credit Ratings” in the 2016 Form 10-K for further information. For example, in addition to limiting our ability to conduct transactions, if our credit ratings were lowered to below “investment grade” based on our positions outstanding at June 30, 2017, we would potentially be required to post up to $4.1 million of additional collateral. This amount is different from the amount disclosed in “Note 3 of the Notes to Condensed Consolidated Financial Statements” because, while this analysis includes contracts that are not considered derivatives in addition to the contracts considered in Note 3, this analysis takes into account contractual threshold limits that are not considered in Note 3. Without contractual threshold limits, we would potentially be required to post up to $4.7 million of additional collateral.
Under the terms of interest rate swap derivatives that we enter into periodically, we may be required to post cash or letters of credit as collateral depending on fluctuations in the fair value of the instrument. As of June 30, 2017, we had interest rate swap derivatives outstanding with a notional amount totaling $510.0 million and we had deposited cash in the amount of $41.6 million and letters of credit of $13.1 million as collateral for these interest rate swap derivatives. If our credit ratings were lowered to below “investment grade” based on our interest rate swap derivatives outstanding at June 30, 2017, we would be required to post up to $11.2 million of additional collateral.
Energy Commodity Risk
Our energy commodity risks have not materially changed during the six months ended June 30, 2017, except as discussed below. Refer to the 2016 Form 10-K. The following table presents energy commodity derivative fair values as a net asset or (liability) as of June 30, 2017 that are expected to settle in each respective year (dollars in thousands):
Purchases | Sales | ||||||||||||||||||||||||||||||
Electric Derivatives | Gas Derivatives | Electric Derivatives | Gas Derivatives | ||||||||||||||||||||||||||||
Year | Physical (1) | Financial (1) | Physical (1) | Financial (1) | Physical (1) | Financial (1) | Physical (1) | Financial (1) | |||||||||||||||||||||||
Remainder 2017 | $ | (2,485 | ) | $ | 456 | $ | (732 | ) | $ | (14,207 | ) | $ | (70 | ) | $ | 1,995 | $ | (213 | ) | $ | 5,808 | ||||||||||
2018 | (6,880 | ) | (347 | ) | — | (9,416 | ) | (24 | ) | 4,234 | (870 | ) | 3,402 | ||||||||||||||||||
2019 | (4,321 | ) | (1,168 | ) | (280 | ) | (6,160 | ) | (19 | ) | 4,569 | (891 | ) | 1,557 | |||||||||||||||||
2020 | — | — | (357 | ) | (489 | ) | — | — | (1,256 | ) | — | ||||||||||||||||||||
2021 | — | — | — | — | — | — | (840 | ) | — | ||||||||||||||||||||||
Thereafter | — | — | — | — | — | — | — | — | |||||||||||||||||||||||
58
The following table presents energy commodity derivative fair values as a net asset or (liability) as of December 31, 2016 that are expected to be delivered in each respective year (dollars in thousands):
Purchases | Sales | ||||||||||||||||||||||||||||||
Electric Derivatives | Gas Derivatives | Electric Derivatives | Gas Derivatives | ||||||||||||||||||||||||||||
Year | Physical (1) | Financial (1) | Physical (1) | Financial (1) | Physical (1) | Financial (1) | Physical (1) | Financial (1) | |||||||||||||||||||||||
2017 | $ | (4,274 | ) | $ | 1,939 | $ | 97 | $ | (4,005 | ) | $ | (225 | ) | $ | 576 | $ | (2,036 | ) | $ | (3,440 | ) | ||||||||||
2018 | (5,598 | ) | — | — | (2,170 | ) | (33 | ) | 854 | (910 | ) | 709 | |||||||||||||||||||
2019 | (3,123 | ) | — | (235 | ) | (3,732 | ) | (40 | ) | 975 | (927 | ) | 103 | ||||||||||||||||||
2020 | — | — | (266 | ) | (370 | ) | — | — | (1,288 | ) | — | ||||||||||||||||||||
2021 | — | — | — | — | — | — | (869 | ) | — | ||||||||||||||||||||||
Thereafter | — | — | — | — | — | — | — | — | |||||||||||||||||||||||
(1) | Physical transactions represent commodity transactions where we will take or make delivery of either electricity or natural gas; financial transactions represent derivative instruments with delivery of cash in the amount of the benefit or cost but with no physical delivery of the commodity, such as futures, swap derivatives, options, or forward contracts. |
The above electric and natural gas derivative contracts will be included in either power supply costs or natural gas supply costs during the period they are delivered and will be included in the various recovery mechanisms (ERM, PCA, and PGAs), or in the general rate case process, and are expected to eventually be collected through retail rates from customers.
Item 3. Quantitative and Qualitative Disclosures about Market Risk
The information required by this item is set forth in the Enterprise Risk Management section of "Item 2. Management’s Discussion and Analysis of Financial Condition and Results of Operations" and is incorporated herein by reference.
Item 4. Controls and Procedures
Conclusion Regarding the Effectiveness of Disclosure Controls and Procedures
The Company has disclosure controls and procedures (as defined in Rules 13a-15(e) and 15d-15(e) under the Securities Exchange Act of 1934, as amended) (Act) that are designed to ensure that information required to be disclosed in the reports it files or submits under the Act is recorded, processed, summarized and reported on a timely basis. Disclosure controls and procedures include, without limitation, controls and procedures designed to ensure that information required to be disclosed by the Company in the reports that it files or submits under the Act is accumulated and communicated to the Company’s management, including its principal executive and principal financial officers, as appropriate, to allow timely decisions regarding required disclosure. With the participation of the Company’s principal executive officer and principal financial officer, the Company's management evaluated its disclosure controls and procedures as of the end of the period covered by this report. There are inherent limitations to the effectiveness of any system of disclosure controls and procedures, including the possibility of human error and the circumvention or overriding of the controls and procedures. Accordingly, even effective disclosure controls and procedures can only provide reasonable assurance of achieving their control objectives. Based upon this evaluation, the Company’s principal executive officer and principal financial officer have concluded that the Company’s disclosure controls and procedures are effective at a reasonable assurance level as of June 30, 2017.
There have been no changes in the Company's internal control over financial reporting that occurred during the second quarter of 2017 that have materially affected, or are reasonably likely to materially affect, the Company's internal control over financial reporting.
PART II. Other Information
Item 1. Legal Proceedings
See “Note 11 of Notes to Condensed Consolidated Financial Statements” in “Part I. Financial Information Item 1. Condensed Consolidated Financial Statements.”
Item 1A. Risk Factors
Please refer to the 2016 Form 10-K for disclosure of risk factors that could have a significant impact on our results of operations, financial condition or cash flows and could cause actual results or outcomes to differ materially from those discussed in our reports filed with the U.S. Securities and Exchange Commission (including this Quarterly Report on Form 10-Q), and elsewhere. These risk factors have not materially changed from the disclosures provided in the 2016 Form 10-K, except for the following:
59
RISKS RELATED TO THE PROPOSED MERGER WITH HYDRO ONE
The Conditions to the Merger May Not Be Satisfied.
The proposed Merger with Hydro One requires approval by the holders of a majority of Avista Corp.'s outstanding shares of common stock and the receipt of regulatory approvals, including from the FERC, the CFIUS, the FCC, the UTC, IPUC, MPSC, OPUC, and the RCA. Such approvals may not be obtained or the regulatory bodies may seek to impose conditions on the completion of the transaction, which could cause the conditions to the Merger to not be satisfied or which could delay or increase the cost of the transaction. In addition, the failure to satisfy other closing conditions could result in a termination of the Merger Agreement by Hydro One or Avista Corp.
Termination Fee.
Upon termination of the Merger Agreement under certain specified circumstances, we will be required to pay Hydro One a Termination Fee of $103.0 million. We will also be required to pay Hydro One the Termination Fee in the event we sign or consummate any specified alternative transaction within twelve months following the termination of the Merger Agreement under certain circumstances. Any fees due as a result of termination could have a material adverse effect on our results of operations, financial condition, and cash flows.
Market Value of Avista Corp. Common Stock; Access to Capital.
There can be no assurance that the Merger will be consummated. Failure to consummate the Merger could (i) affect the value of Avista Corp.'s common stock, including by reducing it to a level at or below the trading range preceding the announcement of the Merger and (ii) negatively affect our access to and cost of both equity and debt financing.
Additionally, if the Merger is not consummated, we will have incurred significant costs and diverted the time and attention of management. A failure to consummate the Merger may also result in negative publicity, litigation against Avista Corp. or its directors and officers, and a negative impression of Avista Corp. in the financial markets. The occurrence of any of these events individually or in combination could have a material adverse effect on our financial condition, results of operations and stock price.
In addition to these risk factors, see also “Forward-Looking Statements” for additional factors which could have a significant impact on our operations, results of operations, financial condition or cash flows and could cause actual results to differ materially from those anticipated in such statements.
Item 2. Unregistered Sales of Equity Securities and Use of Proceeds
(a) | Not applicable |
(b) | Not applicable |
(c) | Not applicable |
Item 4. Mine Safety Disclosures
Not applicable.
60
Item 6. Exhibits
2.1 | Agreement and Plan of Merger, dated as of July 19, 2017, by and among Avista Corporation, Hydro One Limited, Olympus Holding Corp. and Olympus Corp. (1) | |
12 | Computation of ratio of earnings to fixed charges (2) | |
15 | Letter Re: Unaudited Interim Financial Information (2) | |
31.1 | Certification of Chief Executive Officer (Pursuant to 18 U.S.C. Section 1350, as Adopted Pursuant to Section 302 of the Sarbanes-Oxley Act of 2002) (2) | |
31.2 | Certification of Chief Financial Officer (Pursuant to 18 U.S.C. Section 1350, as Adopted Pursuant to Section 302 of the Sarbanes-Oxley Act of 2002) (2) | |
32 | Certification of Corporate Officers (Furnished Pursuant to 18 U.S.C. Section 1350, as Adopted Pursuant to Section 906 of the Sarbanes-Oxley Act of 2002) (3) | |
101 | The following financial information from the Quarterly Report on Form 10−Q for the period ended June 30, 2017, formatted in XBRL (Extensible Business Reporting Language) and filed electronically herewith: (i) the Condensed Consolidated Statements of Income; (ii) Condensed Consolidated Statements of Comprehensive Income; (iii) the Condensed Consolidated Balance Sheets; (iv) the Condensed Consolidated Statements of Cash Flows; (v) the Condensed Consolidated Statements of Equity; and (vi) the Notes to Condensed Consolidated Financial Statements. (2) | |
(1 | ) | Previously filed as exhibit 2.1 to the registrant's Current Report on Form 8-K, filed as of July 19, 2017 and incorporated herein by reference. |
(2 | ) | Filed herewith. |
(3 | ) | Furnished herewith. |
61
SIGNATURE
Pursuant to the requirements of the Securities Exchange Act of 1934, the registrant has duly caused this report to be signed on its behalf by the undersigned thereunto duly authorized.
AVISTA CORPORATION | |||
(Registrant) | |||
Date: | August 1, 2017 | /s/ Mark T. Thies | |
Mark T. Thies | |||
Senior Vice President, Chief Financial Officer, and Treasurer (Principal Financial Officer) | |||
62