Attached files
| file | filename |
|---|---|
| 8-K - ANNALY CAPITAL MANAGEMENT, INC. 8-K - ANNALY CAPITAL MANAGEMENT INC | a51617141.htm |
Exhibit 99.1

Second Quarter 2017 Investor Presentation August 2, 2017

This presentation, other written or oral communications, and our public documents to which we refer contain or incorporate by reference certain forward-looking statements which are based on various assumptions (some of which are beyond our control) and may be identified by reference to a future period or periods or by the use of forward-looking terminology, such as “may,” “will,” “believe,” “expect,” “anticipate,” “continue,” or similar terms or variations on those terms or the negative of those terms. Actual results could differ materially from those set forth in forward looking statements due to a variety of factors, including, but not limited to, changes in interest rates; changes in the yield curve; changes in prepayment rates; the availability of mortgage-backed securities and other securities for purchase; the availability of financing and, if available, the terms of any financings; changes in the market value of our assets; changes in business conditions and the general economy; our ability to grow our commercial business; our ability to grow our residential mortgage credit business; credit risks related to our investments in credit risk transfer securities, residential mortgage-backed securities and related residential mortgage credit assets, commercial real estate assets and corporate debt; risks related to investments in mortgage servicing rights and ownership of a servicer; our ability to consummate any contemplated investment opportunities; changes in government regulations affecting our business; our ability to maintain our qualification as a REIT for U.S. federal income tax purposes; and our ability to maintain our exemption from registration under the Investment Company Act of 1940, as amended. For a discussion of the risks and uncertainties which could cause actual results to differ from those contained in the forward-looking statements, see “Risk Factors” in our most recent Annual Report on Form 10-K and any subsequent Quarterly Reports on Form 10-Q. We do not undertake, and specifically disclaim any obligation, to publicly release the result of any revisions which may be made to any forward-looking statements to reflect the occurrence of anticipated or unanticipated events or circumstances after the date of such statements, except as required by law.Past performance is no guarantee of future results. There is no guarantee that any investment strategy referenced herein will work under all market conditions. Prior to making any investment decision, you should evaluate your ability to invest for the long-term, especially during periods of downturns in the market. You alone assume the responsibility of evaluating the merits and risks associated with any potential investment or investment strategy referenced herein. To the extent that this material contains reference to any past specific investment recommendations or strategies which were or would have been profitable to any person, it should not be assumed that recommendations made in the future will be profitable or will equal the performance of such past investment recommendations or strategies. Non-GAAP Financial MeasuresThis presentation includes certain non-GAAP financial measures, including core earnings metrics, which are presented both inclusive and exclusive of the premium amortization adjustment (PAA). The Company believes its non-GAAP financial measures are useful for management, investors, analysts, and other interested parties in evaluating the Company’s performance but should not be viewed in isolation and are not a substitute for financial measures computed in accordance with GAAP. In addition, the Company may calculate its non-GAAP metrics, which include core earnings and the PAA, differently than its peers making comparative analysis difficult. Please see the section entitled “Non-GAAP Reconciliations” in the attached Appendix for a reconciliation to the most directly comparable GAAP financial measures. Safe Harbor Notice 2

Overview

Source: Bloomberg, Company filings. Financial data as of June 30, 2017. Market data as of July 31, 2017.Agency assets include to be announced (“TBA”) purchase contracts (market value) and mortgage servicing rights (“MSRs”). Commercial Real Estate (“CRE”) assets are exclusive of consolidated variable interest entities (“VIEs”) associated with B-Piece commercial mortgage-backed securities.Dedicated capital excludes TBA purchase contracts (market value) and non-portfolio related activity and may vary from total stockholders’ equity.Sector rank compares Annaly dedicated capital in each of its four investment groups at June 30, 2017 (adjusted for weighted average sector P/B as of July 31, 2017) to the market capitalization of the companies in each respective sector as of July 31, 2017. Comparative sectors used for Agency, CRE, Residential Credit ranking are their respective sector within the Bloomberg Mortgage REIT Index (“BBREMTG”). The comparative sector used for the MML ranking is the S&P BDC Index. Annaly is a Leading Diversified Capital Manager Agency The Annaly Agency Group invests in Agency Mortgage-Backed Securities (“MBS”) Residential Credit The Annaly Residential Credit Group invests in non-Agency residential mortgage assets within securitized products and whole loan markets Commercial Real Estate (CRE) The Annaly Commercial Real Estate Group (“ACREG”) originates and invests in commercial mortgage loans, securities, and other commercial real estate debt and equity investments Middle Market Lending (MML) The Annaly Middle Market Lending Group (“AMML”) provides financing to private equity backed middle market businesses across the respective capital structures 4 $88.4bn Assets(1)|$10.8bn Capital(2) $2.6bn Assets|$0.9bn Capital(2) $2.0bn Assets(1)|$1.0bn Capital(2) $0.8bn Assets|$0.6bn Capital(2) Sector Rank(3)#1/6 Sector Rank(3)#8/16 Sector Rank(3)#4/11 Sector Rank(3)#15/41 Countercyclical/Defensive Cyclical/Growth Cyclical/Growth Countercyclical/Defensive

Unique Shared Capital Model Agency Residential Credit Commercial Real Estate Middle Market Lending Assets(1) $88.4bn $2.6bn $2.0bn $0.8bn Financing(2) $77.0bn $1.7bn $1.0bn $0.2bn Capital(3)(% of Total) $10.8bn(80%) $0.9bn(7%) $1.0bn(8%) $0.6bn(5%) Levered Return(4) 10-12% 9-12% 8-10% 9-11% Income Stability Fluctuates Fluctuates Stable Stable Book Value Impact Higher Impact Higher Impact Low to Moderate Impact Low Impact Note: Financial data as of June 30, 2017.Agency assets include TBA purchase contracts (market value) accounted for as derivatives and MSRs. CRE assets are exclusive of consolidated VIEs associated with B-Piece commercial mortgage-backed securities.Includes TBA notional outstanding.Dedicated capital excludes TBA purchase contracts (market value) and non-portfolio related activity and may vary from total stockholders’ equity.Levered returns represent levered net interest spread using a blend of products within each sector. Annaly is positioned as a permanent capital solution for the redistribution of MBS, Residential Credit, Commercial Real Estate and Middle Market assets 5
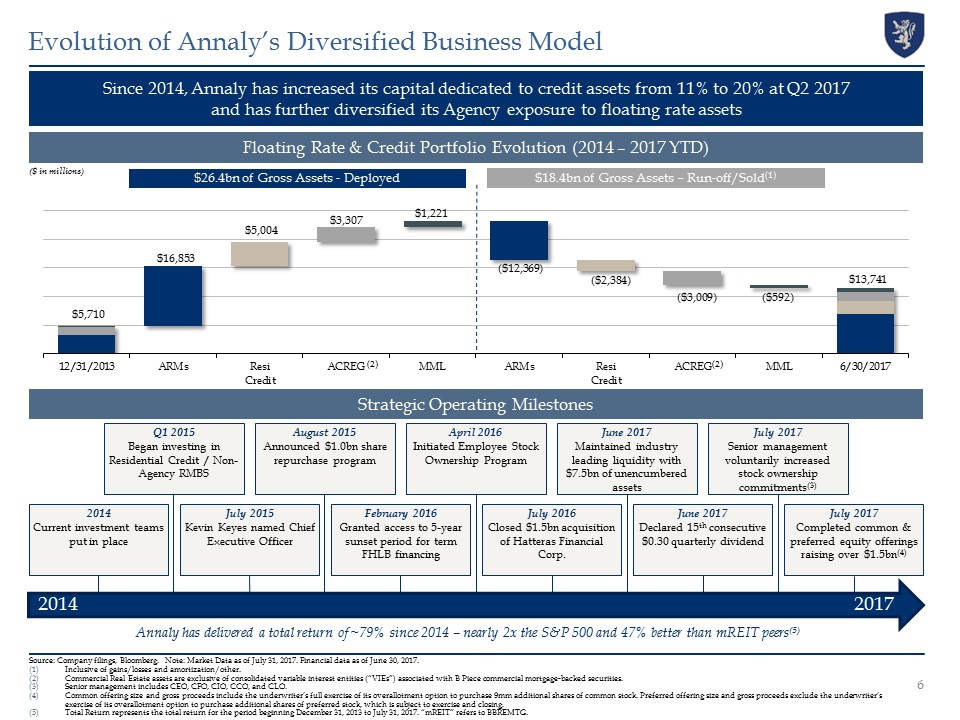
Since 2014, Annaly has increased its capital dedicated to credit assets from 11% to 20% at Q2 2017 and has further diversified its Agency exposure to floating rate assets Floating Rate & Credit Portfolio Evolution (2014 – 2017 YTD) Strategic Operating Milestones Source: Company filings, Bloomberg. Note: Market Data as of July 31, 2017. Financial data as of June 30, 2017.Inclusive of gains/losses and amortization/other. Commercial Real Estate assets are exclusive of consolidated variable interest entities (“VIEs”) associated with B Piece commercial mortgage-backed securities.Senior management includes CEO, CFO, CIO, CCO, and CLO.Common offering size and gross proceeds include the underwriter’s full exercise of its overallotment option to purchase 9mm additional shares of common stock. Preferred offering size and gross proceeds exclude the underwriter’s exercise of its overallotment option to purchase additional shares of preferred stock, which is subject to exercise and closing.Total Return represents the total return for the period beginning December 31, 2013 to July 31, 2017. “mREIT” refers to BBREMTG. 6 Evolution of Annaly’s Diversified Business Model $26.4bn of Gross Assets - Deployed $18.4bn of Gross Assets – Run-off/Sold(1) July 2016Closed $1.5bn acquisition of Hatteras Financial Corp. July 2015Kevin Keyes named Chief Executive Officer July 2017Completed common & preferred equity offerings raising over $1.5bn(4) April 2016Initiated Employee Stock Ownership Program February 2016Granted access to 5-year sunset period for term FHLB financing July 2017Senior management voluntarily increased stock ownership commitments(3) August 2015Announced $1.0bn share repurchase program Q1 2015Began investing in Residential Credit / Non-Agency RMBS 2014Current investment teams put in place June 2017Declared 15th consecutive $0.30 quarterly dividend June 2017Maintained industry leading liquidity with $7.5bn of unencumbered assets Annaly has delivered a total return of ~79% since 2014 – nearly 2x the S&P 500 and 47% better than mREIT peers(5) 2014 2017 ($ in millions) (2) (2)
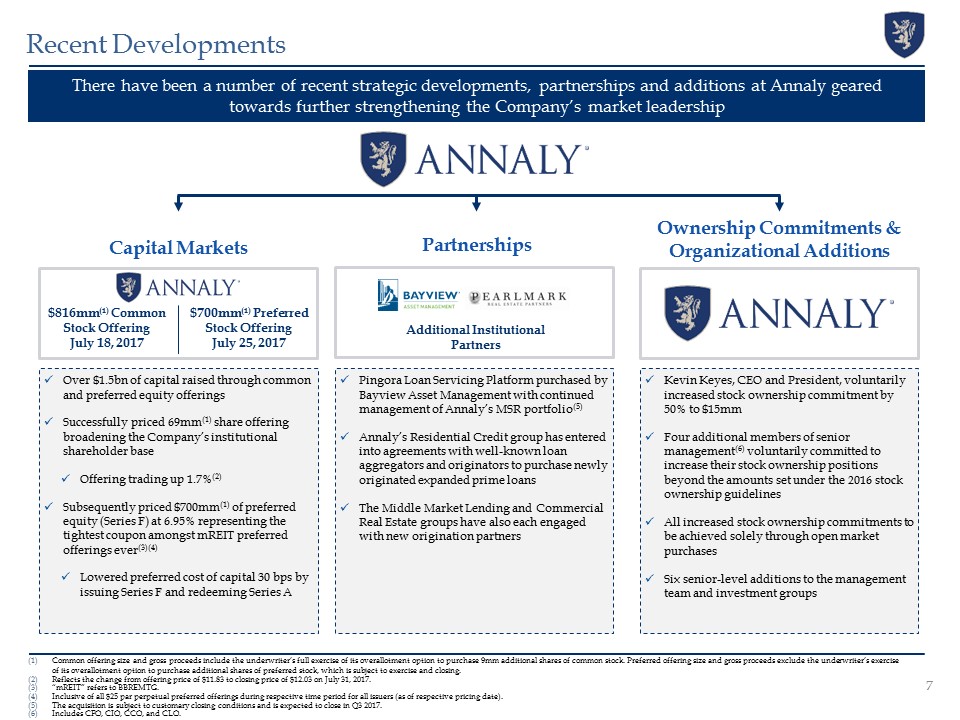
Recent Developments 7 There have been a number of recent strategic developments, partnerships and additions at Annaly geared towards further strengthening the Company’s market leadership Capital Markets GIC Ownership Commitments & Organizational Additions Partnerships $816mm(1) Common Stock OfferingJuly 18, 2017 Additional Institutional Partners Pingora Loan Servicing Platform purchased by Bayview Asset Management with continued management of Annaly’s MSR portfolio(5)Annaly’s Residential Credit group has entered into agreements with well-known loan aggregators and originators to purchase newly originated expanded prime loansThe Middle Market Lending and Commercial Real Estate groups have also each engaged with new origination partners Over $1.5bn of capital raised through common and preferred equity offeringsSuccessfully priced 69mm(1) share offering broadening the Company’s institutional shareholder baseOffering trading up 1.7%(2)Subsequently priced $700mm(1) of preferred equity (Series F) at 6.95% representing the tightest coupon amongst mREIT preferred offerings ever(3)(4)Lowered preferred cost of capital 30 bps by issuing Series F and redeeming Series A Kevin Keyes, CEO and President, voluntarily increased stock ownership commitment by 50% to $15mmFour additional members of senior management(6) voluntarily committed to increase their stock ownership positions beyond the amounts set under the 2016 stock ownership guidelinesAll increased stock ownership commitments to be achieved solely through open market purchasesSix senior-level additions to the management team and investment groups Common offering size and gross proceeds include the underwriter’s full exercise of its overallotment option to purchase 9mm additional shares of common stock. Preferred offering size and gross proceeds exclude the underwriter’s exercise of its overallotment option to purchase additional shares of preferred stock, which is subject to exercise and closing.Reflects the change from offering price of $11.83 to closing price of $12.03 on July 31, 2017.“mREIT” refers to BBREMTG.Inclusive of all $25 par perpetual preferred offerings during respective time period for all issuers (as of respective pricing date). The acquisition is subject to customary closing conditions and is expected to close in Q3 2017.Includes CFO, CIO, CCO, and CLO. $700mm(1) Preferred Stock OfferingJuly 25, 2017
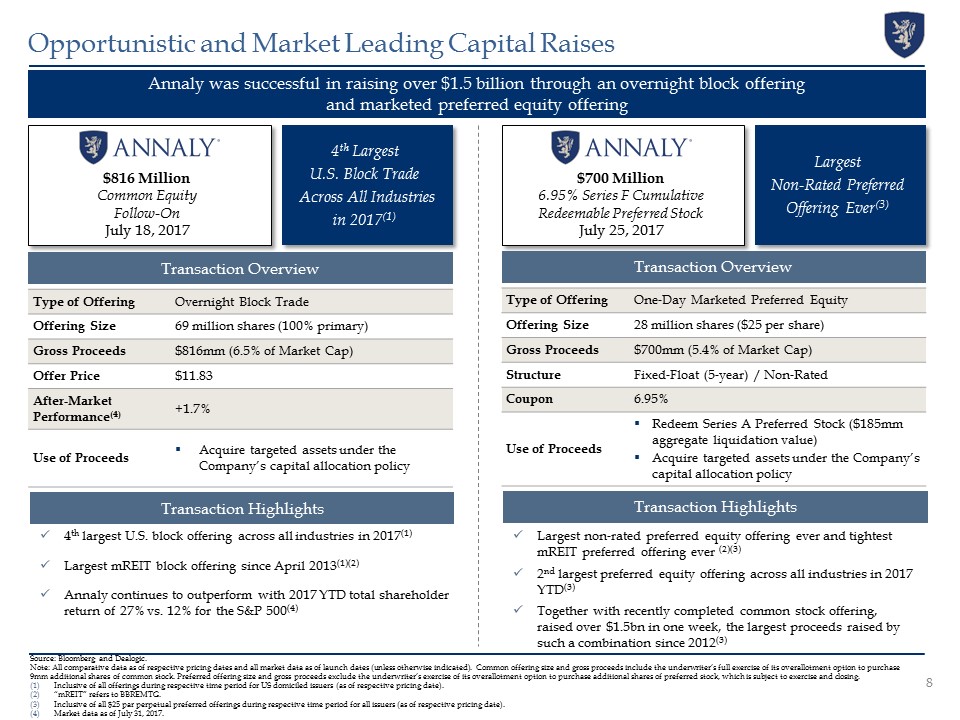
Annaly was successful in raising over $1.5 billion through an overnight block offering and marketed preferred equity offering Source: Bloomberg and Dealogic. Note: All comparative data as of respective pricing dates and all market data as of launch dates (unless otherwise indicated). Common offering size and gross proceeds include the underwriter’s full exercise of its overallotment option to purchase 9mm additional shares of common stock. Preferred offering size and gross proceeds exclude the underwriter’s exercise of its overallotment option to purchase additional shares of preferred stock, which is subject to exercise and closing.Inclusive of all offerings during respective time period for US domiciled issuers (as of respective pricing date). “mREIT” refers to BBREMTG.Inclusive of all $25 par perpetual preferred offerings during respective time period for all issuers (as of respective pricing date). Market data as of July 31, 2017. 8 Opportunistic and Market Leading Capital Raises $816 MillionCommon EquityFollow-OnJuly 18, 2017 4th Largest U.S. Block Trade Across All Industries in 2017(1) Type of Offering Overnight Block Trade Offering Size 69 million shares (100% primary) Gross Proceeds $816mm (6.5% of Market Cap) Offer Price $11.83 After-Market Performance(4) +1.7% Use of Proceeds Acquire targeted assets under the Company’s capital allocation policy Transaction Overview $700 Million6.95% Series F Cumulative Redeemable Preferred StockJuly 25, 2017 Largest Non-Rated Preferred Offering Ever(3) Type of Offering One-Day Marketed Preferred Equity Offering Size 28 million shares ($25 per share) Gross Proceeds $700mm (5.4% of Market Cap) Structure Fixed-Float (5-year) / Non-Rated Coupon 6.95% Use of Proceeds Redeem Series A Preferred Stock ($185mm aggregate liquidation value)Acquire targeted assets under the Company’s capital allocation policy Transaction Overview Transaction Highlights Transaction Highlights 4th largest U.S. block offering across all industries in 2017(1)Largest mREIT block offering since April 2013(1)(2)Annaly continues to outperform with 2017 YTD total shareholder return of 27% vs. 12% for the S&P 500(4) Largest non-rated preferred equity offering ever and tightest mREIT preferred offering ever (2)(3)2nd largest preferred equity offering across all industries in 2017 YTD(3)Together with recently completed common stock offering, raised over $1.5bn in one week, the largest proceeds raised by such a combination since 2012(3)
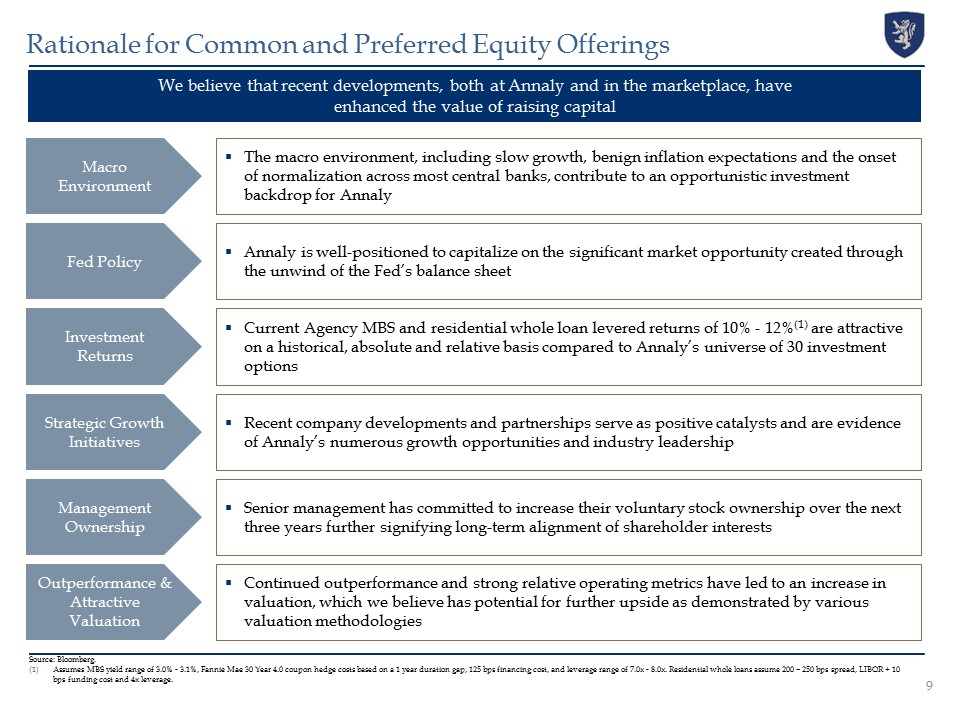
Rationale for Common and Preferred Equity Offerings 9 Source: Bloomberg.Assumes MBS yield range of 3.0% - 3.1%, Fannie Mae 30 Year 4.0 coupon hedge costs based on a 1 year duration gap, 125 bps financing cost, and leverage range of 7.0x - 8.0x. Residential whole loans assume 200 – 250 bps spread, LIBOR + 10 bps funding cost and 4x leverage. The macro environment, including slow growth, benign inflation expectations and the onset of normalization across most central banks, contribute to an opportunistic investment backdrop for Annaly Macro Environment Annaly is well-positioned to capitalize on the significant market opportunity created through the unwind of the Fed’s balance sheet Fed Policy Current Agency MBS and residential whole loan levered returns of 10% - 12%(1) are attractive on a historical, absolute and relative basis compared to Annaly’s universe of 30 investment options Investment Returns Recent company developments and partnerships serve as positive catalysts and are evidence of Annaly’s numerous growth opportunities and industry leadership Strategic Growth Initiatives Continued outperformance and strong relative operating metrics have led to an increase in valuation, which we believe has potential for further upside as demonstrated by various valuation methodologies Outperformance & Attractive Valuation We believe that recent developments, both at Annaly and in the marketplace, have enhanced the value of raising capital Senior management has committed to increase their voluntary stock ownership over the next three years further signifying long-term alignment of shareholder interests Management Ownership

Annaly Strategic Partnerships Note: ‘Bayview’ refers to Bayview Asset Management, LLC. ‘Pingora’ refers to Pingora Holdings, L.P. ‘Pearlmark’ refers to Pearlmark Real Estate Partners. The acquisition is subject to customary closing conditions and is expected to close in Q3 2017.FHLB membership expires in February 2021. Agency / MSR GIC Commercial Real Estate Acquired LP and GP interests in a mezzanine debt fund managed by PearlmarkACREG benefits from an interest in a high-quality cash flowing portfolio of mezzanine and preferred equity investmentsPartnership with strong real estate private equity sponsor with seasoned CRE investment teamAccess to future co-investment opportunities as the business grows Partnerships Pingora Loan Platform purchased by Bayview Asset Management with continued management of Annaly’s MSR portfolio(1)This transaction exemplifies our strategy to partner with industry leaders across our diversified investment platforms to efficiently allocate capital, minimize operating risks and optimize returns for our shareholdersAnnaly’s portfolio of MSRs includes assets acquired through our ongoing joint venture with a leading sovereign wealth fund Residential Credit Engaged with multiple well-known loan aggregators and originators to purchase newly originated expanded prime loans on a flow basis to leverage their respective conduit platform to secure future flow pipelines/arrangementsAllows us to better manage our own production and asset quality and be less dependent upon other third party aggregators to deliverCapitalize on unique funding advantage through FHLB membership(2) Annaly’s expertise across investment platforms has enabled the Company to establish additive, long-term relationships with dedicated 3rd party strategic partners Middle Market Lending Engaged with multi-industry advisory firm to gain access to additional M&A flow to complement AMML’s current origination platformOpportunity for NLY to offer staple financing as a neutral partner making investments in both unitranche /senior debt middle market deals and second lien broadly syndicated dealsLeverages network of large private equity sponsors to generate incremental underwriting fees in addition to spread income Large, Diversified M&A Advisor & Debt Placement Agent Various Well-Known Loan Aggregators and Originators 10
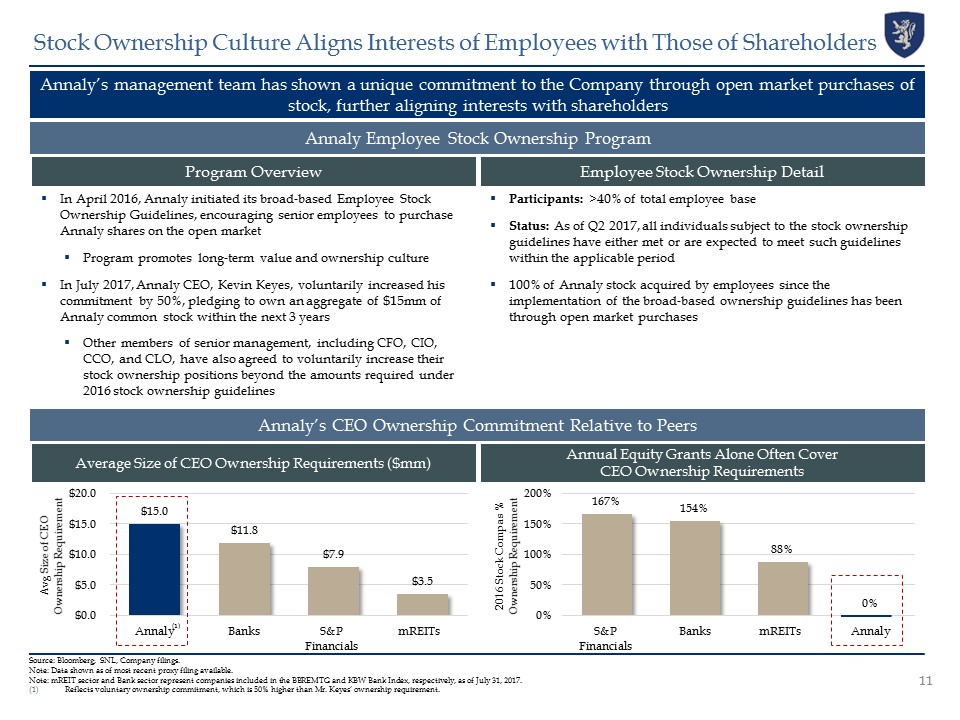
Source: Bloomberg, SNL, Company filings.Note: Data shown as of most recent proxy filing available.Note: mREIT sector and Bank sector represent companies included in the BBREMTG and KBW Bank Index, respectively, as of July 31, 2017.Reflects voluntary ownership commitment, which is 50% higher than Mr. Keyes’ ownership requirement. 11 Stock Ownership Culture Aligns Interests of Employees with Those of Shareholders Program Overview Annaly Employee Stock Ownership Program Employee Stock Ownership Detail Annaly’s CEO Ownership Commitment Relative to Peers Average Size of CEO Ownership Requirements ($mm) Annual Equity Grants Alone Often Cover CEO Ownership Requirements In April 2016, Annaly initiated its broad-based Employee Stock Ownership Guidelines, encouraging senior employees to purchase Annaly shares on the open marketProgram promotes long-term value and ownership culture In July 2017, Annaly CEO, Kevin Keyes, voluntarily increased his commitment by 50%, pledging to own an aggregate of $15mm of Annaly common stock within the next 3 yearsOther members of senior management, including CFO, CIO, CCO, and CLO, have also agreed to voluntarily increase their stock ownership positions beyond the amounts required under 2016 stock ownership guidelines Annaly’s management team has shown a unique commitment to the Company through open market purchases of stock, further aligning interests with shareholders (1) Participants: >40% of total employee baseStatus: As of Q2 2017, all individuals subject to the stock ownership guidelines have either met or are expected to meet such guidelines within the applicable period100% of Annaly stock acquired by employees since the implementation of the broad-based ownership guidelines has been through open market purchases

Performance and Valuation

Industry Leading Size and Scale Annaly is 19x the median size of all mREITs, which provides scale to allocate capital effectively among a universe of 30 investment options Source: Bloomberg, SNL Financial, and Company filings.Note: Represents companies in the BBREMTG. Market data as of July 31, 2017. Common offering size and gross proceeds include the underwriter’s full exercise of its overallotment option to purchase 9mm additional shares of common stock. 13 Annaly’s recent $816 million(1) common equity offering is greater than the market caps of 53% of the companies in the mREIT sector

Source: Bloomberg and Company filings. Includes all companies in the respective Agency, Hybrid, and Commercial sectors of the BBREMTG as of July 31, 2017.Dividend Stability measures the change in dividend from Q4 2013 to Q2 2017.Book Value Stability measures the change in book value from Q4 2013 to Q1 2017. Demonstrated Resiliency – Scaled Diversification Enhances Stability As a result of the diversification strategy, Annaly has continued to deliver a stable book value and consistent dividends, as evidenced by the 15th consecutive quarter of a $0.30 dividend Dividend Stability(1) NLY has declared a consistent dividend over the past 15 consecutive quarters Book value has demonstrated relative stability versus industry peers 14 Book Value Stability(2)

Stability of Annaly’s Core Earnings(1) vs. Other Yield Investments Despite heightened market volatility, Annaly has continued to offer stable core earnings(1) over the past 3 years, particularly when compared to other yield strategies Source: Bloomberg, Company filings, SNL Financial. Note: mREITs include all companies in the respective Agency, Hybrid, and Commercial sectors of the BBREMTG as of July 31, 2017. Utilities represent the Russell 3000 Utilities Index. MLPs represent the Alerian MLP Index. Banks represent the KBW Bank Index. Financials represent the S&P 500 Financial Index. Equity REITs represent the FTSE NAREIT Index. “Core Earnings” represents a non-GAAP financial measure and is shown excluding PAA; see Appendix.Variability calculated as the percentage range between the highest and lowest quarterly “Adjusted Earnings” figures for each company from Q2 2014 to Q1 2017. Annaly and all mREITs utilize “Core” or similarly adjusted EPS (excluding PAA); Banks and Financials utilize adjusted net income; and Equity REITs, Utilities and MLPs utilize EBITDA. 3-Year Variability of Adjusted Earnings(1)(2) 15 Most Volatile LeastVolatile

Annaly vs. Other Yield Sectors – Relative Valuation Source: Bloomberg. Equity REITS represent the S&P 500 REITS Industry Index. Banks represent the KBW Bank Index. S&P represent the SPX Index. Utilities represent the Russell 3000 Utilities Index. Asset Managers represent the S&P 500 Asset Management and Custody Bank Index. MLPs represent the Alerian MLP Index. Note: Market Data as of July 31, 2017. Financial data as of Q1 2017.Total Return represents the total return for the period beginning December 31, 2013 to July 31, 2017 calculated on a daily basis. Annaly’s performance and yield profiles are superior to other yield asset classes, yet valuation still lags the other yield sectors 16 Total Return (1) Price to Book Yield

Source: Bloomberg, Company Financials. Operating Margin and ROE figures based on trailing 12 month financials as of Q1 2017. Market data as of July 31, 2017. Note: Equity REITS represent the S&P 500 REITS Industry Index. S&P represent the SPX Index. Asset Managers represent the S&P 500 Asset Management and Custody Bank Index. MLPs represent the Alerian MLP Index. Utilities represent the Russell 3000 Utilities Index. Banks represent the KBW Bank Index.Price to Earnings refers to Price to Funds From Operation (“FFO”) for equity REITs.Annaly Operating margin defined as (trailing 12 month net interest income – trailing 12 month operating expense) / trailing 12 month interest income. Bloomberg OPER_MARGIN field used for indices.Annaly Leverage is defined as Q1 2017 Economic Leverage. Bloomberg FNCL_LVRG field minus 1, making it a measure of debt to equity, used for indices. Companies with >50x leverage excluded. Financial data as of Q1 2017.Beta refers to the Bloomberg BETA_ADJ_OVERRIDABLE field, calculated over a 2 year period as of July 31, 2017. SPX Index is used as the relative index for the beta calculation.Cost of Equity refers to the Bloomberg WACC_COST_EQUITY field which derives the cost of equity based on the Capital Asset Pricing Model methodology.EVA Spread Calculated as the ROE minus the Cost of Equity. Relative Value Comparison Highlights Valuation Discount Annaly trades at a relative discount to other yield producing sectors despite outperforming across operating and performance metrics 17 Potential Upside to Valuation / More Efficient Full Valuation / Less Efficient

Market Update and Business Overview

Despite sentiment lift, US economic growth is largely unchanged post-electionGrowth remains in line with recent years; appears to be limited near-term upsidePrivate sector debt is at all-time highs relative to GDP, while productivity remains well below prior business cycle levels A stable, “low-flation” macro environment with measured central bank withdrawal presents a favorable opportunity for Annaly No Growth Pickup Despite Heightened Expectations “Reflation” Theme Falls Flat US realized inflation has slowed broadly, after reaching a peak in Q1’17The Fed has stated the inflation slowdown is partially due to transitory factorsFurther hiking path is expected to continue to be gradual Source: Bloomberg, Haver Analytics, Oxford Economics, Morgan Stanley, Federal Reserve, European Central Bank, Bank of Japan. 19 Macro Environment Remains Stable Central Bank Stimulus Withdrawal to be Very Gradual Developed market central banks have begun signaling an eventual end to stimulative asset purchasesInflation continues to be a challenge with G3 missing targets for nearly a decadeThe gradual removal of central bank accommodation should provide Annaly with more opportunities as a private capital solution GDP is Growing Slightly Above Potential Yields to Remain Range-Bound Amid Low Inflation Central Banks Continue to Fall Short of Inflation Objectives

Caps limit runoffFed balance sheet likely to remain permanently elevated from pre-QE periodGlobal gradual convergence supportive of investment environment Attractive ROEs expected to be available in multiple rate environmentsRegulatory proposals aim to relax funding conditions to support supply increaseFed unlikely to hike rates to pre-crisis levels …but funding conditions will drive private market response MBS spreads are expected to widen modestly, but not in a vacuumDeparture of Fed as an uneconomic buyer should raise relative value opportunitiesMore liquid products should witness less spread impact …is likely to cause market-wide portfolio rebalancing… Source: Annaly Internal Calculations, Federal Reserve Bank of New York, The Yield Book, eMBS.Bloomberg (March 31, 2017). May FOMC Minutes (May 2-3, 2017). Testimony by Chair Janet L. Yellen before the Financial Services, U.S. House of Representatives, Washington, D.C. (July 12, 2017). Increased Fed Clarity Regarding Taper in Recent Quarters Given recent clarity from the Fed, Annaly is well-positioned to capitalize on the significant market opportunity created through the unwind of the Fed’s balance sheet 20 Throughout 2017, the Fed had Gradually Increased Transparency Around Unwind and Rate Hikes(1) “Nearly all policymakers indicated … it likely would be appropriate to begin reducing the Federal Reserve’s securities holdings this year.” – FOMC Minutes, May 2-3, 2017 “It wouldn't surprise me if sometime later this year or sometime in 2018 … that we will gradually start to let securities mature rather than reinvest them.” – William Dudley, NY Fed President, March 31, 2017, Bloomberg TV Interview Quarterly Projected Fed Portfolio Runoff “Because the neutral rate is currently quite low by historical standards, the federal funds rate would not have to rise all that much further to get to a neutral policy stance.” – Testimony by Chair Janet L. Yellen, July 12, 2017 We believe a transparent unwind of the Fed’s balance sheet…
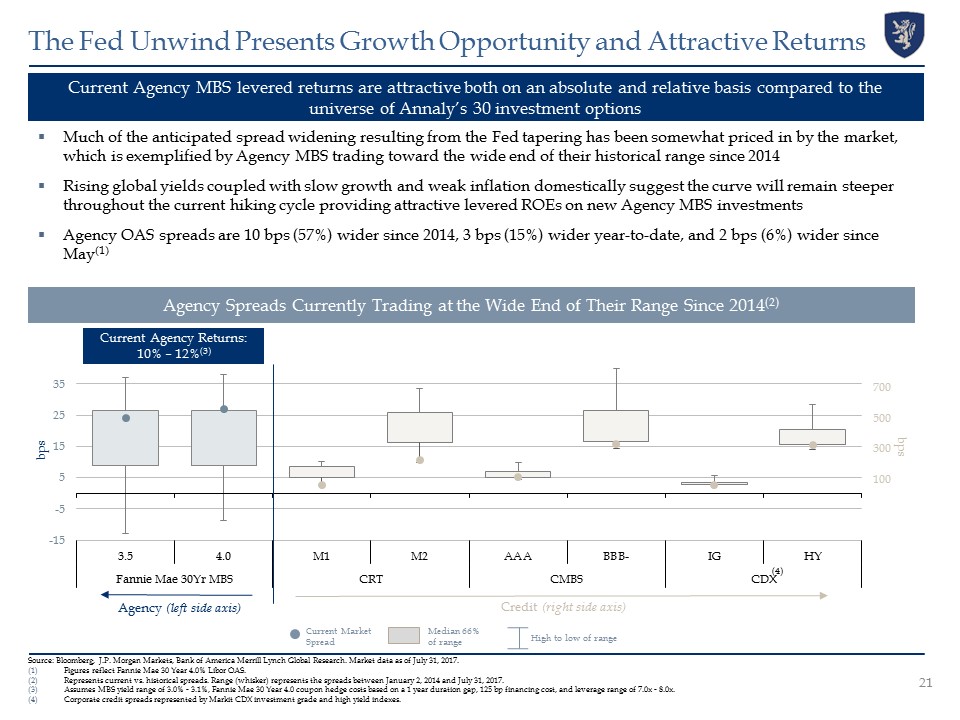
Much of the anticipated spread widening resulting from the Fed tapering has been somewhat priced in by the market, which is exemplified by Agency MBS trading toward the wide end of their historical range since 2014Rising global yields coupled with slow growth and weak inflation domestically suggest the curve will remain steeper throughout the current hiking cycle providing attractive levered ROEs on new Agency MBS investmentsAgency OAS spreads are 10 bps (57%) wider since 2014, 3 bps (15%) wider year-to-date, and 2 bps (6%) wider since May(1) Current Agency MBS levered returns are attractive both on an absolute and relative basis compared to the universe of Annaly’s 30 investment options Agency Spreads Currently Trading at the Wide End of Their Range Since 2014(2) Source: Bloomberg, J.P. Morgan Markets, Bank of America Merrill Lynch Global Research. Market data as of July 31, 2017.Figures reflect Fannie Mae 30 Year 4.0% Libor OAS.Represents current vs. historical spreads. Range (whisker) represents the spreads between January 2, 2014 and July 31, 2017.Assumes MBS yield range of 3.0% - 3.1%, Fannie Mae 30 Year 4.0 coupon hedge costs based on a 1 year duration gap, 125 bp financing cost, and leverage range of 7.0x - 8.0x.Corporate credit spreads represented by Markit CDX investment grade and high yield indexes. 21 The Fed Unwind Presents Growth Opportunity and Attractive Returns Agency (left side axis) Credit (right side axis) Current Market Spread High to low of range Current Agency Returns: 10% – 12%(3) bps bps Median 66% of range (4)

Balance Sheet Summary Capital Structure Highlights 22 Annaly’s Strong Balance Sheet and Liquidity Q2 2017 Total Capitalization ~$79 billion Source: Company filings, Bloomberg, SNL. Note: Financial data as of June 30, 2017. Includes common stock, additional paid-in capital, accumulated other comprehensive income (loss), and accumulated deficit.Pro forma reflects July 2017 common and preferred stock offerings and redemption of Series A preferred stock. Common and preferred stock offerings reflect net proceeds.Inclusive of Agency and Non-Agency repo funding and FHLB.Includes $190mm funded on $450mm of AMML credit facilities (closed new $150mm AMML credit facility in July 2017), $395mm funded on $500mm ACREG credit facility, and $312mm of mortgages payable.Publicly traded REITs defined as all REITs within the Bloomberg United States REIT list. Financial data as of most recent quarter available. Common offering size and gross proceeds include the underwriter’s full exercise of its overallotment option to purchase 9mm additional shares of common stock. Preferred offering size and gross proceeds exclude the underwriter’s exercise of its overallotment option to purchase additional shares of preferred stock, which is subject to exercise and closing.mREIT sector represented by BBREMTG. Largest preferred equity capital base in the mREIT sector and larger than 99% of all publicly traded REITs(5)Recent preferred equity offering of $700mm(6) at a 6.95% coupon lowered the weighted average preferred coupon 30 bps to 7.32%, the lowest in the mREIT sector(7) Largest common equity capital base in the mREIT sector and larger than 99% of all publicly traded REITs(5)Recent common equity offering of $816mm(6) broadened the Company’s institutional sponsorship Availability of ~$1.3bn ($0.9bn outstanding) of credit facilities and mortgages payable provides funding capacity to support commercial credit assets(4) Weighted average maturity of 152 days is evidence of our longer term funding structure(3)Initial 5 year sunset (ending February 2021) for FHLB financing provides significant competitive advantageAllows for financing of credit assets at economically attractive levels Proprietary broker dealer, RCap, in place since 2008, provides beneficial access to FICC marketStrong counterparty credit quality and significant capacity available Annaly’s liability profile and large capital base provide the Company with unique competitive advantages Agency & Non-Agency Repo$62.1bn FHLB $3.6bn CRE & MML Financing $0.9bn Preferred Equity$1.2bn Common Equity(1)$11.4bn Illustrative Pro Forma Equity Capital Base(2) ($ in millions) $12,603 $13,900 / 10.3%▲

Pass Through Coupon Type Agency MBS Portfolio Note: Data as of June 30, 2017. Percentages based on fair market value and may not sum to 100% due to rounding.Inclusive of TBA purchase contracts accounted for as derivatives (market value) and MSRs.“High Quality Spec” protection is defined as pools backed by original loan balances of up to $150K, higher LTV pools (CR/CQ), geographic concentrations (NY/PR). “Med Quality Spec” includes $175K loan balance, high LTV pools, FICO < 700. “30+ WALA” is defined as weighted average loan age greater than 30 months. The Agency MBS portfolio grew from $83.8 billion to $88.4 billion during Q2 2017, a ~5% increase from Q1 2017(1)~90% of the portfolio is positioned in securities with prepayment protection as of Q2 2017Agency MBS modestly underperformed swap hedges given a slight widening in MBS spreadsThe Agency investment team continues to protect book value through a disciplined approach to security selection and hedging Asset Type(1) Call Protection(2) Total Dedicated Capital: $10.8 billion 15 & 20Yr: 20% 30Yr+:80% \\nyprodfs02\fidac\Capital Markets\Quarterly Earnings Supplement\16'Q4\Excel\Agency Portfolio - Q4 2016 Pie Charts.xlsx 23

Note: Data as of June 30, 2017. Percentages based on fair market value and reflect economic interest in securitizations. Jumbo 2.0 includes the economic interest of certain positions that are classified as Residential Mortgage Loans within our Consolidated Financial Statements. Percentages may not sum to 100% due to rounding. FHLB membership expires in February 2021. The Residential Credit portfolio declined from $2.8 billion to $2.6 billion during Q2 2017, a ~6% decrease from Q1 2017Decrease in portfolio size attributable to short duration holdings being called, as well as opportunistic salesTightening of credit assets persisted, driven by both strong technicals and fundamentals Repo funding has improved, albeit not at the pace of asset spread tighteningCredit risk transfer (CRT) securitizations have benefited from strong empirical performance, consistent ratings upgrades and strong technicals as traditional legacy investors gravitate into the sectorExpanded credit, new origination whole loans are expected to be the largest growth area of the portfolio in the near term as we capitalize on our FHLB funding advantage(1)Residential whole loan portfolio grew 14%, or $97mm, during the quarter to $780mm Sector Type Effective Duration Coupon Type Total Dedicated Capital: $0.9 billion Residential Credit Portfolio 24

Commercial Real Estate Portfolio Note: Data as of June 30, 2017. Note: Percentages based on economic interest and may not sum to 100% due to rounding.Commercial Real Estate assets are exclusive of consolidated variable interest entities (“VIEs”) associated with B Piece commercial mortgage-backed securities.Paydowns on consolidated VIEs associated with B Piece commercial mortgage-backed securities and loan participation sold are reported based on net economic interest.Other includes 23 states, none of which represent more than 5% of total portfolio value. The Commercial Real Estate portfolio declined from $2.1 billion to $2.0 billion in assets during Q2 2017, a ~7% decrease from Q1 2017(1)Assets continue to perform as the supply / demand fundamentals in the U.S. Commercial Real Estate market remain favorableNew investment activity has been moderate, primarily a result of a cautious stance on credit and valuations, a significant decline in new acquisition activity by sponsors, and a highly competitive marketNet decline of $130 million in Q2 2017 as payoffs / paydowns eclipsed new investments(2)Borrowers achieved business plans / assets appreciated in valueActive pipeline with quality opportunities, but expect to maintain a disciplined approach Asset Type Sector Type Geographic Concentration(3) Total Dedicated Capital: $1.0 billion 25

Middle Market Lending Portfolio Lien Position Industry(1) Loan Size(2) The Middle Market Lending portfolio declined from $841 million to $774 million in assets during Q2 2017, an ~8% decrease from Q1 2017Despite reduced M&A activity and a technical imbalance with increased capital raising, fund flows and new issue CLOs, the Annaly Middle Market Loan portfolio has grown at returns that are accretive to the existing middle market loan portfolioUnlevered portfolio yield of 8.18% at the end of Q2 2017Portfolio of ~30 obligors is well diversified by sponsor, industry and borrower Total Dedicated Capital: $0.6 billion Note: Data as of June 30, 2017. Percentages based on amortized cost and may not sum to 100% due to rounding.Based on Standard Industrial Classification (SIC) industry categories.Breakdown based on aggregate $ amount of individual investments made within the respective loan size buckets. Multiple investment positions with a single obligor shown as one individual investment. 26

Performance Highlights and Trends Unaudited, dollars in thousands except per share amounts *Represents a non-GAAP financial measure; see Appendix.Net of dividends on preferred stock.Core earnings is defined as net income (loss) excluding gains or losses on disposals of investments and termination of interest rate swaps, unrealized gains or losses on interest rate swaps and investments measured at fair value through earnings, net gains and losses on trading assets, impairment losses, net income (loss) attributable to noncontrolling interest, corporate acquisition related expenses and certain other non-recurring gains or losses, and inclusive of TBA dollar roll income (a component of Net gains (losses) on trading assets) and realized amortization of MSRs (a component of net unrealized gains (losses) on investments measured at fair value through earnings). Core earnings (excluding PAA) excludes the premium amortization adjustment (“PAA”) representing the cumulative impact on prior periods, but not the current period, of quarter-over-quarter changes in estimated long-term prepayment speeds related to the Company’s Agency mortgage-backed securities. Includes non-Agency securities, credit risk transfer securities and residential mortgage loans.Includes consolidated VIEs and loans held for sale.Debt consists of repurchase agreements, other secured financing, securitized debt, participation sold, and mortgages payable. Securitized debt, participation sold and mortgages payable are non-recourse to the Company.Computed as the sum of recourse debt, TBA derivative notional outstanding and net forward purchases of investments divided by total equity. Recourse debt consists of repurchase agreements, other secured financing and securitized debt, participation sold and mortgages payable are non-recourse to the Company and are excluded from this measure.Represents CRT securities, non-Agency mortgage-backed securities, residential mortgage loans, commercial real estate debt investments and preferred equity investments, loans held for sale, investments in commercial real estate and corporate debt, net of financing. 27

Appendix: Non-GAAP Reconciliations

To supplement its consolidated financial statements, which are prepared and presented in accordance with U.S. generally accepted accounting principles (GAAP), the Company provides non-GAAP financial measures. These measures should not be considered a substitute for, or superior to, financial measures computed in accordance with GAAP. These non-GAAP measures provide additional detail to enhance investor understanding of the Company’s period-over-period operating performance and business trends, as well as for assessing the Company’s performance versus that of industry peers. Reconciliations of these non-GAAP financial measures to their most directly comparable GAAP results are provided below. Unaudited, dollars in thousands except per share amounts 29 Non-GAAP Reconciliations Represents transaction costs incurred in connection with the Hatteras Acquisition.Represents a component of Net gains (losses) on trading assets.Represents the portion of changes in fair value that is attributable to the realization of estimated cash flows on the Company’s MSR portfolio and is reported as a component of Net unrealized gains (losses) on investments measured at fair value.Net of dividends on preferred stock.

Non-GAAP Reconciliations (Cont’d) To supplement its consolidated financial statements, which are prepared and presented in accordance with U.S. generally accepted accounting principles (GAAP), the Company provides non-GAAP financial measures. These measures should not be considered a substitute for, or superior to, financial measures computed in accordance with GAAP. These non-GAAP measures provide additional detail to enhance investor understanding of the Company’s period-over-period operating performance and business trends, as well as for assessing the Company’s performance versus that of industry peers. Reconciliations of these non-GAAP financial measures to their most directly comparable GAAP results are provided below. Unaudited, dollars in thousands except per share amounts 30