Attached files
| file | filename |
|---|---|
| EX-99.1 - EXHIBIT 99.1 - Great Ajax Corp. | v472086_ex99-1.htm |
| 8-K - FORM 8-K - Great Ajax Corp. | v472086_8k.htm |
Exhibit 99.2
Second Quarter 2017 Investor Presentation August 1, 2017
Safe Harbor Disclosure 2 □ We make forward - looking statements in this presentation that are subject to risks and uncertainties. These forward - looking statements include information about possible or assumed future results of our business, financial condition, liquidity, resu lts of operations, cash flow and plans and objectives. When we use the words “believe,” “expect,” “anticipate,” “estimate,” “plan,” “continue,” “intend,” “should,” “may” or similar expressions, we intend to identify forward - looking statements. □ Statements regarding the following subjects, among others, may be forward - looking: market trends in our industry, interest rates, real estate values, the debt financing markets or the general economy or the demand for residential and small balance commercial real estate loans; our business and investment strategy; our projected operating results; actions and initiatives of the U.S. government and changes to U.S. government policies and the execution and impact of these actions, initiatives and policies; the state of the U.S. economy generally or in specific geographic regions; economic trends and economic recoveries; our ability to obtain and maintain financing arrangements; changes in the value of our mortgage portfolio; changes to our portfolio of properties; impact of and changes in governmental regulations, tax law and rates, accounting guidance and simila r matters; our ability to satisfy the REIT qualification requirements for U.S. federal income tax purposes; availability of qua lif ied personnel; estimates relating to our ability to make distributions to our stockholders in the future; general volatility of t he capital markets and the market price of our shares of common stock; and degree and nature of our competition. □ The forward - looking statements are based on our beliefs, assumptions and expectations of our future performance, taking into account all information currently available to us. Forward - looking statements are not predictions of future events. These beliefs, assumptions and expectations can change as a result of many possible events or factors, not all of which are known t o us. If a change occurs, our business, financial condition, liquidity and results of operations may vary materially from those expressed in our forward - looking statements. Furthermore, forward - looking statements are subject to risks and uncertainties, including, among other things, those described under Item 1A of our Annual Report on Form 10 - K for the year ended December 31, 2016, which can be accessed through the link to our SEC filings on our website ( www.great - ajax.com ) or at the SEC's website ( www.sec.gov ). Other risks, uncertainties, and factors that could cause actual results to differ materially from those projected may be described from time to time in reports we file with the SEC, including reports on Forms 10 - Q, 10 - K and 8 - K. Any forward - looking statement speaks only as of the date on which it is made. New risks and uncertainties arise over time, and it is not possible for us to predict those events or how they may affect us. Except as required by law, we are not obligated to, and do not intend to, update or revise any forward - looking statements, whether as a result of new information, future events or otherwise. Unless stated otherwise, financial information included in this presentation is as of June 30, 20 17.
Business Overview 3 □ Leverage long - standing relationships to acquire mortgage loans through privately negotiated transactions from a diverse group of customers – Over 90% of our acquisitions since inception have been privately negotiated – Acquisitions made in 206 transactions since inception. 19 transactions in Q2 2017 □ Use our manager’s proprietary analytics to price each pool on an asset - by - asset basis □ Adjust individual loan bid price to accumulate clusters of loans in attractive demographic metropolitan areas – Typical acquisitions contain 25 – 100 loans with total market value between $5 – $20 million □ Our affiliated servicer services the loans asset - by - asset and borrower - by - borrower □ Objective is to maximize returns for each asset by utilizing a full menu of loss mitigation and asset optimization techniques □ Use moderate non - mark - to - market leverage – Asset level leverage of 2.63x and corporate leverage of 2.91x – Nine securitizations since inception totaling $1.2 billion of loan unpaid principal balance (“UPB”) . Approximate leverage of 3.3x from the sale of senior bonds.

Highlights – Quarter Ended June 30, 2017 4 □ Purchased $210.2 million of re - performing mortgage loans (“RPL”) with an aggregate UPB of $249.0 million and underlying collateral value of $357.7 million; and originated $1.7 million of small balance commercial mortgage loans (“SBC”) to end the quarter with $1,044.7 million of mortgage loans with an aggregate UPB of $1,257.1 million □ Issued $87.5 million in convertible senior notes and a net increase in secured debt of $98.1 million □ Portfolio interest income of $21.7 million; net interest income of $12.4 million □ Net income attributable to common stockholders of $6.9 million □ Basic earnings per share (“EPS”) of $0.38 per share □ Taxable income of $0.39 per share □ Book value per share of $15.49 at June 30, 2017 □ $42.0 million of cash and cash equivalents at June 30, 2017

Portfolio Overview – as of June 30, 2017 5 $1,257 MM RPL: $1,194 MM NPL: $63 MM $1,648 MM RPL: $1,536 MM NPL: $ 70 MM REO & Rental: $ 42 MM 93% 4% 3% Property Value 1 RPL NPL REO 1 REO and Rental Property value is presented at estimated property fair value less expected liquidation costs 95% 5% Unpaid Principal Balance RPL NPL

Portfolio Growth 6 Re - performing Loans Re - performing loan UPB as of 6/30/2017 includes $6.7million of small balance commercial originations which are performing loa ns Re - performing loan status stays constant based on purchase status $64 $617 $994 $1,194 $73 $710 $1,210 $1,536 $49 $469 $785 $965 0 200 400 600 800 1,000 1,200 1,400 1,600 1,800 Initial Assets (07/08/14) 12/31/2015 12/31/2016 6/30/2017 Millions UPB Property Value Price

Portfolio Growth 7 $111 $76 $63 $117 $84 $70 $68 $48 $39 0 20 40 60 80 100 120 140 Initial Assets (07/08/14) 12/31/2015 12/31/2016 6/30/2017 Millions UPB Property Value Price Non - performing Loans Non - performing loan status stays constant based on purchase status
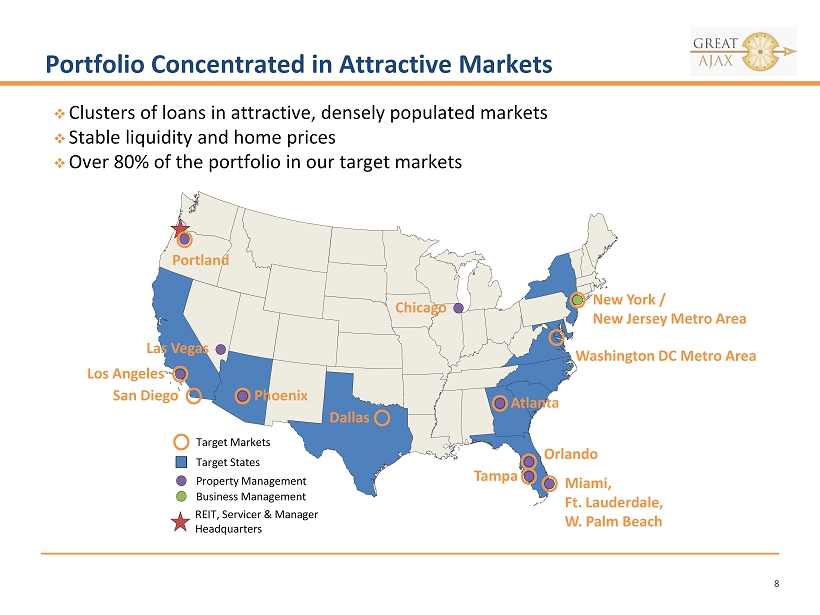
Portfolio Concentrated in Attractive Markets 8 □ Clusters of loans in attractive, densely populated markets □ Stable liquidity and home prices □ Over 80% of the portfolio in our target markets Target States Target Markets Los Angeles San Diego Dallas Portland Phoenix Washington DC Metro Area Chicago Atlanta Orlando Tampa Miami, Ft. Lauderdale, W. Palm Beach New York / New Jersey Metro Area Las Vegas REIT, Servicer & Manager Headquarters Property Management Business Management

Portfolio Migration 9 □ 24 for 24: Loan that has made 24 full payments in the last 24 months □ 12 for 12: Loan that has made 12 full payments in the last 12 months □ 7 for 7 : Loan that has made 7 full payments in the last 7 months □ NPL: <1 full payment in the last three months □ $530.6 million of purchased UPB is 12 for 12 or better based on the payment history of the loans post service transfer to Gregory Funding LLC, our affiliated servicer □ Current status excludes borrower payment history prior to the date the loan was serviced by Gregory Funding LLC to the extent the prior history would result in the borrower having an acquisition status of better than 7 for 7. Including prior servicer history for these loans would result in a considerably higher number of loans that are 12 for 12 or better Count UPB Count UPB Liquidated - - 686 $137,641 24for24 318 $58,923 1,366 $303,121 12for12 10 $1,656 951 $227,441 7for7 2,456 $551,777 1,050 $224,538 4f4-6f6 992 $216,703 328 $65,941 Less Than 4f4 1,197 $256,705 454 $94,581 NPL 496 $122,195 490 $118,185 REO - - 169 $41,340 Purchased REO 34 $8,074 9 $3,245 Total 5,503 $1,216,033 5,503 $1,216,033 Total Pre-2Q 2017 Acquisitions (Dollars in thousands) Acquisition Current Based on Acquisition UPB
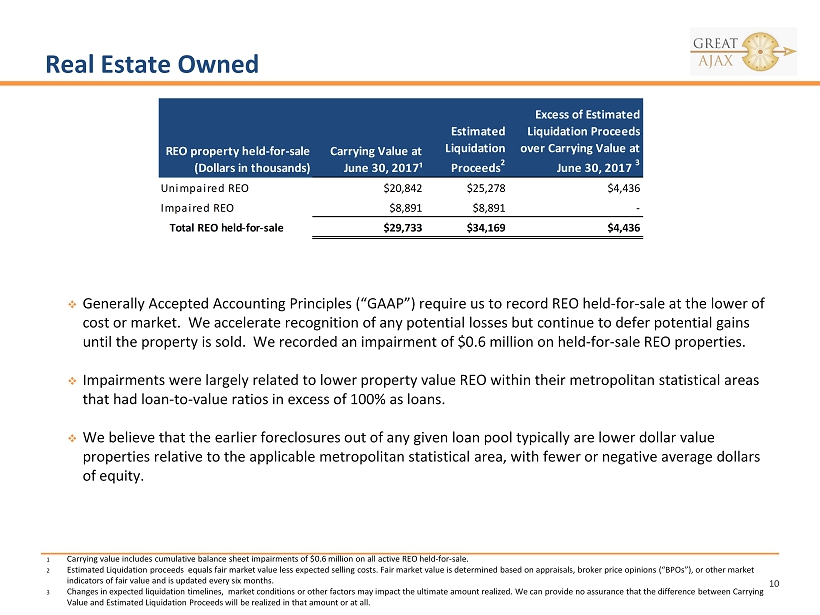
Real Estate Owned 10 1 Carrying value includes cumulative balance sheet impairments of $0.6 million on all active REO held - for - sale. 2 Estimated Liquidation proceeds equals fair market value less expected selling costs. Fair market value is determined based on appraisals, broker price opinions (“BPOs”) , o r other market indicators of fair value and is updated every six months. 3 Changes in expected liquidation timelines, market conditions or other factors may impact the ultimate amount realized. We can provid e n o assurance that the difference between Carrying Value and Estimated Liquidation Proceeds will be realized in that amount or at all. □ Generally Accepted Accounting Principles (“GAAP”) require us to record REO held - for - sale at the lower of cost or market. W e accelerate recognition of any potential losses but continue to defer potential gains until the property is sold. We recorded an impairment of $0.6 million on held - for - sale REO properties. □ Impairments were largely related to lower property value REO within their metropolitan statistical areas that had loan - to - value ratios in excess of 100 % as loans. □ W e believe that the earlier foreclosures out of any given loan pool typically are lower dollar value properties relative to the applicable metropolitan statistical area, with fewer or negative average dollars of equity. REO property held-for-sale (Dollars in thousands) Carrying Value at June 30, 2017¹ Estimated Liquidation Proceeds 2 Excess of Estimated Liquidation Proceeds over Carrying Value at June 30, 2017 3 Unimpaired REO $20,842 $25,278 $4,436 Impaired REO $8,891 $8,891 - Total REO held-for-sale $29,733 $34,169 $4,436

Building Net Asset Value 11 This illustration has not been prepared in accordance with GAAP and is not intended to constitute a non - GAAP financial measure, but rather an additional tool for investors to consider. In evaluating our financial results, management regularly considers the following analysis, which is intended to arrive at a “ne t asset value” equivalent. Based on the leverage from the nine securitizations, securitization investors value our loan portfolio at between $ 17.79 and $18.38 per share As shown below, at June 30, 2017, if we were to lever our whole loan portfolio through a securitization, the face value of th e e quity tranche would be approximately $289.1MM under scenario 1 where the leverage is 77% (similar to our most recent securitization) and $ 314 .3 MM under scenario 2 where the leverage is 75% (similar to a previous securitization). Given that our securitization investors curr ently value the equity tranche at between 30% - 50%, using the average 40%, the value of our equity tranche would be $115.6MM under scenario 1, wh ich is $70.8MM or $2.89 per share over the remaining basis of $44.9MM. Our current book value per share is $15.49. By contrast, our c urrent NAV based on this securitization analysis would be the sum of $15.49 and $2.89, or $18.38 per share Entire Portfolio 6/30/2017 UPB $1,257,054,915 Price $1,004,055,229 Book Value / Share $15.49 Leverage (Bond Face/UPB) Bond Face Value Bond Price Net Proceeds Equity Basis Implied value/Share Implied NAV Per Share Senior 65% $817,088,568.82 100.0% $816,998,444 B1 7% $87,988,523.70 97.3% $85,623,832 B2 5% $62,854,754.09 90% $56,569,279 Equity-Trust Certificate $289,123,069 40% $115,649,228 $44,863,675 $2.89 $18.38 Leverage (Bond Face/UPB) Bond Face Value Bond Price Net Proceeds Equity Basis Implied value/Share Implied NAV Per Share Senior 65% $817,085,947.53 100.0% $817,085,948 B1 5% $62,849,701.45 97.3% $61,160,616 B2 5% $62,849,701.45 90% $56,564,731 Equity-Trust Certificate $314,269,565 40% $125,707,826.00 $69,243,935 $2.30 $17.79
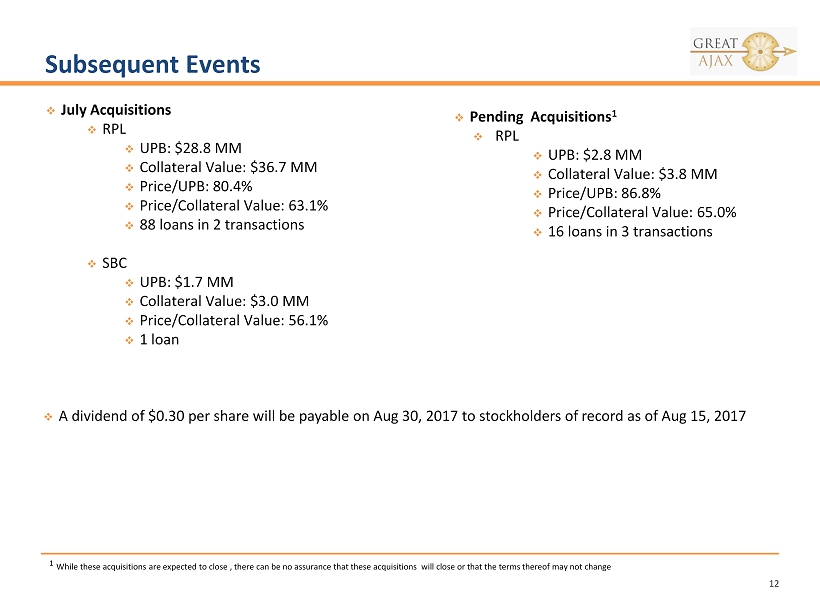
Subsequent Events 12 1 While these acquisitions are expected to close , there can be no assurance that these acquisitions will close or that the terms thereof may not change □ July Acquisitions □ RPL □ UPB: $ 28.8 MM □ Collateral Value: $ 36.7 MM □ Price/UPB: 80.4% □ Price/Collateral Value: 63.1% □ 88 loans in 2 transactions □ SBC □ UPB: $1.7 MM □ Collateral Value: $3.0 MM □ Price/Collateral Value: 56.1% □ 1 loan □ Pending Acquisitions 1 □ RPL □ UPB: $ 2.8 MM □ Collateral Value: $ 3.8 MM □ Price/UPB: 86.8 % □ Price/Collateral Value: 65.0 % □ 16 loans in 3 transactions □ A dividend of $ 0.30 per share will be payable on Aug 30, 2017 to stockholders of record as of Aug 15, 2017

Consolidated Statements of Income 13 (Dollars in thousands except per share amounts) (Unaudited) Three months ended Six months ended June 30, 2017 June 30, 2016 June 30, 2017 June 30, 2016 INCOME: Loan interest income 21,721$ 16,378$ 42,528$ 32,258$ Interest expense (9,293) (6,063) (16,944) (11,050) Net interest income 12,428 10,315 25,584 21,208 Income from investment in Manager 142 46 191 90 Other income (loss) 535 482 997 1,001 Total income 13,105 10,843 26,772 22,299 EXPENSE: Related party expense - loan servicing fees 1,935 1,410 3,817 2,786 Related party expense - management fee 1,330 937 2,403 1,843 Loan transaction expense 442 574 967 787 Professional fees 507 407 987 821 Real estate operating expenses 637 268 961 475 Other expense 886 360 1,570 740 Total expense 5,737 3,956 10,705 7,452 (Gain) / Loss on debt extinguishment 218 - 218 - Income before provision for income tax 7,150 6,887 15,849 14,847 Provision for income tax 48 26 49 23 Consolidated net income 7,102 6,861 15,800 14,824 238 256 527 568 6,864$ 6,605$ 15,273$ 14,256$ Basic earnings per common share 0.38$ 0.42$ 0.84$ 0.92$ Diluted earnings per common share 0.36$ 0.42$ 0.82$ 0.92$ Weighted average shares - basic 18,008,499 15,742,932 17,992,692 15,524,725 Weighted average shares - diluted 23,026,679 16,389,126 18,813,549 16,174,164 Less: consolidated net income attributable to the noncontrolling interest Consolidated net income attributable to common stockholders

Consolidated Balance Sheets 14 (1) Mortgage loans includes $ 699,566 and $598,643 of loans at June 30, 2017 and December 31, 2016, respectively, transferred to securitization trusts that are variable interest entities (“VIEs”) , these loans can only be used to settle obligations of the VIEs. Secured borrowings consist of notes issued by VIEs that can only be sett led with the assets and cash flows of the VIEs. The creditors do not have recourse to the primary beneficiary (Great Ajax Corp ). (2) Property held for sale, net, includes valuation allowances of $1,304 and $1,620 at June 30, 2017, and December 31, 2016, res pec tively. (Dollars in thousands except per share amounts) (unaudited) ASSETS June 30, 2017 December 31, 2016 Cash and cash equivalents 42,040$ 35,723$ Cash held in trust 29 1,185 Mortgage loans, net (1) 1,044,745 869,091 Property held-for-sale 28,278 23,882 Rental property, net 1,969 1,289 Investment in securities 6,303 6,323 Receivable from servicer 16,067 12,481 Investment in affiliate 1,862 4,253 Prepaid expenses and other assets 4,829 3,175 Total Assets 1,146,122$ 957,402$ LIABILITIES AND EQUITY Liabilities: Secured borrowings (1) 522,706$ 442,670$ Borrowings under repurchase agreement 245,526 227,440 Senior convertible notes, net 82,083 - Management fee payable 750 750 Accrued expenses and other liabilities 2,697 3,819 Total liabilities 853,762 674,679 Commitments and contingencies (See Note 7) Equity: - - Common stock $0.01 par value; 125,000,000 shares authorized, 18,169,424 shares issued and outstanding, and 18,122,387 shares issued and outstanding at June 30, 2017 and December 31, 2016, respectively 182 181 Additional paid-in capital 248,803 244,880 Retained earnings 32,880 27,231 Accumulated other comprehensive loss (131) - Equity attributable to common stockholders 281,734 272,292 Noncontrolling interests 10,626 10,431 Total equity 292,360 282,723 Total Liabilities and Equity 1,146,122$ 957,402$ Preferred stock $0.01 par value; 25,000,000 shares authorized, none issued or outstanding