Attached files
| file | filename |
|---|---|
| EX-31.1 - EXHIBIT 31.1 - FLOTEK INDUSTRIES INC/CN/ | exhibit311-10q06302017.htm |
| EX-32.1 - EXHIBIT 32.1 - FLOTEK INDUSTRIES INC/CN/ | exhibit321-10q06302017.htm |
| EX-31.2 - EXHIBIT 31.2 - FLOTEK INDUSTRIES INC/CN/ | exhibit312-10q06302017.htm |
| EX-10.2 - EXHIBIT 10.2 - FLOTEK INDUSTRIES INC/CN/ | exhibit102-novassetpurchas.htm |
| EX-32.2 - EXHIBIT 32.2 - FLOTEK INDUSTRIES INC/CN/ | exhibit322-10q06302017.htm |
UNITED STATES
SECURITIES AND EXCHANGE COMMISSION
Washington, D.C. 20549
FORM 10-Q |
x | QUARTERLY REPORT PURSUANT TO SECTION 13 OR 15(d) OF THE SECURITIES EXCHANGE ACT OF 1934 |
For the quarterly period ended June 30, 2017
or
¨ | TRANSITION REPORT PURSUANT TO SECTION 13 OR 15(d) OF THE SECURITIES EXCHANGE ACT OF 1934 |
For the transition period from to
Commission File Number 1-13270
FLOTEK INDUSTRIES, INC. (Exact name of registrant as specified in its charter) |
Delaware | 90-0023731 | |
(State or other jurisdiction of incorporation or organization) | (I.R.S. Employer Identification No.) | |
10603 W. Sam Houston Parkway N., Suite 300 Houston, TX | 77064 | |
(Address of principal executive offices) | (Zip Code) | |
(713) 849-9911
(Registrant’s telephone number, including area code)
Indicate by check mark whether the registrant (1) has filed all reports required to be filed by Section 13 or 15(d) of the Securities Exchange Act of 1934 during the preceding 12 months (or for such shorter period that the registrant was required to file such reports), and (2) has been subject to such filing requirements for the past 90 days. Yes x No ¨
Indicate by check mark whether the registrant has submitted electronically and posted on its corporate Website, if any, every Interactive Data File required to be submitted and posted pursuant to Rule 405 of Regulation S-T (§232.405 of this chapter) during the preceding 12 months (or for such shorter period that the registrant was required to submit and post such files). Yes x No ¨
Indicate by check mark whether the registrant is a large accelerated filer, an accelerated filer, a non-accelerated filer, or a smaller reporting company. See the definitions of “large accelerated filer,” “accelerated filer,” “smaller reporting company,” and “emerging growth company” in Rule 12b-2 of the Exchange Act.
Large accelerated filer | ¨ | Accelerated filer | x | |||
Non-accelerated filer | ¨ (Do not check if a smaller reporting company) | Smaller reporting company | ¨ | |||
Emerging growth company | ¨ | |||||
If an emerging growth company, indicate by check mark if the registrant has elected not to use the extended transition period for complying with any new or revised financial accounting standards provided pursuant to Section 13(a) of the Exchange Act. ¨
Indicate by check mark whether the registrant is a shell company (as defined in Rule 12b-2 of the Exchange Act). Yes ¨ No x
As of July 28, 2017, there were 57,332,720 outstanding shares of Flotek Industries, Inc. common stock, $0.0001 par value.
TABLE OF CONTENTS
2
PART I — FINANCIAL INFORMATION
Item 1. Financial Statements
FLOTEK INDUSTRIES, INC.
UNAUDITED CONDENSED CONSOLIDATED BALANCE SHEETS
(in thousands, except share data)
June 30, 2017 | December 31, 2016 | ||||||
ASSETS | |||||||
Current assets: | |||||||
Cash and cash equivalents | $ | 3,422 | $ | 4,823 | |||
Accounts receivable, net of allowance for doubtful accounts of $994 and $664 at June 30, 2017 and December 31, 2016, respectively | 60,089 | 47,152 | |||||
Inventories | 78,410 | 58,283 | |||||
Income taxes receivable | 3,872 | 12,752 | |||||
Assets held for sale | 7,197 | 43,900 | |||||
Other current assets | 6,079 | 21,708 | |||||
Total current assets | 159,069 | 188,618 | |||||
Property and equipment, net | 74,396 | 74,691 | |||||
Goodwill | 56,660 | 56,660 | |||||
Deferred tax assets, net | 19,972 | 12,894 | |||||
Other intangible assets, net | 49,080 | 50,352 | |||||
TOTAL ASSETS | $ | 359,177 | $ | 383,215 | |||
LIABILITIES AND EQUITY | |||||||
Current liabilities: | |||||||
Accounts payable | $ | 28,554 | $ | 29,960 | |||
Accrued liabilities | 8,488 | 12,170 | |||||
Interest payable | 21 | 24 | |||||
Liabilities held for sale | 2,416 | 4,961 | |||||
Current portion of long-term debt | 42,716 | 40,566 | |||||
Total current liabilities | 82,195 | 87,681 | |||||
Long-term debt, less current portion | — | 7,833 | |||||
Total liabilities | 82,195 | 95,514 | |||||
Commitments and contingencies | |||||||
Equity: | |||||||
Cumulative convertible preferred stock, $0.0001 par value, 100,000 shares authorized; no shares issued and outstanding | — | — | |||||
Common stock, $0.0001 par value, 80,000,000 shares authorized; 60,504,613 shares issued and 57,313,766 shares outstanding at June 30, 2017; 59,684,669 shares issued and 56,972,580 shares outstanding at December 31, 2016 | 6 | 6 | |||||
Additional paid-in capital | 331,126 | 318,392 | |||||
Accumulated other comprehensive income (loss) | (970 | ) | (956 | ) | |||
Retained earnings (accumulated deficit) | (25,633 | ) | (9,830 | ) | |||
Treasury stock, at cost; 2,709,680 and 2,028,847 shares at June 30, 2017 and December 31, 2016, respectively | (27,905 | ) | (20,269 | ) | |||
Flotek Industries, Inc. stockholders’ equity | 276,624 | 287,343 | |||||
Noncontrolling interests | 358 | 358 | |||||
Total equity | 276,982 | 287,701 | |||||
TOTAL LIABILITIES AND EQUITY | $ | 359,177 | $ | 383,215 | |||
See accompanying Notes to Unaudited Condensed Consolidated Financial Statements.
3
FLOTEK INDUSTRIES, INC.
UNAUDITED CONDENSED CONSOLIDATED STATEMENTS OF OPERATIONS
(in thousands, except per share data)
Three months ended June 30, | Six months ended June 30, | ||||||||||||||
2017 | 2016 | 2017 | 2016 | ||||||||||||
Revenue | $ | 85,177 | $ | 64,079 | $ | 165,131 | $ | 127,890 | |||||||
Cost of revenue | 59,086 | 42,361 | 111,298 | 82,379 | |||||||||||
Gross profit | 26,091 | 21,718 | 53,833 | 45,511 | |||||||||||
Expenses: | |||||||||||||||
Corporate general and administrative | 11,155 | 9,557 | 23,426 | 20,096 | |||||||||||
Segment selling and administrative | 9,386 | 8,067 | 19,695 | 17,105 | |||||||||||
Depreciation and amortization | 2,479 | 1,905 | 4,924 | 3,806 | |||||||||||
Research and development | 4,109 | 2,048 | 7,250 | 3,995 | |||||||||||
Loss (gain) on disposal of long-lived assets | 214 | (15 | ) | 412 | (15 | ) | |||||||||
Total expenses | 27,343 | 21,562 | 55,707 | 44,987 | |||||||||||
(Loss) income from operations | (1,252 | ) | 156 | (1,874 | ) | 524 | |||||||||
Other (expense) income: | |||||||||||||||
Interest expense | (549 | ) | (610 | ) | (1,145 | ) | (1,018 | ) | |||||||
Other (expense) income, net | 237 | (47 | ) | 391 | (53 | ) | |||||||||
Total other expense | (312 | ) | (657 | ) | (754 | ) | (1,071 | ) | |||||||
Loss before income taxes | (1,564 | ) | (501 | ) | (2,628 | ) | (547 | ) | |||||||
Income tax benefit | 442 | 390 | 762 | 407 | |||||||||||
Loss from continuing operations | (1,122 | ) | (111 | ) | (1,866 | ) | (140 | ) | |||||||
Loss from discontinued operations, net of tax | (2,704 | ) | (2,169 | ) | (13,937 | ) | (32,325 | ) | |||||||
Net loss | $ | (3,826 | ) | $ | (2,280 | ) | $ | (15,803 | ) | $ | (32,465 | ) | |||
Basic earnings (loss) per common share: | |||||||||||||||
Continuing operations | $ | (0.02 | ) | $ | — | (0.03 | ) | — | |||||||
Discontinued operations, net of tax | (0.05 | ) | (0.04 | ) | (0.24 | ) | (0.59 | ) | |||||||
Basic earnings (loss) per common share | $ | (0.07 | ) | $ | (0.04 | ) | $ | (0.27 | ) | $ | (0.59 | ) | |||
Diluted earnings (loss) per common share: | |||||||||||||||
Continuing operations | $ | (0.02 | ) | $ | — | (0.03 | ) | — | |||||||
Discontinued operations, net of tax | (0.05 | ) | (0.04 | ) | (0.24 | ) | (0.59 | ) | |||||||
Diluted earnings (loss) per common share | $ | (0.07 | ) | $ | (0.04 | ) | $ | (0.27 | ) | $ | (0.59 | ) | |||
Weighted average common shares: | |||||||||||||||
Weighted average common shares used in computing basic earnings (loss) per common share | 57,854 | 54,910 | 57,764 | 54,827 | |||||||||||
Weighted average common shares used in computing diluted earnings (loss) per common share | 57,854 | 54,910 | 57,764 | 54,827 | |||||||||||
See accompanying Notes to Unaudited Condensed Consolidated Financial Statements.
4
FLOTEK INDUSTRIES, INC.
UNAUDITED CONDENSED CONSOLIDATED STATEMENTS OF COMPREHENSIVE INCOME
(in thousands)
Three months ended June 30, | Six months ended June 30, | ||||||||||||||
2017 | 2016 | 2017 | 2016 | ||||||||||||
Loss from continuing operations | $ | (1,122 | ) | $ | (111 | ) | $ | (1,866 | ) | $ | (140 | ) | |||
Loss from discontinued operations, net of tax | (2,704 | ) | (2,169 | ) | (13,937 | ) | (32,325 | ) | |||||||
Net loss | (3,826 | ) | (2,280 | ) | (15,803 | ) | (32,465 | ) | |||||||
Other comprehensive income (loss): | |||||||||||||||
Foreign currency translation adjustment | (5 | ) | 7 | (14 | ) | 324 | |||||||||
Comprehensive income (loss) | $ | (3,831 | ) | $ | (2,273 | ) | $ | (15,817 | ) | $ | (32,141 | ) | |||
See accompanying Notes to Unaudited Condensed Consolidated Financial Statements.
5
FLOTEK INDUSTRIES, INC.
UNAUDITED CONDENSED CONSOLIDATED STATEMENTS OF CASH FLOWS
(in thousands)
Six months ended June 30, | |||||||
2017 | 2016 | ||||||
Cash flows from operating activities: | |||||||
Net loss | $ | (15,803 | ) | $ | (32,465 | ) | |
Loss from discontinued operations, net of tax | (13,937 | ) | (32,325 | ) | |||
Loss from continuing operations | (1,866 | ) | (140 | ) | |||
Adjustments to reconcile loss from continuing operations to net cash used in operating activities: | |||||||
Depreciation and amortization | 6,023 | 4,651 | |||||
Amortization of deferred financing costs | 253 | 205 | |||||
Loss (gain) on sale of assets | 412 | (15 | ) | ||||
Stock compensation expense | 6,653 | 5,128 | |||||
Deferred income tax benefit | (7,329 | ) | (8,076 | ) | |||
Reduction in tax benefit related to share-based awards | 315 | 954 | |||||
Changes in current assets and liabilities: | |||||||
Accounts receivable, net | (12,874 | ) | (51 | ) | |||
Inventories | (20,023 | ) | (7,624 | ) | |||
Income taxes receivable | 8,619 | (11,535 | ) | ||||
Other current assets | 14,185 | (414 | ) | ||||
Accounts payable | (1,418 | ) | 3,622 | ||||
Accrued liabilities | (180 | ) | 11,685 | ||||
Income taxes payable | (10 | ) | (1,759 | ) | |||
Interest payable | (3 | ) | 74 | ||||
Net cash used in operating activities | (7,243 | ) | (3,295 | ) | |||
Cash flows from investing activities: | |||||||
Capital expenditures | (4,508 | ) | (8,238 | ) | |||
Proceeds from sales of businesses | 17,490 | — | |||||
Proceeds from sale of assets | 310 | 24 | |||||
Purchase of patents and other intangible assets | (247 | ) | (140 | ) | |||
Net cash provided by (used in) investing activities | 13,045 | (8,354 | ) | ||||
Cash flows from financing activities: | |||||||
Repayments of indebtedness | (9,833 | ) | (3,571 | ) | |||
Borrowings on revolving credit facility | 224,757 | 171,397 | |||||
Repayments on revolving credit facility | (220,607 | ) | (153,460 | ) | |||
Debt issuance costs | (106 | ) | (147 | ) | |||
Reduction in tax benefit related to share-based awards | — | (954 | ) | ||||
Purchase of treasury stock related to share-based awards | (1,335 | ) | (609 | ) | |||
Proceeds from sale of common stock | 368 | 446 | |||||
Repurchase of common stock | (487 | ) | — | ||||
Proceeds from exercise of stock options | 20 | 134 | |||||
Net cash (used in) provided by financing activities | (7,223 | ) | 13,236 | ||||
Discontinued operations: | |||||||
Net cash used in operating activities | (794 | ) | (59 | ) | |||
Net cash provided by investing activities | 794 | 51 | |||||
Net cash flows used in discontinued operations | — | (8 | ) | ||||
Effect of changes in exchange rates on cash and cash equivalents | 20 | 53 | |||||
Net (decrease) increase in cash and cash equivalents | (1,401 | ) | 1,632 | ||||
Cash and cash equivalents at the beginning of period | 4,823 | 2,208 | |||||
Cash and cash equivalents at the end of period | $ | 3,422 | $ | 3,840 | |||
See accompanying Notes to Unaudited Condensed Consolidated Financial Statements.
6
FLOTEK INDUSTRIES, INC.
UNAUDITED CONDENSED CONSOLIDATED STATEMENT OF EQUITY
(in thousands)
Common Stock | Treasury Stock | Additional Paid-in Capital | Accumulated Other Comprehensive Income (Loss) | Retained Earnings (Accumulated Deficit) | Non-controlling Interests | Total Equity | |||||||||||||||||||||||||||
Shares Issued | Par Value | Shares | Cost | ||||||||||||||||||||||||||||||
Balance, December 31, 2016 | 59,685 | $ | 6 | 2,029 | $ | (20,269 | ) | $ | 318,392 | $ | (956 | ) | $ | (9,830 | ) | $ | 358 | $ | 287,701 | ||||||||||||||
Net loss | — | — | — | — | — | — | (15,803 | ) | — | (15,803 | ) | ||||||||||||||||||||||
Foreign currency translation adjustment | — | — | — | — | — | (14 | ) | — | — | (14 | ) | ||||||||||||||||||||||
Stock issued under employee stock purchase plan | — | — | (40 | ) | — | 368 | — | — | — | 368 | |||||||||||||||||||||||
Common stock issued in payment of accrued liability | — | — | — | — | 188 | — | — | — | 188 | ||||||||||||||||||||||||
Stock options exercised | 651 | — | — | — | 5,834 | — | — | — | 5,834 | ||||||||||||||||||||||||
Stock surrendered for exercise of stock options | — | — | 470 | (5,814 | ) | — | — | — | — | (5,814 | ) | ||||||||||||||||||||||
Restricted stock granted | 169 | — | — | — | — | — | — | — | — | ||||||||||||||||||||||||
Restricted stock forfeited | — | — | 76 | — | — | — | — | — | — | ||||||||||||||||||||||||
Treasury stock purchased | — | — | 125 | (1,335 | ) | — | — | — | — | (1,335 | ) | ||||||||||||||||||||||
Stock compensation expense | — | — | — | — | 6,344 | — | — | — | 6,344 | ||||||||||||||||||||||||
Repurchase of common stock | — | — | 50 | (487 | ) | — | — | — | — | (487 | ) | ||||||||||||||||||||||
Balance, June 30, 2017 | 60,505 | $ | 6 | 2,710 | $ | (27,905 | ) | $ | 331,126 | $ | (970 | ) | $ | (25,633 | ) | $ | 358 | $ | 276,982 | ||||||||||||||
See accompanying Notes to Unaudited Condensed Consolidated Financial Statements.
7
FLOTEK INDUSTRIES, INC.
NOTES TO UNAUDITED CONDENSED CONSOLIDATED FINANCIAL STATEMENTS
Note 1 — Organization and Significant Accounting Policies
Organization and Nature of Operations
Flotek Industries, Inc. (“Flotek” or the “Company”) is a global, diversified, technology-driven company that develops and supplies chemistry and services to the oil and gas industries, and high value compounds to companies that make cleaning products, cosmetics, food and beverages, and other products that are sold in consumer and industrial markets.
The Company’s oilfield business includes specialty chemistries and logistics which enable its customers in pursuing improved efficiencies in the drilling and completion of their wells. The Company also provides automated bulk material handling, loading facilities, and blending capabilities. The Company processes citrus oil to produce (1) high value compounds used as additives by companies in the flavors and fragrances markets and (2) environmentally friendly chemistries for use in numerous industries around the world, including the oil and gas (“O&G”) industry.
Flotek operates in over 20 domestic and international markets. Customers include major integrated O&G companies, oilfield services companies, independent O&G companies, pressure-pumping service companies, national and state-owned oil companies, and international supply chain management companies. The Company also serves customers who purchase non-energy-related citrus oil and related products, including household and commercial cleaning product companies, fragrance and cosmetic companies, and food manufacturing companies.
Flotek was initially incorporated under the laws of the Province of British Columbia on May 17, 1985. On October 23, 2001, Flotek changed its corporate domicile to the state of Delaware.
Basis of Presentation
The accompanying Unaudited Condensed Consolidated Financial Statements and accompanying footnotes (collectively the “Financial Statements”) reflect all adjustments, in the opinion of management, necessary for fair presentation of the financial condition and results of operations for the periods presented. All such adjustments are normal and recurring in nature. The Financial Statements, including selected notes, have been prepared in accordance with applicable rules and regulations of the Securities and Exchange Commission (“SEC”) regarding interim financial reporting and do not include all information and disclosures required by accounting principles generally accepted in the United States of America (“U.S. GAAP”) for comprehensive financial statement reporting. These interim Financial Statements should be read in conjunction with the audited consolidated financial statements and notes included in the Company’s Annual Report on Form 10-K for the fiscal year ended December 31, 2016 (“Annual Report”). A copy of the Annual Report is available on the SEC’s website, www.sec.gov, under the Company’s ticker symbol (“FTK”) or on Flotek’s website, www.flotekind.com. The results of operations for the three and six months ended June 30, 2017, are not necessarily indicative of the results to be expected for the year ending December 31, 2017.
During the fourth quarter of 2016, the Company classified the Drilling Technologies and Production Technologies segments as held for sale based on management’s intention to sell these businesses. The Company’s historical financial statements have been revised to present the operating results of the Drilling Technologies and Production Technologies segments as discontinued operations. The results of operations of Drilling Technologies and Production Technologies are presented as “Loss from discontinued operations” in the statement of operations and the related cash flows of these segments has been reclassified to discontinued operations for all periods presented. The assets and liabilities of the Drilling Technologies and Production Technologies segments have been reclassified to “Assets held for sale” and “Liabilities held for sale”, respectively, in the consolidated balance sheets for all periods presented.
Use of Estimates
The preparation of financial statements in conformity with U.S. GAAP requires management to make estimates and assumptions that affect reported amounts of assets and liabilities, disclosure of contingent assets and liabilities, and reported amounts of revenue and expenses. Actual results could differ from these estimates.
Reclassifications
Certain prior period amounts have been reclassified to conform to the current period presentation. The reclassifications did not impact net income (loss).
8
FLOTEK INDUSTRIES, INC.
NOTES TO UNAUDITED CONDENSED CONSOLIDATED FINANCIAL STATEMENTS
Note 2 — Recent Accounting Pronouncements
Application of New Accounting Standards
Effective January 1, 2017, the Company adopted the accounting guidance in Accounting Standards Update (“ASU”) No. 2015-11, “Simplifying the Measurement of Inventory.” This standard requires management to measure inventory at the lower of cost or net realizable value. Net realizable value is the estimated selling prices in the ordinary course of business, less reasonably predictable costs of completion, disposal, and transportation. Implementation of this standard did not have a material effect on the consolidated financial statements and related disclosures.
Effective January 1, 2017, the Company adopted the accounting guidance in ASU No. 2015-17, “Balance Sheet Classification of Deferred Taxes.” This standard eliminated the requirement for organizations to present deferred tax assets and liabilities as current and noncurrent in a classified balance sheet. Instead, organizations are now required to classify all deferred tax assets and liabilities as noncurrent. Implementation of this standard did not have a material effect on the consolidated financial statements and related disclosures. The Company applied this standard retrospectively and, therefore, prior periods presented were adjusted.
Effective January 1, 2017, the Company adopted the accounting guidance in ASU No. 2016-09, “Improvements to Employee Share-Based Payment Accounting.” This standard simplifies several aspects of the accounting for share-based payment transactions, including the income tax consequences, classification of awards as either equity or liabilities, and classification on the statement of cash flows. The new guidance requires excess tax benefits and deficiencies to be recognized in the income statement rather than in additional paid-in capital. As a result of applying this change, the Company recognized $0.3 million of excess tax benefit in the provision for incomes taxes during the six months ended June 30, 2017. The Company applied this standard prospectively, where applicable, and, therefore, prior periods presented were not adjusted.
New Accounting Requirements and Disclosures
In May 2014, the Financial Accounting Standards Board (“FASB”) issued ASU No. 2014-09, “Revenue from Contracts with Customers.” The ASU will supersede most of the existing revenue recognition requirements in U.S. GAAP and will require entities to recognize revenue at an amount that reflects the consideration to which the Company expects to be entitled in exchange for transferring goods or services to a customer. The new standard also requires significantly expanded disclosures regarding the qualitative and quantitative information of an entity’s nature, amount, timing, and uncertainty of revenue and cash flows arising from contracts with customers. In August 2015, the FASB issued ASU No. 2015-14, which deferred the effective date by one year to annual reporting periods beginning after December 15, 2017, including interim periods within that reporting period. In March 2016, the FASB issued ASU No. 2016-08, which improves the operability and understandability of the implementation guidance on principal versus agent considerations. In April 2016, the FASB issued ASU No. 2016-10, which clarifies identifying performance obligations and the licensing implementation guidance. In May 2016, the FASB issued ASU No. 2016-11, which rescinds certain SEC Staff Observer comments that are codified in Topic 605, Revenue Recognition, effective upon adoption of ASU 2014-09, and ASU No. 2016-12, which reduces the potential for diversity in practice at initial application and reduces the cost and complexity of applying Topic 606 both at transition and on an ongoing basis. In December 2016, the FASB issued ASU No. 2016-20, which provides technical corrections and improvements to the original guidance issued. The Company intends to adopt the new standard in the first quarter of 2018 using the modified retrospective method. The Company has identified key contract types representative of its business for comparing historical accounting policies and practices to the new standard and is continuing to evaluate the impact these pronouncements will have on the consolidated financial statements and related disclosures.
In February 2016, the FASB issued ASU No. 2016-02, “Leases.” This standard requires the recognition of lease assets and lease liabilities by lessees for those leases classified as operating leases under previous U.S. GAAP. The pronouncement is effective for annual reporting periods beginning after December 15, 2018, including interim periods within that reporting period and should be applied using a modified retrospective transition approach, with early application permitted. The Company is currently evaluating the impact the pronouncement will have on the consolidated financial statements and related disclosures.
In June 2016, the FASB issued ASU No. 2016-13, “Measurement of Credit Losses on Financial Instruments.” This standard replaces the incurred loss impairment methodology in current U.S. GAAP with a methodology that reflects expected credit losses and requires consideration of a broader range of reasonable and supportable information to inform credit loss estimates. The pronouncement is effective for fiscal years beginning after December 15, 2019, including interim periods within those fiscal years, with early adoption for the fiscal years beginning after December 15, 2018, including interim periods within those fiscal years. The Company is currently evaluating the impact the pronouncement will have on the consolidated financial statements and related disclosures.
9
FLOTEK INDUSTRIES, INC.
NOTES TO UNAUDITED CONDENSED CONSOLIDATED FINANCIAL STATEMENTS
In August 2016, the FASB issued ASU No. 2016-15, “Classification of Certain Cash Receipts and Cash Payments.” This standard addresses eight specific cash flow issues with the objective of reducing the existing diversity in practice. The pronouncement is effective for fiscal years beginning after December 15, 2017, including interim periods within those fiscal years, with early adoption permitted. The Company is currently evaluating the impact the pronouncement will have on the consolidated financial statements and related disclosures.
In January 2017, the FASB issued ASU No. 2017-01, “Clarifying the Definition of a Business.” This standard provides additional guidance on whether an integrated set of assets and activities constitutes a business. The pronouncement is effective for annual periods beginning after December 15, 2017, including interim periods within those periods, with early adoption permitted in specific instances. The Company is currently evaluating the impact the pronouncement will have on the consolidated financial statements and related disclosures.
In January 2017, the FASB issued ASU No. 2017-04, “Simplifying the Test for Goodwill Impairment.” This standard eliminates Step 2 from the goodwill impairment test. An entity will now recognize an impairment charge for the amount by which the carrying amount exceeds the reporting unit’s fair value. The pronouncement is effective for fiscal years beginning after December 15, 2019, including interim periods within those fiscal years, with early adoption permitted. The Company is currently evaluating the impact the pronouncement will have on the consolidated financial statements and related disclosures.
In May 2017, the FASB issued ASU No. 2017-09, “Scope of Modification Accounting.” This standard provides guidance about which changes to the terms or conditions of a share-based payment award require an entity to apply modification accounting under Topic 718. The pronouncement is effective for annual periods beginning after December 15, 2017, including interim periods within those periods, with early adoption permitted. The Company is currently evaluating the impact the pronouncement will have on the consolidated financial statements and related disclosures.
Note 3 — Discontinued Operations
During the fourth quarter 2016, the Company initiated a strategic restructuring of its business to enable a greater focus on its core businesses in energy chemistry and consumer and industrial chemistry. The Company executed a plan to sell or otherwise dispose of the Drilling Technologies and Production Technologies segments. An investment banking advisory services firm was engaged and actively marketed these segments.
The Company met all of the criteria to classify the Drilling Technologies and Production Technologies segments’ assets and liabilities as held for sale in the fourth quarter 2016. Effective December 31, 2016, the Company classified the assets, liabilities, and results of operations for these two segments as “Discontinued Operations” for all periods presented.
Disposal of the Drilling Technologies and Production Technologies reporting segments represented a strategic shift that would have a major effect on the Company’s operations and financial results.
On May 22, 2017, the Company completed the sale of substantially all of the assets and transfer of certain specified liabilities and obligations of the Company’s Drilling Technologies segment to National Oilwell Varco, L.P. (“NOV”) for $17.0 million in cash consideration, subject to normal working capital adjustments, with $1.5 million held back by NOV for up to 18 months to satisfy potential indemnification claims.
On May 23, 2017, the Company completed the sale of substantially all of the assets and transfer of certain specified liabilities and obligations of the Company’s Production Technologies segment to Raptor Lift Solutions, LLC (“Raptor Lift”) for $2.9 million in cash consideration, with $0.4 million held back by Raptor Lift to satisfy potential indemnification claims.
10
FLOTEK INDUSTRIES, INC.
NOTES TO UNAUDITED CONDENSED CONSOLIDATED FINANCIAL STATEMENTS
The following summarized financial information has been segregated from continuing operations and reported as Discontinued Operations for the three and six months ended June 30, 2017 and 2016 (in thousands):
Three months ended June 30, | Six months ended June 30, | ||||||||||||||
2017 | 2016 | 2017 | 2016 | ||||||||||||
Drilling Technologies | |||||||||||||||
Revenue | $ | 4,737 | $ | 6,372 | $ | 11,534 | $ | 12,829 | |||||||
Cost of revenue | (2,603 | ) | (4,155 | ) | (7,259 | ) | (9,587 | ) | |||||||
Selling, general and administrative | (2,740 | ) | (3,495 | ) | (5,771 | ) | (8,155 | ) | |||||||
Depreciation and amortization | — | (337 | ) | — | (1,085 | ) | |||||||||
Research and development | (6 | ) | (22 | ) | (6 | ) | (65 | ) | |||||||
Gain (loss) on disposal of long-lived assets | (12 | ) | 19 | 62 | 16 | ||||||||||
Impairment of inventory and long-lived assets | — | — | — | (36,522 | ) | ||||||||||
Loss from operations | (624 | ) | (1,618 | ) | (1,440 | ) | (42,569 | ) | |||||||
Other expense | (46 | ) | (69 | ) | (117 | ) | (243 | ) | |||||||
Loss on sale of businesses | (1,365 | ) | — | (1,365 | ) | — | |||||||||
Loss on write-down of assets held for sale | (272 | ) | — | (6,831 | ) | — | |||||||||
Loss before income taxes | (2,307 | ) | (1,687 | ) | (9,753 | ) | (42,812 | ) | |||||||
Income tax benefit | 158 | 456 | 3,147 | 14,881 | |||||||||||
Net loss from discontinued operations | $ | (2,149 | ) | $ | (1,231 | ) | $ | (6,606 | ) | $ | (27,931 | ) | |||
Production Technologies | |||||||||||||||
Revenue | $ | 849 | $ | 1,868 | $ | 4,002 | $ | 3,889 | |||||||
Cost of revenue | (707 | ) | (1,882 | ) | (3,189 | ) | (3,793 | ) | |||||||
Selling, general and administrative | (802 | ) | (897 | ) | (1,675 | ) | (2,051 | ) | |||||||
Depreciation and amortization | — | (149 | ) | — | (298 | ) | |||||||||
Research and development | (92 | ) | (201 | ) | (363 | ) | (467 | ) | |||||||
Loss on disposal of long-lived assets | — | — | — | (59 | ) | ||||||||||
Impairment of inventory | — | — | — | (3,913 | ) | ||||||||||
Loss from operations | (752 | ) | (1,261 | ) | (1,225 | ) | (6,692 | ) | |||||||
Other expense | (16 | ) | (23 | ) | (52 | ) | (44 | ) | |||||||
Gain on sale of businesses | 171 | — | 171 | — | |||||||||||
Loss on write-down of assets held for sale | — | — | (9,718 | ) | — | ||||||||||
Loss before income taxes | (597 | ) | (1,284 | ) | (10,824 | ) | (6,736 | ) | |||||||
Income tax benefit | 42 | 346 | 3,493 | 2,342 | |||||||||||
Net loss from discontinued operations | $ | (555 | ) | $ | (938 | ) | $ | (7,331 | ) | $ | (4,394 | ) | |||
Drilling Technologies and Production Technologies | |||||||||||||||
Loss from discontinued operations, net of tax | $ | (2,704 | ) | $ | (2,169 | ) | $ | (13,937 | ) | $ | (32,325 | ) | |||
11
FLOTEK INDUSTRIES, INC.
NOTES TO UNAUDITED CONDENSED CONSOLIDATED FINANCIAL STATEMENTS
The assets and liabilities held for sale on the Consolidated Balance Sheets as of June 30, 2017 and December 31, 2016 are as follows (in thousands):
Drilling Technologies | Production Technologies | ||||||||||||||
June 30, 2017 | December 31, 2016 | June 30, 2017 | December 31, 2016 | ||||||||||||
Assets: | |||||||||||||||
Accounts receivable, net | $ | 2,448 | $ | 5,072 | $ | 539 | $ | 1,784 | |||||||
Inventories | 1,942 | 9,078 | — | 8,115 | |||||||||||
Other current assets | 1,595 | 278 | 697 | 370 | |||||||||||
Long-term receivable | — | — | — | 4,179 | |||||||||||
Property and equipment, net | 880 | 11,277 | — | 3,978 | |||||||||||
Goodwill | — | 15,333 | — | 1,689 | |||||||||||
Other intangible assets, net | — | 7,395 | — | 484 | |||||||||||
Assets held for sale | 6,865 | 48,433 | 1,236 | 20,599 | |||||||||||
Valuation allowance | (904 | ) | (18,971 | ) | — | (6,161 | ) | ||||||||
Assets held for sale, net | $ | 5,961 | $ | 29,462 | $ | 1,236 | $ | 14,438 | |||||||
Liabilities: | |||||||||||||||
Accounts payable | $ | 388 | $ | 2,472 | $ | 40 | $ | 914 | |||||||
Accrued liabilities | 1,607 | 1,190 | 381 | 385 | |||||||||||
Liabilities held for sale | $ | 1,995 | $ | 3,662 | $ | 421 | $ | 1,299 | |||||||
Note 4 — Impairment of Inventory and Long-Lived Assets for Discontinued Operations
During the three months ended March 31, 2016, as a result of changes in the oil and gas industry that occurred since the beginning of 2016 and the corresponding impact on the Company’s business outlook, the Company evaluated the direction of its business activities. Crude oil prices, which appeared to have stabilized during the fourth quarter of 2015, fell further during the first quarter of 2016, decreasing approximately 21% from average prices seen in the fourth quarter of 2015. The U.S. drilling rig count declined from 698 at December 31, 2015 to 450 at April 1, 2016, a decline of 35.5%.
Due to the decreased rig activity and its impact on management’s expectations for future market activity, the Company further refocused operations of its Drilling Technologies segment. The Company decided to exit the business of building and repairing motors in all domestic markets. In addition, changes in drilling technique, including further escalation of the move to a dominance of pad drilling, reduced the marketability of certain other inventory items. The focus of the Production Technologies segment was shifted to its new technologies for electric submersible pumps for the oil and gas industry and for hydraulic pumping units. Inventory associated with older technologies for these items has been evaluated for impairment. As a result of these changes in focus and projected declines in asset utilization, the Company recorded a pre-tax impairment of inventories as noted below.
Changes in the business climate noted above and increasing operating losses experienced within the Drilling Technologies and Production Technologies segments during the three months ended March 31, 2016, caused the Company to test asset groups within these two segments for recoverability. Recoverability of the carrying value of the asset groups was based upon estimated future cash flows while taking into consideration various assumptions and estimates, including future use of the assets, remaining useful life of the assets, and eventual disposition of the assets. Undiscounted estimated cash flows of two asset groups associated with domestic operations in the Drilling Technologies segment did not exceed the carrying value of the respective asset groups. Therefore, the Company performed an analysis of discounted future cash flows to determine the fair value of each of these two asset groups. As a result of this testing, the Company recorded a pre-tax impairment of long-lived assets as noted below.
12
FLOTEK INDUSTRIES, INC.
NOTES TO UNAUDITED CONDENSED CONSOLIDATED FINANCIAL STATEMENTS
The Company recorded impairment charges during the three months ended March 31, 2016, as follows (in thousands):
Drilling Technologies: | |||
Inventories | $ | 12,653 | |
Long-lived assets: | |||
Property and equipment | 14,642 | ||
Intangible assets other than goodwill | 9,227 | ||
Production Technologies: | |||
Inventories | 3,913 | ||
Total impairment | $ | 40,435 | |
Based on the changes in the business climate discussed above and continuing operating losses experienced during the three months ended March 31, 2016 and June 30, 2016, goodwill within the Teledrift and Production Technologies reporting units was tested for impairment during these periods. However, no impairments of goodwill were recorded based upon this testing.
Note 5 — Supplemental Cash Flow Information
Supplemental cash flow information is as follows (in thousands):
Six months ended June 30, | |||||||
2017 | 2016 | ||||||
Supplemental non-cash investing and financing activities: | |||||||
Value of common stock issued in payment of accrued liability | $ | 188 | $ | — | |||
Exercise of stock options by common stock surrender | 5,814 | — | |||||
Supplemental cash payment information: | |||||||
Interest paid | $ | 1,069 | $ | 921 | |||
Income taxes received, net of payments (paid, net of refunds) | 9,489 | (3,429 | ) | ||||
Note 6 — Revenue
The Company differentiates revenue and cost of revenue based on whether the source of revenue is attributable to products or services. Revenue and cost of revenue by source are as follows (in thousands):
Three months ended June 30, | Six months ended June 30, | ||||||||||||||
2017 | 2016 | 2017 | 2016 | ||||||||||||
Revenue: | |||||||||||||||
Products | $ | 83,835 | $ | 62,561 | $ | 162,350 | $ | 124,560 | |||||||
Services | 1,342 | 1,518 | 2,781 | 3,330 | |||||||||||
$ | 85,177 | $ | 64,079 | $ | 165,131 | $ | 127,890 | ||||||||
Cost of revenue: | |||||||||||||||
Products | $ | 57,052 | $ | 41,692 | $ | 107,741 | $ | 80,936 | |||||||
Services | 1,522 | 172 | 2,458 | 598 | |||||||||||
Depreciation | 512 | 497 | 1,099 | 845 | |||||||||||
$ | 59,086 | $ | 42,361 | $ | 111,298 | $ | 82,379 | ||||||||
Note 7 — Inventories
Inventories are as follows (in thousands):
June 30, 2017 | December 31, 2016 | ||||||
Raw materials | $ | 42,668 | $ | 28,626 | |||
Work-in-process | 2,933 | 2,918 | |||||
Finished goods | 32,809 | 26,739 | |||||
Inventories | $ | 78,410 | $ | 58,283 | |||
13
FLOTEK INDUSTRIES, INC.
NOTES TO UNAUDITED CONDENSED CONSOLIDATED FINANCIAL STATEMENTS
Note 8 — Property and Equipment
Property and equipment are as follows (in thousands):
June 30, 2017 | December 31, 2016 | ||||||
Land | $ | 6,551 | $ | 5,837 | |||
Buildings and leasehold improvements | 43,052 | 42,986 | |||||
Machinery, equipment and rental tools | 38,213 | 36,187 | |||||
Equipment in progress | 5,091 | 3,235 | |||||
Furniture and fixtures | 2,026 | 1,969 | |||||
Transportation equipment | 2,449 | 3,059 | |||||
Computer equipment and software | 12,069 | 11,844 | |||||
Property and equipment | 109,451 | 105,117 | |||||
Less accumulated depreciation | (35,055 | ) | (30,426 | ) | |||
Property and equipment, net | $ | 74,396 | $ | 74,691 | |||
Depreciation expense, including expense recorded in cost of revenue, totaled $2.3 million and $1.7 million for the three months ended June 30, 2017 and 2016, respectively, and $4.7 million and $3.2 million for the six months ended June 30, 2017 and 2016, respectively.
During the three and six months ended June 30, 2017 and 2016, no impairments were recognized related to property and equipment.
Note 9 — Goodwill
Changes in the carrying value of goodwill for each reporting unit are as follows (in thousands):
Energy Chemistry Technologies | Consumer and Industrial Chemistry Technologies | Total | |||||||||
Balance at December 31, 2016 | $ | 37,180 | $ | 19,480 | $ | 56,660 | |||||
Goodwill impairment recognized | — | — | — | ||||||||
Balance at June 30, 2017 | $ | 37,180 | $ | 19,480 | $ | 56,660 | |||||
During the three and six months ended June 30, 2017 and 2016, no impairments of goodwill were recognized.
Note 10 — Other Intangible Assets
Other intangible assets are as follows (in thousands):
June 30, 2017 | December 31, 2016 | ||||||||||||||
Cost | Accumulated Amortization | Cost | Accumulated Amortization | ||||||||||||
Finite-lived intangible assets: | |||||||||||||||
Patents and technology | $ | 17,099 | $ | 5,060 | $ | 16,815 | $ | 4,537 | |||||||
Customer lists | 30,877 | 7,343 | 30,877 | 6,518 | |||||||||||
Trademarks and brand names | 1,517 | 1,092 | 1,467 | 1,069 | |||||||||||
Total finite-lived intangible assets acquired | 49,493 | 13,495 | 49,159 | 12,124 | |||||||||||
Deferred financing costs | 1,822 | 370 | 1,804 | 117 | |||||||||||
Total amortizable intangible assets | 51,315 | $ | 13,865 | 50,963 | $ | 12,241 | |||||||||
Indefinite-lived intangible assets: | |||||||||||||||
Trademarks and brand names | 11,630 | 11,630 | |||||||||||||
Total other intangible assets | $ | 62,945 | $ | 62,593 | |||||||||||
Carrying value: | |||||||||||||||
Other intangible assets, net | $ | 49,080 | $ | 50,352 | |||||||||||
14
FLOTEK INDUSTRIES, INC.
NOTES TO UNAUDITED CONDENSED CONSOLIDATED FINANCIAL STATEMENTS
Finite-lived intangible assets acquired are amortized on a straight-line basis over two to 20 years. Amortization of finite-lived intangible assets acquired totaled $0.7 million and $0.7 million for the three months ended June 30, 2017 and 2016, respectively, and $1.4 million and $1.4 million for the six months ended June 30, 2017 and 2016, respectively.
Amortization of deferred financing costs was $0.1 million and $0.1 million for the three months ended June 30, 2017 and 2016, respectively, and $0.3 million and $0.2 million for the six months ended June 30, 2017 and 2016, respectively.
Note 11 — Long-Term Debt and Credit Facility
Long-term debt is as follows (in thousands):
June 30, 2017 | December 31, 2016 | ||||||
Long-term debt: | |||||||
Borrowings under revolving credit facility | $ | 42,716 | $ | 38,566 | |||
Term loan | — | 9,833 | |||||
Total long-term debt | 42,716 | 48,399 | |||||
Less current portion of long-term debt | (42,716 | ) | (40,566 | ) | |||
Long-term debt, less current portion | $ | — | $ | 7,833 | |||
Credit Facility
On May 10, 2013, the Company and certain of its subsidiaries (the “Borrowers”) entered into an Amended and Restated Revolving Credit, Term Loan and Security Agreement (the “Credit Facility”) with PNC Bank, National Association (“PNC Bank”). The Company may borrow under the Credit Facility for working capital, permitted acquisitions, capital expenditures and other corporate purposes. The Credit Facility, as amended, continues in effect until May 10, 2020. Under terms of the Credit Facility, as amended, the Company has total borrowing availability of $65 million; initially, up to $55 million under a revolving credit facility with borrowing of $10 million under a term loan. The revolving credit facility limit will increase by each term loan principal payment, therefore, total borrowing capacity will remain at $65 million throughout the term of the Credit Facility.
The Credit Facility is secured by substantially all of the Company’s domestic real and personal property, including accounts receivable, inventory, land, buildings, equipment and other intangible assets. The Credit Facility contains customary representations, warranties, and both affirmative and negative covenants. The Company was in compliance with all debt covenants at June 30, 2017. The Credit Facility restricts the payment of cash dividends on common stock and limits the amount that may be used to repurchase common stock and preferred stock. In the event of default, PNC Bank may accelerate the maturity date of any outstanding amounts borrowed under the Credit Facility.
The Credit Facility contains financial covenants to maintain a fixed charge coverage ratio and a leverage ratio, as well as establishes an annual limit on capital expenditures. The fixed charge coverage ratio is the ratio of (a) earnings before interest, taxes, depreciation, and amortization (“EBITDA”), adjusted for non-cash stock-based compensation and the loss from discontinued operations, less cash paid for taxes during the period to (b) all debt payments during the period. The fixed charge coverage ratio requirement began for the quarter ended March 31, 2017 at 1.00 to 1.00 and increases to 1.10 to 1.00 for the year ending December 31, 2017, and thereafter. The leverage ratio (funded debt to adjusted EBITDA) requirement begins for the six months ending June 30, 2017, at not greater than 5.50 to 1.10 and reduces to not greater than 4.00 to 1.00 for the year ending March 31, 2018, and thereafter. The annual limit on capital expenditures for 2017 is $20 million. The annual limit on capital expenditures for 2017 is reduced if the undrawn availability under the revolving credit facility falls below $10 million at month-end for April, May, or June 2017 or below $15 million at any other month-end.
Beginning with fiscal year 2017, the Credit Facility includes a provision that 25% of EBITDA minus cash paid for taxes, dividends, debt payments, and unfunded capital expenditures, not to exceed $3.0 million for any year, be paid on the outstanding balance within 60 days of the fiscal year end.
Each of the Company’s domestic subsidiaries is fully obligated for Credit Facility indebtedness as a borrower or as a guarantor.
(a) Revolving Credit Facility
Under the revolving credit facility, the Company may initially borrow up to $55 million through May 10, 2020. This includes a sublimit of $10 million that may be used for letters of credit. As of May 22, 2017, the revolving credit facility limit increased to $65 million upon payment in full of the outstanding term loan principal balance. The revolving credit facility is secured by substantially all of the Company’s domestic accounts receivable and inventory.
15
FLOTEK INDUSTRIES, INC.
NOTES TO UNAUDITED CONDENSED CONSOLIDATED FINANCIAL STATEMENTS
At June 30, 2017, eligible accounts receivable and inventory securing the revolving credit facility provided total borrowing capacity of $64.9 million under the revolving credit facility. Available borrowing capacity, net of outstanding borrowings, was $22.2 million at June 30, 2017.
The interest rate on advances under the revolving credit facility varies based on the fixed charge coverage ratio. Rates range (a) between PNC Bank’s base lending rate plus 1.5% to 2.0% or (b) between the London Interbank Offered Rate (LIBOR) plus 2.5% to 3.0%. PNC Bank’s base lending rate was 4.25% at June 30, 2017. The Company is required to pay a monthly facility fee of 0.25% per annum, on any unused amount under the commitment based on daily averages. At June 30, 2017, $42.7 million was outstanding under the revolving credit facility, with $7.7 million borrowed as base rate loans at an interest rate of 5.75% and $35.0 million borrowed as LIBOR loans at an interest rate of 3.73%.
Borrowing under the revolving credit agreement is classified as current debt as a result of the required lockbox arrangement and the subjective acceleration clause.
(b) Term Loan
The amount borrowed under the term loan was reset to $10 million effective as of September 30, 2016. Monthly principal payments of $0.2 million were required. On May 22, 2017, the Company repaid the outstanding balance of the term loan and the liens on land, buildings, equipment, and other intangible assets were released.
Note 12 — Earnings (Loss) Per Share
Basic earnings (loss) per common share is calculated by dividing net income (loss) by the weighted average number of common shares outstanding for the period. Diluted earnings (loss) per common share is calculated by dividing net income (loss) by the weighted average number of common shares outstanding combined with dilutive common share equivalents outstanding, if the effect is dilutive.
Potentially dilutive securities were excluded from the calculation of diluted loss per share for the three and six months ended June 30, 2017 and 2016, since including them would have an anti-dilutive effect on loss per share due to the net loss incurred during the period. Securities convertible into shares of common stock that were not considered in the diluted loss per share calculations were 12,100 stock options and 1.3 million restricted stock units for the three and six months ended June 30, 2017, and 0.7 million stock options and 0.8 million restricted stock units for the three and six months ended June 30, 2016.
Basic and diluted earnings (loss) per common share are as follows (in thousands, except per share data):
Three months ended June 30, | Six months ended June 30, | ||||||||||||||
2017 | 2016 | 2017 | 2016 | ||||||||||||
Loss from continuing operations | $ | (1,122 | ) | $ | (111 | ) | $ | (1,866 | ) | $ | (140 | ) | |||
Loss from discontinued operations, net of tax | (2,704 | ) | (2,169 | ) | (13,937 | ) | (32,325 | ) | |||||||
Net loss - Basic and Diluted | $ | (3,826 | ) | $ | (2,280 | ) | $ | (15,803 | ) | $ | (32,465 | ) | |||
Weighted average common shares outstanding - Basic | 57,854 | 54,910 | 57,764 | 54,827 | |||||||||||
Assumed conversions: | |||||||||||||||
Incremental common shares from stock options | — | — | — | — | |||||||||||
Incremental common shares from restricted stock units | — | — | — | — | |||||||||||
Weighted average common shares outstanding - Diluted | 57,854 | 54,910 | 57,764 | 54,827 | |||||||||||
Basic earnings (loss) per common share: | |||||||||||||||
Continuing operations | $ | (0.02 | ) | $ | — | $ | (0.03 | ) | $ | — | |||||
Discontinued operations, net of tax | (0.05 | ) | (0.04 | ) | (0.24 | ) | (0.59 | ) | |||||||
Basic earnings (loss) per common share | $ | (0.07 | ) | $ | (0.04 | ) | $ | (0.27 | ) | $ | (0.59 | ) | |||
Diluted earnings (loss) per common share: | |||||||||||||||
Continuing operations | $ | (0.02 | ) | $ | — | $ | (0.03 | ) | $ | — | |||||
Discontinued operations, net of tax | (0.05 | ) | (0.04 | ) | (0.24 | ) | (0.59 | ) | |||||||
Diluted earnings (loss) per common share | $ | (0.07 | ) | $ | (0.04 | ) | $ | (0.27 | ) | $ | (0.59 | ) | |||
16
FLOTEK INDUSTRIES, INC.
NOTES TO UNAUDITED CONDENSED CONSOLIDATED FINANCIAL STATEMENTS
Note 13 — Fair Value Measurements
Fair value is defined as the amount that would be received for selling an asset or paid to transfer a liability in an orderly transaction between market participants at the measurement date. The Company categorizes financial assets and liabilities into the three levels of the fair value hierarchy. The hierarchy prioritizes the inputs to valuation techniques used to measure fair value and bases categorization within the hierarchy on the lowest level of input that is available and significant to the fair value measurement.
• | Level 1 — Quoted prices in active markets for identical assets or liabilities; |
• | Level 2 — Observable inputs other than Level 1, such as quoted prices for similar assets or liabilities, quoted prices in markets that are not active, or other inputs that are observable or can be corroborated by observable market data for substantially the full term of the assets or liabilities; and |
• | Level 3 — Significant unobservable inputs that are supported by little or no market activity or that are based on the reporting entity’s assumptions about the inputs. |
Fair Value of Other Financial Instruments
The carrying amounts of certain financial instruments, including cash and cash equivalents, accounts receivable, accounts payable, and accrued expenses, approximate fair value due to the short-term nature of these accounts. The Company had no cash equivalents at June 30, 2017 or December 31, 2016.
The carrying value and estimated fair value of the Company’s long-term debt are as follows (in thousands):
June 30, 2017 | December 31, 2016 | ||||||||||||||
Carrying Value | Fair Value | Carrying Value | Fair Value | ||||||||||||
Term loan | $ | — | $ | — | $ | 9,833 | $ | 9,833 | |||||||
Borrowings under revolving credit facility | 42,716 | 42,716 | 38,566 | 38,566 | |||||||||||
The carrying value of the term loan and borrowings under the revolving credit facility approximate their fair value because the interest rates are variable.
Assets Measured at Fair Value on a Nonrecurring Basis
The Company’s non-financial assets, including property and equipment, goodwill, and other intangible assets are measured at fair value on a non-recurring basis and are subject to fair value adjustment in certain circumstances. No impairments of any of these assets were recognized during the three and six months ended June 30, 2017 and 2016.
Note 14 — Income Taxes
A reconciliation of the U.S. federal statutory tax rate to the Company’s effective income tax rate is as follows:
Three months ended June 30, | Six months ended June 30, | ||||||||||
2017 | 2016 | 2017 | 2016 | ||||||||
U.S. federal statutory tax rate | (35.0 | )% | (35.0 | )% | (35.0 | )% | (35.0 | )% | |||
State income taxes, net of federal benefit | (4.8 | ) | (4.8 | ) | (3.8 | ) | (4.7 | ) | |||
Non-U.S. income taxed at different rates | (0.1 | ) | (40.8 | ) | 0.1 | (37.2 | ) | ||||
Excess tax benefit related to stock-based awards | 13.4 | — | 10.7 | — | |||||||
Other | (1.8 | ) | 2.8 | (1.0 | ) | 2.5 | |||||
Effective income tax rate | (28.3 | )% | (77.8 | )% | (29.0 | )% | (74.4 | )% | |||
Fluctuations in effective tax rates have historically been impacted by permanent tax differences with no associated income tax impact, changes in state apportionment factors, including the effect on state deferred tax assets and liabilities, and non-U.S. income taxed at different rates. Changes in the effective tax rate during the three and six months ended June 30, 2017, included the Company implementing ASU No. 2016-09 which requires accounting for excess tax benefits and tax deficiencies as discrete items in the period in which they occur.
In January 2017, the Internal Revenue Service notified the Company that it will examine the Company’s federal tax returns for the year ended December 31, 2014. No adjustments have been asserted, and management believes that sustained adjustments, if any, would not have a material effect on the Company’s financial position, results of operations, or liquidity.
17
FLOTEK INDUSTRIES, INC.
NOTES TO UNAUDITED CONDENSED CONSOLIDATED FINANCIAL STATEMENTS
Note 15 — Common Stock
The Company’s Certificate of Incorporation, as amended November 9, 2009, authorizes the Company to issue up to 80 million shares of common stock, par value $0.0001 per share, and 100,000 shares of one or more series of preferred stock, par value $0.0001 per share.
A reconciliation of changes in common shares issued during the six months ended June 30, 2017 is as follows:
Shares issued at December 31, 2016 | 59,684,669 | |
Issued as restricted stock award grants | 168,756 | |
Issued upon exercise of stock options | 651,188 | |
Shares issued at June 30, 2017 | 60,504,613 | |
Stock Repurchase Program
In November 2012, the Company’s Board of Directors authorized the repurchase of up to $25 million of the Company’s common stock. Repurchases may be made in the open market or through privately negotiated transactions. During the three and six months ended June 30, 2017, the Company repurchased 50,000 shares of its outstanding common stock on the open market at a cost of $0.5 million, inclusive of transaction costs, or an average price of $9.76 per share. During the three and six months ended June 30, 2016, the Company did not repurchase any shares of its outstanding common stock.
In June 2015, the Company’s Board of Directors authorized the repurchase of up to an additional $50 million of the Company’s common stock. Repurchases may be made in the open market or through privately negotiated transactions. Through June 30, 2017, the Company has not repurchased any of its common stock under this authorization.
As of June 30, 2017, the Company has $54.4 million remaining under its share repurchase programs. A covenant under the Company’s Credit Facility limits the amount that may be used to repurchase the Company’s common stock. As of June 30, 2017, this covenant limits additional share repurchases to $4.4 million.
Note 16 — Business Segment, Geographic and Major Customer Information
Segment Information
Operating segments are defined as components of an enterprise for which separate financial information is available that is regularly evaluated by chief operating decision-makers in deciding how to allocate resources and assess performance. The operations of the Company are categorized into two reportable segments: Energy Chemistry Technologies and Consumer and Industrial Chemistry Technologies.
• | Energy Chemistry Technologies designs, develops, manufactures, packages, and markets specialty chemistries used in oil and natural gas well drilling, cementing, completion, and stimulation. In addition, the Company’s chemistries are used in specialized enhanced and improved oil recovery markets. Activities in this segment also include construction and management of automated material handling facilities and management of loading facilities and blending operations for oilfield services companies. |
• | Consumer and Industrial Chemistry Technologies designs, develops, and manufactures products that are sold to companies in the flavor and fragrance industry and the specialty chemical industry. These technologies are used by beverage and food companies, fragrance companies, and companies providing household and industrial cleaning products. |
The Company evaluates performance based upon a variety of criteria. The primary financial measure is segment operating income. Various functions, including certain sales and marketing activities and general and administrative activities, are provided centrally by the corporate office. Costs associated with corporate office functions, other corporate income and expense items, and income taxes are not allocated to reportable segments.
18
FLOTEK INDUSTRIES, INC.
NOTES TO UNAUDITED CONDENSED CONSOLIDATED FINANCIAL STATEMENTS
Summarized financial information of the reportable segments is as follows (in thousands):
As of and for the three months ended June 30, | Energy Chemistry Technologies | Consumer and Industrial Chemistry Technologies | Corporate and Other | Total | |||||||||||
2017 | |||||||||||||||
Net revenue from external customers | $ | 65,875 | $ | 19,302 | $ | — | $ | 85,177 | |||||||
Gross profit | 22,804 | 3,287 | — | 26,091 | |||||||||||
Income (loss) from operations | 9,299 | 1,216 | (11,767 | ) | (1,252 | ) | |||||||||
Depreciation and amortization | 1,795 | 583 | 613 | 2,991 | |||||||||||
Capital expenditures | 1,956 | 397 | 278 | 2,631 | |||||||||||
2016 | |||||||||||||||
Net revenue from external customers | $ | 43,385 | $ | 20,694 | $ | — | $ | 64,079 | |||||||
Gross profit | 17,660 | 4,058 | — | 21,718 | |||||||||||
Income (loss) from operations | 7,584 | 2,686 | (10,114 | ) | 156 | ||||||||||
Depreciation and amortization | 1,237 | 608 | 557 | 2,402 | |||||||||||
Capital expenditures | 3,685 | 204 | 559 | 4,448 | |||||||||||
As of and for the six months ended June 30, | Energy Chemistry Technologies | Consumer and Industrial Chemistry Technologies | Corporate and Other | Total | |||||||||||
2017 | |||||||||||||||
Net revenue from external customers | $ | 126,640 | $ | 38,491 | $ | — | $ | 165,131 | |||||||
Gross profit | 45,106 | 8,727 | — | 53,833 | |||||||||||
Income (loss) from operations | 17,848 | 4,921 | (24,643 | ) | (1,874 | ) | |||||||||
Depreciation and amortization | 3,644 | 1,162 | 1,217 | 6,023 | |||||||||||
Capital expenditures | 2,470 | 897 | 1,141 | 4,508 | |||||||||||
2016 | |||||||||||||||
Net revenue from external customers | $ | 88,064 | $ | 39,826 | $ | — | $ | 127,890 | |||||||
Gross profit | 36,429 | 9,082 | — | 45,511 | |||||||||||
Income (loss) from operations | 15,597 | 6,075 | (21,148 | ) | 524 | ||||||||||
Depreciation and amortization | 2,480 | 1,118 | 1,053 | 4,651 | |||||||||||
Capital expenditures | 6,699 | 346 | 1,193 | 8,238 | |||||||||||
19
FLOTEK INDUSTRIES, INC.
NOTES TO UNAUDITED CONDENSED CONSOLIDATED FINANCIAL STATEMENTS
Assets of the Company by reportable segments are as follows (in thousands):
June 30, 2017 | December 31, 2016 | ||||||
Energy Chemistry Technologies | $ | 195,963 | $ | 184,328 | |||
Consumer and Industrial Chemistry Technologies | 117,037 | 98,105 | |||||
Corporate and Other | 38,980 | 56,882 | |||||
Total segments | 351,980 | 339,315 | |||||
Held for sale | 7,197 | 43,900 | |||||
Total assets | $ | 359,177 | $ | 383,215 | |||
Geographic Information
Revenue by country is based on the location where services are provided and products are used. No individual country other than the United States (“U.S.”) accounted for more than 10% of revenue. Revenue by geographic location is as follows (in thousands):
Three months ended June 30, | Six months ended June 30, | ||||||||||||||
2017 | 2016 | 2017 | 2016 | ||||||||||||
U.S. | $ | 71,836 | $ | 49,381 | $ | 136,485 | $ | 101,987 | |||||||
Other countries | 13,341 | 14,698 | 28,646 | 25,903 | |||||||||||
Total | $ | 85,177 | $ | 64,079 | $ | 165,131 | $ | 127,890 | |||||||
Long-lived assets held in countries other than the U.S. are not considered material to the consolidated financial statements.
Major Customers
Revenue from major customers, as a percentage of consolidated revenue, is as follows:
Three months ended June 30, | Six months ended June 30, | ||||||||||
2017 | 2016 | 2017 | 2016 | ||||||||
Customer A | 13.3 | % | 17.5 | % | 12.7 | % | 20.7 | % | |||
Customer B | 10.1 | % | 13.3 | % | 9.9 | % | 12.8 | % | |||
Over 95% of the revenue from these customers was for sales in the Energy Chemistry Technologies segment.
Note 17 — Commitments and Contingencies
Class Action Litigation
On March 30, 2017, the U.S. District Court for the Southern District of Texas granted the Company’s motion to dismiss the four consolidated putative securities class action lawsuits that were filed in November 2015, against the Company and certain of its officers. The lawsuits were previously consolidated into a single case, and a consolidated amended complaint had been filed. The consolidated amended complaint asserted that the Company made false and/or misleading statements, as well as failed to disclose material adverse facts about the Company’s business, operations, and prospects. The complaint sought an award of damages in an unspecified amount on behalf of a putative class consisting of persons who purchased the Company’s common stock between October 23, 2014 and November 9, 2015, inclusive. The lead plaintiff appealed the District Court’s decision granting the motion to dismiss.
In January 2016, three derivative lawsuits were filed, two in the District Court of Harris County, Texas (which have since been consolidated into one case) and one in the United States District Court for the Southern District of Texas, on behalf of the Company against certain of its officers and its current directors. The lawsuits allege violations of law, breaches of fiduciary duty, and unjust enrichment against the defendants.
The Company believes the lawsuits are without merit and intends to vigorously defend against all claims asserted. Discovery has not yet commenced. At this time, the Company is unable to reasonably estimate the outcome of this litigation.
In addition, as previously disclosed, the U.S. Securities and Exchange Commission has opened an inquiry related to similar issues to those raised in the above-described litigation.
20
FLOTEK INDUSTRIES, INC.
NOTES TO UNAUDITED CONDENSED CONSOLIDATED FINANCIAL STATEMENTS
Other Litigation
The Company is subject to routine litigation and other claims that arise in the normal course of business. Management is not aware of any pending or threatened lawsuits or proceedings that are expected to have a material effect on the Company’s financial position, results of operations or liquidity.
Concentrations and Credit Risk
The majority of the Company’s revenue is derived from the oil and gas industry. Customers include major oilfield services companies, major integrated oil and natural gas companies, independent oil and natural gas companies, pressure pumping service companies, and state-owned national oil companies. This concentration of customers in one industry increases credit and business risks.
The Company is subject to concentrations of credit risk within trade accounts receivable, as the Company does not generally require collateral as support for trade receivables. In addition, the majority of the Company’s cash is maintained at a major financial institution and balances often exceed insurable amounts.
21
Item 2. Management’s Discussion and Analysis of Financial Condition and Results of Operations
Forward-Looking Statements
This Quarterly Report on Form 10-Q (“Quarterly Report”), and in particular, Part I, Item 2 — “Management’s Discussion and Analysis of Financial Condition and Results of Operations,” contains “forward-looking statements” within the meaning of the safe harbor provisions, 15 U.S.C. § 78u-5, of the Private Securities Litigation Reform Act of 1995 (“Reform Act”). Forward-looking statements are not historical facts, but instead represent Flotek Industries, Inc.’s (“Flotek” or “Company”) current assumptions and beliefs regarding future events, many of which, by their nature, are inherently uncertain and outside the Company’s control. Such statements include estimates, projections, and statements related to the Company’s business plan, objectives, expected operating results, and assumptions upon which those statements are based. The forward-looking statements contained in this Quarterly Report are based on information available as of the date of this Quarterly Report.
The forward-looking statements relate to future industry trends and economic conditions, forecast performance or results of current and future initiatives and the outcome of contingencies and other uncertainties that may have a significant impact on the Company’s business, future operating results and liquidity. These forward-looking statements generally are identified by words including, but not limited to, “anticipate,” “believe,” “estimate,” “continue,” “intend,” “expect,” “plan,” “forecast,” “project,” and similar expressions, or future-tense or conditional constructions such as “will,” “may,” “should,” “could,” etc. The Company cautions that these statements are merely predictions and are not to be considered guarantees of future performance. Forward-looking statements are based upon current expectations and assumptions that are subject to risks and uncertainties that can cause actual results to differ materially from those projected, anticipated, or implied.
A detailed discussion of potential risks and uncertainties that could cause actual results and events to differ materially from forward-looking statements is included in Part I, Item 1A — “Risk Factors” of the Annual Report on Form 10-K for the year ended December 31, 2016 (“Annual Report”) and periodically in subsequent reports filed with the Securities and Exchange Commission (“SEC”). The Company has no obligation to publicly update or revise any forward-looking statements, whether as a result of new information or future events, except as required by law.
Management’s Discussion and Analysis of Financial Condition and Results of Operations (“MD&A”) should be read in conjunction with the unaudited condensed consolidated financial statements and the related notes thereto of this Quarterly Report, as well as the Annual Report. Phrases such as “Company,” “we,” “our,” and “us” refer to Flotek Industries, Inc. and its subsidiaries.
Basis of Presentation
During the fourth quarter of 2016, the Company classified the Drilling Technologies and Production Technologies segments as held for sale based on management’s intention to sell these businesses. The Company’s historical financial statements have been revised to present the operating results of the Drilling Technologies and Production Technologies segments as discontinued operations. The results of operations of Drilling Technologies and Production Technologies are presented as “Loss from discontinued operations” in the statement of operations and the related cash flows of these segments has been reclassified to discontinued operations for all periods presented. The assets and liabilities of the Drilling Technologies and Production Technologies segments have been reclassified to “Assets held for sale” and “Liabilities held for sale”, respectively, in the consolidated balance sheets for all periods presented.
In May 2017, the Company completed the sale of substantially all of the assets and transfer of certain specified liabilities and obligations of each of the Drilling Technologies and Production Technologies segments.
Executive Summary
Flotek is a global, diversified, technology-driven company that develops and supplies chemistries and services to the oil and gas industries, and high value compounds to companies that make cleaning products, cosmetics, food and beverages, and other products that are sold in consumer and industrial markets. Flotek operates in over 20 domestic and international markets.
The Company’s oilfield business includes specialty chemistries and logistics. Flotek’s technologies enable its customers in pursuing improved efficiencies in the drilling and completion of their wells. Customers include major integrated oil and gas (“O&G”) companies, oilfield services companies, independent O&G companies, pressure-pumping service companies, national and state-owned oil companies, and international supply chain management companies. The Company also produces non-energy-related citrus oil and related products including (1) high value compounds used as additives by companies in the flavors and fragrances markets and (2) environmentally friendly chemistries for use in numerous industries around the world, including the O&G industry. The Company sources citrus oil domestically and internationally and is one of the largest processors of citrus oil in the world. Additionally, the Company also provides automated bulk material handling, loading facilities, and blending capabilities.
22
Continuing Operations
The operations of the Company are categorized into two reportable segments: Energy Chemistry Technologies (“ECT”) and Consumer and Industrial Chemistry Technologies (“CICT”).
• | Energy Chemistry Technologies designs, develops, manufactures, packages, and markets specialty chemistries used in O&G well drilling, cementing, completion, and stimulation. These technologies developed by Flotek’s Research and Innovation team enable customers to pursue improved efficiencies in the drilling and completion of wells. |
• | Consumer and Industrial Chemistry Technologies designs, develops, and manufactures products that are sold to companies in the flavor and fragrance industries and specialty chemical industry. These technologies are used by beverage and food companies, fragrance companies, and companies providing household and industrial cleaning products. |
Discontinued Operations
The Drilling Technologies and Production Technologies segments are classified as discontinued operations.
• | Drilling Technologies assembles, rents, sells, inspects, and markets downhole drilling equipment used in energy, mining, and industrial drilling activities. |
• | Production Technologies assembles and markets production-related equipment, including pumping system components, electric submersible pumps (“ESP”), gas separators, valves, and services that support natural gas and oil production activities. |
Market Conditions
The Company’s success is sensitive to a number of factors, which include, but are not limited to, drilling and well completion activity, customer demand for its advanced technology products, market prices for raw materials, and governmental actions.
Drilling and well completion activity levels are influenced by a number of factors, including the number of rigs in operation and the geographical areas of rig activity. Additional factors that influence the level of drilling and well completion activity include:
• | Historical, current, and anticipated future O&G prices, |
• | Federal, state, and local governmental actions that may encourage or discourage drilling activity, |
• | Customers’ strategies relative to capital funds allocations, |
• | Weather conditions, and |
• | Technological changes to drilling and completion methods and economics. |
Historical North American drilling activity is reflected in “TABLE A” on the following page.
Customers’ demand for advanced technology products and services provided by the Company are dependent on their recognition of the value of:
• | Chemistries that improve the economics of their O&G operations, |
• | Chemistries that meet the need of consumer product markets, and |
• | Chemistries that are economically viable, socially responsible, and ecologically sound. |
Market prices for commodities, including citrus oils and guar, can be influenced by:
• | Historical, current, and anticipated future production levels of the global citrus (primarily orange) and guar crops, |
• | Weather related risks, |
• | Health and condition of citrus trees and guar plants (e.g., disease and pests), and |
• | International competition and pricing pressures resulting from natural and artificial pricing influences. |
Governmental actions may restrict the future use of hazardous chemicals, including, but not limited to, the following industrial applications:
• | O&G drilling and completion operations, |
• | O&G production operations, and |
• | Non-O&G industrial solvents. |
23
TABLE A | Three months ended June 30, | Six months ended June 30, | |||||||||||||||
2017 | 2016 | % Change | 2017 | 2016 | % Change | ||||||||||||
Average North American Active Drilling Rigs | |||||||||||||||||
U.S. | 895 | 422 | 112.1 | % | 819 | 483 | 69.6 | % | |||||||||
Canada | 117 | 48 | 143.8 | % | 206 | 108 | 90.7 | % | |||||||||
Total | 1,012 | 470 | 115.3 | % | 1,025 | 591 | 73.4 | % | |||||||||
Average U.S. Active Drilling Rigs by Type | |||||||||||||||||
Vertical | 77 | 51 | 51.0 | % | 73 | 57 | 28.1 | % | |||||||||
Horizontal | 751 | 326 | 130.4 | % | 681 | 377 | 80.6 | % | |||||||||
Directional | 67 | 45 | 48.9 | % | 65 | 49 | 32.7 | % | |||||||||
Total | 895 | 422 | 112.1 | % | 819 | 483 | 69.6 | % | |||||||||
Average North American Drilling Rigs by Product | |||||||||||||||||
Oil | 771 | 350 | 120.3 | % | 763 | 433 | 76.2 | % | |||||||||
Natural Gas | 241 | 120 | 100.8 | % | 262 | 158 | 65.8 | % | |||||||||
Total | 1,012 | 470 | 115.3 | % | 1,025 | 591 | 73.4 | % | |||||||||
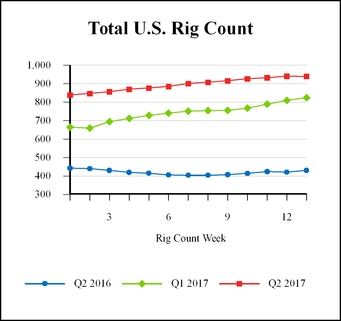
Source: Rig counts are per Baker Hughes, Inc. (www.bakerhughes.com). Rig counts are the averages of the weekly rig count activity.
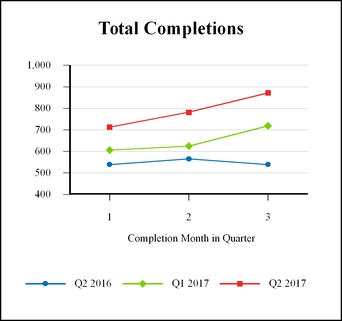
Completions are per the U.S. Energy Information Administration (https://www.eia.gov/petroleum/drilling/) as of July 17, 2017.
Average U.S. rig activity increased by 112.1% and 69.6% for the three and six months ended June 30, 2017, respectively, compared to the same periods of 2016, and sequentially, increased by 20.6% when compared to the first quarter of 2017.
According to data collected by the U.S. Energy Information Administration (“EIA”) as reported on July 17, 2017, completions in the seven most prolific areas in the lower 48 states increased 44.1% and 28.6% for the three and six months ended June 30, 2017, when compared to the same periods of 2016. Sequentially, completions increased 21.4% when compared to the first quarter of 2017.
24
Company Outlook
After a continuous decline in U.S. drilling rig activity beginning in mid-2014, the market began to gradually recover in the second quarter of 2016. Although a continuing recovery appears to be underway, the level of drilling and completion activity is still depressed compared to historical levels. Assuming the price for crude oil remains relatively stable and regulatory impediments are reduced, the Company expects U.S. oilfield activity to improve modestly throughout 2017.
During the second quarter of 2017, the Company continued to successfully promote the efficacy of its Complex nano-Fluid® (“CnF®”) chemistries resulting in a 43.1% increase in CnF® sales volumes compared to the second quarter of 2016. Second quarter 2017 CnF® volumes increased 1.6% compared to the first quarter of 2017. Although quarter to quarter performance may vary, the Company expects its Energy Chemistry Technologies sales to outperform market activity metrics over time by continuing to demonstrate the efficacy of its CnF® chemistries through comparative analysis of wells with and without CnF® chemistries, field validation results conducted by E&P companies, and the continuation of its direct-to-operator sales program known as the Flotek Store®. Whether operators purchase directly from Flotek or continue to purchase from oilfield distribution and service companies, E&P operators are benefiting from increased transparency in pricing and a more direct relationship with Flotek’s technical expertise and supply chain.
The Company’s success in promoting its patented and proprietary chemistries is supported through its industry leading research and innovation staff who provide customer responsive product innovation, as well as development of new products which are expected to expand the Company’s future product lines. During the third quarter of 2016, the Company completed its new Global Research & Innovation Center in Houston. This state-of-the-art facility allows for the development of next-generation innovative energy chemistries, as well as expanded collaboration between clients, leaders from academia, and Company scientists. These collaborative opportunities are an important and distinguishing capability within the industry.
The outlook for the Company’s consumer and industrial chemistries will be driven by the availability and demand for citrus oils, industrial solvents, and flavor and fragrance ingredients. Although current inventory and crop expectations are sufficient to meet the Company’s needs to supply its flavor and fragrance business, as well as both internal and external industrial markets, the market supply of citrus oils has declined in recent years due to the reduction in citrus crops caused by the citrus greening disease. This reduced supply has resulted in higher citrus oil prices and increased price volatility. However, the Company expects its strong market position to enable it to maintain a stable supply of citrus oils for internal use and external sales. The Company expects to manage the impact of volatile terpene costs through the development of new product formulations and pricing strategies.
During the fourth quarter 2016, the Company implemented a strategic restructuring of its business to enable a greater focus on its core businesses in energy chemistry and consumer and industrial chemistry and initiated a process to identify potential buyers for its Drilling Technologies and Production Technologies segments. During the second quarter of 2017, the Company completed the sale of substantially all of the assets and transfer of certain specified liabilities and obligations of the Drilling Technologies and Production Technologies segments.
Capital expenditures for continuing operations totaled $4.5 million and $8.2 million for the six months ended June 30, 2017 and 2016, respectively. The Company expects capital spending to be between $9 million and $12 million in 2017. The Company will remain nimble in its core capital expenditure plans, adjusting as market conditions warrant.
Changes to geopolitical, global economic, and industry trends could have an impact, either positive or negative, on the Company’s business. In the event of significant adverse changes to the demand for oil and gas production, the market price for oil and gas, and/or the availability of citrus crops, the market conditions affecting the Company could change rapidly and materially. Should such adverse changes to market conditions occur, management believes the Company has access to adequate liquidity to withstand the impact of such changes while continuing to make strategic capital investments and acquisitions, if opportunities arise. In addition, management believes the Company is well-positioned to take advantage of significant increases in demand for its products should market conditions improve dramatically in the near term.
25
Results of Continuing Operations (in thousands):
Three months ended June 30, | Six months ended June 30, | ||||||||||||||
2017 | 2016 | 2017 | 2016 | ||||||||||||
Revenue | $ | 85,177 | $ | 64,079 | $ | 165,131 | $ | 127,890 | |||||||
Cost of revenue | 59,086 | 42,361 | 111,298 | 82,379 | |||||||||||
Gross profit | 26,091 | 21,718 | 53,833 | 45,511 | |||||||||||
Gross margin % | 30.6 | % | 33.9 | % | 32.6 | % | 35.6 | % | |||||||
Corporate general and administrative | 11,155 | 9,557 | 23,426 | 20,096 | |||||||||||
Corporate general and administrative % | 13.1 | % | 14.9 | % | 14.2 | % | 15.7 | % | |||||||
Segment selling and administrative | 9,386 | 8,067 | 19,695 | 17,105 | |||||||||||
Segment selling and administrative % | 11.0 | % | 12.6 | % | 11.9 | % | 13.4 | % | |||||||
Depreciation and amortization | 2,479 | 1,905 | 4,924 | 3,806 | |||||||||||
Research and innovation costs | 4,109 | 2,048 | 7,250 | 3,995 | |||||||||||
Loss on disposal of long-lived assets | 214 | (15 | ) | 412 | (15 | ) | |||||||||
(Loss) income from operations | (1,252 | ) | 156 | (1,874 | ) | 524 | |||||||||
Operating margin % | (1.5 | )% | 0.2 | % | (1.1 | )% | 0.4 | % | |||||||
Interest and other expense, net | (312 | ) | (657 | ) | (754 | ) | (1,071 | ) | |||||||
Loss before income taxes | (1,564 | ) | (501 | ) | (2,628 | ) | (547 | ) | |||||||
Income tax benefit | 442 | 390 | 762 | 407 | |||||||||||
Loss from continuing operations | (1,122 | ) | (111 | ) | (1,866 | ) | (140 | ) | |||||||
Loss from discontinued operations, net of tax | (2,704 | ) | (2,169 | ) | (13,937 | ) | (32,325 | ) | |||||||
Net loss | $ | (3,826 | ) | $ | (2,280 | ) | $ | (15,803 | ) | $ | (32,465 | ) | |||
Consolidated Results of Operations: Three and Six Months Ended June 30, 2017, Compared to the Three and Six Months Ended June 30, 2016
Consolidated revenue for the three and six months ended June 30, 2017, increased $21.1 million, or 32.9%, and $37.2 million, or 29.1%, respectively, versus the same periods of 2016. These increases in revenue were driven by increased sales within the Energy Chemistry Technologies segment due to the increased oilfield activity beginning in the latter half of 2016.
Consolidated gross profit for the three and six months ended June 30, 2017, increased $4.4 million, or 20.1%, and $8.3 million, or 18.3%, respectively, compared to the same periods of 2016. Gross margin decreased to 30.6% and 32.6% for the three and six months ended June 30, 2017, respectively, from 33.9% and 35.6% in the same periods of 2016, primarily due to increased volumes of lower margin product sales in all segments.
Corporate general and administrative (“CG&A”) expenses are not directly attributable to products sold or services provided. CG&A costs increased $1.6 million, or 16.7%, and $3.3 million, or 16.6%, for the three and six months ended June 30, 2017, respectively, versus the same periods of 2016; however, as a percentage of revenue, CG&A decreased 1.8% and 1.5% for the three and six months ended June 30, 2017, respectively. These increases were primarily due to costs associated with executive retirement and stock compensation expense, partially offset by decreased legal expenses related to ongoing litigation.
Segment selling and administrative (“SS&A”) expenses are not directly attributable to products sold or services provided. SS&A costs increased $1.3 million, or 16.4%, and $2.6 million, or 15.1%, for the three and six months ended June 30, 2017, respectively, versus the same periods of 2016; however, as a percentage of revenue, SS&A decreased 1.6% and 1.5% for the three and six months ended June 30, 2017, respectively. These increases were primarily due to increased headcount in the Energy Chemistry Technologies sales and support staff for expansion and growth in new business and related higher sales and marketing expenses.
Depreciation and amortization expense increased $0.6 million, or 30.1%, and $1.1 million, or 29.4%, for the three and six months ended June 30, 2017, respectively, versus the same periods of 2016, primarily attributable to the completion and equipping of the Global Research & Innovation Center in August 2016, along with other improvements to manufacturing facilities.
Research and Innovation (“R&I”) expense increased $2.1 million, or 100.6%, and $3.3 million, or 81.5%, for the three and six months ended June 30, 2017, respectively, compared to the same periods of 2016. These increases in R&I are primarily attributable
26
to new product development and Flotek’s commitment to remaining responsive to customer needs, increased demand, continued growth and refining of existing product lines, and the development of new chemistries which are expected to expand the Company’s intellectual property portfolio.
Interest and other expense decreased $0.3 million, or 52.5%, and $0.3 million, or 29.6%, for the three and six months ended June 30, 2017, respectively, versus the same periods of 2016, primarily due to the repayment of the term loan on May 27, 2017.
The Company recorded income tax benefits of $0.4 million and $0.8 million, yielding effective tax benefit rates of 28.3% and 29.0%, for the three and six months ended June 30, 2017, respectively, compared to income tax benefits of $0.4 million and $0.4 million, yielding effective tax benefit rates of 77.8% and 74.4%, for the comparable periods in 2016.
As part of the Company’s strategic restructuring of its business to enable a greater focus on its core businesses in energy chemistry and consumer and industrial chemistry, the Company completed the sale of substantially all of the assets and transfer of certain specified liabilities and obligations of the Drilling Technologies and Production Technologies segments in May 2017. The Company recorded a net loss from discontinued operations of $2.7 million and $13.9 million for the three and six months ended June 30, 2017, respectively.
Results by Segment
Energy Chemistry Technologies (“ECT”) | |||||||||||||||
(dollars in thousands) | Three months ended June 30, | Six months ended June 30, | |||||||||||||
2017 | 2016 | 2017 | 2016 | ||||||||||||
Revenue | $ | 65,875 | $ | 43,385 | $ | 126,640 | $ | 88,064 | |||||||
Gross profit | 22,804 | 17,660 | 45,106 | 36,429 | |||||||||||
Gross margin % | 34.6 | % | 40.7 | % | 35.6 | % | 41.4 | % | |||||||
Income from operations | 9,299 | 7,584 | 17,848 | 15,597 | |||||||||||
Operating margin % | 14.1 | % | 17.5 | % | 14.1 | % | 17.7 | % | |||||||
ECT Results of Operations: Three and Six Months Ended June 30, 2017, Compared to the Three and Six Months Ended June 30, 2016
ECT revenue for the three and six months ended June 30, 2017, increased $22.5 million, or 51.8%, and $38.6 million, or 43.8%, respectively, versus the same periods of 2016. CnF® sales volumes increased 43.1% (revenues increased 51.1%), compared to the three months ended June 30, 2016. Increased CnF® chemistry sales during the second quarter of 2017 was due to increased well completion activity by customers. Quarterly non-CnF revenues rose approximately 62.8%, compared to the three months ended June 30, 2016, due to increased customer demand as a result of oilfield market conditions.
Sequentially, revenues increased $5.1 million, or 8.4%, versus the first quarter of 2017. CnF® sales volumes increased 1.6% (revenues increased 1.2%) on a sequential basis.
ECT gross profit increased $5.1 million, or 29.1%, and $8.7 million, or 23.8%, for the three and six months ended June 30, 2017, respectively, versus the same periods of 2016. Gross margin decreased to 34.6% and 35.6% for the three and six months ended June 30, 2017, respectively, from 40.7% and 41.4% in the same periods of 2016. The gross margin decreases over the periods were primarily due to product mix with higher raw material costs associated with the higher sales volume of CnF® chemistries. Sequentially, gross profit increased $0.5 million, or 2.3%, versus the first quarter of 2017.
Income from operations for the ECT segment increased $1.7 million, or 22.6%, and $2.3 million, or 14.4%, for the three and six months ended June 30, 2017, respectively, versus the same periods of 2016. These increases were primarily attributable to the increase in CnF® sales.
27
Consumer and Industrial Chemistry Technologies (“CICT”) | |||||||||||||||
(dollars in thousands) | Three months ended June 30, | Six months ended June 30, | |||||||||||||
2017 | 2016 | 2017 | 2016 | ||||||||||||
Revenue | $ | 19,302 | $ | 20,694 | $ | 38,491 | $ | 39,826 | |||||||
Gross profit | 3,287 | 4,058 | 8,727 | 9,082 | |||||||||||
Gross margin % | 17.0 | % | 19.6 | % | 22.7 | % | 22.8 | % | |||||||
Income from operations | 1,216 | 2,686 | 4,921 | 6,075 | |||||||||||
Operating margin % | 6.3 | % | 13.0 | % | 12.8 | % | 15.3 | % | |||||||
CICT Results of Operations: Three and Six Months Ended June 30, 2017, Compared to the Three and Six Months Ended June 30, 2016
CICT revenue decreased $1.4 million, or 6.7%, and $1.3 million, or 3.4%, for the three and six months ended June 30, 2017, respectively, versus the same periods of 2016. These decreases were due to reduced volumes, partially offset by higher prices. Sequentially, quarterly revenues remained flat.
CICT gross profit for the three and six months ended June 30, 2017, decreased $0.8 million, or 19.0%, and $0.4 million, or 3.9%, respectively, versus the same periods of 2016. Gross margin decreased to 17.0% and 22.7% for the three and six months ended June 30, 2017, respectively, from 19.6% and 22.8% in the same periods of 2016, as a result of decreased margins associated with product mix and a slight increase in direct costs. Sequentially, gross profits decreased by $2.2 million, and gross margins decreased to 17.0% from 28.3% in the first quarter of 2017 due to product mix and increased raw material costs.
Income from operations for the CICT segment decreased $1.5 million, or 54.7%, and $1.2 million, or 19.0%, for the three and six months ended June 30, 2017, respectively, versus the same periods of 2016. Sequentially, quarterly operating profits decreased by $2.5 million. These decreases are primarily attributable to product mix and increased raw material and indirect costs.
Discontinued Operations
During the fourth quarter of 2016, the Company classified the Drilling Technologies and Production Technologies segments as held for sale based on management’s intention to sell these businesses. In May 2017, the Company completed the sale of substantially all of the assets and transfer of certain specified liabilities and obligations of the Drilling Technologies and Production Technologies segments. The Company’s historical financial statements have been revised to present the operating results of the Drilling Technologies and Production Technologies segments as discontinued operations. The information below is presented for informational purposes only.
Drilling Technologies | |||||||||||||||
(dollars in thousands) | Three months ended June 30, | Six months ended June 30, | |||||||||||||
2017 | 2016 | 2017 | 2016 | ||||||||||||
Revenue | $ | 4,737 | $ | 6,372 | $ | 11,534 | $ | 12,829 | |||||||
Gross profit | 2,134 | 2,217 | 4,275 | 3,242 | |||||||||||
Gross margin % | 45.0 | % | 34.8 | % | 37.1 | % | 25.3 | % | |||||||
Loss from operations | (624 | ) | (1,618 | ) | (1,440 | ) | (42,569 | ) | |||||||
Loss from operations - excluding impairment | (624 | ) | (1,618 | ) | (1,440 | ) | (6,047 | ) | |||||||
Operating margin % - excluding impairment | (13.2 | )% | (25.4 | )% | (12.5 | )% | (47.1 | )% | |||||||
28
Production Technologies | |||||||||||||||
(dollars in thousands) | Three months ended June 30, | Six months ended June 30, | |||||||||||||
2017 | 2016 | 2017 | 2016 | ||||||||||||
Revenue | $ | 849 | $ | 1,868 | $ | 4,002 | $ | 3,889 | |||||||
Gross profit | 142 | (14 | ) | 813 | 96 | ||||||||||
Gross margin % | 16.7 | % | (0.7 | )% | 20.3 | % | 2.5 | % | |||||||
Loss from operations | (752 | ) | (1,261 | ) | (1,225 | ) | (6,692 | ) | |||||||
Loss from operations - excluding impairment | (752 | ) | (1,261 | ) | (1,225 | ) | (2,779 | ) | |||||||
Operating margin % - excluding impairment | (88.6 | )% | (67.5 | )% | (30.6 | )% | (71.5 | )% | |||||||
Off-Balance Sheet Arrangements
There have been no transactions that generate relationships with unconsolidated entities or financial partnerships, such as entities often referred to as “structured finance” or “special purpose entities” (“SPEs”), established for the purpose of facilitating off-balance sheet arrangements or other contractually narrow or limited purposes. As of June 30, 2017, the Company was not involved in any unconsolidated SPEs.
The Company has not made any guarantees to customers or vendors nor does the Company have any off-balance sheet arrangements or commitments that have, or are reasonably likely to have, a current or future effect on the Company’s financial condition, change in financial condition, revenue, expenses, results of operations, liquidity, capital expenditures, or capital resources that would be material to investors.
Critical Accounting Policies and Estimates
The Company’s Financial Statements have been prepared in accordance with accounting principles generally accepted in the United States of America (“U.S. GAAP”). Preparation of these statements requires management to make judgments, estimates, and assumptions that affect the amounts reported in the financial statements and accompanying footnotes. Part II, Item 8 — Financial Statements and Supplementary Data, Note 2 of “Notes to Consolidated Financial Statements” and Part II, Item 7 — Management’s Discussion and Analysis of Financial Conditions and Results of Operations, “Critical Accounting Policies and Estimates” of the Company’s Annual Report, and the “Notes to Unaudited Condensed Consolidated Financial Statements” of this Quarterly Report describe the significant accounting policies and critical accounting estimates used to prepare the consolidated financial statements. Critical accounting policies and estimates are defined as those that are both most important to the portrayal of the Company’s financial condition and results of operations and require management’s most subjective judgments. The Company regularly reviews and challenges judgments, assumptions, and estimates related to critical accounting policies. The Company’s estimates and assumptions are based on historical experience and expected changes in the business environment; however, actual results may materially differ from the estimates. There have been no significant changes in the Company’s critical accounting estimates during the six months ended June 30, 2017.
Recent Accounting Pronouncements
Recent accounting pronouncements which may impact the Company are described in Note 2 — “Recent Accounting Pronouncements” in Part I, Item 1 — “Financial Statements” of this Quarterly Report.
Capital Resources and Liquidity
Overview
The Company’s ongoing capital requirements arise from the Company’s need to service debt, acquire and maintain equipment, fund working capital requirements, and when the opportunities arise, to make strategic acquisitions and repurchase Company stock. During the first six months of 2017, the Company funded capital requirements primarily with cash on hand and debt financing.
The Company’s primary source of debt financing is its Credit Facility with PNC Bank. This Credit Facility contains provisions for a revolving credit facility and a term loan secured by substantially all of the Company’s domestic real and personal property, including accounts receivable, inventory, land, buildings, equipment, and other intangible assets. On May 22, 2017, the Company repaid the outstanding balance of the term loan and the liens on land, buildings, equipment, and other intangible assets were released. As of June 30, 2017, the Company had $42.7 million in outstanding borrowings under the revolving debt portion of the Credit Facility and no outstanding balance under the term loan. At June 30, 2017, the Company was in compliance with all debt
29
covenants. Significant terms of the Credit Facility are discussed in Note 11 — “Long-Term Debt and Credit Facility” in Part I, Item 1 — “Financial Statements” of this Quarterly Report.
The Company believes it has access to adequate liquidity to fund its ongoing operations and capital expenditures. As of June 30, 2017, the Company had available borrowing capacity under its revolving line of credit of $22.2 million and available cash of $3.4 million, resulting in total liquidity of $25.6 million. For the remainder of 2017, the Company plans to spend between $4.5 million and $7.5 million for committed and planned capital expenditures. The Company may pursue external financing to increase its liquidity position and/or fund acquisitions when strategic opportunities arise.
Any excess cash generated may be used to pay down the level of debt or retained for future use.
Net Debt
Net debt represents total debt less cash and cash equivalents and combines the Company’s indebtedness and the cash and cash equivalents that could be used to repay that debt. Components of net debt are as follows (in thousands):
June 30, 2017 | June 30, 2016 | ||||||
Cash and cash equivalents | $ | 3,422 | $ | 3,840 | |||
Current portion of long-term debt | (42,716 | ) | (50,228 | ) | |||
Long-term debt, less current portion | — | (14,684 | ) | ||||
Net debt | $ | (39,294 | ) | $ | (61,072 | ) | |
Cash Flows
Consolidated cash flows by type of activity are noted below (in thousands):
Six months ended June 30, | |||||||
2017 | 2016 | ||||||
Net cash used in operating activities | $ | (7,243 | ) | $ | (3,295 | ) | |
Net cash provided by (used in) investing activities | 13,045 | (8,354 | ) | ||||
Net cash (used in) provided by financing activities | (7,223 | ) | 13,236 | ||||
Net cash flows used in discontinued operations | — | (8 | ) | ||||
Effect of changes in exchange rates on cash and cash equivalents | 20 | 53 | |||||
Net (decrease) increase in cash and cash equivalents | $ | (1,401 | ) | $ | 1,632 | ||
Operating Activities
Net cash used in operating activities was $7.2 million and $3.3 million during the six months ended June 30, 2017 and 2016, respectively. Consolidated net loss for the six months ended June 30, 2017 and 2016, totaled $1.9 million and $0.1 million, respectively.
During the six months ended June 30, 2017, net non-cash contributions to net income totaled $6.3 million. Contributory non-cash items consisted primarily of $6.3 million for depreciation and amortization, $6.7 million for stock-based compensation expense, and $0.4 million for net loss on sale of assets, partially offset by $7.3 million for changes to deferred income taxes.
During the six months ended June 30, 2016, net non-cash contributions to net income totaled $2.8 million. Contributory non-cash items consisted primarily of $4.9 million for depreciation and amortization, $5.1 million for stock compensation expense, and $1.0 million for recognized incremental tax benefits related to the Company’s share based awards, partially offset by $8.1 million for changes to deferred income taxes.
During the six months ended June 30, 2017, changes in working capital used $11.7 million in cash, primarily resulting from increasing accounts receivable and inventory by $32.9 million and decreasing accounts payable and accrued liabilities, partially offset by decreasing income taxes receivable and other current assets by $22.8 million.
During the six months ended June 30, 2016, changes in working capital used $6.0 million in cash, primarily resulting from increasing accounts receivable, inventory, income taxes receivable, and other current assets by $19.6 million and decreasing income taxes payable by $1.8 million, partially offset by increasing accounts payable, accrued liabilities, and interest payable by $15.4 million.
30
Investing Activities
Net cash provided by investing activities was $13.0 million for the six months ended June 30, 2017. Cash provided by investing activities primarily included $17.5 million of proceeds received from the sale of the Drilling Technologies and Production Technologies segments and $0.3 million of proceeds received from the sale of fixed assets, partially offset by $4.5 million for capital expenditures and $0.2 million for the purchase of various patents.
Net cash used in investing activities was $8.4 million for the six months ended June 30, 2016. Cash used in investing activities primarily included $8.2 million for capital expenditures and $0.1 million associated with the purchase of various patents.
Financing Activities
Net cash used in financing activities was $7.2 million for the six months ended June 30, 2017, primarily due to using $5.7 million for repayments of debt, net of borrowings, purchases of treasury stock for tax withholding purposes related to vesting of restricted stock awards of $1.3 million, and $0.5 million for the repurchase of common stock. Cash used in financing activities was partially offset by $0.4 million in proceeds from the sale of common stock.
Net cash generated through financing activities was $13.2 million for the six months ended June 30, 2016. Cash generated through financing activities was primarily due to receiving $14.4 million from borrowings of debt, net of repayments, and proceeds from the sale of common stock of $0.4 million. Cash generated through financing activities was partially offset by reductions in tax benefit related to stock-based compensation of $1.0 million and $0.6 million for purchases of treasury stock for tax withholding purposes related to vesting of restricted stock awards and the exercise of non-qualified stock options.
Although the Company has no immediate intention to access the capital markets, the Company has prepared a “universal” shelf registration which will be filed with the Securities and Exchange Commission. This shelf registration statement will register the issuance and sale from time to time of various securities by the Company, including but not limited to senior notes, subordinated notes, preferred stock, common stock, warrants, units, and guarantees. Once this shelf registration statement is filed with the Securities and Exchange Commission and becomes effective, the Company will have the financial flexibility to access the capital markets quickly and efficiently from time to time as the need may arise.
Contractual Obligations
Cash flows from operations are dependent on a variety of factors, including fluctuations in operating results, accounts receivable collections, inventory management, and the timing of payments for goods and services. Correspondingly, the impact of contractual obligations on the Company’s liquidity and capital resources in future periods is analyzed in conjunction with such factors.
Material contractual obligations consist of repayment of amounts borrowed on the Company’s Credit Facility with PNC Bank and payment of operating lease obligations. Contractual obligations at June 30, 2017, are as follows (in thousands):
Payments Due by Period | |||||||||||||||||||
Total | Less than 1 year | 1 - 3 years | 3 - 5 years | More than 5 years | |||||||||||||||
Borrowings under revolving credit facility (1) | $ | 42,716 | $ | 42,716 | $ | — | $ | — | $ | — | |||||||||
Operating lease obligations | 23,210 | 2,749 | 4,986 | 3,971 | 11,504 | ||||||||||||||
Total | $ | 65,926 | $ | 45,465 | $ | 4,986 | $ | 3,971 | $ | 11,504 | |||||||||
(1) The borrowing is classified as current debt. The weighted-average interest rate is 4.09% at June 30, 2017.
Item 3. Quantitative and Qualitative Disclosures About Market Risk
The Company is exposed to market risk from changes in interest rates, commodity prices, and foreign currency exchange rates. There have been no material changes to the quantitative or qualitative disclosures about market risk set forth in Part II, Item 7A of the Company’s Annual Report.
31
Item 4. Controls and Procedures
Evaluation of Disclosure Controls and Procedures
The Company’s disclosure controls and procedures are designed to ensure that information required to be disclosed by the Company in reports filed or submitted under the Securities Exchange Act of 1934, as amended (the “Exchange Act”), is recorded, processed, summarized and reported within the time periods specified in the SEC’s rules and forms. The Company’s disclosure controls and procedures are also designed to ensure such information is accumulated and communicated to management, including the principal executive and principal financial officers, as appropriate to allow timely decisions regarding required disclosures. There are inherent limitations to the effectiveness of any system of disclosure controls and procedures, including the possibility of human error and the circumvention or overriding of controls and procedures. Accordingly, even effective disclosure controls and procedures can only provide reasonable assurance that control objectives are attained. The Company’s disclosure controls and procedures are designed to provide such reasonable assurance.
The Company’s management, with the participation of the principal executive and principal financial officers, evaluated the effectiveness of the design and operation of the Company’s disclosure controls and procedures as of June 30, 2017, as required by Rule 13a-15(e) of the Exchange Act. Based upon that evaluation, the principal executive and principal financial officers have concluded that the Company’s disclosure controls and procedures were effective as of June 30, 2017.
Changes in Internal Control Over Financial Reporting
There have been no changes in the Company’s system of internal control over financial reporting during the three months ended June 30, 2017, that have materially affected, or are reasonably likely to materially affect, the Company’s internal control over financial reporting.
32
PART II - OTHER INFORMATION
Item 1. Legal Proceedings
Class Action Litigation
On March 30, 2017, the U.S. District Court for the Southern District of Texas granted the Company’s motion to dismiss the four consolidated putative securities class action lawsuits that were filed in November 2015, against the Company and certain of its officers. The lawsuits were previously consolidated into a single case, and a consolidated amended complaint had been filed. The consolidated amended complaint asserted that the Company made false and/or misleading statements, as well as failed to disclose material adverse facts about the Company’s business, operations, and prospects. The complaint sought an award of damages in an unspecified amount on behalf of a putative class consisting of persons who purchased the Company’s common stock between October 23, 2014 and November 9, 2015, inclusive. The lead plaintiff appealed the District Court’s decision granting the motion to dismiss.
In January 2016, three derivative lawsuits were filed, two in the District Court of Harris County, Texas (which have since been consolidated into one case) and one in the United States District Court for the Southern District of Texas, on behalf of the Company against certain of its officers and its current directors. The lawsuits allege violations of law, breaches of fiduciary duty, and unjust enrichment against the defendants.
The Company believes the lawsuits are without merit and intends to vigorously defend against all claims asserted. Discovery has not yet commenced. At this time, the Company is unable to reasonably estimate the outcome of this litigation.
In addition, as previously disclosed, the U.S. Securities and Exchange Commission has opened an inquiry related to similar issues to those raised in the above-described litigation.
Other Litigation
The Company is subject to routine litigation and other claims that arise in the normal course of business. Management is not aware of any pending or threatened lawsuits or proceedings that are expected to have a material effect on the Company’s financial position, results of operations or liquidity.
Item 1A. Risk Factors
There have been no material changes to the risk factors set forth in Part I, Item 1A of the Company’s Annual Report.
Item 2. Unregistered Sales of Equity Securities and Use of Proceeds
Issuer Purchases of Equity Securities
Repurchases of the Company’s equity securities during the three months ended June 30, 2017, are as follows:
Period | Total Number of Shares Purchased (1) | Average Price Paid per Share | Total Number of Shares Purchased as Part of Publicly Announced Plans or Programs | Maximum Dollar Value of Shares that May Yet be Purchased Under the Plans or Programs (2) (3) (4) | |||||||||
April 1, 2017 to April 30, 2017 | 497,391 | $ | 12.55 | — | $ | 54,907,862 | |||||||
May 1, 2017 to May 31, 2017 | 81,218 | $ | 9.74 | 50,000 | $ | 54,420,042 | |||||||
June 1, 2017 to June 30, 2017 | 56,191 | $ | 9.08 | — | $ | 54,420,042 | |||||||
Total | 634,800 | $ | 11.89 | 50,000 | |||||||||
(1) | The Company purchases shares of its common stock (a) to satisfy tax withholding requirements and payment remittance obligations related to period vesting of restricted shares and exercise of non-qualified stock options, (b) to satisfy payments required for common stock upon the exercise of stock options, and (c) as part of a publicly announced repurchase program on the open market. |
(2) | In November 2012, the Company’s Board of Directors authorized the repurchase of up to $25 million of the Company’s common stock. Repurchases may be made in open market or privately negotiated transactions. Through June 30, 2017, the Company has repurchased $20.6 million of its common stock and $4.4 million may yet be used to purchase shares. |
(3) | In June 2015, the Company’s Board of Directors authorized the repurchase of up to an additional $50 million of the Company’s common stock. Repurchases may be made in open market or privately negotiated transactions. Through June 30, 2017, the Company has not repurchased any of its common stock under this authorization and $50.0 million may yet be used to purchase shares. |
33
(4) | A covenant under the Company’s Credit Facility limits the amount that may be used to repurchase the Company’s common stock. As of June 30, 2017, this covenant limits additional share repurchases to $4.4 million. |
Item 3. Defaults Upon Senior Securities
None.
Item 4. Mine Safety Disclosures
Not applicable.
Item 5. Other Information
None.
Item 6. Exhibits
Exhibit Number | Description of Exhibit | |
3.1 | ||
3.2 | ||
3.3 | ||
4.1 | ||
4.2 | ||
10.1 | ||
10.2 | * | Asset Purchase Agreement, dated May 2, 2017, by and among National Oilwell DHT, L.P., Dreco Energy Services ULC, and National Oilwell Varco, L.P., the buyers, Teledrift Company, Turbeco, Inc., Flotek Technologies ULC, and Flotek Industries FZE, the sellers, and Flotek Industries, Inc. |
31.1 | * | |
31.2 | * | |
32.1 | ** | |
32.2 | ** | |
101.INS | + | XBRL Instance Document. |
101.SCH | + | XBRL Schema Document. |
101.CAL | + | XBRL Calculation Linkbase Document. |
101.LAB | + | XBRL Label Linkbase Document. |
101.PRE | + | XBRL Presentation Linkbase Document. |
101.DEF | + | XBRL Definition Linkbase Document. |
* | Filed herewith. | |
** | Furnished with this Form 10-Q, not filed. | |
+ | Filed electronically with this Form 10-Q. | |
34
SIGNATURES
Pursuant to the requirements of the Securities Exchange Act of 1934, the registrant has duly caused this report to be signed on its behalf by the undersigned, thereunto duly authorized.
FLOTEK INDUSTRIES, INC. | ||
By: | /s/ JOHN W. CHISHOLM | |
John W. Chisholm | ||
President, Chief Executive Officer and Chairman of the Board | ||
Date: August 1, 2017
FLOTEK INDUSTRIES, INC. | ||
By: | /s/ H. RICHARD WALTON | |
H. Richard Walton | ||
Executive Vice President and Chief Financial Officer | ||
Date: August 1, 2017
35