Attached files
| file | filename |
|---|---|
| 8-K - COMMERCE UNION BANCSHARES, INC. 8-K - Reliant Bancorp, Inc. | a51604764.htm |
Exhibit 99.1

KBW Community Bank Investor Conference August 1, 2017 NASDAQ: CUBN

Forward Looking Statement All statements included in this presentation relating to Commerce Union Bancshares Inc.’s plans, objectives, expectations or future performance are forward-looking statements within the meaning of the Private Securities Litigation Reform Act of 1995. The words “believe,” “may,” “should,” “anticipate,” “estimate,” “expect,” “intend,” “objective,” “possible,” “seek,” “plan,” “strive” or similar words, or negatives of these words, identify forward-looking statements. These forward-looking statements are based on management’s current expectations. The Company’s actual results in future periods may differ materially from those indicated by forward-looking statements due to various risks and uncertainties. These and other risks and uncertainties are described in greater detail under “Risk Factors” in the Form 10-K and subsequent periodic reports filed with the Securities and Exchange Commission. The forward-looking statements in this presentation are made as of the date of the release and the Company does not assume any responsibility to update these statements.

Non-GAAP Financial Matters This presentation contains non-GAAP financial measures. The non-GAAP measures in this presentation include “adjusted net income attributable to common shareholders, per diluted share and “adjusted net interest margin.” We believe these non-GAAP measures provide useful information to investors because these are among the measures used by our management team to evaluate our operating performance and make day-to-day operating decisions. In addition, we believe certain purchase accounting adjustments and non-recurring income relating to the payoff of a purchased credit impaired loan in the second quarter of 2016 do not reflect the operational performance of the business in this period; accordingly, it is useful to consider these line items with and without such adjustments. We believe this presentation also increases comparability of period-to-period results. Other companies may use similarly titled non-GAAP financial measures that are calculated differently from the way we calculate such measures. Accordingly, our non-GAAP financial measures may not be comparable to similar measures used by other companies. We caution investors not to place undue reliance on such non-GAAP measures, but instead to consider them with the most directly comparable GAAP measure. Non-GAAP financial measures have limitations as analytical tools, and should not be considered in isolation, or as a substitute for our results as reported under generally accepted accounting principles.

Company Timeline 2006 2014 2015 2017 8/14/2006Commerce Union Bank established 4/1/2015CUBN and Reliant close merger 4/28/2014CUBN and Reliant announce merger 7/7/2015CUBN stock begins trading on Nasdaq 3/6/2017Opens Green Hills branch in Davidson County Total Assets($mm) Reliant Bank Commerce Union Bank 2012 2013 2014 2015 2016 Q2‘17 2011 2010 2009 2008 2007 2006 $385 $385 $450 $363 $379 $382 $317 $205 $111 $232 $253 $296 $209 $187 $148 $133 $98 $35 $876 $912 $1,004 2/21/2017Expansion into Chattanooga 1/9/2006Reliant Bank established Source: SNL Financial 6/30/2017$1 billion in Assets

Experienced Management Team DeVan D. Ard, Jr.Chairman & CEO – Reliant Bank Former Area Executive in Middle Tennessee at AmSouth BankFounder of Reliant Bank in 2006 35 years of banking experience / 12 years at CUBN* / 18 years in Middle TN James Daniel Dellinger CFO & Head of Investor Relations Former Chief Financial Officer at Premier Bank of BrentwoodFormer Chief Financial Officer at Erwin National Bank25 years of banking experience / 12 years at CUBN* / 20 years in Middle TN Alan MimsExecutive VP, CRO Executive Vice President – Chief Risk Officer since April 2017Former Senior Examiner and Case Manger for the Federal Reserve Bank of Atlanta28 years of banking experience / 1 year at CUBN* / 1 year in Middle TN Gene WhittleExecutive VP, CCO Eddie GammonExecutive VP, Director of Operations John R. WilsonExecutive VP, CLO Executive Vice President – Chief Credit Officer since 2010Former Executive Vice President and Chief Credit Officer at Avenue Bank40 years of banking experience / 7 years at CUBN* / 37 years in Middle TN Executive Vice President – Director of Operations since March 2016Former Senior Vice President of Operations at IBERIABANKFormer Senior Vice President – Director of Deposit Operations at Avenue Bank32 years of banking experience / 1 year at CUBN* / 2 years in Middle TN Executive Vice President – Chief Loan Officer Former Spring Hill Market President for Cumberland Bank28 years of banking experience / 11 years at CUBN* / 28 years in Middle TN Source: SNL Financial* Denotes years at CUBN or Reliant Bank Kim YorkExecutive VP, CSO Executive Vice President – Chief Strategy Office since March 2017Former Senior Vice President and Chief Marketing Officer at Ascend Federal Credit Union22 years of banking experience / 1 year at CUBN* / 22 years in Middle TN

Company Overview Commercially oriented bank headquartered in Brentwood, TennesseeFocused on fast growing middle Tennessee markets with recent expansion into Chattanooga14th largest bank by deposits in Nashville MSA and 6th largest community bank by deposits headquartered in Nashville MSAEmphasis on building relationships – less than 5% of loan portfolio in participations, over 80% of top 50 loan customers maintain depositsConsistent focus on asset qualityDiversified markets and lending opportunitiesExperienced management team with local market knowledge

CUBN Branches (8)CUBN Mortgage LPO (1)CUBN LPO (2) DAVIDSON MONTGOMERY ROBERTSON SUMNER WILSON RUTHERFORD MAURY HICKMAN WILLIAMSON DICKSON CHEATHAM Clarksville Springfield Gallatin Murfreesboro Brentwood Dickson AshlandCity Nashville 24 40 65 HAMILTON Chattanooga Lebanon Franklin DAVIDSON Reliant Bank Franchise – Nashville MSA & Chattanooga

Recent Accomplishments Strengthened management teamAdded lenders in all key markets to expand revenue baseEntered vibrant Chattanooga market Feb 2017Opened Green Hills branch March 2017Added LPO in Murfreesboro – Rutherford CountyContinued focus on integration/cost savingsRussell 2000 inclusionIncreased cash dividend 9.1% - changes to quarterly payment from annual payment

Why Nashville & Middle Tennessee? LIVABILITYAttracts & Retains Talent LOCATIONStrategic & Low-Cost TALENTAvailable & Educated ECONOMYRegional & Diverse

Nashville MSA Demographics ScaleThe Nashville region is expected to surpass the current size of Austin, Charlotte, Portland, and Denver regions by 2035, with a population of 2.6 millionNashville is the 8th largest Southeast metropolitan area with a population exceeding 1.8 million as of July 2016Population grew approximately 11.6% from 2010 through 2016 at 1.85% annually Unemployment rate of 2.9% is below the national average of 4.1% as of April 2017Median household income growth of 16.5% from 2000-2012 Nashville Market Highlights Source: SNL Financial, Bureau of Labor Statistics, Nashville Area Chamber of Commerce

Nashville MSA Demographics Strong Business EnvironmentWilliamson and Rutherford counties top 5 job growth markets in America4th on Forbes’ list of top cities for technology jobs and white collar job growth (2016)Historic success in landing major brand-name corporate relocations including Nissan North America, Dell Computer, Caterpillar Financial, and Ford Motor CreditPassionate Sports Fan Base Nashville PredatorsTennessee Titans Nashville Market Highlights Source: SNL Financial, Bureau of Labor Statistics, Nashville Area Chamber of Commerce

Nashville Demographics 2022 Median Household Income (HHI) ($) ‘17 – ‘22 Projected HHI Growth (%) ‘17 – ‘22 Projected Population Growth (%) (1) Source: SNL Financial, Bureau of Labor Statistics, Nashville Area Chamber of CommerceCUBN deposit data weighted by county (1) (1)

Population Growth Projection - 2040 County Ranking County % Growth by 2040 1 Williamson (Brentwood, Franklin) 153% 2 Rutherford (Murfreesboro) 99% 3 Sevier 86% 4 Wilson 80% 5 Montgomery 60% 6 Knox 47% 7 Sumner (Gallatin) 36% 8 Davidson (Nashville) 20% 9 Hamilton (Chattanooga) 13% 10 Shelby 9%

Financial Information NASDAQ: CUBN

Second Quarter 2017 Highlights Net income $2.2 million, $.28 per share Return on average assets – 0.90% Return on average equity – 7.98%Loans + 10.9% YoY to $719.8 millionDeposits + 29.7% YoY to $840.0 millionAssets +13.7% YoY to $1.0 billionStrong net interest margin 4.01%Superior asset quality = Low level of NPA’s, Strong ALLL, Low NCO’sCapital = all ratios exceed regulatory targets for “well capitalized”Positioned for revenue growth, improved efficiency
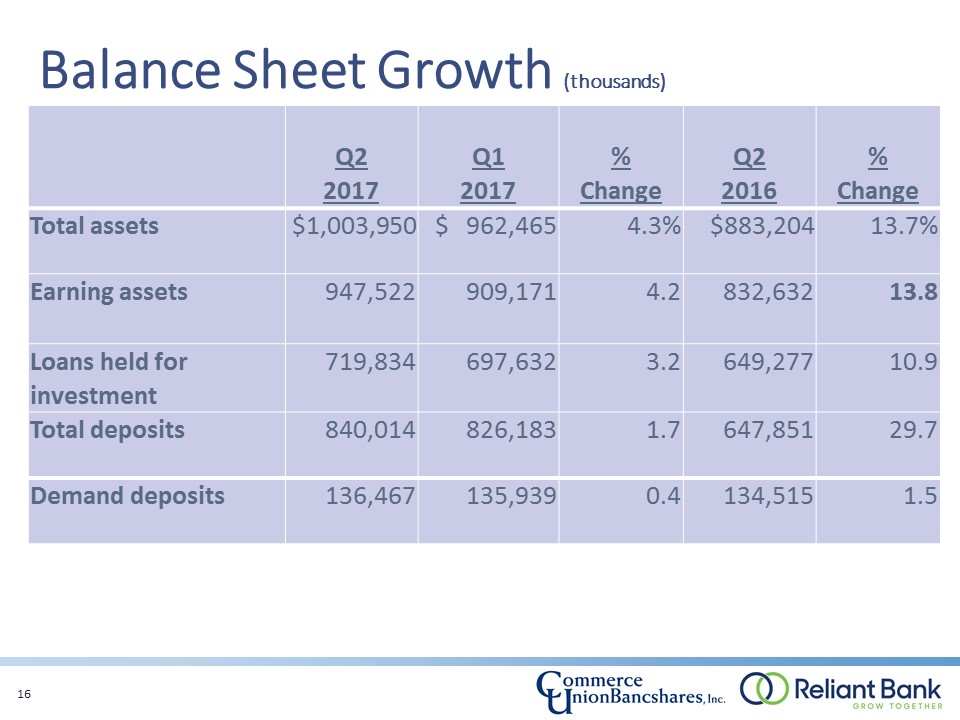
Balance Sheet Growth (thousands) Q2 2017 Q1 2017 % Change Q2 2016 % Change Total assets $1,003,950 $ 962,465 4.3% $883,204 13.7% Earning assets 947,522 909,171 4.2 832,632 13.8 Loans held for investment 719,834 697,632 3.2 649,277 10.9 Total deposits 840,014 826,183 1.7 647,851 29.7 Demand deposits 136,467 135,939 0.4 134,515 1.5

Revenue Growth and Profitability (thousands except share amounts) Q2 2017 Q1 2017 % Change Q2 2016 % Change Net income attributable to common shareholders $2,187 $2,058 6.3% $2,360 -7.3% Fully diluted EPS (as reported) 0.28 0.26 7.7 0.31 -9.7 Fully diluted EPS (as adjusted) 0.28 0.26 7.7 0.23 21.8 Net interest income (as reported) 8,503 7,971 6.7 8,692 -2.2 Net interest income (as adjusted) 8,378 7,853 6.7 7,631 9.8 Net interest margin (as reported) 4.01% 4.01% - 4.33% (32BP) Net interest margin (as adjusted) 3.96 3.96 - 3.91 5BP Provision for loan losses $245 $410 -40.2 $450 -45.6 Non-interest income 1,231 1,139 8.1 2,510 -51.0 Non-interest expense 7,268 6,869 5.8 8,027 -9.5

Loan Platform % of Loans by Market (1) Gross Loans Portfolio Composition Q217 Loans Held for Investment ($mm) CAGR: 12.0% Dollars in millionsSource: SNL Financial, Company documentsData as of or for the three months ended 6/30/17Note: Loan portfolio composition utilizes call report categories based on collateral typeBased upon borrower address

Diversified C&D Loan Portfolio Data as of 6/30/17Percentages shown on pie charts total 100% and are based upon book balances as of 6/30/17 Category (thousands) 1 - 4 Family Residential - Builders / Non-Owner Occupied $ 35,706 1 - 4 Family Residential - Owner Occupied 13,845 Total Land and Lots 27,182 Land Dev. - Residential 4,031 Apartment / Multi-Family 12,000 Hotel / Motel 8,753 Office - General 1,638 Retail - Non-Anchored Tenants 4,045 Retail - Single Credit Tenant 2,730 Self Storage 798 Commercial Construction - Owner-Occupied 2,414 Total $ 113,142

Diversified CRE Loan Portfolio Data as of 6/30/17Percentages shown on pie charts total 100% and are based upon book balances as of 6/30/17 Based upon non-owner occupied CRE portfolio as of 6/30/17 Category (thousands) Churches / Religious $2,083 Gas Station / C-Store 4,592 Golf Course 7,494 Hotel / Motel 2,496 Industrial / Warehouse 9,889 Office - General 28,312 Office Condo 288 Retail - Non-Anchored Tenants 61,295 Restaurant - National Franchise 4,928 Restaurant - Other 904 Retail - Single Credit Tenant 30,748 Self Storage 784 Other 2,693 Total $156,506

Asset Quality Nonperforming Assets Net Charge Offs (recoveries) / Average Loans (%) (1)

Deposit Portfolio Deposit Composition – 6/30/17 Non-Interest Bearing Deposit Growth Deposit Growth & Cost of Deposits (%) Dollars in millionsData as of or for the three months ended the date indicated

Historical Profitability Trends Source: SNL Financial Data as of or for the three months ended each respective quarterCore Income excludes extraordinary items, non-recurring items and gains / (losses) on sale of securities and non-controlling interest and includes amortization of intangibles and goodwill impairment; refer to appendix for “Reconciliation of non-GAAP financial measures”Net interest margin is defined as net interest income calculated on a tax-equivalent basis divided by average earning assets Per segment reporting; excludes impact of mortgage joint venture; refer to appendix for “Reconciliation of non-GAAP financial measures” Core ROAA (1) (%) Reported NIM (2) (%) Retail Banking Non-Interest Income (3) / Average Assets (%) Retail Banking Non-Interest Expense (3) / Average Assets (%)

Strategy for 2017 Develop new markets – Chattanooga, Murfreesboro, Green HillsAdd lending talent across all marketsGrow noninterest income – current and newImprove operating efficiencySuccessfully implement branding strategyMaintain superior asset quality

NASDAQ: CUBN Supplemental Information

Adjusted Net Income Attributable to Common Shareholders, Per Diluted Share Q2 2017 Q1 2017 % Change Q2 2016 % Change Net income attributable to common shareholders, per diluted share $0.28 $0.26 7.7% $0.31 (9.7)% Purchase accounting adjustments - - - (0.03) - Interest income recognized on payoff of purchased credit impaired loan - - - (0.05) - Adjusted net income attributable to common shareholders, per diluted share $0.28 $0.26 7.7% $0.23 21.8%

Adjusted Net Interest Margin Q2 2017 Q1 2017 % Change Q2 2016 % Change Net interest income $8,503 $7,971 6.7% $8,692 -2.2% Purchase accounting adjustments (125) (118) (442) Interest income recognized on payoff of purchased credit impaired loan - - (619) Adjusted net interest income $8,378 $7,853 6.7% $7,631 9.8% Adjusted net interest margin 3.96% 3.96% - 3.91% 5BP