Attached files
| file | filename |
|---|---|
| EX-99.3 - ASHLAND GLOBAL HOLDINGS INC | ex993.htm |
| EX-99.1 - ASHLAND GLOBAL HOLDINGS INC | ex991.htm |
| 8-K - ASHLAND GLOBAL HOLDINGS INC | form8k.htm |
Exhibit 99.2

Third-Quarter Fiscal 2017 Earnings August 1, 2017 / efficacy usability allure integrity profitability

Forward-Looking StatementsThis presentation contains forward-looking statements within the meaning of Section 27A of the Securities Act of 1933, as amended and Section 21E of the Securities Exchange Act of 1934, as amended. Ashland has identified some of these forward-looking statements with words such as “anticipates,” “believes,” “expects,” “estimates,” “is likely,” “predicts,” “projects,” “forecasts,” “objectives,” “may,” “will,” “should,” “plans” and “intends” and the negative of these words or other comparable terminology. Ashland may from time to time make forward-looking statements in its annual reports, quarterly reports and other filings with the SEC, news releases and other written and oral communications. These forward-looking statements are based on Ashland’s expectations and assumptions, as of the date such statements are made, regarding Ashland’s future operating performance and financial condition, as well as the economy and other future events or circumstances. Ashland’s expectations and assumptions include, without limitation, internal forecasts and analyses of current and future market conditions and trends, management plans and strategies, operating efficiencies and economic conditions (such as prices, supply and demand, cost of raw materials, and the ability to recover raw-material cost increases through price increases), and risks and uncertainties associated with the following: the impact of acquisitions and/or divestitures Ashland has made or may make, including the acquisition of Pharmachem (including the possibility that Ashland may not realize the anticipated benefits from such transactions); Ashland’s substantial indebtedness (including the possibility that such indebtedness and related restrictive covenants may adversely affect Ashland’s future cash flows, results of operations, financial condition and its ability to repay debt); the potential that Ashland does not realize all of the expected benefits of the separation of its Valvoline business; and severe weather, natural disasters, cyber events and legal proceedings and claims (including product recalls, environmental and asbestos matters). Various risks and uncertainties may cause actual results to differ materially from those stated, projected or implied by any forward-looking statements, including, without limitation, risks and uncertainties affecting Ashland that are described in Ashland’s most recent Form 10-K (including Item 1A Risk Factors) filed with the SEC, which is available on Ashland’s website at http://investor.ashland.com or on the SEC’s website at http://www.sec.gov. Ashland believes its expectations and assumptions are reasonable, but there can be no assurance that the expectations reflected herein will be achieved. Unless legally required, Ashland undertakes no obligation to update any forward-looking statements made in this presentation whether as a result of new information, future events or otherwise. Information on Ashland’s website is not incorporated into or a part of this presentation.Regulation G: Adjusted ResultsThe information presented herein regarding certain unaudited adjusted results does not conform to generally accepted accounting principles in the United States (U.S. GAAP) and should not be construed as an alternative to the reported results determined in accordance with U.S. GAAP. Ashland has included this non-GAAP information to assist in understanding the operating performance of the company and its reportable segments. The non-GAAP information provided may not be consistent with the methodologies used by other companies. All non-GAAP information related to previous Ashland filings with the SEC has been reconciled with reported U.S. GAAP results. 2
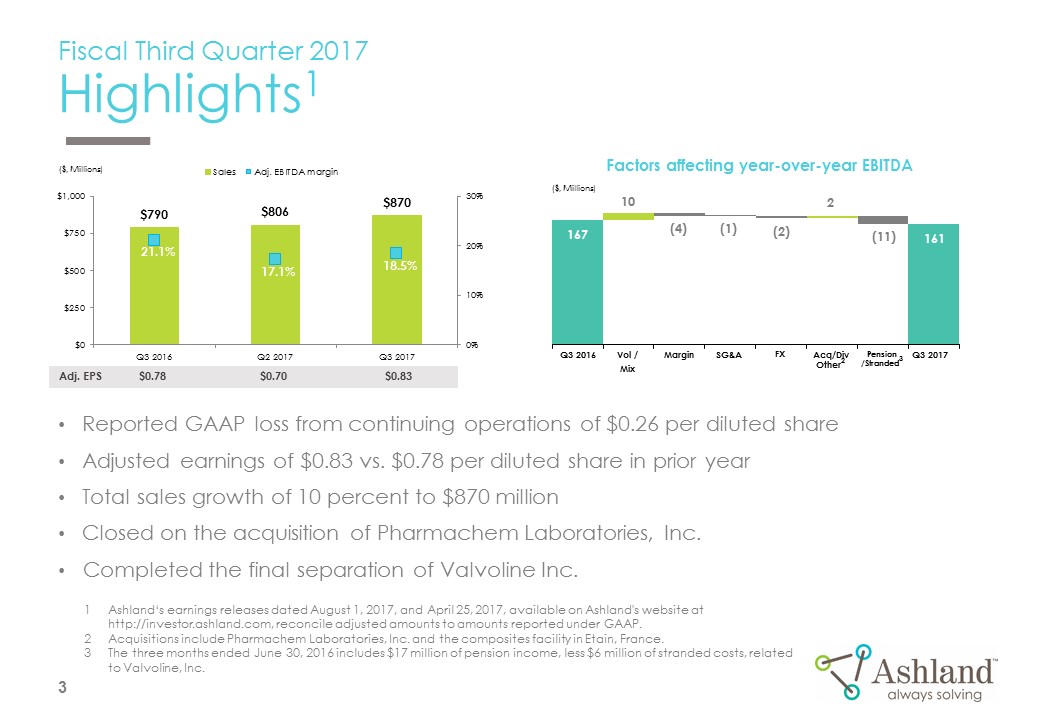
Fiscal Third Quarter 2017Highlights1 Reported GAAP loss from continuing operations of $0.26 per diluted shareAdjusted earnings of $0.83 vs. $0.78 per diluted share in prior yearTotal sales growth of 10 percent to $870 millionClosed on the acquisition of Pharmachem Laboratories, Inc.Completed the final separation of Valvoline Inc. Adj. EPS $0.78 $0.70 $0.83 Q3 2016 Vol /Mix Acq/Div Other2 Margin SG&A (4) 10 161 167 (1) Q3 2017 2 ($, Millions) ($, Millions) Factors affecting year-over-year EBITDA (11) FX 293 Ashland‘s earnings releases dated August 1, 2017, and April 25, 2017, available on Ashland's website at http://investor.ashland.com, reconcile adjusted amounts to amounts reported under GAAP. Acquisitions include Pharmachem Laboratories, Inc. and the composites facility in Etain, France. The three months ended June 30, 2016 includes $17 million of pension income, less $6 million of stranded costs, related to Valvoline, Inc. 3 (2) Pension /Stranded3

Fiscal Third Quarter – Continuing OperationsKey Items Affecting Income Excluding intangible amortization, adjusted EPS would have been 23 cents higher, or $1.06 per diluted share 4

Ashland Global Holdings Inc.Adjusted Results Summary1 Ashland‘s earnings releases dated August 1, 2017, and April 25, 2017, available on Ashland's website at http://investor.ashland.com, reconcile adjusted amounts to amounts reported under GAAP. The three months ended June 30, 2016 includes $17 million of pension income, less $6 million of stranded costs, related to Valvoline, Inc. Total sales of $870 million represents year-over-year growth of 10 percentAdjusted EBITDA of $161 million and adjusted EBITDA margin of 18.5 percent 5

Specialty IngredientsAdjusted Results Summary1 Sales increased $39 million, or 7 percent, to $591 million in the third quarterAdjusted EBITDA of $131 million increased 2 percent over the prior year Ashland‘s earnings releases dated August 1, 2017, and April 25, 2017, available on Ashland's website at http://investor.ashland.com, reconcile adjusted amounts to amounts reported under GAAP. 6
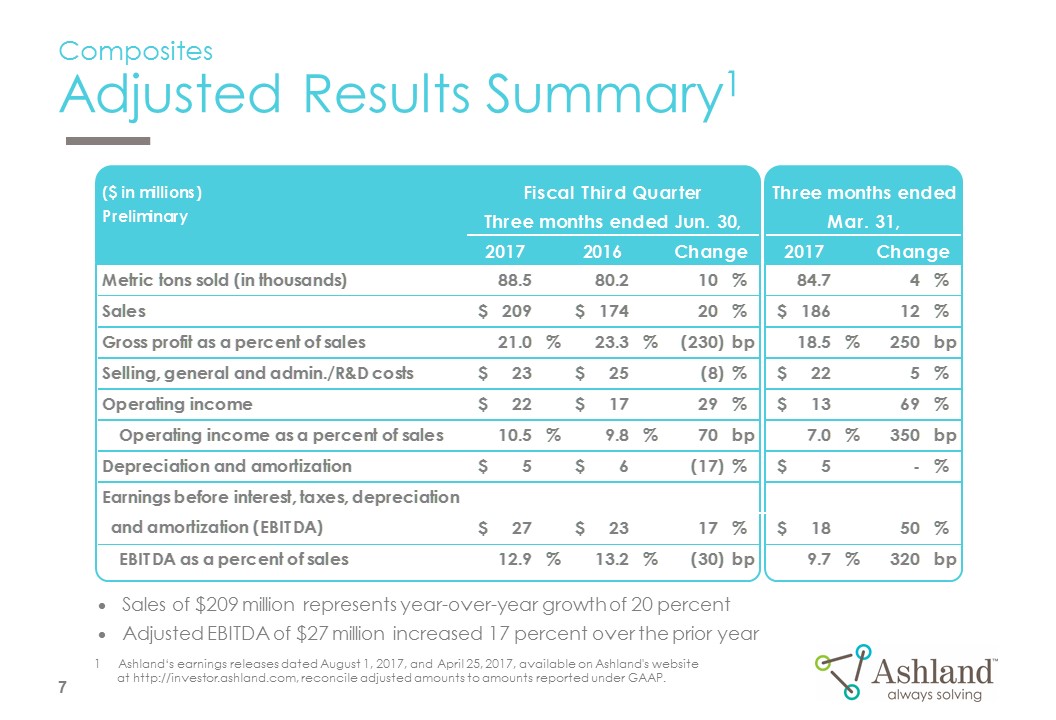
CompositesAdjusted Results Summary1 Sales of $209 million represents year-over-year growth of 20 percentAdjusted EBITDA of $27 million increased 17 percent over the prior year Ashland‘s earnings releases dated August 1, 2017, and April 25, 2017, available on Ashland's website at http://investor.ashland.com, reconcile adjusted amounts to amounts reported under GAAP. 7

Intermediates & SolventsAdjusted Results Summary1 Sales of $70 million represents year-over-year growth of 9 percentAdjusted EBITDA of $10 million increased 43 percent over the prior year Ashland‘s earnings releases dated August 1, 2017, and April 25, 2017, available on Ashland's website at http://investor.ashland.com, reconcile adjusted amounts to amounts reported under GAAP. 8
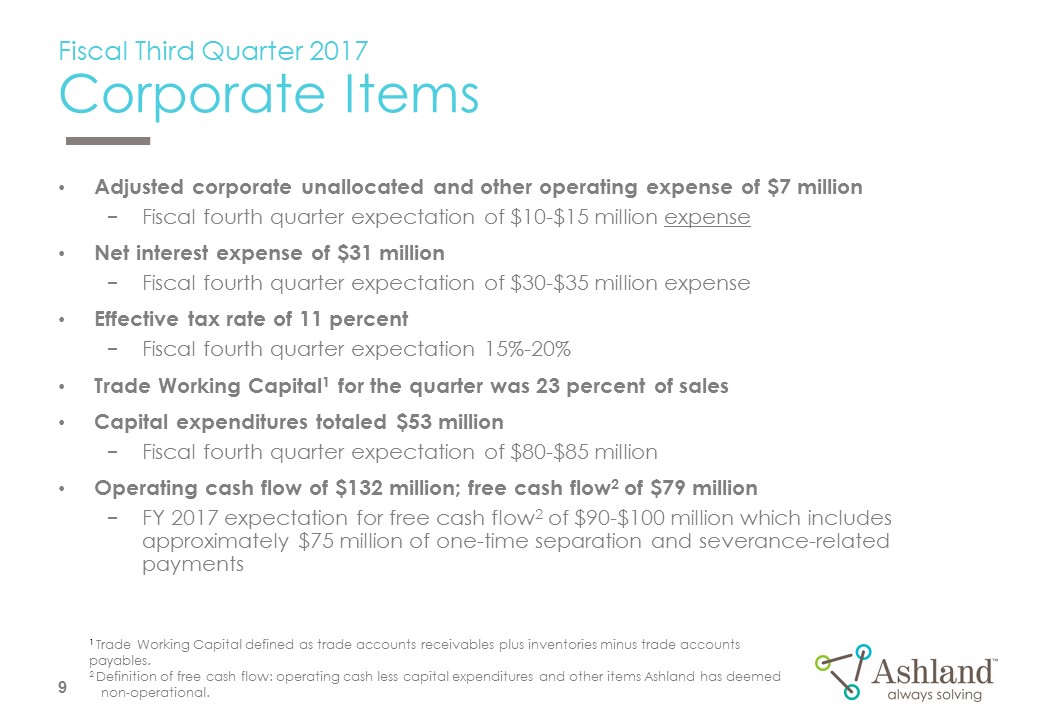
Fiscal Third Quarter 2017Corporate Items Adjusted corporate unallocated and other operating expense of $7 millionFiscal fourth quarter expectation of $10-$15 million expenseNet interest expense of $31 millionFiscal fourth quarter expectation of $30-$35 million expenseEffective tax rate of 11 percentFiscal fourth quarter expectation 15%-20%Trade Working Capital1 for the quarter was 23 percent of salesCapital expenditures totaled $53 millionFiscal fourth quarter expectation of $80-$85 millionOperating cash flow of $132 million; free cash flow2 of $79 millionFY 2017 expectation for free cash flow2 of $90-$100 million which includes approximately $75 million of one-time separation and severance-related payments 1 Trade Working Capital defined as trade accounts receivables plus inventories minus trade accounts payables.2 Definition of free cash flow: operating cash less capital expenditures and other items Ashland has deemed non-operational. 9

Ashland Investor Day, May 2017Financial targets to create shareholder value 10 Note: Adjusted EPS growth, Adjusted EBITDA and Free Cash Flow are forward looking non-GAAP financial measures. See Slide 26 for an explanation for why reconciliations are not available to the most directly comparable forward looking GAAP financial measure; 1. Cumulative Free Cash Flow generation over target period less certain key items; 2. New and Proprietary Product Sales defined as new products in the market for <= 5 years and patented products for life of patent * = 2021 Adjusted EBITDA Target New actions to sustain and grow premium mixEvolve business portfolioImplement new market strategiesExpand new and proprietary product sales2 (NPI)New initiatives to improve competitivenessAsset utilization programsPrice to value effortsSG&A inflation initiatives Ensure CapEx plus changes in working capital <6.5% per year Adjusted Specialty Ingredients EBITDA (%) >25%* Cashgeneration1$1B+ Adjusted EPS growth (CAGR)>15% 2018 – 2021 Performance Targets

Appendix A: Bridges

Ashland Q3 FY 2016 vs. Q3 FY 2017Sales and Adjusted EBITDA Bridges 2% Q3 2016 Volume / Mix 790 870 ($ millions)Preliminary Sales increased $80 million, or 10 percent, compared to the prior-year quarterAdjusted EBITDA of $161 million compared to $167 million in the prior-year quarterPrior-year adjusted EBITDA includes $11 million of pension income less stranded costs related to Valvoline Acquisitions include Pharmachem Laboratories, Inc. and the composites facility in Etain, France.The three months ended June 30, 2016 includes $17 million of pension income, less $6 million of stranded costs, related to Valvoline, Inc. 4% (1%) 5% Sales Price FX Acq/Div/Other1 Q3 2017 10 Q3 2016 Volume/ Mix 167 161 (4) (1) 2 (11) Adjusted EBITDA Margin SG&A FX Acq/Div/Other1 Q3 2017 12 (2) Pension /Stranded2

Specialty IngredientsSales and Adjusted EBITDA Bridges 1% Q3 2016 Volume / Mix 552 591 ($ millions)Preliminary Sales increased $39 million, or 7 percent, to $591 million in the third quarterSales growth achieved through positive volume/mix, pricing and acquisitionsAdjusted EBITDA of $131 million increased 2 percent over the prior year 1% (1%) 6% Sales Price FX Acq/Div/ Other1 Q3 2017 5 Q3 2016 Volume/ Mix 128 131 (5) (1) (2) 6 Adjusted EBITDA Margin SG&A FX Q3 2017 Acq/Div/ Other1 13 Acquisitions include Pharmachem Laboratories, Inc.
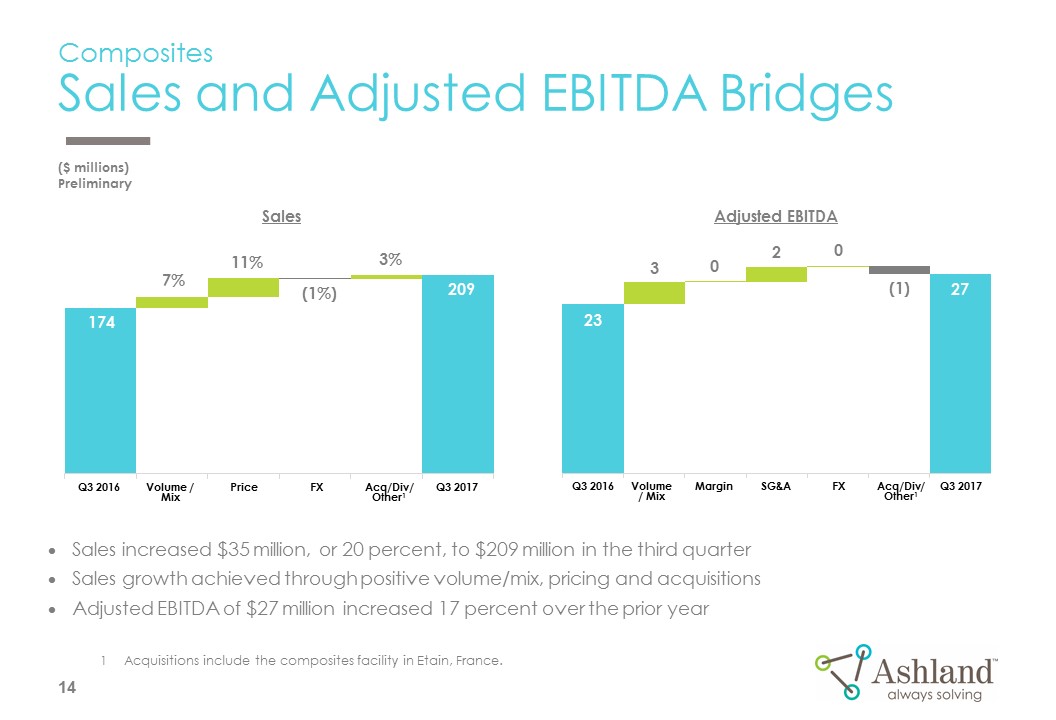
CompositesSales and Adjusted EBITDA Bridges 7% Q3 2016 Volume / Mix 174 209 ($ millions)Preliminary Sales increased $35 million, or 20 percent, to $209 million in the third quarterSales growth achieved through positive volume/mix, pricing and acquisitionsAdjusted EBITDA of $27 million increased 17 percent over the prior year 11% (1%) 3% Sales Price FX Acq/Div/ Other1 Q3 2017 3 Q3 2016 Volume/ Mix 23 27 0 2 0 (1) Adjusted EBITDA Margin SG&A FX Q3 2017 Acq/Div/ Other1 14 Acquisitions include the composites facility in Etain, France.

Intermediates & SolventsSales and Adjusted EBITDA Bridges 5% Q3 2016 Volume / Mix 64 70 ($ millions)Preliminary Sales increased $6 million, or 9 percent, to $70 million in the third quarterSales growth achieved through positive volume/mix and improved pricingAdjusted EBITDA of $10 million increased 43 percent over the prior year 6% (2%) 0% Sales Price FX Acq/Div/Other Q3 2017 2 Q3 2016 Volume/ Mix 7 10 1 0 0 0 Adjusted EBITDA Margin SG&A FX Q3 2017 Acq/Div/Other 15

Appendix B: Volume Trends and Liquidity and Net Debt
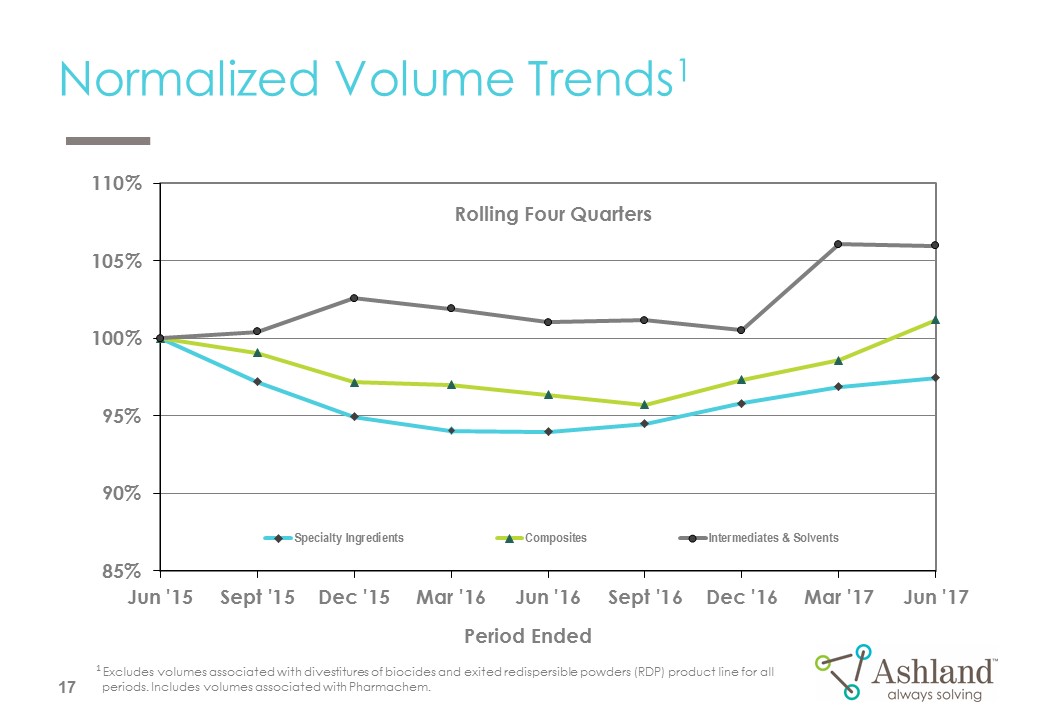
Period Ended 1 Excludes volumes associated with divestitures of biocides and exited redispersible powders (RDP) product line for all periods. Includes volumes associated with Pharmachem. Rolling Four Quarters Normalized Volume Trends1 17
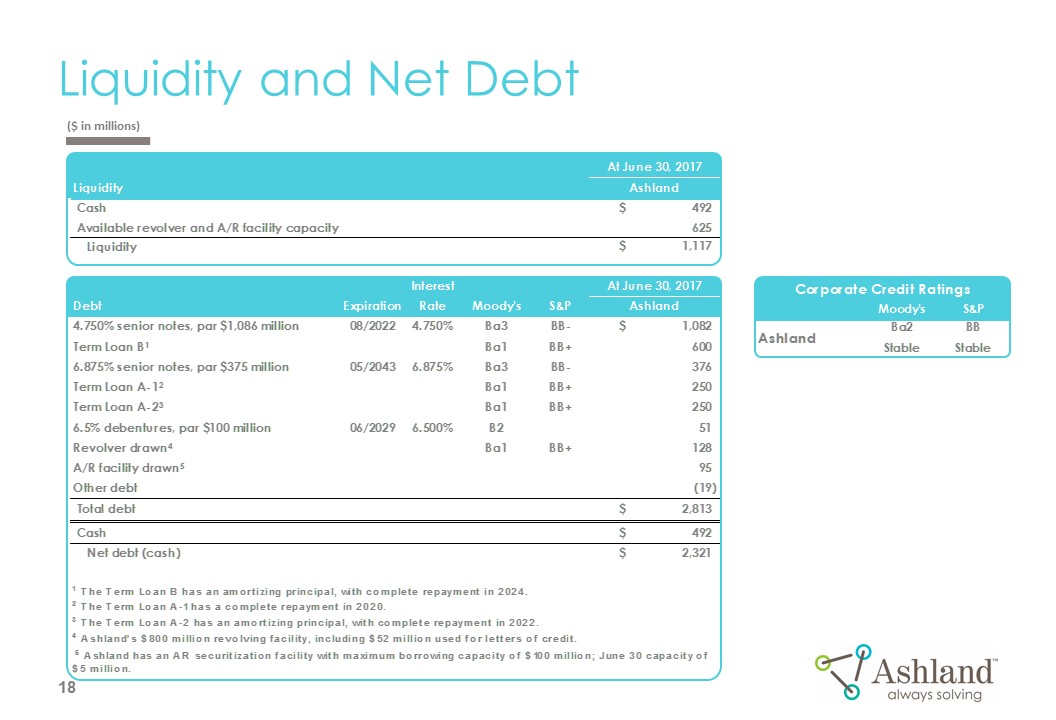
Liquidity and Net Debt ($ in millions) 18

Scheduled Debt Payments ($ in millions) 19

Appendix C: Business Profiles 12 Months Ended June 30, 2017

Corporate Profile By business unit By geography 1 For 12 months ended June 30, 2017.2 Ashland includes only U.S. and Canada in its North America designation. North America240% Asia Pacific19% LatinAmerica/Other - 9% Europe 32% SpecialtyIngredients69% Intermediates and Solvents8% Composites23% Sales1 - $3.1 Billion 21

Corporate Profile For 12 months ended June 30, 2017. See Appendix D for reconciliation to amounts reported under GAAP. NYSE Ticker Symbol: ASH Total Employees: ~7,000 Outside North America ~50% Number of Countries in Which Ashland Has Sales: More than 100 SpecialtyIngredients83% Intermediates and Solvents3% Adjusted EBITDA1 - $552 Million 22

Specialty Ingredients Salesby Market2 For 12 Months Ended June 30, 2017Sales: $2.1 billionAdjusted EBITDA: $479 million1Adjusted EBITDA Margin: 22.3%1 Salesby Product Cellulosics 37% PVP19% Adhesives 16% North America 39% AsiaPacific 20% Europe 31% Latin America/Other – 10% Actives – 6% Vinyl Ethers6% Salesby Geography3 1 See Appendix D for reconciliation to amounts reported under GAAP.2 Within the Sales by Market chart above, Industrial Specialties are presented in green and Consumer Specialties are presented in blue.3 Includes Pharmachem’s sales for the period May 17, 2017 through June 30, 2017, the period for which Pharmachem was owned. 23 A global leader of cellulose ethers, vinyl pyrrolidones and biofunctionals Pharmachem3 2% Pharmachem3 2%

Composites Salesby Geography For 12 Months Ended June 30, 2017Sales: $722 millionAdjusted EBITDA: $80 million1Adjusted EBITDA Margin: 11.1%1 Salesby Product UPR/VER383% Gel coats and other17% Construction: Residential19% Marine 23% Construction:Industrial40% Salesby Market North America48% Asia Pacific – 15% Europe29% Latin America/Other 8% Transportation 11% Construction: Infrastructure 7% 1 See Appendix D for reconciliation to amounts reported under GAAP.2 UPR stands for unsaturated polyester resins and VER stands for vinyl ester resins. 24 A global leader in unsaturated polyester resins, vinyl ester resins and gel coats
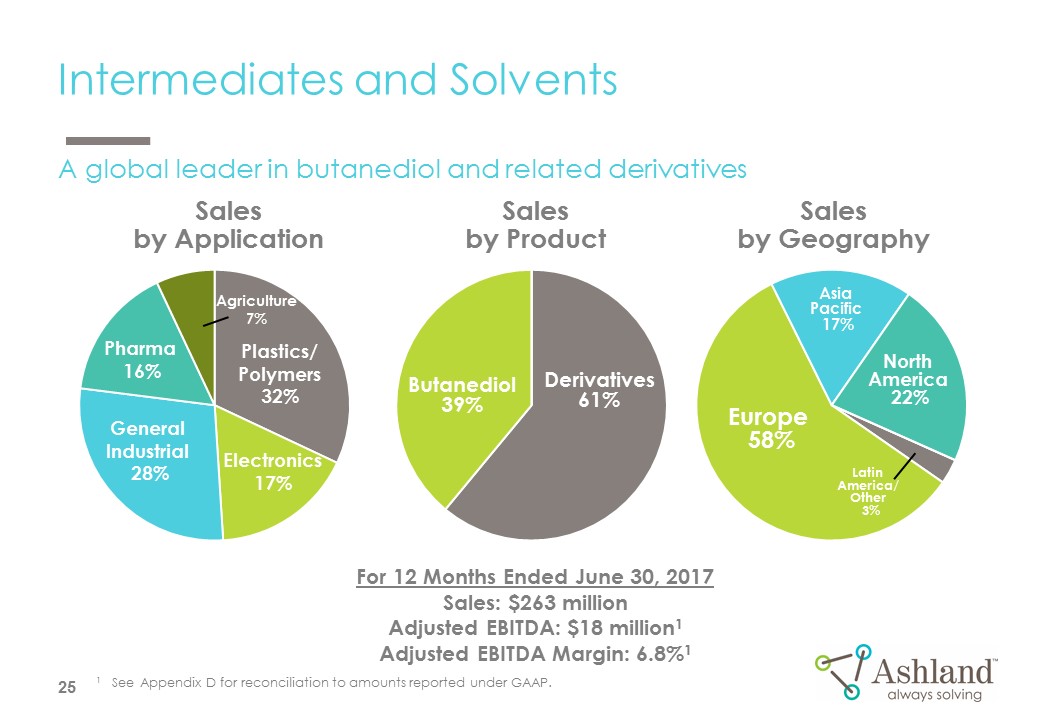
Intermediates and Solvents Salesby Geography For 12 Months Ended June 30, 2017Sales: $263 millionAdjusted EBITDA: $18 million1Adjusted EBITDA Margin: 6.8%1 Salesby Product Butanediol39% Derivatives61% GeneralIndustrial 28% Plastics/Polymers32% Salesby Application North America 22% Asia Pacific 17% Europe 58% Latin America/Other 3% 1 See Appendix D for reconciliation to amounts reported under GAAP. 25 A global leader in butanediol and related derivatives Pharma 16% Agriculture7%

Appendix D: Non-GAAP Reconciliation1 Although Ashland provides forward looking guidance for adjusted EBITDA in this presentation, Ashland is not reaffirming or providing forward-looking guidance for U.S. GAAP reported financial measures or a reconciliation of forward-looking non-GAAP financial measures to the most directly comparable U.S. GAAP measure because it is unable to predict with reasonable certainty the ultimate outcome of certain significant items without unreasonable effort.

Ashland Global Holdings Inc. and Consolidated SubsidiariesReconciliation of Non-GAAP Data for 12 Months Ended June 30, 2017 North America2__% Asia Pacific__% LatinAmerica/Other - _% Europe __% AshlandSpecialtyIngredients__% AshlandPerformanceMaterials__% Valvoline__% 1 Quarterly totals may not sum to actual results due to quarterly rounding conventions. Calculation of adjusted EBITDA for each quarter has been reconciled within certain financial filings with the SEC and posted on Ashland's website for each reportable segment. 27

® Registered trademark, Ashland or its subsidiaries, registered in various countries™ Trademark, Ashland or its subsidiaries, registered in various countries