Attached files
| file | filename |
|---|---|
| EX-99.1 - EXHIBIT 99.1 - ALBANY INTERNATIONAL CORP /DE/ | a51605566ex99_1.htm |
| 8-K - ALBANY INTERNATIONAL CORP. 8-K - ALBANY INTERNATIONAL CORP /DE/ | a51605566.htm |
Exhibit 99.2
Q2 Financial PerformanceAugust 1, 2017
‘Non-GAAP’ Items and Forward-Looking StatementsThis presentation contains the following non-GAAP measures:Percentage changes in net sales, excluding currency rate effects (for each segment, and the Company as a whole);Adjusted EBITDA (for each segment, and the Company as a whole; absolute and as a percentage of sales);Net debt; andNet income per share attributable to the Company, excluding adjustments. We think such items provide useful information to investors regarding the Company’s core operational performance. See the Company’s earnings release (which accompanies this presentation) for additional information including reconciliations to GAAP measures. This presentation also may contain statements, estimates, or projections that constitute “forward-looking statements” as defined under U.S. federal securities laws. Forward-looking statements are subject to certain risks and uncertainties that could cause actual results to differ materially from the Company’s historical experience and our present expectations or projections. We disclaim any obligation to update any information in this presentation to reflect any changes or developments after the date on the cover page. Certain additional disclosures regarding our use of these ‘non-GAAP’ items and forward-looking statements are set forth in our first-quarter earnings press release dated August 1, 2017, and in our SEC filings, including our most recent quarterly reports and our annual reports for the years ended December 31, 2014, 2015, and 2016. Our use of such items in this presentation is subject to those additional disclosures, which we urge you to read. 2
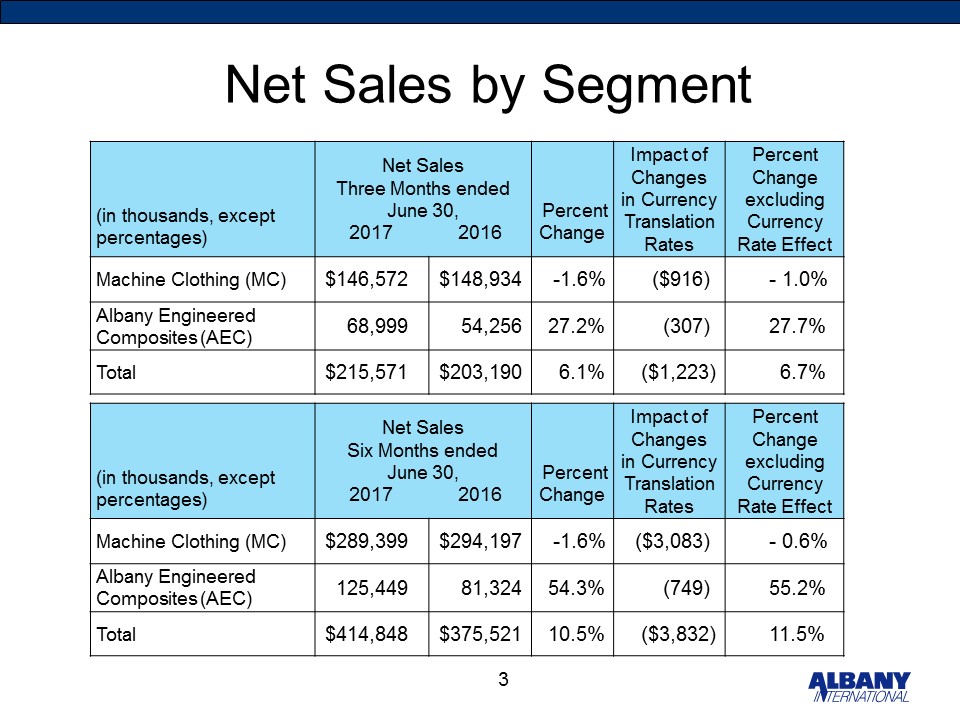
Net Sales by Segment 3 (in thousands, except percentages) Net SalesThree Months endedJune 30, 2017 2016 PercentChange Impact of Changesin CurrencyTranslation Rates Percent Changeexcluding Currency Rate Effect Machine Clothing (MC) $146,572 $148,934 -1.6% ($916) - 1.0% Albany Engineered Composites (AEC) 68,999 54,256 27.2% (307) 27.7% Total $215,571 $203,190 6.1% ($1,223) 6.7% (in thousands, except percentages) Net SalesSix Months endedJune 30, 2017 2016 PercentChange Impact of Changesin CurrencyTranslation Rates Percent Changeexcluding Currency Rate Effect Machine Clothing (MC) $289,399 $294,197 -1.6% ($3,083) - 0.6% Albany Engineered Composites (AEC) 125,449 81,324 54.3% (749) 55.2% Total $414,848 $375,521 10.5% ($3,832) 11.5%
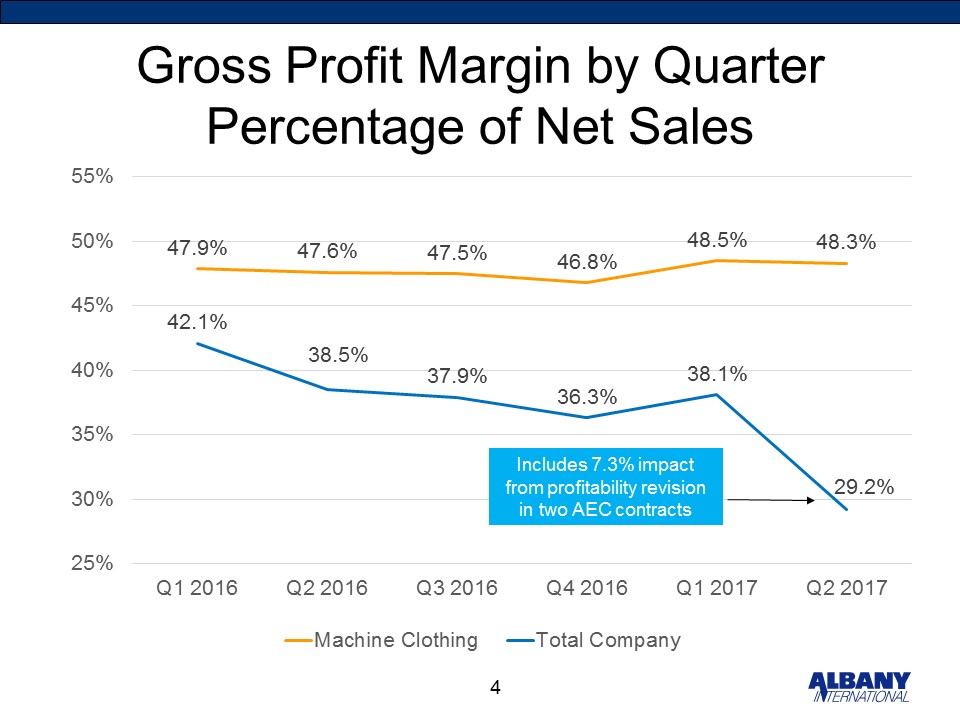
Gross Profit Margin by QuarterPercentage of Net Sales 4 Includes 7.3% impact from profitability revision in two AEC contracts
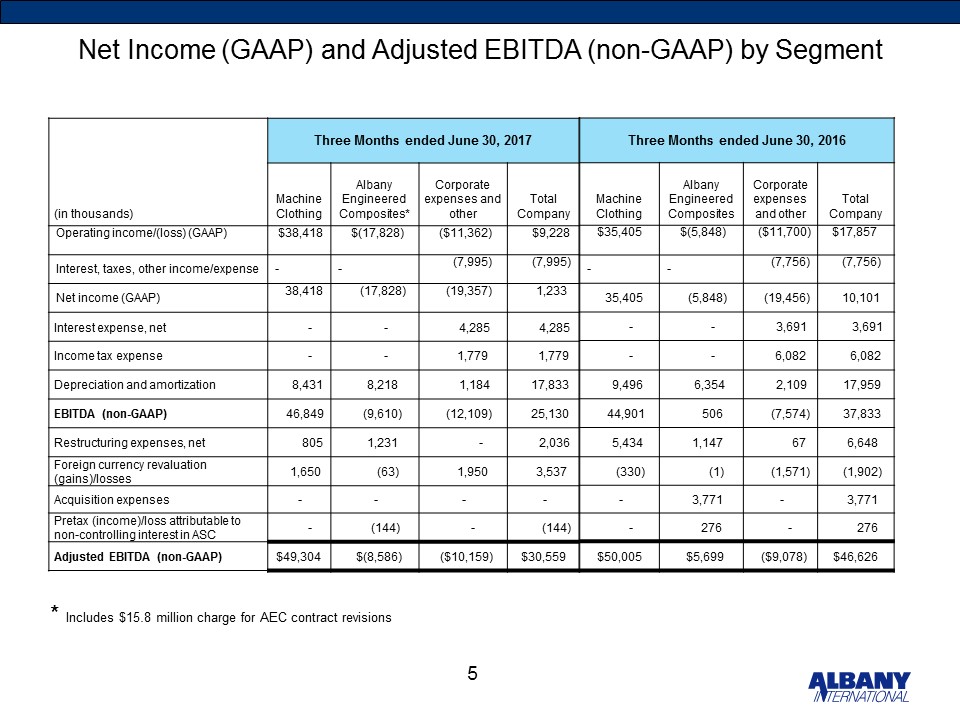
Net Income (GAAP) and Adjusted EBITDA (non-GAAP) by Segment 5 Three Months ended June 30, 2017 (in thousands) Machine Clothing Albany Engineered Composites* Corporate expenses and other Total Company Operating income/(loss) (GAAP) $38,418 $(17,828) ($11,362) $9,228 Interest, taxes, other income/expense - - (7,995) (7,995) Net income (GAAP) 38,418 (17,828) (19,357) 1,233 Interest expense, net - - 4,285 4,285 Income tax expense - - 1,779 1,779 Depreciation and amortization 8,431 8,218 1,184 17,833 EBITDA (non-GAAP) 46,849 (9,610) (12,109) 25,130 Restructuring expenses, net 805 1,231 - 2,036 Foreign currency revaluation (gains)/losses 1,650 (63) 1,950 3,537 Acquisition expenses - - - - Pretax (income)/loss attributable to non-controlling interest in ASC - (144) - (144) Adjusted EBITDA (non-GAAP) $49,304 $(8,586) ($10,159) $30,559 Three Months ended June 30, 2016 Machine Clothing Albany Engineered Composites Corporate expenses and other Total Company $35,405 $(5,848) ($11,700) $17,857 - - (7,756) (7,756) 35,405 (5,848) (19,456) 10,101 - - 3,691 3,691 - - 6,082 6,082 9,496 6,354 2,109 17,959 44,901 506 (7,574) 37,833 5,434 1,147 67 6,648 (330) (1) (1,571) (1,902) - 3,771 - 3,771 - 276 - 276 $50,005 $5,699 ($9,078) $46,626 * Includes $15.8 million charge for AEC contract revisions

Net Income (GAAP) and Adjusted EBITDA (non-GAAP) by Segment 6 Six Months ended June 30, 2017 (in thousands) Machine Clothing Albany Engineered Composites* Corporate expenses and other Total Company Operating income/(loss) (GAAP) $76,679 $(22,942) ($22,453) $31,284 Interest, taxes, other income/expense - - (19,077) (19,077) Net income (GAAP) 76,679 (22,942) (41,530) 12,207 Interest expense, net - - 8,613 8,613 Income tax expense - - 8,329 8,329 Depreciation and amortization 16,718 16,022 2,386 35,126 EBITDA (non-GAAP) 93,397 (6,920) (22,202) 64,275 Restructuring expenses, net 916 3,801 - 4,717 Foreign currency revaluation (gains)/losses 3,313 34 2,052 5,399 Acquisition expenses - - - - Pretax (income)/loss attributable to non-controlling interest in ASC - (314) - (314) Adjusted EBITDA (non-GAAP) $97,626 $(3,399) ($20,150) $74,077 Six Months ended June 30, 2016 Machine Clothing Albany Engineered Composites Corporate expenses and other Total Company $72,543 $(9,553) ($22,864) $40,126 - - (16,709) (16,709) 72,543 (9,553) (39,573) 23,417 - - 5,929 5,929 - - 13,125 13,125 18,813 9,750 4,216 32,779 91,356 197 (16,303) 75,250 6,132 1,147 48 7,327 1,560 4 (2,047) (483) - 5,367 - 5,367 - 463 - 463 $99,048 $7,178 ($18,302) $87,924 * Includes $15.8 million charge for AEC contract revisions
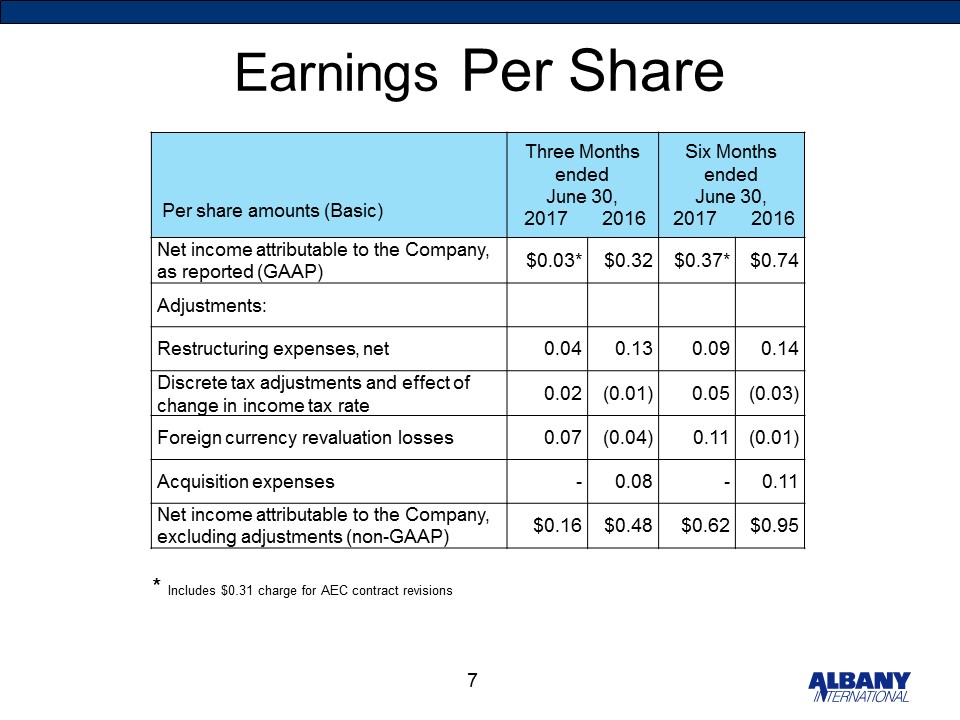
7 Earnings Per Share Per share amounts (Basic) Three Months endedJune 30, 2017 2016 Six Months endedJune 30, 2017 2016 Net income attributable to the Company, as reported (GAAP) $0.03* $0.32 $0.37* $0.74 Adjustments: Restructuring expenses, net 0.04 0.13 0.09 0.14 Discrete tax adjustments and effect of change in income tax rate 0.02 (0.01) 0.05 (0.03) Foreign currency revaluation losses 0.07 (0.04) 0.11 (0.01) Acquisition expenses - 0.08 - 0.11 Net income attributable to the Company, excluding adjustments (non-GAAP) $0.16 $0.48 $0.62 $0.95 * Includes $0.31 charge for AEC contract revisions
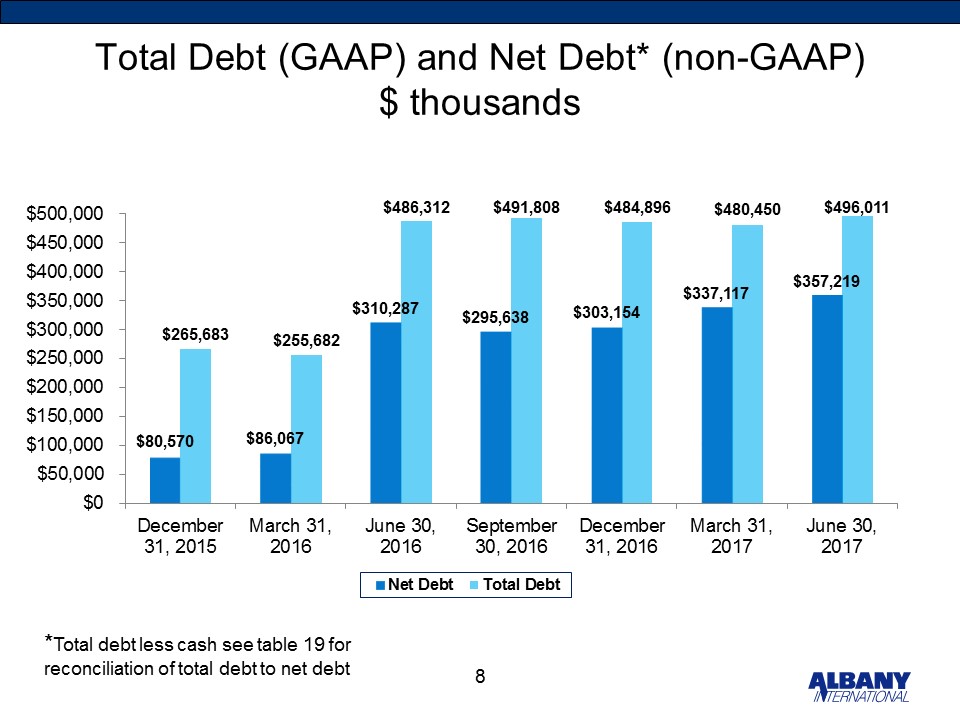
Total Debt (GAAP) and Net Debt* (non-GAAP)$ thousands 8 *Total debt less cash see table 19 for reconciliation of total debt to net debt