Attached files
| file | filename |
|---|---|
| 8-K - 8-K - SANDY SPRING BANCORP INC | v471740_8k.htm |
Exhibit 99.1
Daniel J. Schrider President & Chief Executive Officer Philip J. Mantua Executive Vice President & Chief Financial Officer KBW 2017 Community Bank Investor Conference August 1 - 2, 2017
FORWARD - LOOKING INFORMATION During the course of this presentation, management may make forward - looking statements that are subject to risks and uncertainties. These forward - looking statements include: statements of goals, intentions, earnings expectations, and other expectations; estimates of risks and future costs and benefits; assessments of probable loan and lease losses; assessments of market risk; and statements of the ability to achieve financial and other goals. These forward - looking statements are subject to significant uncertainties because they are based upon or are affected by: management’s estimates and projections of future interest rates, market behavior, and other economic conditions; future laws and regulations; and a variety of other matters which, by their nature, are subject to significant uncertainties. Because of these uncertainties, Sandy Spring Bancorp’s actual future results may differ materially from those indicated. In addition, the Company’s past results of operations do not necessarily indicate its future results. 2 SASR; KBW 2017 Community Bank Investor Conference , August 1 - 2, 2017

Corporate Profiles 3 ♦ Headquartered in Olney, MD, an affluent suburb of Washington, DC ♦ Oldest independent bank of local origin ♦ 44 community banking offices in Maryland, Northern Virginia & DC along with 8 loan production offices ♦ $ 5.3 billion in assets (as of 6/30/17 ) ♦ $973 million market capitalization (as of 7/25/17 ) ♦ 68% institutional ownership ♦ Approximately 75% of employees own stock ♦ Insurance Agency and Asset Management subsidiaries ▪ Headquartered in Reston, VA, also an affluent suburb of Washington, DC ▪ Chartered in 2004 and current CEO in place since inception (along with nearly the entire management team) ▪ Management team skilled with successful transactions (including fee - based businesses ) ▪ 19 community banking offices ▪ $2.1 billion in assets (as of 6/30/17 ) ▪ $450 million market capitalization (as of 7/25/17 ) ▪ 50% institutional ownership ▪ Operates WashingtonFirst Mortgage, a division of WashingtonFirst Bank and 1 st Portfolio Advisors Source: Company filings and S&P Global Market Intelligence SASR; KBW 2017 Community Bank Investor Conference , August 1 - 2, 2017
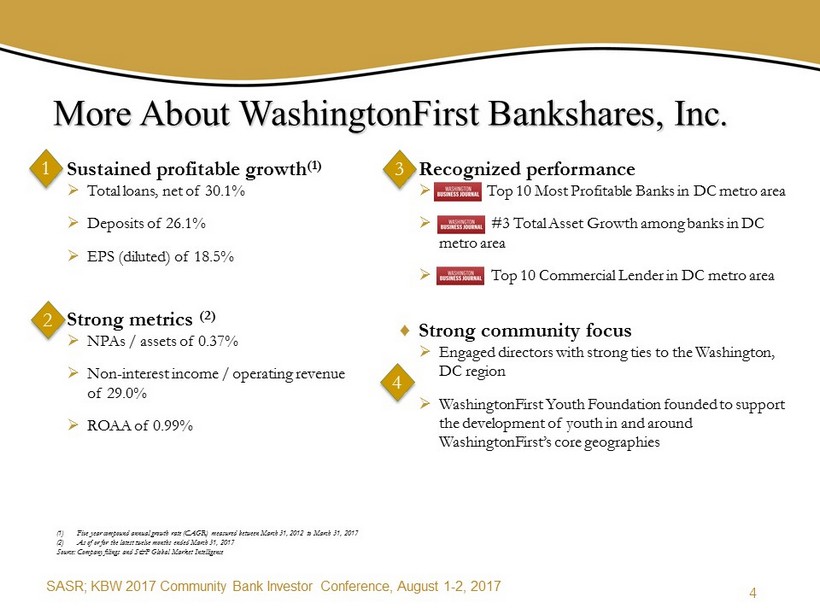
More About WashingtonFirst Bankshares, Inc. 4 (1) Five year compound annual growth rate (CAGR) measured between March 31, 2012 to March 31, 2017 (2) As of or for the latest twelve months ended March 31, 2017 Source: Company filings and S&P Global Market Intelligence ♦ Recognized performance » Top 10 Most Profitable Banks in DC metro area » #3 Total Asset Growth among banks in DC metro area » Top 10 Commercial Lender in DC metro area ♦ Strong community focus » Engaged directors with strong ties to the Washington, DC region » WashingtonFirst Youth Foundation founded to support the development of youth in and around WashingtonFirst’s core geographies ♦ Sustained profitable growth (1) » Total loans, net of 30.1% » Deposits of 26.1% » EPS (diluted) of 18.5% ♦ Strong metrics (2) » NPAs / assets of 0.37% » Non - interest income / operating revenue of 29.0 % » ROAA of 0.99% 1 2 3 4 SASR; KBW 2017 Community Bank Investor Conference , August 1 - 2, 2017
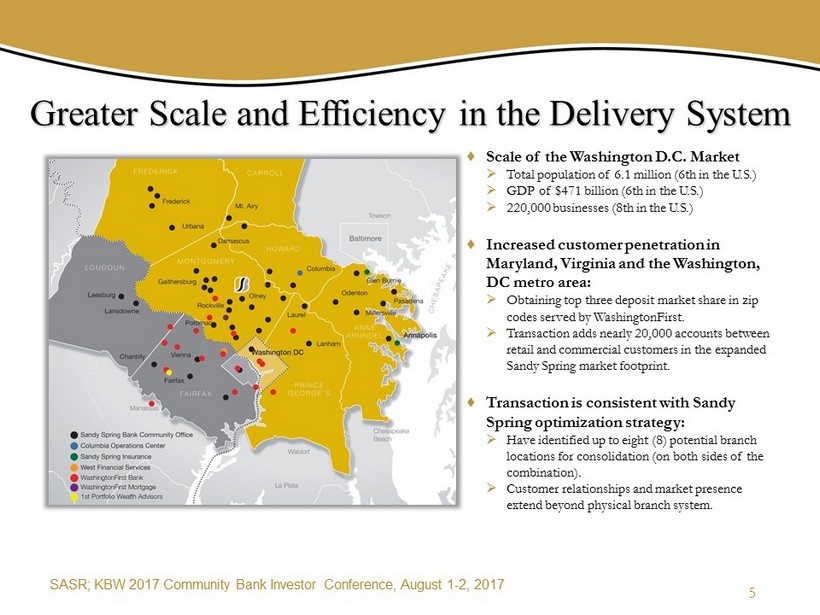
Greater Scale and Efficiency in the Delivery System 5 ♦ Scale of the Washington D.C. Market » Total population of 6.1 million (6th in the U.S.) » GDP of $471 billion (6th in the U.S.) » 220,000 businesses (8th in the U.S.) ♦ Increased customer penetration in Maryland, Virginia and the Washington, DC metro area: » Obtaining top three deposit market share in zip codes served by WashingtonFirst. » Transaction adds nearly 20,000 accounts between retail and commercial customers in the expanded Sandy Spring market footprint. ♦ Transaction is consistent with Sandy Spring optimization strategy: » Have identified up to eight (8) potential branch locations for consolidation (on both sides of the combination ). » Customer relationships and market presence extend beyond physical branch system. SASR; KBW 2017 Community Bank Investor Conference , August 1 - 2, 2017

Greater Washington Market Highlights ♦ 24% of the regions workforce has a graduate degree; 49% has a bachelor’s degree, 1 st in the nation ♦ Home to 6 of the top 10 most educated counties in the US ♦ # 1 in the US for occupational concentration for Computer and Math Sciences and Business and Financial Services ♦ #1 in the US for federal procurement — more than Texas or California ♦ Future growth expected in cyber security, homeland security, clean energy and health care Greater Washington Jobs by Sector 2017 Source: The Stephen S. Fuller Institute 6 SASR; KBW 2017 Community Bank Investor Conference , August 1 - 2, 2017
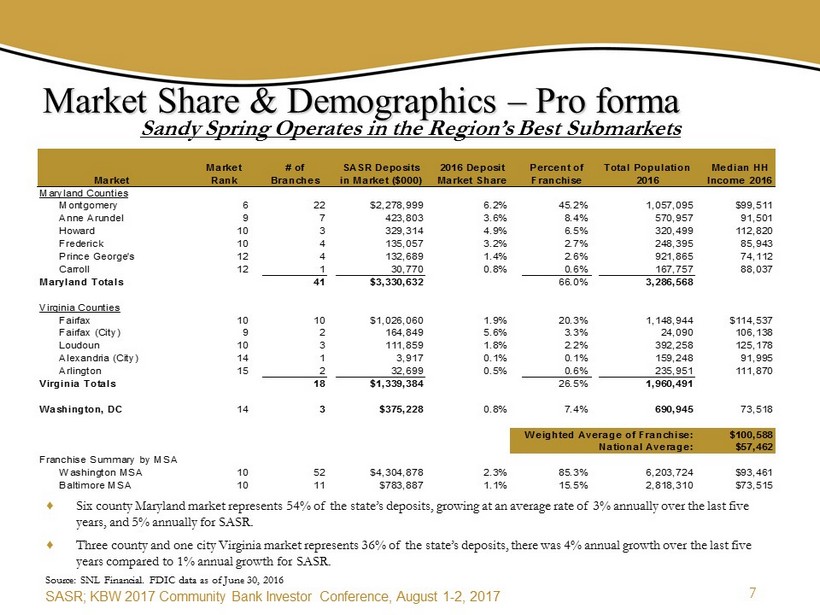
Market Share & Demographics – Pro forma ♦ Six county Maryland market represents 54% of the state’s deposits, growing at an average rate of 3% annually over the last five years, and 5% annually for SASR. ♦ Three county and one city Virginia market represents 36% of the state’s deposits, there was 4% annual growth over the last five years compared to 1 % annual growth for SASR. Sandy Spring Operates in the Region’s Best Submarkets 7 Source: SNL Financial. FDIC data as of June 30, 2016 Market Market Rank # of Branches SASR Deposits in Market ($000) 2016 Deposit Market Share Percent of Franchise Total Population 2016 Median HH Income 2016 Maryland Counties Montgomery 6 22 $2,278,999 6.2% 45.2% 1,057,095 $99,511 Anne Arundel 9 7 423,803 3.6% 8.4% 570,957 91,501 Howard 10 3 329,314 4.9% 6.5% 320,499 112,820 Frederick 10 4 135,057 3.2% 2.7% 248,395 85,943 Prince George's 12 4 132,689 1.4% 2.6% 921,865 74,112 Carroll 12 1 30,770 0.8% 0.6% 167,757 88,037 Maryland Totals 41 $3,330,632 66.0% 3,286,568 Virginia Counties Fairfax 10 10 $1,026,060 1.9% 20.3% 1,148,944 $114,537 Fairfax (City) 9 2 164,849 5.6% 3.3% 24,090 106,138 Loudoun 10 3 111,859 1.8% 2.2% 392,258 125,178 Alexandria (City) 14 1 3,917 0.1% 0.1% 159,248 91,995 Arlington 15 2 32,699 0.5% 0.6% 235,951 111,870 Virginia Totals 18 $1,339,384 26.5% 1,960,491 Washington, DC 14 3 $375,228 0.8% 7.4% 690,945 73,518 Weighted Average of Franchise: $100,588 National Average: $57,462 Franchise Summary by MSA Washington MSA 10 52 $4,304,878 2.3% 85.3% 6,203,724 $93,461 Baltimore MSA 10 11 $783,887 1.1% 15.5% 2,818,310 $73,515 SASR; KBW 2017 Community Bank Investor Conference , August 1 - 2, 2017

♦ Market dominated by larger regional and national banks ♦ Over 75% aggregate share amongst banks with assets greater than $50 billion ♦ SASR is positioned to achieve significant growth Significant Opportunity to Take Share – Pro forma Source: SNL Financial. FDIC data as of June 30, 2016 . 8 Rank Institution # of Branches Total Deposits ($000) Market Share 1 Capital One Financial Corp. 47 $7,931,009 21.4% 2 Bank of America Corp. 32 6,511,660 17.6% 3 SunTrust Banks Inc. 35 4,498,385 12.2% 4 Wells Fargo & Co. 20 2,854,426 7.7% 5 Eagle Bancorp Inc. 7 2,426,795 6.6% 6 Sandy Spring Bancorp Inc. 22 2,278,999 6.2% Total for institutions in the market: 295 $37,033,331 Rank Institution # of Branches Total Deposits ($000) Market Share 1 Wells Fargo & Co. 166 $31,872,851 16.9% 2 Bank of America Corp. 156 30,275,134 16.1% 3 Capital One Financial Corp 140 25,654,173 13.6% 4 SunTrust Banks Inc. 158 18,602,750 9.9% 5 BB&T Corp. 183 13,470,334 7.2% 6 PNC Financial Services Group 180 12,496,495 6.6% 7 United Bankshares Inc. 70 8,786,530 4.7% 8 Citigroup Inc. 34 6,677,000 4.2% 9 Eagle Bancorp Inc 21 5,404,317 2.9% 10 Sandy Spring Bancorp Inc. 52 4,304,878 2.3% Total for institutions in the market: 1,594 188,412,366 Montgomery County, MD MSA Washington, D.C. MSA SASR; KBW 2017 Community Bank Investor Conference , August 1 - 2, 2017

Transaction Rationale 9 Increases Presence and Market Share in Key Washington, DC Metro Area Markets Complementary Business and Cultural Fit Lower Transaction Risk ♦ Combination of Sandy Spring Bancorp and WashingtonFirst consistent with Sandy Spring strategic objectives. ♦ Pro forma traditional branch system extends reach of Sandy Spring brand in strategically important Northern Virginia marketplace. ♦ Strengthens existing presence in the Washington, DC corridor and creates a premier bank in region. ♦ Two well known financial services brands both focused on providing exceptional services and remarkable experiences to the client base. ♦ Complementary loan and deposit mixes united by similar credit quality and risk appetite cultures. ♦ Add selected depth to both the corporate governance and management teams. ♦ Thorough level of due diligence and thoughtful consideration of integration strategies. ♦ Highly motivated management team has energy to quickly integrate. ♦ Identified meaningful and achievable opportunities for cost savings and operating efficiencies at WashingtonFirst. ♦ Revenue enhancement opportunities (not modeled but considered) include enhanced cross - sell of Sandy Spring fee - based lines of business and accelerated growth in lending markets. SASR; KBW 2017 Community Bank Investor Conference , August 1 - 2, 2017

Summary of Terms and Key Transaction Metrics 10 Transaction Summary (1) Transaction Valuation (1),(2) ♦ Offer price per share (1) : $36.50 ♦ Transaction value: $488.9 million in the aggregate ♦ Consideration mix: 100% SASR stock (cash out of WFBI options) ♦ Exchange ratio: 0.8713 SASR (subject to pricing mechanism) ♦ Price/tangible book value (2) : 256.3% ♦ Price/LTM EPS (X): 25.9X ♦ Price/2017 Consensus EPS (X) (3) : 24.0X (1) Based on Sandy Spring’s closing price as of May 12, 2017; note: actual price will be based on Parent Average Price as defined in the Merger Agreement (2) Data for WashingtonFirst as of March 31, 2017 and latest twelve months ended March 31, 2017 (3) Based on consensus estimate as of May 12, 2017 of $1.52 per share for WFBI Corporate Governance ♦ Four current WFBI board members to be appointed to SASR’s board ♦ Shaza Andersen and Joe Bracewell will also join SASR’s executive committee SASR; KBW 2017 Community Bank Investor Conference , August 1 - 2, 2017

Transaction Assumptions and Considerations 11 Restructuring Charges and Cost Savings Acquisition Accounting Adjustments Other Considerations ♦ Cost savings targeted at 39% of WFBI non - interest expenses ♦ Approximately 80% of cost savings to be realized during 2018; 100% realized in 2019 ♦ Transaction expenses, restructuring charges and investment in pro forma SASR of $25.8 million (pre - tax ) ♦ Credit loan mark - down on WFBI loan portfolio estimated at $10.1 million ♦ Interest rate loan mark - up on WFBI loan portfolio estimated at $24.0 million ♦ Minimal adjustments applied to fixed assets ♦ Core deposit intangible estimated to be 50 basis points (amortized over 8 years ) ♦ Retain $25 million of WFBI subordinated debt ♦ Retain $8 million of WFBI - assumed trust preferred securities SASR; KBW 2017 Community Bank Investor Conference , August 1 - 2, 2017
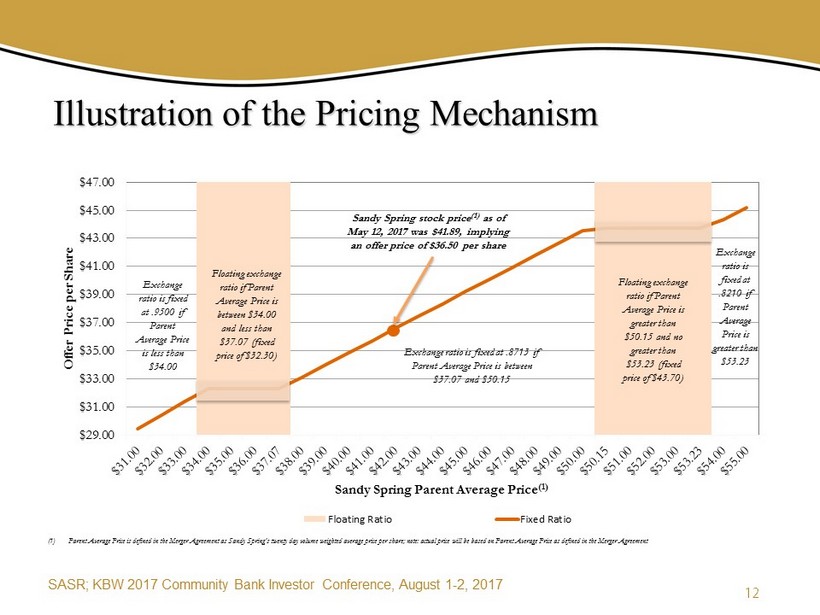
Illustration of the Pricing Mechanism 12 $29.00 $31.00 $33.00 $35.00 $37.00 $39.00 $41.00 $43.00 $45.00 $47.00 Offer Price per Share Sandy Spring Parent Average Price (1) Floating Ratio Fixed Ratio (1) Parent Average Price is defined in the Merger Agreement as Sandy Spring’s twenty day volume weighted average price per share; no te: actual price will be based on Parent Average Price as defined in the Merger Agreement Floating exchange ratio if Parent Average Price is greater than $50.15 and no greater than $53.23 (fixed price of $43.70) Floating exchange ratio if Parent Average Price is between $34.00 and less than $37.07 (fixed price of $32.30) Exchange ratio is fixed at .8210 if Parent Average Price is greater than $53.23 Exchange ratio is fixed at .8713 if Parent Average Price is between $37.07 and $50.15 Exchange ratio is fixed at .9500 if Parent Average Price is less than $34.00 Sandy Spring stock price (1) as of May 12, 2017 was $41.89, implying an offer price of $36.50 per share SASR; KBW 2017 Community Bank Investor Conference , August 1 - 2, 2017

Pro forma Capital Ratios (5) Summary of Transaction Impacts 13 ♦ 2018E EPS impact: 8.3% accretive (1) ♦ 2019E EPS impact: 12.7% accretive (1) ♦ Pro forma TBV dilution at close: 4.8% dilutive (2) ♦ TBV earnback: 3.75 years (3) ♦ Internal rate of return: > 15.0% (4) (1) Estimated based on consensus earnings estimates for Sandy Spring and WashingtonFirst plus adjustments , after - tax, resulting fro m the transaction. Neither Sandy Spring or WashingtonFirst endorse consensus earnings estimate or publish financial guidance . Please note that actual results may differ materially. (2) Measured at closing, assuming a close date of December 31, 2017 and $5.5 million in pre - tax transaction expenses incurred in 201 7 (3) Measured using the cross - over method (4) Based on aggregate deal value as of May 12, 2017 and a terminal earnings multiple of 16X (5) Measured at closing, assuming a close date of December 31, 2017 and $5.5 million in pre - tax transaction expenses incurred in 201 7 ♦ TCE / TA ratio: 8.85% ♦ Tier 1 leverage ratio: 9.30% ♦ Total capital ratio: 12.00% Impact on SASR Shareholders SASR; KBW 2017 Community Bank Investor Conference , August 1 - 2, 2017
Strategic Objectives ♦ Execute strategy focused on the Client Experience ♦ Continue to grow and integrate fee - based business lines ♦ Achieve balanced & diverse loan & deposit growth ♦ Continue Channel Optimization effort including branch rationalization ♦ Continue Employee Development strategy ♦ Proactively pursue bank & non - bank M&A 14 SASR; KBW 2017 Community Bank Investor Conference , August 1 - 2, 2017

Client Experience Strategy Our goal is to create remarkable experiences that will: ♦ Convert clients into our best advocates ♦ Provide employees with rewarding growth opportunities ♦ Distinguish us from the typical competitor ♦ Drive growth and high - performing financial results ♦ Enhance our ongoing support of local communities 15 SASR; KBW 2017 Community Bank Investor Conference , August 1 - 2, 2017

SASR; KBW 2017 Community Bank Investor Conference , August 1 - 2, 2017 16 Our CX Journey – The Path to Remarkable
Channel Optimization Strategy ♦ Executing our branch rationalization initiative to improve branch performance, modeling offices to fit evolving client needs, and consolidate, when appropriate ♦ Evaluate expansion in or adjacent to our existing geography ♦ Develop a seamless client experience across multiple delivery channels such as branch, phone, web and mobile ♦ Make key investments in technology that will enable our bankers to better serve our clients as well as enhance our client’s own technology experience 17 SASR; KBW 2017 Community Bank Investor Conference , August 1 - 2, 2017

$0 $1,000,000 $2,000,000 $3,000,000 $4,000,000 $5,000,000 2013 2014 2015 2016 2017 Gross Loans Deposits Assets 18 Average Balance Sheet Growth Growth Rates Loans Deposits Assets 5 Year 2017 11% 12% 6% 11% 6% 12% Balance Sheet Growth Trends - Existing SASR; KBW 2017 Community Bank Investor Conference , August 1 - 2, 2017

Asset Mix - Existing 19 September 30, 2015 Investment Securities ($000) 2016 US Government Agencies & Corporations 79,791 10.9% State and Municipal 305,160 41.5% Mortgage-backed 311,188 42.3% Trust Preferred 1,007 0.1% Equity and Other Securities 37,682 5.1% Total Securities $734,828 100.0% Loans & Leases, 78% Investment Securities, 16% Other Assets, 4% Cash & S - T Investments, 2% June 30, 2017 June 30, 2016 Investment Securities ($000) 2017 US Government Agencies & Corporations 112,362 13.7% State and Municipal 324,933 39.6% Mortgage-backed 332,275 40.4% Trust Preferred 908 0.1% Equity and Other Securities 51,013 6.2% Total Securities $821,491 100.0% Loans & Leases, 77% Investment Securities, 16% Other Assets, 5% Cash & S - T Investments, 2% SASR; KBW 2017 Community Bank Investor Conference , August 1 - 2, 2017

Non - interest, 33% CDs, 17% Money Market, 26% Savings, 8% Int. Checking, 16% Growth Rates Cost of Deposits Valuable Deposit Franchise - Existing 20 Average Deposit Mix – 2nd Qtr 2017 5 Year 2017 Total Deposits 6% 11% Non-interest 12% 15% Interest-bearing 3% 10% 2016 0.24% 1Q 2017 0.26% 2Q 2017 0.31% SASR; KBW 2017 Community Bank Investor Conference , August 1 - 2, 2017

Complementary Loan and Deposit Profiles 21 Res Mtg 26% CRE Occ 19% CRE Inv 25% C&D 8% C&I 11% Cons 11% Loan Portfolio Deposit Mix Total loans: $3.99 billion Average yield (FTE): 4.16% Sandy Spring Non - Int Brg. 31% NOW 17% Savings 9% MMDA 27% Time 16% Total deposits: $3.80 billion (cost = 0.25%) Loan/deposit ratio of 105.1% Sandy Spring Res Mtg 19% CRE Occ 16% CRE Inv 37% C&D 17% C&I 11% Total loans: $1.59 billion Average yield (FTE): 4.76% WashingtonFirst (1) Non - Int Brg. 29% NOW 9% Savings 15% MMDA 13% Time 34% Total deposits: $1.68 billion (cost = 0.64%) Loan/deposit ratio of 95.1% Res Mtg 24% CRE Occ 19% CRE Inv 28% C&D 10% C&I 11% Cons 8% Total loans: $5.59 billion Average yield (FTE): 4.32% Pro Forma (2) Non - Int Brg. 32% NOW 14% Savings 10% MMDA 22% Time 22% Total deposits: $5.48 billion (cost = 0.37 %) Loan/deposit ratio of 102.0% Pro Forma (2) (1) WashingtonFirst’s consumer loans represent less than 1% of the concentration. (2) As of March 31, 2017; excludes impact of fair value adjustments on pro forma loan and deposit mixes. Source: Company filings WashingtonFirst (1) SASR; KBW 2017 Community Bank Investor Conference , August 1 - 2, 2017

Service Charges on Deposits, 16% Gain on Mtg Banking Activity, 6% Wealth Mgmt Fees, 37% Insurance Agency Commissions, 12% Income from BOLI, 5% Bank Card Income, 10% Other, 14% $0 $40,000 $80,000 $120,000 $160,000 $200,000 2012 2013 2014 2015 2016 Net Interest Income Non-interest Income Wealth Management Insurance Agency Bank Card Revenue Breakdown Revenue Composition - Existing $ amounts in thousands. (1) Non - interest Income excludes Investment Gains and other non - operating income . (2) Excludes the impact of sale of wealth related revenues in early 2016 & 2017. Growth Rates (2) 2017 Non - interest Income Detail (1) 22 28% 72% 27% 25% 28% 27% 27% 72% 73% 73% 73% 75% 5 Year 2017 8% 9% 3% 24% 5% 4% SASR; KBW 2017 Community Bank Investor Conference , August 1 - 2, 2017
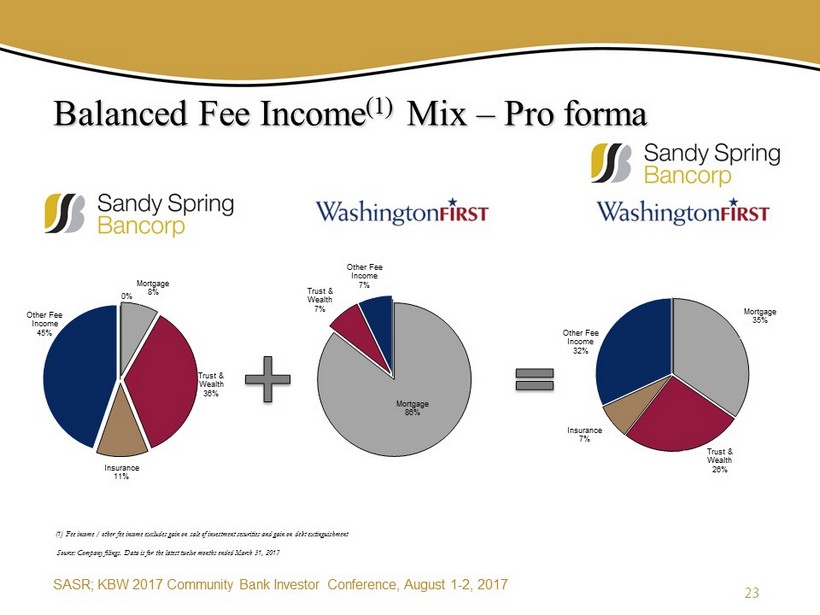
Mortgage 86% Trust & Wealth 7% Other Fee Income 7% Balanced Fee Income (1) Mix – Pro forma 23 Source: Company filings. Data is for the latest twelve months ended March 31, 2017 (1) Fee income / other fee income excludes gain on sale of investment securities and gain on debt extinguishment Mortgage 8% Trust & Wealth 36% Insurance 11% Other Fee Income 45% 0% Mortgage 35% Trust & Wealth 26% Insurance 7% Other Fee Income 32% SASR; KBW 2017 Community Bank Investor Conference , August 1 - 2, 2017

$ amounts in thousands. Historical Financial Trends - Quarterly 24 *3Q15 - 4Q15 litigation expenses, 1Q16 - 2Q16 FHLB redemption penalties, 2Q17 merger expenses. Net Interest Income Provision (credit) for Credit Losses Non-interest Income - Mortgage Gains Non-interest Income - Other Non-interest Income - Non-Recurring Non-interest Expense Non-interest Expense - Non-Recurring* Net Income before Taxes Applicable Income Taxes Net Income EPS - Net Income - Diluted Pre-Tax, Pre-Provision Income Net Interest Margin Efficiency Ratio - Non-GAPP Non-interest Income / Operating Revenue 3Q15 4Q15 1Q16 2Q16 3Q16 4Q16 1Q17 2Q17 $35,116 $35,777 $36,122 $36,732 $37,731 $38,967 $40,253 $42,326 1,706 1,850 1,236 2,957 781 572 194 1,322 566 548 535 1,106 1,129 1,279 608 840 11,824 11,695 11,059 10,295 11,455 11,052 12,024 12,731 - - 1,769 1,350 - 13 - - 29,475 31,382 30,566 29,455 29,326 30,544 29,981 31,881 155 (4,386) 1,751 1,416 - - - 987 16,170 19,174 15,932 15,655 20,208 20,195 22,710 21,707 5,175 6,372 5,119 5,008 6,734 6,879 7,598 6,966 $10,995 $12,802 $10,813 $10,647 $13,474 $13,316 $15,112 $14,741 0.45$ 0.52$ 0.45$ 0.44$ 0.56$ 0.55$ 0.63$ 0.61$ 18,031 16,638 17,168 18,612 20,989 20,767 22,904 24,016 3.43% 3.45% 3.44% 3.51% 3.50% 3.52% 3.51% 3.60% 59.73% 63.08% 61.84% 59.12% 56.33% 57.54% 54.78% 54.10% 26.08% 25.50% 27.00% 25.77% 25.01% 24.06% 23.89% 24.28% SASR; KBW 2017 Community Bank Investor Conference , August 1 - 2, 2017
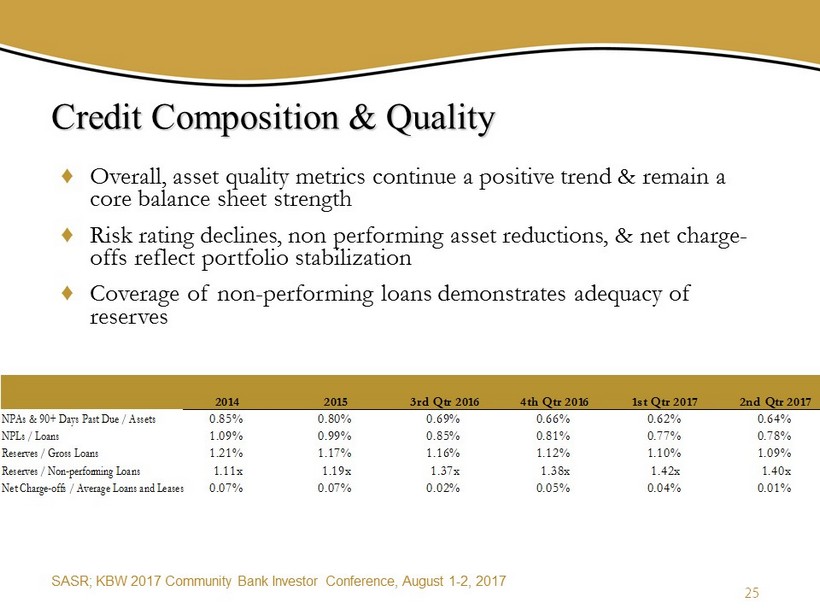
♦ Overall, asset quality metrics continue a positive trend & remain a core balance sheet strength ♦ Risk rating declines, non performing asset reductions, & net charge - offs reflect portfolio stabilization ♦ Coverage of non - performing loans demonstrates adequacy of reserves Credit Composition & Quality 25 NPAs & 90+ Days Past Due / Assets NPLs / Loans Reserves / Gross Loans Reserves / Non-performing Loans Net Charge-offs / Average Loans and Leases 2014 2015 3rd Qtr 2016 4th Qtr 2016 1st Qtr 2017 2nd Qtr 2017 0.85% 0.80% 0.69% 0.66% 0.62% 0.64% 1.09% 0.99% 0.85% 0.81% 0.77% 0.78% 1.21% 1.17% 1.16% 1.12% 1.10% 1.09% 1.11x 1.19x 1.37x 1.38x 1.42x 1.40x 0.07% 0.07% 0.02% 0.05% 0.04% 0.01% SASR; KBW 2017 Community Bank Investor Conference , August 1 - 2, 2017

$ amounts in thousands. (1) Non - performing assets includes 90+ Days Past Dues and accruing restructured loans. Credit Composition & Quality NPA Quarterly Trend (1) 26 Consumer Loans Consumer Loans Residential Mortgages Construction Lot Permanent Total Mortgage Loans Commercial Loans Owner Occupied R/E Investment R/E AD&C Business Loans & Lines Lease Receivables Total Commercial Loans Other Real Estate Owned Restructured Loans Other Foreclosed Assets Total Non-performing Assets NPAs / Total Assets 2013 2014 2015 2016 3Q16 4Q16 1Q17 2Q17 % of Total NPAs 2,260 1,668 2,193 2,860 2,726 2,860 3,058 3,115 9.3% 2,315 1,105 418 195 199 195 189 187 0.6% 1,713 463 803 814 760 814 736 724 2.2% 4,022 2,549 8,019 6,675 6,561 6,675 6,404 6,377 18.9% 8,050 4,117 9,240 7,684 7,520 7,684 7,329 7,288 21.7% 5,936 8,941 6,340 4,823 5,591 4,823 5,106 5,350 15.9% 6,802 8,156 8,368 8,107 9,189 8,107 7,970 6,934 20.6% 4,127 2,464 194 137 137 137 137 137 0.4% 3,400 3,184 3,696 5,833 4,303 5,833 4,849 6,807 20.2% 0 0 0 0 0 0 0 0 0.0% 20,265 22,745 18,598 18,900 19,220 18,900 18,062 19,228 57.1% 1,338 3,195 2,742 1,911 1,274 1,911 1,294 1,460 4.3% 9,459 5,497 4,467 2,489 2,512 2,489 2,409 2,569 7.6% 0 0 0 0 0 0 0 0 0.0% 41,372 37,222 37,240 33,844 33,252 33,844 32,152 33,660 100.0% 1.01% 0.85% 0.80% 0.66% 0.69% 0.66% 0.62% 0.64% SASR; KBW 2017 Community Bank Investor Conference , August 1 - 2, 2017

27 Interest Rate Risk Profile $ amounts in thousands. SASR; KBW 2017 Community Bank Investor Conference , August 1 - 2, 2017

♦ Capital deployment efforts continue through strong organic growth, dividend payout and share repurchases ♦ Dividend payout ratio at 54% ♦ During 2016, 517,629 shares repurchased at average price of $25.91 ♦ M&A efforts are ongoing for both bank and non - bank companies Capital Adequacy 28 0.00% 6.00% 12.00% 18.00% 2013 2014 2015 2016 2017 Tang. Common Equity /Tang. Assets 10.37% 10.15% 9.66% 9.07% 9.06% Tier 1 Risk-Based Capital 14.42% 13.95% 13.13% 11.74% 10.96% Total Risk-Based Capital 15.65% 15.06% 14.25% 12.80% 12.00% SASR; KBW 2017 Community Bank Investor Conference , August 1 - 2, 2017

♦ Average loan growth 12% over 2016 - Linked quarter average growth 2% ♦ Average Non - Interest Bearing deposit growth 15% over 2016 - 34% of total average deposits for 2 nd quarter 2017 ♦ Non - Performing Assets to Assets at .64% at June 30, 2017 - .69% at March 31, 2016 ♦ Investment portfolio at 16% of assets at June 30, 2017 - 16% at June 30, 2016 ♦ Net Interest Margin steady at 3.60% - Loans at 78 % of assets as of June 30 , 2017 ♦ Non - Interest Income – Fee based revenues continue to grow - Wealth, Insurance & Mortgage 4%, 24% & 3 % respectively over 2016 Current Financial Performance 29 SASR; KBW 2017 Community Bank Investor Conference , August 1 - 2, 2017

30 Investment Thesis for Pro forma Sandy Spring ♦ Coupling of Sandy Spring’s stand - alone momentum with WashingtonFirst to further enhance earnings trajectory and shareholder value » Follow up to stand - alone SASR strong Q1 ‘17 with WashingtonFirst franchise that has driven strong asset, fee - income and earnings growth over the last five years. » Enhances franchise scale and service line in Washington, DC metro and Northern Virginia markets among institutions with similar focus on the client experience. » Significant boost to earnings per share with a desirable internal rate of return and manageable tangible book value dilution earn back. » Increases future expansion opportunities in attractive markets. SASR; KBW 2017 Community Bank Investor Conference , August 1 - 2, 2017

Q&A 31 SASR; KBW 2017 Community Bank Investor Conference , August 1 - 2, 2017

Page Reference ♦ Selected Financial Data 33 to 34 ♦ Lines of Business 35 to 37 ♦ Management Team 38 to 38 ♦ Non - GAAP Financial Measures 39 to 43 Addendum 32 SASR; KBW 2017 Community Bank Investor Conference , August 1 - 2, 2017
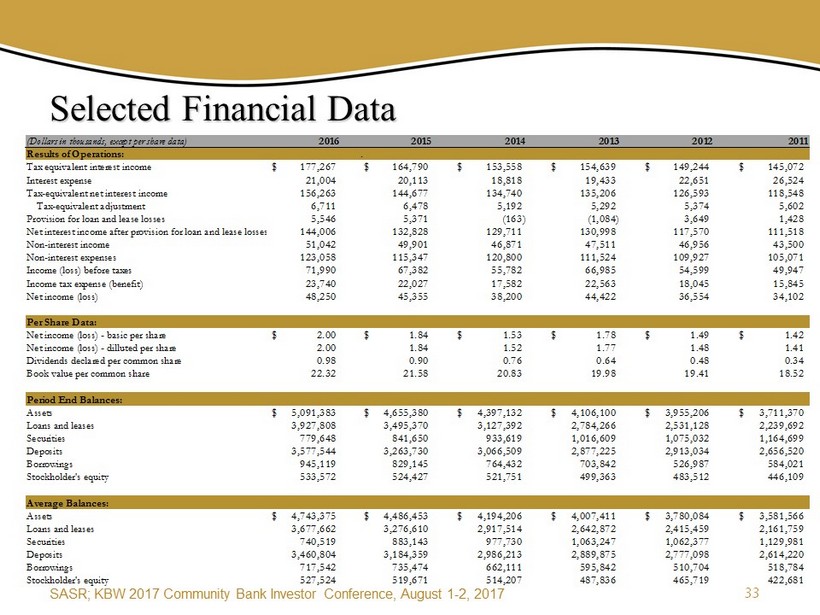
(Dollars in thousands, except per share data) Results of Operations: Tax equivalent interest income Interest expense Tax-equivalent net interest income Tax-equivalent adjustment Provision for loan and lease losses Net interest income after provision for loan and lease losses Non-interest income Non-interest expenses Income (loss) before taxes Income tax expense (benefit) Net income (loss) Per Share Data: Net income (loss) - basic per share Net income (loss) - dilluted per share Dividends declared per common share Book value per common share Period End Balances: Assets Loans and leases Securities Deposits Borrowings Stockholder's equity Average Balances: Assets Loans and leases Securities Deposits Borrowings Stockholder's equity Selected Financial Data 33 2016 2015 2014 2013 2012 2011 . 177,267$ 164,790$ 153,558$ 154,639$ 149,244$ 145,072$ 21,004 20,113 18,818 19,433 22,651 26,524 156,263 144,677 134,740 135,206 126,593 118,548 6,711 6,478 5,192 5,292 5,374 5,602 5,546 5,371 (163) (1,084) 3,649 1,428 144,006 132,828 129,711 130,998 117,570 111,518 51,042 49,901 46,871 47,511 46,956 43,500 123,058 115,347 120,800 111,524 109,927 105,071 71,990 67,382 55,782 66,985 54,599 49,947 23,740 22,027 17,582 22,563 18,045 15,845 48,250 45,355 38,200 44,422 36,554 34,102 2.00$ 1.84$ 1.53$ 1.78$ 1.49$ 1.42$ 2.00 1.84 1.52 1.77 1.48 1.41 0.98 0.90 0.76 0.64 0.48 0.34 22.32 21.58 20.83 19.98 19.41 18.52 5,091,383$ 4,655,380$ 4,397,132$ 4,106,100$ 3,955,206$ 3,711,370$ 3,927,808 3,495,370 3,127,392 2,784,266 2,531,128 2,239,692 779,648 841,650 933,619 1,016,609 1,075,032 1,164,699 3,577,544 3,263,730 3,066,509 2,877,225 2,913,034 2,656,520 945,119 829,145 764,432 703,842 526,987 584,021 533,572 524,427 521,751 499,363 483,512 446,109 4,743,375$ 4,486,453$ 4,194,206$ 4,007,411$ 3,780,084$ 3,581,566$ 3,677,662 3,276,610 2,917,514 2,642,872 2,415,459 2,161,759 740,519 883,143 977,730 1,063,247 1,062,377 1,129,981 3,460,804 3,184,359 2,986,213 2,889,875 2,777,098 2,614,220 717,542 735,474 662,111 595,842 510,704 518,784 527,524 519,671 514,207 487,836 465,719 422,681 SASR; KBW 2017 Community Bank Investor Conference , August 1 - 2, 2017

Selected Financial Data 34 (Dollars in thousands, except per share data) 2016 2015 2014 2013 2012 Results of Operations: Return on average assets 1.02 % 1.01 % 0.91 % 1.11 % 0.97 % Return on average common equity 9.15 8.73 7.43 9.11 7.85 Yield on average interest-earning assets 3.96 3.91 3.93 4.15 4.24 Rate on average interest-bearing liabilities 0.68 0.70 0.69 0.74 0.89 Net interest spread 3.28 3.21 3.24 3.41 3.35 Net interest margin 3.49 3.44 3.45 3.63 3.60 Efficiency Ratio - GAAP 61.35 61.32 68.47 62.86 65.36 Efficiency Ratio - Non-GAAP 58.66 61.09 62.48 60.06 60.94 Capital Ratios: Tier 1 leverage 10.14 % 10.60 % 11.26 % 11.32 % 10.98 % Tier 1 capital to risk-weighted assets 11.74 13.13 13.95 14.42 14.15 Total regulatory capital to risk-weighted assets 12.80 14.25 15.06 15.65 15.40 Tangible common equity to tangible assets - Non-GAAP 9.07 9.66 10.15 10.37 9.94 Average equity to average assets 11.12 11.58 12.26 12.17 12.32 Credit Quality Ratios: Allowance for loan losses to loans and leases 1.12 % 1.17 % 1.21 % 1.39 % 1.70 % Non-performing loans to total loans 0.81 0.99 1.09 1.44 2.29 Non-performing assets to total assets 0.66 0.80 0.85 1.01 1.61 Net charge-offs to average loans and leases 0.06 0.07 0.03 0.12 0.42 SASR; KBW 2017 Community Bank Investor Conference , August 1 - 2, 2017

Lines of Business Sandy Spring Trust Provides clients with investment management through internally - researched custom portfolios, as well as a comprehensive array of traditional fiduciary and trust services. Business development occurs through the efforts of our Wealth Management Consultant, as well as the sales efforts of administrative officers and portfolio managers. Recruitment of high - profile trust administrators with a strong client following has also played a key role in the growth of assets under this division’s management. West Financial Services This wealth management firm, acquired in 2005 and headquartered in McLean, Virginia, focuses on financial planning, asset management and business consulting services. For over 25 years, WFS has provided these services to a targeted client segment of high net worth individuals and the medical community. The firm and its principals are regularly recognized in the financial and medical publications as top advisors nationwide. Wealth Management 35 SASR; KBW 2017 Community Bank Investor Conference , August 1 - 2, 2017
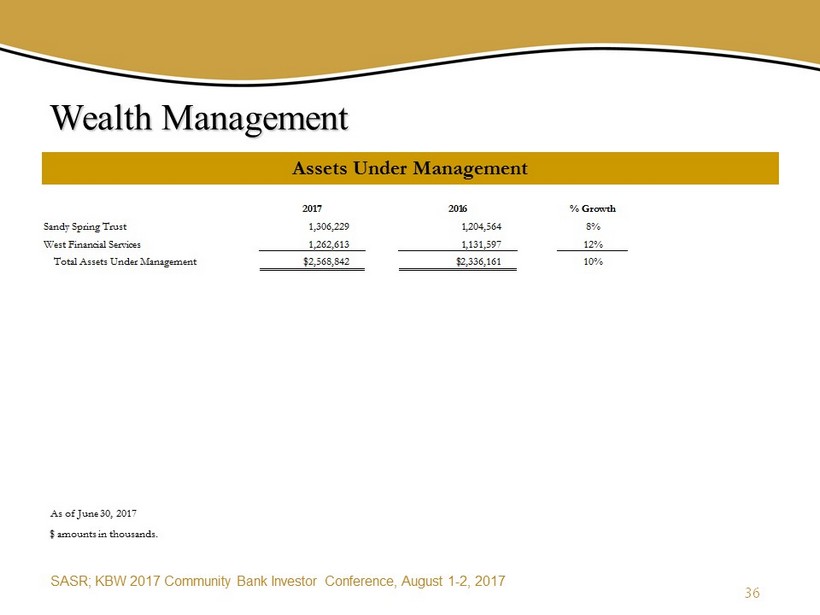
Wealth Management $ amounts in thousands. Assets Under Management 36 2017 Sandy Spring Trust 1,306,229 West Financial Services 1,262,613 Total Assets Under Management $2,568,842 2016 1,204,564 1,131,597 $2,336,161 % Growth 8% 12% 10% As of June 30, 2017 SASR; KBW 2017 Community Bank Investor Conference , August 1 - 2, 2017

Insurance Agency Insurance Revenue Mix - 2017 YTD 37 Commercial Lines, 36.66% Physicians Liability, 23.09% Personal Lines, 19.56% Bonds, 10.65% Contingent Income, 7.87% Group Benefits & Other, 2.17% SASR; KBW 2017 Community Bank Investor Conference , August 1 - 2, 2017
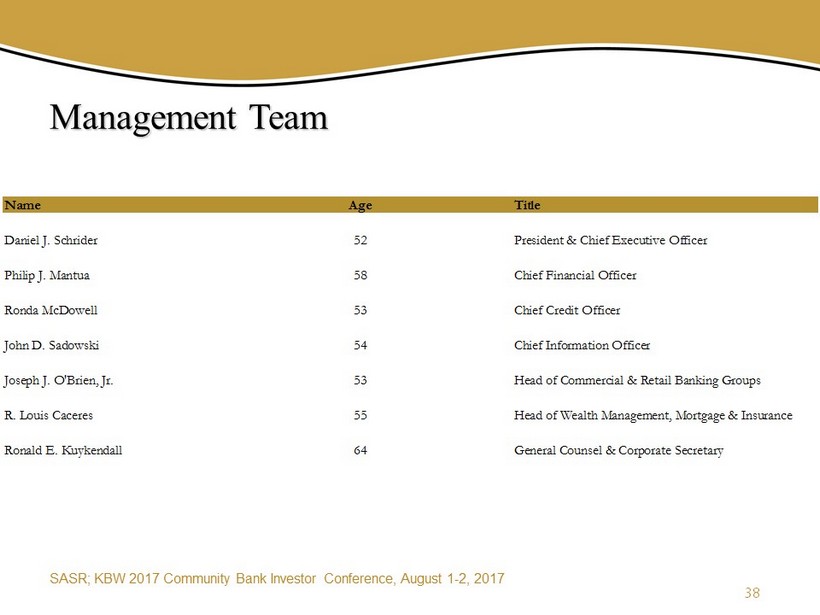
Management Team 38 Name Age Title Daniel J. Schrider 52 President & Chief Executive Officer Philip J. Mantua 58 Chief Financial Officer Ronda McDowell 53 Chief Credit Officer John D. Sadowski 54 Chief Information Officer Joseph J. O'Brien, Jr. 53 Head of Commercial & Retail Banking Groups R. Louis Caceres 55 Head of Wealth Management, Mortgage & Insurance Ronald E. Kuykendall 64 General Counsel & Corporate Secretary SASR; KBW 2017 Community Bank Investor Conference , August 1 - 2, 2017

Non - GAAP Financial Measures The Company has for many years used a traditional efficiency ratio that is a non - GAAP financial measure of operating expense control and efficiency of operations. Management believes that its traditional ratio better focuses attention on the operating performance of the Company over time than does a GAAP ratio, and is highly useful in comparing period - to - period operating performance of the Company’s core business operations. It is used by management as part of its assessment of its performance in managing non - interest expenses. However, this measure is supplemental, and is not a substitute for an analysis of performance based on GAAP measures. The reader is cautioned that the non - GAAP efficiency ratio used by the Company may not be comparable to GAAP or non - GAAP efficiency ratios reported by other financial institutions. In general, the efficiency ratio is non - interest expenses as a percentage of net interest income plus non - interest income. Non - interest expenses used in the calculation of the non - GAAP efficiency ratio exclude goodwill impairment losses, the amortization of intangibles, and non - recurring expenses. Income for the non - GAAP ratio includes the favorable effect of tax - exempt income and excludes securities gains and losses, which vary widely from period to period without appreciably affecting operating expenses, and non - recurring gains. The measure is different from the GAAP efficiency ratio, which also is presented on slides 40 and 41. The GAAP measure is calculated using non - interest expense and income amounts as shown on the face of the Consolidated Statements of Income in audited financial statements. The GAAP and non - GAAP efficiency ratios are reconciled on slides 40 and 41. Tangible common equity and tangible assets are non - GAAP financial measures calculated using GAAP amounts. The Company calculates tangible common equity by excluding the balance of preferred stock, goodwill and other intangible assets from its calculation of stockholders’ equity. The Company calculates tangible assets by excluding the balance of goodwill an d other intangible assets from its calculation of total assets. Management believes that this non - GAAP financial measure provides information to investors that is useful in understanding the Company’s financial condition. Because not all companies use the same calculation of tangible common equity and tangible assets, this presentation may not be comparable to other similarly titled measures calculated by other companies. A reconciliation of the non - GAAP ratio of tangible common equity to tangible assets is provided on slides 42 and 43. 39 SASR; KBW 2017 Community Bank Investor Conference , August 1 - 2, 2017
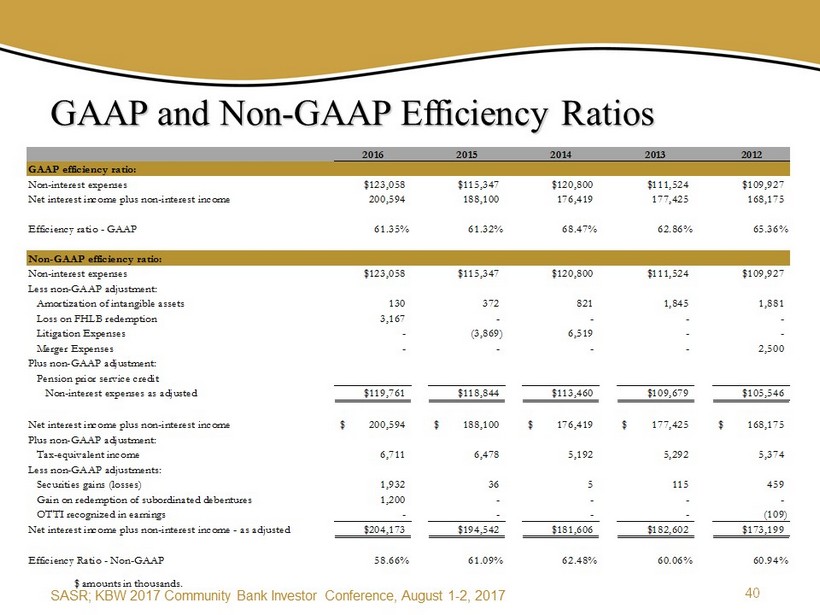
GAAP and Non - GAAP Efficiency Ratios $ amounts in thousands. 40 2016 2015 2014 2013 2012 GAAP efficiency ratio: Non-interest expenses $123,058 $115,347 $120,800 $111,524 $109,927 Net interest income plus non-interest income 200,594 188,100 176,419 177,425 168,175 Efficiency ratio - GAAP 61.35% 61.32% 68.47% 62.86% 65.36% Non-GAAP efficiency ratio: Non-interest expenses $123,058 $115,347 $120,800 $111,524 $109,927 Less non-GAAP adjustment: Amortization of intangible assets 130 372 821 1,845 1,881 Loss on FHLB redemption 3,167 - - - - Litigation Expenses - (3,869) 6,519 - - Merger Expenses - - - - 2,500 Plus non-GAAP adjustment: Pension prior service credit Non-interest expenses as adjusted $119,761 $118,844 $113,460 $109,679 $105,546 Net interest income plus non-interest income 200,594$ 188,100$ 176,419$ 177,425$ 168,175$ Plus non-GAAP adjustment: Tax-equivalent income 6,711 6,478 5,192 5,292 5,374 Less non-GAAP adjustments: Securities gains (losses) 1,932 36 5 115 459 Gain on redemption of subordinated debentures 1,200 - - - - OTTI recognized in earnings - - - - (109) Net interest income plus non-interest income - as adjusted $204,173 $194,542 $181,606 $182,602 $173,199 Efficiency Ratio - Non-GAAP 58.66% 61.09% 62.48% 60.06% 60.94% SASR; KBW 2017 Community Bank Investor Conference , August 1 - 2, 2017
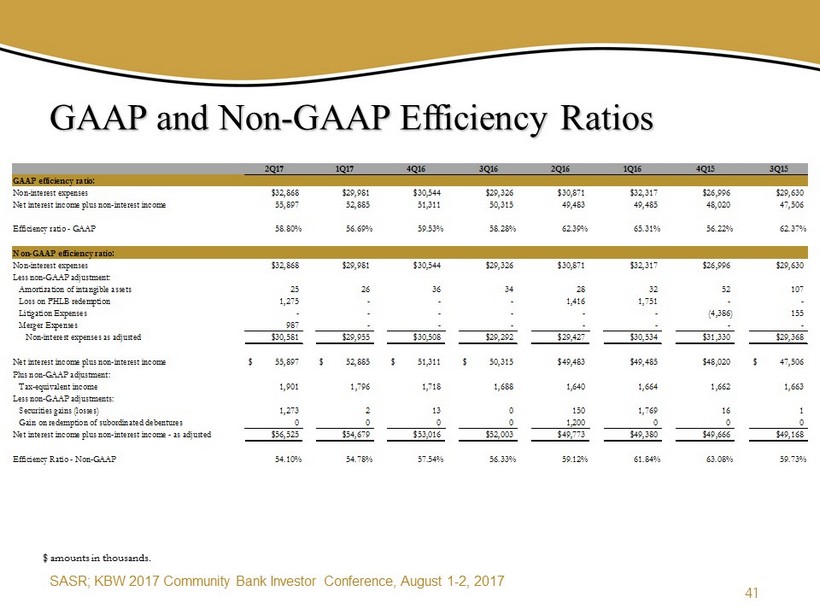
GAAP and Non - GAAP Efficiency Ratios $ amounts in thousands. 41 2Q17 1Q17 4Q16 3Q16 2Q16 1Q16 4Q15 3Q15 GAAP efficiency ratio: Non-interest expenses $32,868 $29,981 $30,544 $29,326 $30,871 $32,317 $26,996 $29,630 Net interest income plus non-interest income 55,897 52,885 51,311 50,315 49,483 49,485 48,020 47,506 Efficiency ratio - GAAP 58.80% 56.69% 59.53% 58.28% 62.39% 65.31% 56.22% 62.37% Non-GAAP efficiency ratio: Non-interest expenses $32,868 $29,981 $30,544 $29,326 $30,871 $32,317 $26,996 $29,630 Less non-GAAP adjustment: Amortization of intangible assets 25 26 36 34 28 32 52 107 Loss on FHLB redemption 1,275 - - - 1,416 1,751 - - Litigation Expenses - - - - - - (4,386) 155 Merger Expenses 987 - - - - - - - Non-interest expenses as adjusted $30,581 $29,955 $30,508 $29,292 $29,427 $30,534 $31,330 $29,368 Net interest income plus non-interest income 55,897$ 52,885$ 51,311$ 50,315$ $49,483 $49,485 $48,020 47,506$ Plus non-GAAP adjustment: Tax-equivalent income 1,901 1,796 1,718 1,688 1,640 1,664 1,662 1,663 Less non-GAAP adjustments: Securities gains (losses) 1,273 2 13 0 150 1,769 16 1 Gain on redemption of subordinated debentures 0 0 0 0 1,200 0 0 0 Net interest income plus non-interest income - as adjusted $56,525 $54,679 $53,016 $52,003 $49,773 $49,380 $49,666 $49,168 Efficiency Ratio - Non-GAAP 54.10% 54.78% 57.54% 56.33% 59.12% 61.84% 63.08% 59.73% SASR; KBW 2017 Community Bank Investor Conference , August 1 - 2, 2017
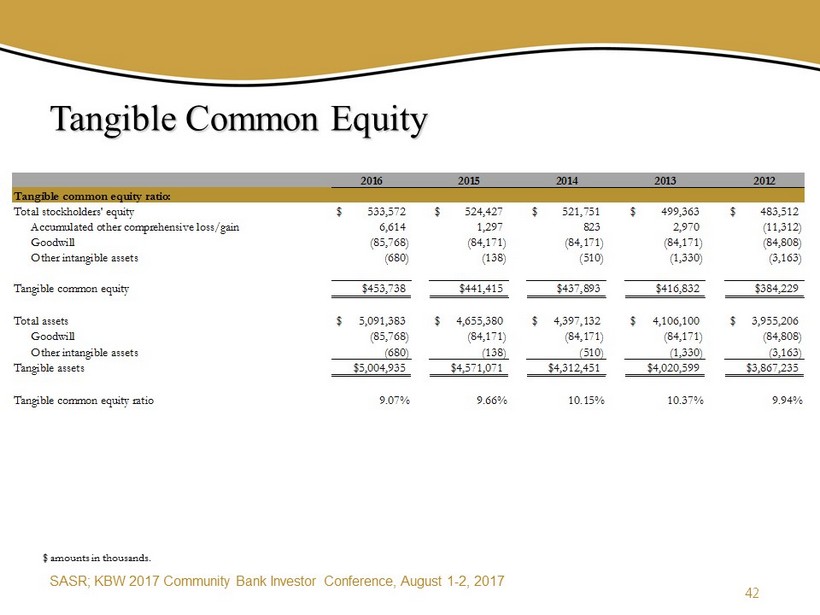
Tangible Common Equity $ amounts in thousands. 42 2016 2015 2014 2013 2012 Tangible common equity ratio: Total stockholders' equity 533,572$ 524,427$ 521,751$ 499,363$ 483,512$ Accumulated other comprehensive loss/gain 6,614 1,297 823 2,970 (11,312) Goodwill (85,768) (84,171) (84,171) (84,171) (84,808) Other intangible assets (680) (138) (510) (1,330) (3,163) Tangible common equity $453,738 $441,415 $437,893 $416,832 $384,229 Total assets 5,091,383$ 4,655,380$ 4,397,132$ 4,106,100$ 3,955,206$ Goodwill (85,768) (84,171) (84,171) (84,171) (84,808) Other intangible assets (680) (138) (510) (1,330) (3,163) Tangible assets $5,004,935 $4,571,071 $4,312,451 $4,020,599 $3,867,235 Tangible common equity ratio 9.07% 9.66% 10.15% 10.37% 9.94% SASR; KBW 2017 Community Bank Investor Conference , August 1 - 2, 2017
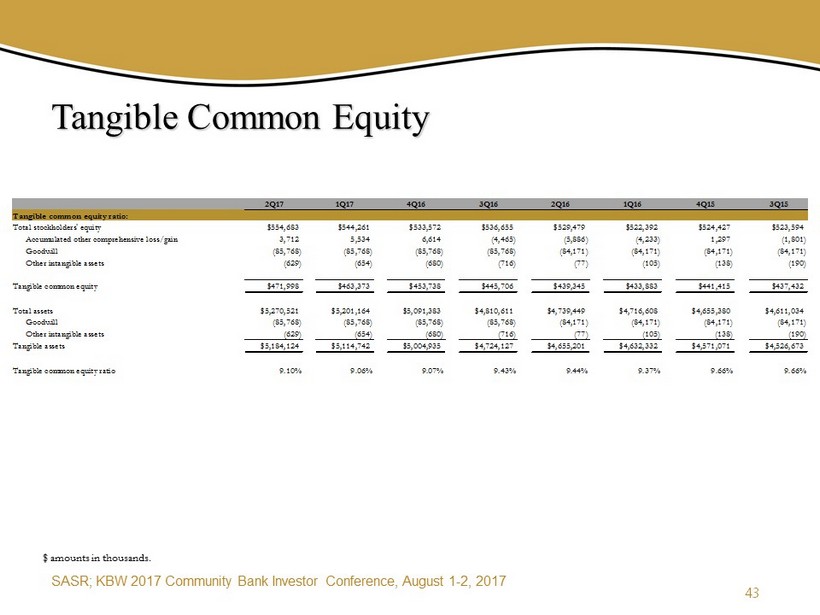
Tangible Common Equity $ amounts in thousands. 43 2Q17 1Q17 4Q16 3Q16 2Q16 1Q16 4Q15 3Q15 Tangible common equity ratio: Total stockholders' equity $554,683 $544,261 $533,572 $536,655 $529,479 $522,392 $524,427 $523,594 Accumulated other comprehensive loss/gain 3,712 5,534 6,614 (4,465) (5,886) (4,233) 1,297 (1,801) Goodwill (85,768) (85,768) (85,768) (85,768) (84,171) (84,171) (84,171) (84,171) Other intangible assets (629) (654) (680) (716) (77) (105) (138) (190) Tangible common equity $471,998 $463,373 $453,738 $445,706 $439,345 $433,883 $441,415 $437,432 Total assets $5,270,521 $5,201,164 $5,091,383 $4,810,611 $4,739,449 $4,716,608 $4,655,380 $4,611,034 Goodwill (85,768) (85,768) (85,768) (85,768) (84,171) (84,171) (84,171) (84,171) Other intangible assets (629) (654) (680) (716) (77) (105) (138) (190) Tangible assets $5,184,124 $5,114,742 $5,004,935 $4,724,127 $4,655,201 $4,632,332 $4,571,071 $4,526,673 Tangible common equity ratio 9.10% 9.06% 9.07% 9.43% 9.44% 9.37% 9.66% 9.66% SASR; KBW 2017 Community Bank Investor Conference , August 1 - 2, 2017