Attached files
| file | filename |
|---|---|
| EX-99.1 - EXHIBIT 99.1 - PACIFIC PREMIER BANCORP INC | ex_991-prxipxkbwxconfx2017.htm |
| 8-K - 8-K - PACIFIC PREMIER BANCORP INC | a8k_ppbixip-2017xq2kbwconf.htm |
Investor Presentation
Second Quarter 2017
Steve Gardner
Chairman, President & Chief Executive Officer
sgardner@ppbi.com - 949-864-8000
Exhibit 99.2

2
Forward-Looking Statements
The statements contained in this presentation that are not historical facts are forward-looking statements based on management’s
current expectations and beliefs concerning future developments and their potential effects on Pacific Premier Bancorp, Inc. (the
“Company”) including, without limitation, plans, strategies and goals, and statements about the Company’s expectations regarding
revenue and asset growth, financial performance, loan and deposit growth, yields and returns, shareholder value creation and the
impact of acquisitions. Such statements involve inherent risks and uncertainties, many of which are difficult to predict and are
generally beyond the control of the Company. There can be no assurance that future developments affecting the Company will be the
same as those anticipated by management. The Company cautions readers that a number of important factors could cause actual
results to differ materially from those expressed in, or implied or projected by, such forward-looking statements. These risks and
uncertainties include, but are not limited to, the following: the strength of the United States economy in general and the strength of
the local economies in which the Company conducts operations; the effects of, and changes in, trade, monetary and fiscal policies and
laws, including interest rate policies of the Board of Governors of the Federal Reserve System; inflation, interest rate, market and
monetary fluctuations; the timely development of competitive new products and services and the acceptance of these products and
services by new and existing customers; the willingness of users to substitute competitors’ products and services for the Company’s
products and services; the impact of changes in financial services policies, laws and regulations (including the Dodd-Frank Wall Street
Reform and Consumer Protection Act) and of governmental efforts to restructure the U.S. financial regulatory system; technological
changes; the effect of acquisitions that the Company may make, if any, including, without limitation, the failure to achieve the
expected revenue growth and/or expense savings from its acquisitions; changes in the level of the Company’s nonperforming assets
and charge-offs; any oversupply of inventory and deterioration in values of California real estate, both residential and commercial; the
effect of changes in accounting policies and practices, as may be adopted from time-to-time by bank regulatory agencies, the Securities
and Exchange Commission (“SEC”), the Public Company Accounting Oversight Board, the Financial Accounting Standards Board or
other accounting standards setters; possible other-than-temporary impairment of securities held by us; changes in consumer spending,
borrowing and savings habits; the effects of the Company’s lack of a diversified loan portfolio, including the risks of geographic and
industry concentrations; ability to attract deposits and other sources of liquidity; changes in the financial performance and/or
condition of our borrowers; changes in the competitive environment among financial and bank holding companies and other financial
service providers; unanticipated regulatory or judicial proceedings; and the Company’s ability to manage the risks involved in the
foregoing. Additional factors that could cause actual results to differ materially from those expressed in the forward-looking
statements are discussed in the 2016 Annual Report on Form 10-K of Pacific Premier Bancorp, Inc. filed with the SEC and available at
the SEC’s Internet site (http://www.sec.gov).
The Company specifically disclaims any obligation to update any factors or to publicly announce the result of revisions to any of the
forward-looking statements included herein to reflect future events or developments.
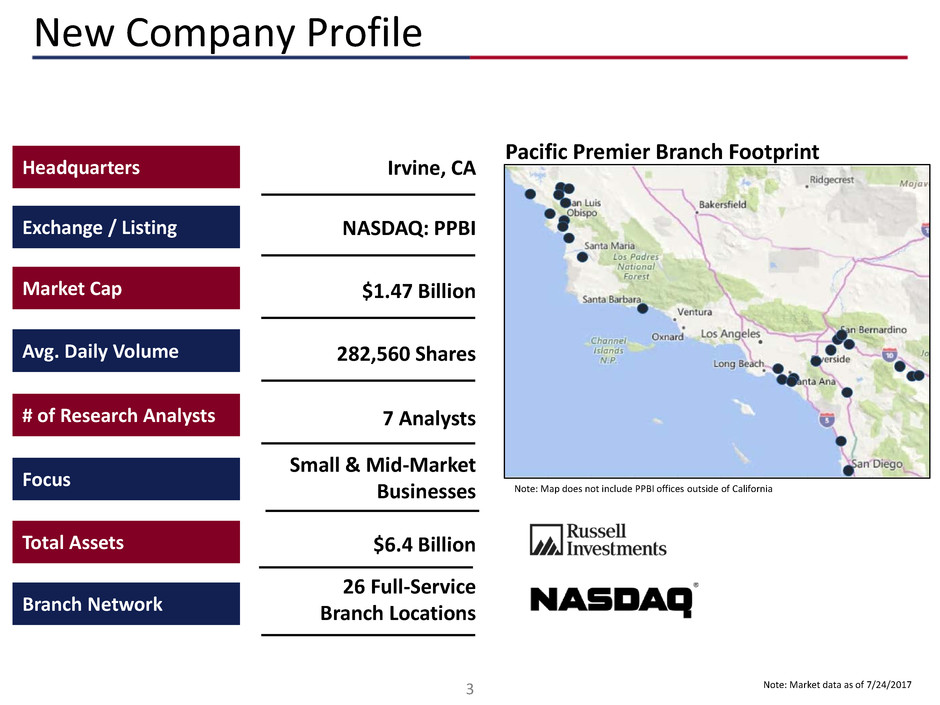
3
26 Full-Service
Branch Locations
New Company Profile
Exchange / Listing NASDAQ: PPBI
Focus
Small & Mid-Market
Businesses
Total Assets $6.4 Billion
Branch Network
Note: Market data as of 7/24/2017
Pacific Premier Branch Footprint
Headquarters Irvine, CA
# of Research Analysts 7 Analysts
Market Cap $1.47 Billion
Avg. Daily Volume 282,560 Shares
Note: Map does not include PPBI offices outside of California

4
Strategic Transformation
2008 - 2012
Organic growth driven by dynamic sales culture
Geographic expansion through highly accretive FDIC-assisted acquisitions
Canyon National Bank (CNB) - $192 million in assets, closed on 2/11/2011 (FDIC-Assisted)
Palm Desert National Bank (PDNB) - $103 million in assets, closed on 4/27/2012 (FDIC-Assisted)
2017 and Beyond
Focus on producing EPS growth from scale, efficiency, balance sheet leverage
Target ROAA and ROATCE of 1.25% and 15%, respectively
Continue disciplined organic and acquisitive growth increasing scarcity value
2013 - 2017
Build out of commercial banking platform through acquisitions
First Associations Bank (FAB) - $424 million in assets, closed on 3/15/2013 (151 days)
San Diego Trust Bank (SDTB) - $211 million in assets, closed on 6/25/2013 (111 days)
Infinity Franchise Holdings (IFH) - $80 million in assets, closed on 1/30/2014 (73 days)
Independence Bank (IDPK) - $422 million in assets, closed on 1/26/2015 (96 days)
Security California Bancorp (SCAF) - $715 million in assets, closed 1/31/2016 (123 days)
Heritage Oaks Bancorp (HEOP) – $2 billion in assets, closed on 4/1/2017 (109 days)
A balance of organic and acquisitive growth to create a California centric commercial
bank franchise with $6.4 billion in assets

5
History of PPBI
• Total deposits compound annual growth rate of 38% since 2011
• Total loans compound annual growth rate of 41% since 2011
Total Assets – Acquired vs. Non-Acquired
February 2011
Acquired Canyon
National Bank
($192MM assets) in
FDIC-assisted deal
$961 $1,174
$1,714
$2,039
$2,791
$3,563 $3,599
$3,755
$4,040 $4,174
$6,440
$8.00
$10.50
$13.00
$15.50
$-
$1,000
$2,000
$3,000
$4,000
$5,000
$6,000
2011 2012 2013 2014 2015 1Q'16 2Q'16 3Q'16 4Q'16 1Q'17 2Q'17
Non-Acquired Acquired TBV/Share
April 2012
Acquired Palm
Desert National
Bank ($103MM
assets) in FDIC-
assisted deal
March 2013 and June 2013
Acquired First Associations
Bank ($424MM assets) and
San Diego Trust Bank
($211MM assets)
January 2014
Acquired Infinity
Franchise Holdings
($80MM assets), a
specialty finance
company
January 2015
Acquired
Independence
Bank ($422MM
assets)
January 2016
Acquired SCAF
($715MM assets)
Timely and efficient acquisitions have accelerated PPBI’s growth and performance
Total Assets TBV/ShareAs of April 1, 2017
Acquired HEOP
($2.0B assets)
Note: All dollars in millions
6
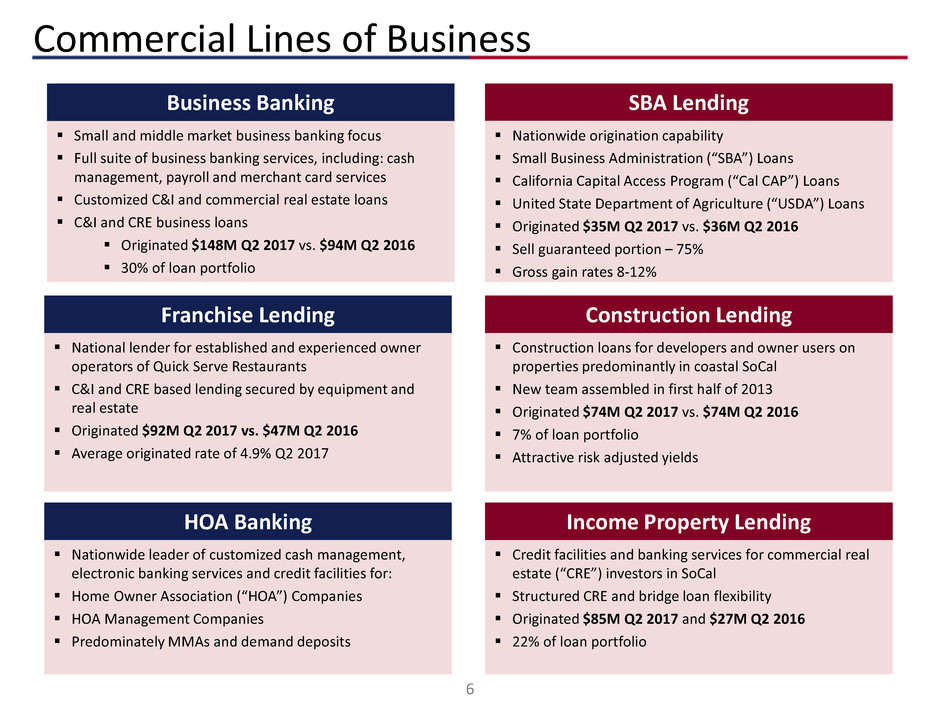
Small and middle market business banking focus
Full suite of business banking services, including: cash
management, payroll and merchant card services
Customized C&I and commercial real estate loans
C&I and CRE business loans
Originated $148M Q2 2017 vs. $94M Q2 2016
30% of loan portfolio
Commercial Lines of Business
Business Banking SBA Lending
Franchise Lending
Income Property Lending
Nationwide origination capability
Small Business Administration (“SBA”) Loans
California Capital Access Program (“Cal CAP”) Loans
United State Department of Agriculture (“USDA”) Loans
Originated $35M Q2 2017 vs. $36M Q2 2016
Sell guaranteed portion – 75%
Gross gain rates 8-12%
National lender for established and experienced owner
operators of Quick Serve Restaurants
C&I and CRE based lending secured by equipment and
real estate
Originated $92M Q2 2017 vs. $47M Q2 2016
Average originated rate of 4.9% Q2 2017
Credit facilities and banking services for commercial real
estate (“CRE”) investors in SoCal
Structured CRE and bridge loan flexibility
Originated $85M Q2 2017 and $27M Q2 2016
22% of loan portfolio
Construction Lending
Construction loans for developers and owner users on
properties predominantly in coastal SoCal
New team assembled in first half of 2013
Originated $74M Q2 2017 vs. $74M Q2 2016
7% of loan portfolio
Attractive risk adjusted yields
HOA Banking
Nationwide leader of customized cash management,
electronic banking services and credit facilities for:
Home Owner Association (“HOA”) Companies
HOA Management Companies
Predominately MMAs and demand deposits

7
Increasing Loan Volumes & Attractive Yields
$251
$299
$322
$385
$455
$492
4.97% 4.93%
4.87%
4.80%
4.88%
4.99%
3.00%
3.50%
4.00%
4.50%
5.00%
-
100
200
300
400
500
600
1Q'16 2Q'16 3Q'16 4Q'16 1Q'17 2Q'17
Business Loans Real Estate Loans Other Loans Weighted Average Coupon
Note: All dollars in millions
8
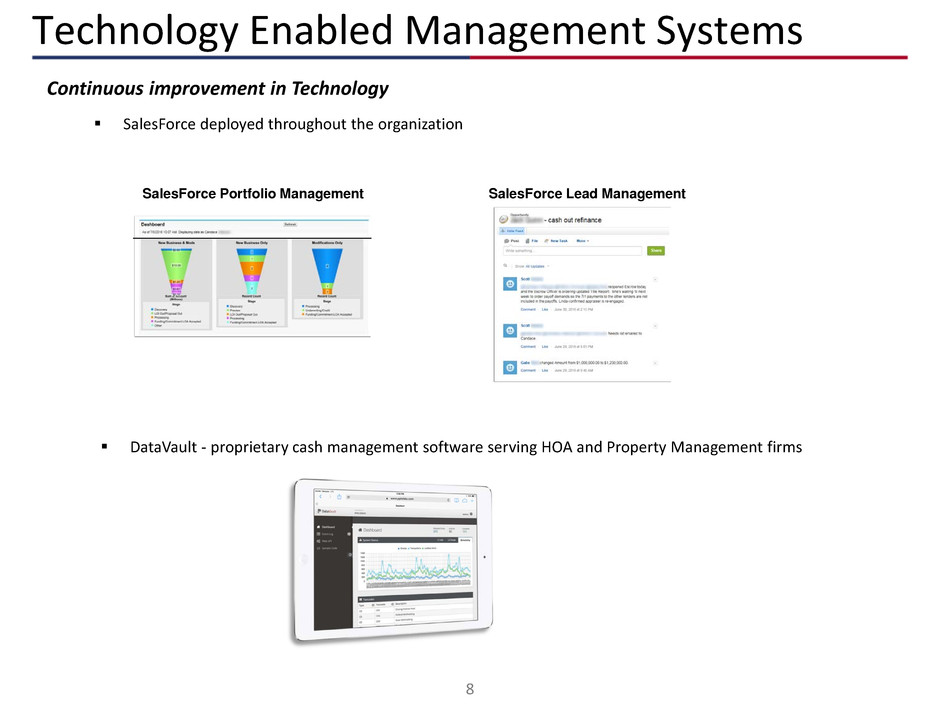
Technology Enabled Management Systems
Continuous improvement in Technology
SalesForce deployed throughout the organization
SalesForce Lead ManagementSalesForce Portfolio Management
DataVault - proprietary cash management software serving HOA and Property Management firms
9
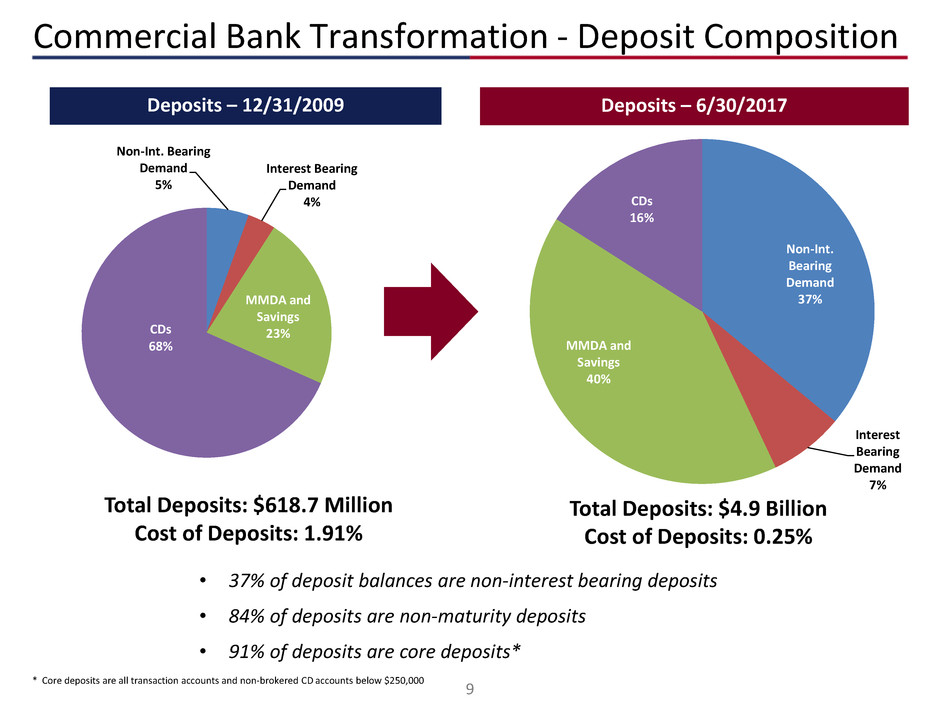
Commercial Bank Transformation - Deposit Composition
Deposits – 12/31/2009 Deposits – 6/30/2017
Total Deposits: $618.7 Million
Cost of Deposits: 1.91%
Total Deposits: $4.9 Billion
Cost of Deposits: 0.25%
Non-Int. Bearing
Demand
5%
Interest Bearing
Demand
4%
MMDA and
Savings
23%CDs
68%
Non-Int.
Bearing
Demand
37%
Interest
Bearing
Demand
7%
MMDA and
Savings
40%
CDs
16%
• 37% of deposit balances are non-interest bearing deposits
• 84% of deposits are non-maturity deposits
• 91% of deposits are core deposits*
* Core deposits are all transaction accounts and non-brokered CD accounts below $250,000
10
Commercial &
Industrial
5%
CRE - Own. Occ.
18%
CRE - Non-Own.
Occ.
26%
Multi-family
48%
1-4 Family
2%
Other
1%
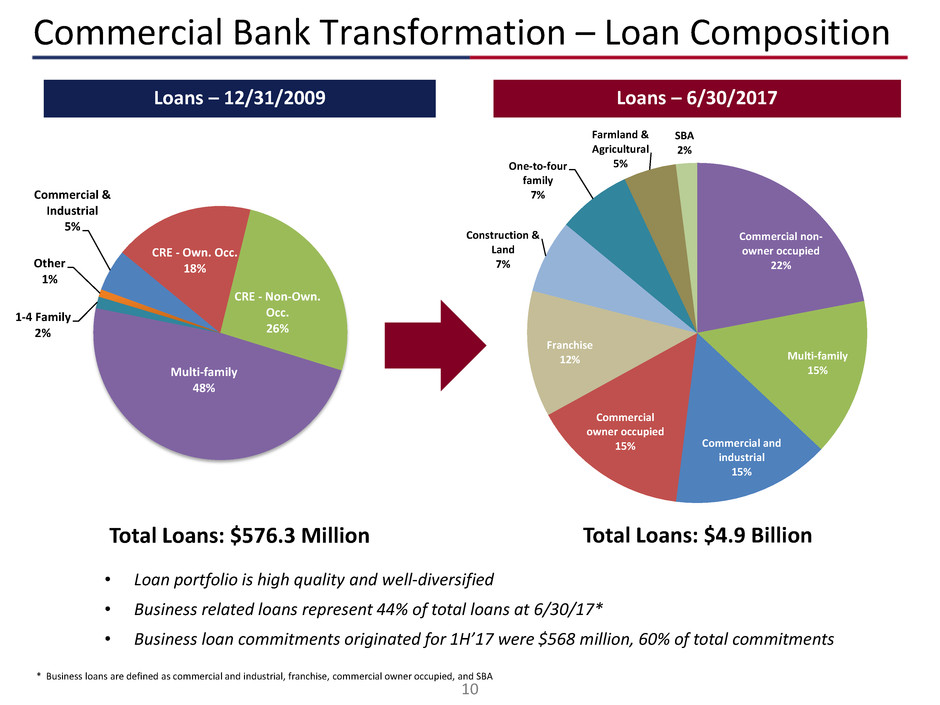
Commercial Bank Transformation – Loan Composition
Loans – 12/31/2009 Loans – 6/30/2017
• Loan portfolio is high quality and well-diversified
• Business related loans represent 44% of total loans at 6/30/17*
• Business loan commitments originated for 1H’17 were $568 million, 60% of total commitments
Total Loans: $576.3 Million Total Loans: $4.9 Billion
* Business loans are defined as commercial and industrial, franchise, commercial owner occupied, and SBA
Commercial non-
owner occupied
22%
Multi-family
15%
Commercial and
industrial
15%
Commercial
owner occupied
15%
Franchise
12%
Construction &
Land
7%
One-to-four
family
7%
Farmland &
Agricultural
5%
SBA
2%

11
Conservative Credit Culture
Nonperforming Assets to Total Assets (%)
The Company has a history of effective credit risk management and outperforming peers
• No troubled debt restructurings (“TDRs”)
• Tactical loan sales utilized strategically to manage various risks
• Nonperforming assets to total assets of 0.01%
1.04
1.70
1.58 1.66
1.36
0.48 0.58
0.40
3.26
1.62
1.31
0.76
0.55
1.67
1.08
0.38 0.33
0.21 0.15 0.20 0.20 0.14 0.12 0.12 0.21 0.19 0.18 0.18 0.17
0.13 0.17 0.04 0.02
0.01
2.93
3.62
3.96
4.11
4.26 4.30 4.24
4.39
4.23 4.29
4.06 4.04
3.77
3.48 3.39
3.21
2.96
1.56
1.24
1.10 1.18 1.05
0.91
0.80 0.74 0.69 0.59 0.58
0.74
0.53 0.48 0.50 0.49
-
0.50
1.00
1.50
2.00
2.50
3.00
3.50
4.00
4.50
5.00
PPB Peers *
CNB
Acquisition
2/11/11
PDNB
Acquisition
4/27/12
* California peer group consists of all insured California institutions, from SNL Financial.
12
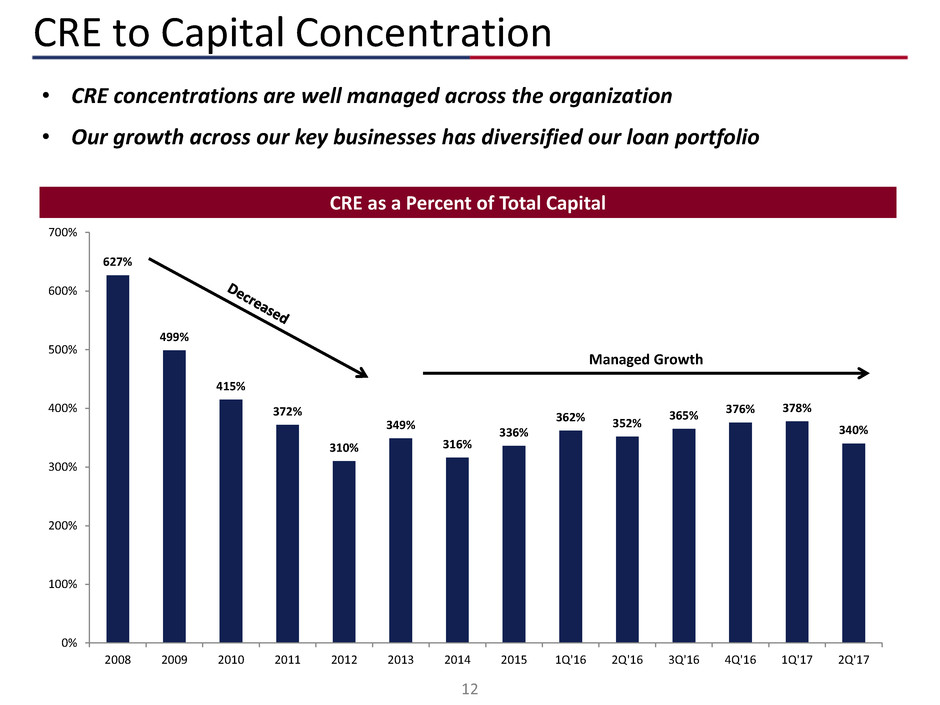
CRE to Capital Concentration
• CRE concentrations are well managed across the organization
• Our growth across our key businesses has diversified our loan portfolio
Managed Growth
CRE as a Percent of Total Capital
627%
499%
415%
372%
310%
349%
316%
336%
362% 352%
365% 376%
378%
340%
0%
100%
200%
300%
400%
500%
600%
700%
2008 2009 2010 2011 2012 2013 2014 2015 1Q'16 2Q'16 3Q'16 4Q'16 1Q'17 2Q'17

13
Strong Loan Yields - Declining Cost of Deposits
Portfolio Core Loan Yields Cost of Total Deposits
0.33%
0.36%
0.32%
0.28% 0.27%
0.25%
0.00%
0.10%
0.20%
0.30%
0.40%
0.50%
$0
$500
$1,000
$1,500
$2,000
$2,500
$3,000
$3,500
$4,000
$4,500
$5,000
2013 2014 2015 2016 1Q'17 2Q'17
Total Deposits Cost of Deposits
Our specialty lines of business have optimized our NIM through diversification and
disciplined pricing as well as accelerating organic loan and deposit growth
Note: All dollars in millions
Note: Core loan yields exclude accretion, prepayments and other one-time items.
5.26% 5.15% 5.10%
5.04% 4.96% 4.89%
0.00%
0.75%
1.50%
2.25%
3.00%
3.75%
4.50%
5.25%
6.00%
$0
$500
$1,000
$1,500
$2,000
$2,500
$3,000
$3,500
$4,000
$4,500
$5,000
2013 2014 2015 2016 1Q'17 2Q'17
Loans Portfolio Core Loan Yield
• Heritage Oak’s loan yield at acquisition was 4.44% • Heritage Oak’s cost of deposits at acquisition was 0.25%

14
Revenue & Net Interest Margin
Annual Operating Revenue
Note: All dollars in millions
Note: Operating revenue = net interest income + noninterest income.
*Annualized
$67
$87
$121
$173
$186
$288
$0.0
$50.0
$100.0
$150.0
$200.0
$250.0
$300.0
2013 2014 2015 2016 1Q'17* 2Q'17*
Core Net Interest Margin
And delivered revenue growth of 57% as well as consistent net interest margin of over 4%
3.93%
4.09%
4.06%
4.20%
4.27%
4.09%
3.70%
3.80%
3.90%
4.00%
4.10%
4.20%
4.30%
2013 2014 2015 2016 1Q'17 2Q'17
• Heritage Oak’s core NIM at acquisition was 3.32%

15
Noninterest Expense & Efficiency
Adjusted Noninterest Expense / Avg. Assets Efficiency Ratio
In addition to leveraging technology to drive growth, the Company has continually
improved its operational processes to achieve greater operating leverage and
economies of scale
Note: Efficiency Ratio represents the ratio of noninterest expense less other real estate owned operations, core deposit intangible amortization and merger related expense to the sum of net
interest income before provision for loan losses and total noninterest income less gains/(loss) on sale of securities, and other-than-temporary impairment recovery (loss) on investment securities.
Adjusted noninterest expense excludes other real estate owned operations, core deposit intangible amortization and merger related costs.
64.7%
61.4%
55.9%
53.6% 52.3% 52.3%
0.0%
10.0%
20.0%
30.0%
40.0%
50.0%
60.0%
70.0%
2013 2014 2015 2016 1Q'17 2Q'17
2.95% 2.87%
2.58% 2.55%
2.40%
2.30%
0.00%
0.50%
1.00%
1.50%
2.00%
2.50%
3.00%
3.50%
2013 2014 2015 2016 1Q'17 2Q'17

16
Pre-Tax, Pre-Provision Income(1) Tangible Book Value per Share
$23.4
$33.5
$51.9
$78.5
$86.3
$134.9
$0
$20
$40
$60
$80
$100
$120
$140
2013 2014 2015 2016 1Q'17* Q2'17*
$9.08
$10.12
$11.17
$12.51
$12.88
$13.83
$7.00
$8.00
$9.00
$10.00
$11.00
$12.00
$13.00
$14.00
2013 2014 2015 2016 1Q'17 2Q'17
Strong operating income has consistently resulted in shareholder value creation
Operating Income and Tangible Book Value
Note: All dollars in millions, except per share data
Note: Tangible book values are based on basic shares outstanding
(1) Excludes merger-related expenses
*Annualized
17
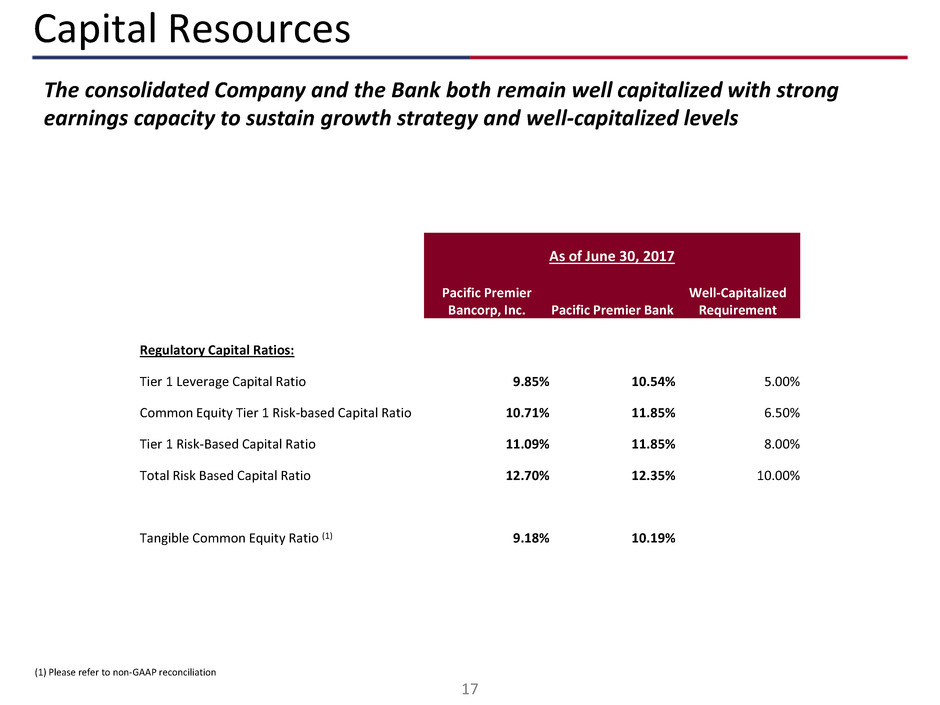
Capital Resources
(1) Please refer to non-GAAP reconciliation
As of June 30, 2017
Pacific Premier
Bancorp, Inc. Pacific Premier Bank
Well-Capitalized
Requirement
Regulatory Capital Ratios:
Tier 1 Leverage Capital Ratio 9.85% 10.54% 5.00%
Common Equity Tier 1 Risk-based Capital Ratio 10.71% 11.85% 6.50%
Tier 1 Risk-Based Capital Ratio 11.09% 11.85% 8.00%
Total Risk Based Capital Ratio 12.70% 12.35% 10.00%
Tangible Common Equity Ratio (1) 9.18% 10.19%
The consolidated Company and the Bank both remain well capitalized with strong
earnings capacity to sustain growth strategy and well-capitalized levels

18
Superior Market Performance (PPBI)
Source: SNL Financial, market information as of 6/30/2017
Since June 2015, PPBI’s stock price has significantly outperformed its publicly traded bank
peers (SNL Bank Index / NASDAQ Bank Index)
PPBI +118%
NASDAQ
Bank
SNL Bank +23%
+30%
-40.0%
-20.0%
0.0%
20.0%
40.0%
60.0%
80.0%
100.0%
120.0%
140.0%
160.0%
Jun-15 Aug-15 Oct-15 Dec-15 Feb-16 Apr-16 Jun-16 Aug-16 Oct-16 Dec-16 Feb-17 Apr-17 Jun-17
PPBI SNL Bank NASDAQ Bank

19
Strategically Focused – Financially Motivated
PPBI’s management team operates the bank with the understanding we are growing toward $10.0 billion
• Our business model is always evolving, transforming and improving
• Continue to build a quality banking franchise and leverage our core competencies
• Investments in and the strengthening of the entire team is an on-going process
Continue to Evolve and Strive for Superior Performance
Operational Integrity Leads to Strong Internal Controls and Risk Management
PPBI’s operating environment and culture have been built over the years to be scalable
• Disciplined credit underwriting culture remains a fundamental underpinning
• BSA/AML – automated Rule Based Risk Rating and statistical analytics covering entire client base
• CRA – enhanced program to exceed community group requirements and large bank exam standards
Keen Focus on Creating Maximum Shareholder Value
Management consistently communicates and executes on its strategic plan
• Our Board regularly evaluates capital management, strategic direction and the alternatives to maximize shareholder value
• Focused on increasing earnings and building TBV through growth strategies and improving efficiencies
• Our goal is to create a fundamentally sound franchise with strong earnings and risk management

20
Scarcity Value in Southern California
• Significant scarcity value for quality and
sizeable banking franchises in Southern
California
• PPBI is 7th largest bank headquartered in
Southern California
• Includes all banks and thrifts headquartered
in Southern California (Orange, Los Angeles,
San Bernardino, Riverside, and San Diego
counties). Sorted by total assets, excludes
pending merger targets and ethnic-focused
banks
Largest 25 Banks Headquartered in Southern California
Source: SNL Financial for most recent period-end
*Total assets includes impact from PPBI’s pending acquisition of HEOP
Note: All dollars in thousands
Rank Company Name Exchange City
Total Assets
($000s)
1 PacWest Bancorp* NASDAQ Beverly Hills 25,285,002$
2 Banc of California, Inc. NYSE Santa Ana 11,052,085$
3 BofI Holding, Inc. NASDAQ San Diego 8,700,031$
4 CVB Financial Corp. NASDAQ Ontario 8,559,121$
5 Opus Bank NASDAQ Irvine 7,983,682$
6 Farmers & Merchants Bank of Long Beach OTCQB Long Beach 6,834,068$
7 Pacific Premier Bancorp, Inc. NASDAQ Irvine 6,440,631$
8 First Foundation Inc. NASDAQ Irvine 3,687,917$
9 Community Bank OTC Pink Pasadena 3,625,043$
10 Grandpoint Capital, Inc. OTC Pink Los Angeles 3,356,266$
11 Manufacturers Bank Los Angeles 2,663,014$
12 American Business Bank OTC Pink Los Angeles 1,827,731$
13 Plaza Bancorp OTC Pink Irvine 1,205,438$
14 Provident Financial Holdings, Inc. NASDAQ Riverside 1,199,445$
15 Pacific Mercantile Bancorp NASDAQ Costa Mesa 1,179,745$
16 Sunwest Bank Irvine 1,079,496$
17 Malaga Bank F.S.B. OTC Pink Palos Verdes Estates 992,258$
18 Silvergate Bank La Jolla 948,898$
19 Seacoast Commerce Bank* OTC Pink San Diego 877,482$
20 California First National Bank NASDAQ Irvine 796,430$
21 Commercial Bank of California Irvine 788,357$
22 Bank of Hemet Riverside 677,530$
23 San Diego Private Bank OTCQX Coronado 537,939$
24 Pacific Commerce Bank OTC Pink Los Angeles 535,159$
25 Premier Business Bank OTCQX Los Angeles 529,064$
21
• Proven track record of executing on acquisitions and organic growth
• Well positioned to evaluate attractive acquisition opportunities
• Continue to drive economies of scale and operating leverage
• Positioned to deliver continued growth and strong profitability
• Ability to integrate business lines that generate higher risk adjusted returns
• Create scarcity value among banks in Southern California
PPBI Outlook
Building Long-term Franchise Value

22
Appendix material

23
Consolidated Financial Highlights
(1) Represents the ratio of noninterest expense less OREO operations, core deposit intangible amortization and merger related expense to the sum of net interest
income before provision for loan losses and total noninterest income less gains/(loss) on sale of securities.
(2) Nonperforming assets excludes nonperforming investment securities.
(3) Classified assets includes substandard loans, doubtful, substandard investment securities, and OREO.
* Please refer to non-GAAP reconciliation
Note: All dollars in thousands, except per share data
June 30, September 30, December 31, March 31, June 30,
2016 2016 2016 2017 2017
Summary Balance Sheet
Total Assets $3,597,666 $3,754,831 $4,036,311 $4,174,428 $6,440,631
Loans Held for Investment 2,920,619 3,090,839 3,241,613 3,385,697 4,858,611
Total Deposits 2,931,001 3,059,752 3,145,581 3,297,073 4,946,431
Loans Held for Investment / Total Deposits 99.6% 101.0% 103.1% 102.7% 98.2%
Summary Income Statement
Total Revenue $42,011 $44,977 $46,622 $46,386 $72,097
Total Non-Interest Expense 23,695 25,860 25,377 29,747 48,496
Provision for Loan Losses 1,589 4,013 2,054 2,502 1,904
Net Income 10,369 9,227 11,953 9,521 14,176
Diluted EPS $0.37 $0.33 $0.43 $0.34 $0.35
Performance Ratios
Return on Average Assets 1.16% 1.00% 1.24% 0.94% 0.89%
Return on Average Tangible Common Equity 13.30% 11.35% 14.17% 11.03% 11.33%
Return on Adjusted Average Tangible Common Equity 13.68% 11.35% 14.72% 14.76% 16.21%
Efficiency Ratio 54.4% 57.0% 50.9% 52.3% 52.3%
Net Interest Margin 4.48% 4.41% 4.59% 4.39% 4.40
Asset Quality
Delinquent Loans to Loans Held for Investment 0.19% 0.18% 0.03% 0.01% 0.06%
Allowance for Loan Losses to Loans Held for Investment 0.65% 0.71% 0.66% 0.68% 0.52%
Nonperforming Assets to Total Assets 0.13% 0.17% 0.04% 0.02% 0.01%
Net Loan Charge-offs to Average Total Loans 0.04% 0.04% 0.08% 0.02% - %
Allowance for Loan Losses as a % of Nonperforming loans 467% 381% 1866% 4498% 6343%
Classified Assets to Total Risk-Based Capital 6.07% 5.05% 3.00% 2.54% 4.98%
Capital Ratios
Tangible Common Equity/ Tangible Assets * 9.42% 9.28% 8.86% 8.85% 9.18%
Tangible Book Value Per Share * $11.87 $12.22 $12.51 $12.88 $13.83
Common Equity Tier 1 Risk-based Capital Ratio 10.53% 10.36% 10.12% 9.84% 10.71%
Tier 1 Risk-based Ratio 10.84% 10.66% 10.41% 10.11% 11.09%
Risk-based Capital Ratio 13.37% 13.14% 12.72% 12.34% 12.70%
`

24
Non-GAAP Financial Measures
Tangible common equity to tangible assets (the "tangible common equity ratio") and tangible book value per share are a non-GAAP financial measures derived from GAAP-based
amounts. We calculate the tangible common equity ratio by excluding the balance of intangible assets from common stockholders' equity and dividing by tangible assets. We
calculate tangible book value per share by dividing tangible common equity by common shares outstanding, as compared to book value per common share, which we calculate by
dividing common stockholders’ equity by common shares outstanding. We believe that this information is consistent with the treatment by bank regulatory agencies, which exclude
intangible assets from the calculation of risk-based capital ratios. Accordingly, we believe that these non-GAAP financial measures provide information that is important to investors
and that is useful in understanding our capital position and ratios. However, these non-GAAP financial measures are supplemental and are not a substitute for an analysis based on
GAAP measures. As other companies may use different calculations for these measures, this presentation may not be comparable to other similarly titled measures reported by
other companies. A reconciliation of the non-GAAP measure of tangible common equity ratio to the GAAP measure of common equity ratio and tangible book value per share to the
GAAP measure of book value per share are set forth below.
Note: All dollars in thousands, except per share data
June 30, September 30, December 31, March 31, June 30,
2016 2016 2016 2017 2017
Total stockholders' equity 440,630$ 449,965$ 459,740$ 471,025$ 959,731$
Less: Intangible assets (112,439) (111,915) (111,941) (111,432) (405,869)
Tangible common equity 328,191$ 338,050$ 347,799$ 359,593$ 553,862$
Total assets 3,597,666$ 3,754,831$ 4,036,311$ 4,174,428$ 6,440,631$
Less: Intangible assets (112,439) (111,915) (111,670) (111,432) (405,869)
Tangible assets 3,485,227$ 3,642,916$ 3,924,641$ 4,062,996$ 6,034,762$
Common Equity ratio 12.25% 11.98% 11.39% 11.28% 14.90%
Less: Intangibility equity ratio (2.83%) (2.70%) (2.53%) (2.43%) (5.72%)
Tangible common equity ratio 9.42% 9.28% 8.86% 8.85% 9.18%
Basic shares outstanding 27,650,533 27,656,533 27,798,283 27,908,816 40,048,758
Book value per share 15.94$ 16.27$ 16.54$ 16.88$ 23.96$
Less: Intangible book value per share (4.07) (4.05) (4.03) (4.00) (10.13)
Tangible book value per share 11.87$ 12.22$ 12.51$ 12.88$ 13.83$
