Attached files
| file | filename |
|---|---|
| 8-K - 8-K - CARPENTER TECHNOLOGY CORP | a17-18521_28k.htm |
Exhibit 99.1
Carpenter Technology Corporation 4th Quarter and Fiscal Year 2017 Earnings Call July 27, 2017

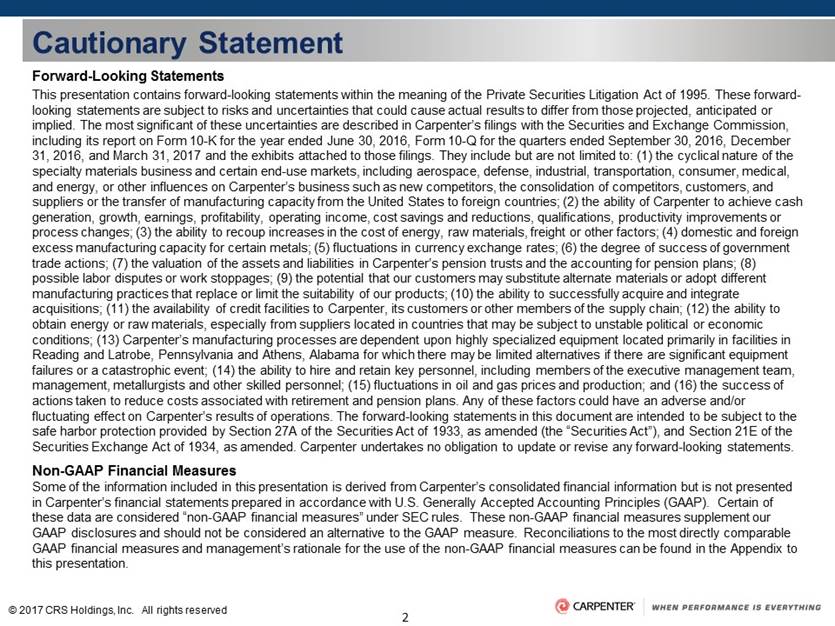
Cautionary Statement Forward-Looking Statements This presentation contains forward-looking statements within the meaning of the Private Securities Litigation Act of 1995. These forward-looking statements are subject to risks and uncertainties that could cause actual results to differ from those projected, anticipated or implied. The most significant of these uncertainties are described in Carpenter’s filings with the Securities and Exchange Commission, including its report on Form 10-K for the year ended June 30, 2016, Form 10-Q for the quarters ended September 30, 2016, December 31, 2016, and March 31, 2017 and the exhibits attached to those filings. They include but are not limited to: (1) the cyclical nature of the specialty materials business and certain end-use markets, including aerospace, defense, industrial, transportation, consumer, medical, and energy, or other influences on Carpenter’s business such as new competitors, the consolidation of competitors, customers, and suppliers or the transfer of manufacturing capacity from the United States to foreign countries; (2) the ability of Carpenter to achieve cash generation, growth, earnings, profitability, operating income, cost savings and reductions, qualifications, productivity improvements or process changes; (3) the ability to recoup increases in the cost of energy, raw materials, freight or other factors; (4) domestic and foreign excess manufacturing capacity for certain metals; (5) fluctuations in currency exchange rates; (6) the degree of success of government trade actions; (7) the valuation of the assets and liabilities in Carpenter’s pension trusts and the accounting for pension plans; (8) possible labor disputes or work stoppages; (9) the potential that our customers may substitute alternate materials or adopt different manufacturing practices that replace or limit the suitability of our products; (10) the ability to successfully acquire and integrate acquisitions; (11) the availability of credit facilities to Carpenter, its customers or other members of the supply chain; (12) the ability to obtain energy or raw materials, especially from suppliers located in countries that may be subject to unstable political or economic conditions; (13) Carpenter’s manufacturing processes are dependent upon highly specialized equipment located primarily in facilities in Reading and Latrobe, Pennsylvania and Athens, Alabama for which there may be limited alternatives if there are significant equipment failures or a catastrophic event; (14) the ability to hire and retain key personnel, including members of the executive management team, management, metallurgists and other skilled personnel; (15) fluctuations in oil and gas prices and production; and (16) the success of actions taken to reduce costs associated with retirement and pension plans. Any of these factors could have an adverse and/or fluctuating effect on Carpenter’s results of operations. The forward-looking statements in this document are intended to be subject to the safe harbor protection provided by Section 27A of the Securities Act of 1933, as amended (the “Securities Act”), and Section 21E of the Securities Exchange Act of 1934, as amended. Carpenter undertakes no obligation to update or revise any forward-looking statements. Non-GAAP Financial Measures Some of the information included in this presentation is derived from Carpenter’s consolidated financial information but is not presented in Carpenter’s financial statements prepared in accordance with U.S. Generally Accepted Accounting Principles (GAAP). Certain of these data are considered “non-GAAP financial measures” under SEC rules. These non-GAAP financial measures supplement our GAAP disclosures and should not be considered an alternative to the GAAP measure. Reconciliations to the most directly comparable GAAP financial measures and management’s rationale for the use of the non-GAAP financial measures can be found in the Appendix to this presentation.
4th Quarter and Fiscal Year 2017 Summary Tony Thene President and Chief Executive Officer
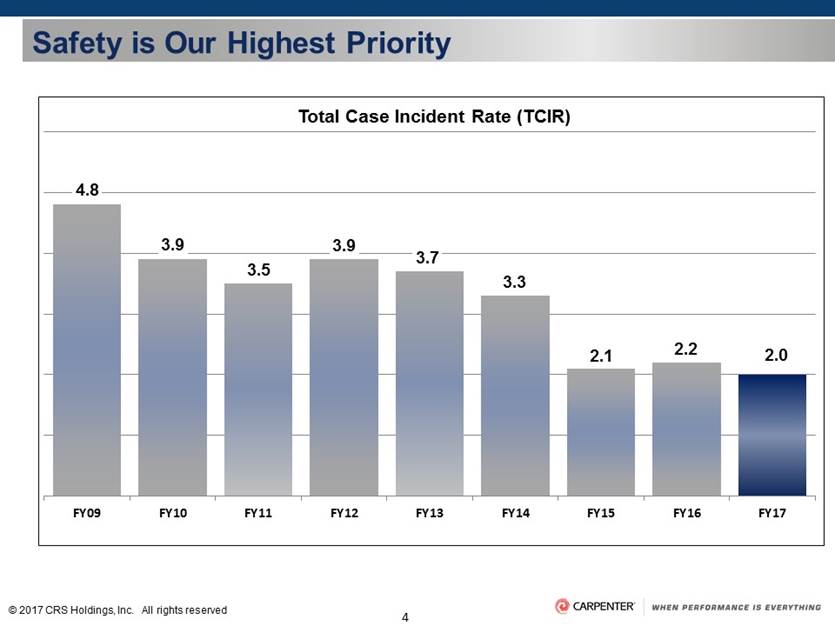
Safety is Our Highest Priority 4.8 3.9 3.5 3.9 3.7 3.3 2.1 2.2 2.0 FY09 FY10 FY11 FY12 FY13 FY14 FY15 FY16 FY17 Total Case Incident Rate (TCIR)
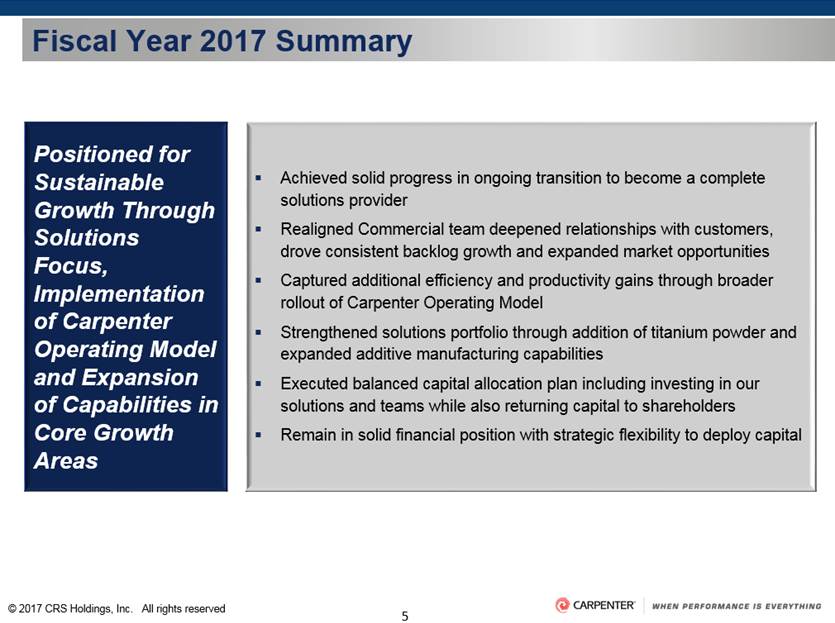
Fiscal Year 2017 Summary Positioned for Sustainable Growth Through Solutions Focus, Implementation of Carpenter Operating Model and Expansion of Capabilities in Core Growth Areas Achieved solid progress in ongoing transition to become a complete solutions provider Realigned Commercial team deepened relationships with customers, drove consistent backlog growth and expanded market opportunities Captured additional efficiency and productivity gains through broader rollout of Carpenter Operating Model Strengthened solutions portfolio through addition of titanium powder and expanded additive manufacturing capabilities Executed balanced capital allocation plan including investing in our solutions and teams while also returning capital to shareholders Remain in solid financial position with strategic flexibility to deploy capital
4th Quarter Summary Performance Driven by Product and Market Diversity, Higher Mix, Realigned Commercial Team and Carpenter Operating Model Strong execution of strategy and corresponding operating results; reported EPS of $0.54, adjusted EPS of $0.58 Continued solid growth in Aerospace and Defense end-use market – up 8% sequentially Recovery in oil & gas sub-market uncertain given current global industry and macro conditions Sequential margin expansion at Specialty Alloys Operations (SAO); new three year high Performance Engineered Products (PEP) generated positive operating income for third consecutive quarter Further benefits from the rollout of Carpenter Operating Model across all facilities Solutions-focused approach and Commercial team driving consistent backlog growth Divestiture of business consistent with strategic focus on core operations Strengthened titanium powder and additive manufacturing offerings Maintained solid financial position

Aerospace and Defense 230.7 53% +5% +8% Continued solid engine demand across multiple platforms Sequential improvement in fasteners, although still trailing prior year Structural/distribution overall down year-over-year (YoY) and sequentially due to timing of program-related sales Defense up YoY and sequentially due to program-specific demand Energy 34.8 8% +48% -5% North American (NA) directional and horizontal rig count up 123% YoY; down 1% sequentially Improving rental and replacement activity in directional drilling in NA Capital budgets for drilling and exploration appear to be expanding mainly in NA; limited activity in offshore/deep water applications Power generation down YoY and sequentially, but increased on full year basis Transportation 32.1 7% -3% +3% Sales down YoY due to lower market demand in NA in light vehicle and heavy duty truck segment Sequential sales up given share gains and heavy duty truck segment recovers from recent lows Medical 36.0 8% +20% +14% Up YoY and sequentially due to share gain and customers rebuilding inventory in both cardiology and orthopedic markets Notable titanium growth based on production / capacity improvements from Carpenter Operating Model and market share gains Industrial and Consumer 75.5 17% +7% +13% Industrial sales up YoY and sequentially driven by increased demand from several sub-markets Consumer sales up sequentially driven by increased demand in electronics and sporting goods supported by richer mix Consumer sales down YoY due to strong sporting goods demand in prior year Comments Q4-17 Net Sales ex. Surcharge ($M)* vs. Q4-16 vs. Q3-17 Sales ex-surcharge up 8% year-over-year and up 6% sequentially *Excludes sales through Carpenter’s Distribution businesses Q4-17 End-Use Market Highlights

4th Quarter Financial Overview & Business Update Damon Audia Senior Vice President and Chief Financial Officer

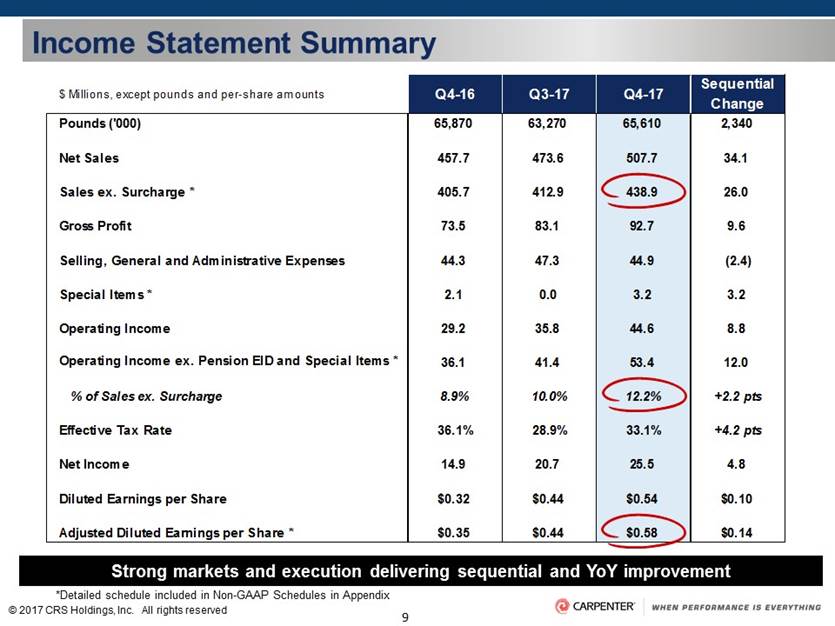
9 © 2017 CRS Holdings, Inc. All rights reserved $ Millions, except pounds and per-share amounts Q4-16 Q3-17 Q4-17 Sequential Change Pounds ('000) 65,870 63,270 65,610 2,340 Net Sales 457.7 473.6 507.7 34.1 Sales ex. Surcharge * 405.7 412.9 438.9 26.0 Gross Profit 73.5 83.1 92.7 9.6 Selling, General and Administrative Expenses 44.3 47.3 44.9 (2.4) Special Items * 2.1 0.0 3.2 3.2 Operating Income 29.2 35.8 44.6 8.8 Operating Income ex. Pension EID and Special Items * 36.1 41.4 53.4 12.0 % of Sales ex. Surcharge 8.9% 10.0% 12.2% +2.2 pts Effective Tax Rate 36.1% 28.9% 33.1% +4.2 pts Net Income 14.9 20.7 25.5 4.8 Diluted Earnings per Share $0.32 $0.44 $0.54 $0.10 Adjusted Diluted Earnings per Share * $0.35 $0.44 $0.58 $0.14 Income Statement Summary *Detailed schedule included in Non-GAAP Schedules in Appendix Strong markets and execution delivering sequential and YoY improvement
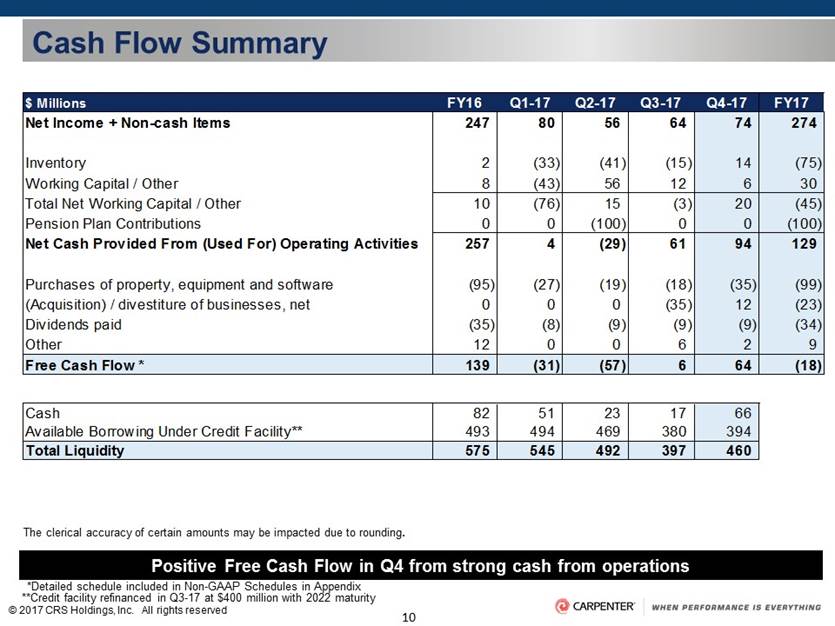
10 © 2017 CRS Holdings, Inc. All rights reserved $ Millions FY16 Q1-17 Q2-17 Q3-17 Q4-17 FY17 Net Income + Non-cash Items 247 80 56 64 74 274 Inventory 2 (33) (41) (15) 14 (75) Working Capital / Other 8 (43) 56 12 6 30 Total Net Working Capital / Other 10 (76) 15 (3) 20 (45) Pension Plan Contributions 0 0 (100) 0 0 (100) Net Cash Provided From (Used For) Operating Activities 257 4 (29) 61 94 129 Purchases of property, equipment and software (95) (27) (19) (18) (35) (99) (Acquisition) / divestiture of businesses, net 0 0 0 (35) 12 (23) Dividends paid (35) (8) (9) (9) (9) (34) Other 12 0 0 6 2 9 Free Cash Flow * 139 (31) (57) 6 64 (18) Cash 82 51 23 17 66 Available Borrowing Under Credit Facility** 493 494 469 380 394 Total Liquidity 575 545 492 397 460 Cash Flow Summary *Detailed schedule included in Non-GAAP Schedules in Appendix Positive Free Cash Flow in Q4 from strong cash from operations The clerical accuracy of certain amounts may be impacted due to rounding. **Credit facility refinanced in Q3-17 at $400 million with 2022 maturity
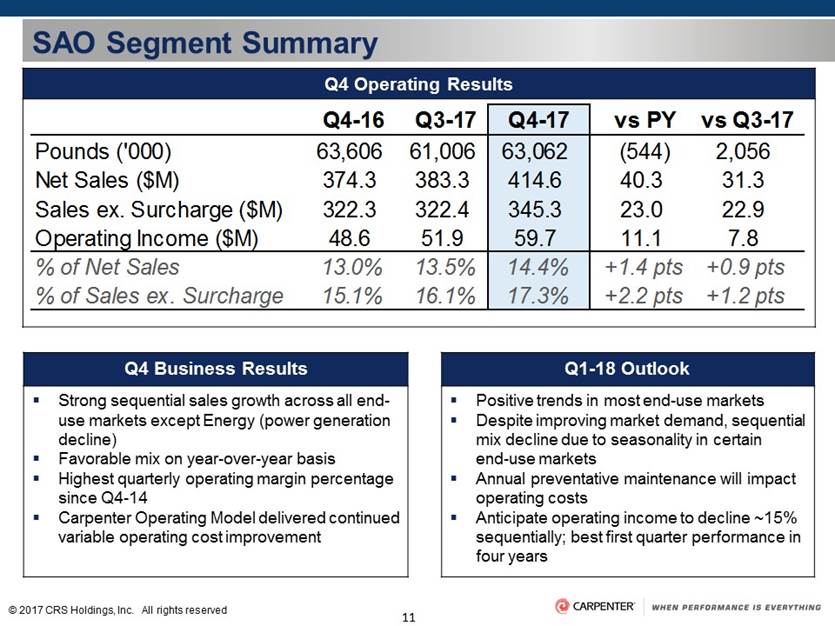
SAO Segment Summary Q4 Business Results Q1-18 Outlook Strong sequential sales growth across all end-use markets except Energy (power generation decline) Favorable mix on year-over-year basis Highest quarterly operating margin percentage since Q4-14 Carpenter Operating Model delivered continued variable operating cost improvement Positive trends in most end-use markets Despite improving market demand, sequential mix decline due to seasonality in certain end-use markets Annual preventative maintenance will impact operating costs Anticipate operating income to decline ~15% sequentially; best first quarter performance in four years Q4 Operating Results SAO Q4-16 Q3-17 Q4-17 vs PY vs Q3-17 Pounds ('000) 63,606 61,006 63,062 (544) 2,056 Net Sales ($M) 374.3 383.3 414.6 40.3 31.3 Sales ex. Surcharge ($M) 322.3 322.4 345.3 23.0 22.9 Operating Income ($M) 48.6 51.9 59.7 11.1 7.8 % of Net Sales 13.0% 13.5% 14.4% +1.4 pts +0.9 pts % of Sales ex. Surcharge 15.1% 16.1% 17.3% +2.2 pts +1.2 pts PEP Q4-16 Q3-17 Q4-17 vs PY vs Q3-17 Pounds ('000) 2,956 3,096 2,512 (444) (584) Sales ex. Surcharge ($M) 91.4 90.2 80.4 (11.0) (9.8) Op Inc ex. EID ($M) (0.4) (1.3) (2.8) (2.4) (1.5) % of Sales ex. Surcharge -0.4% -1.4% -3.5% -3.1% -2.1% Q4-16 90.2 Q4-17 vs PY Op Income Adjusted ($M)* 63.5 #REF! 35.1 (28.4) Diluted EPS Reported $ 0.57 #REF! $ (0.03) $ (0.60) Diluted EPS Adjusted** $ 0.57 $ 0.32 $ (0.25)
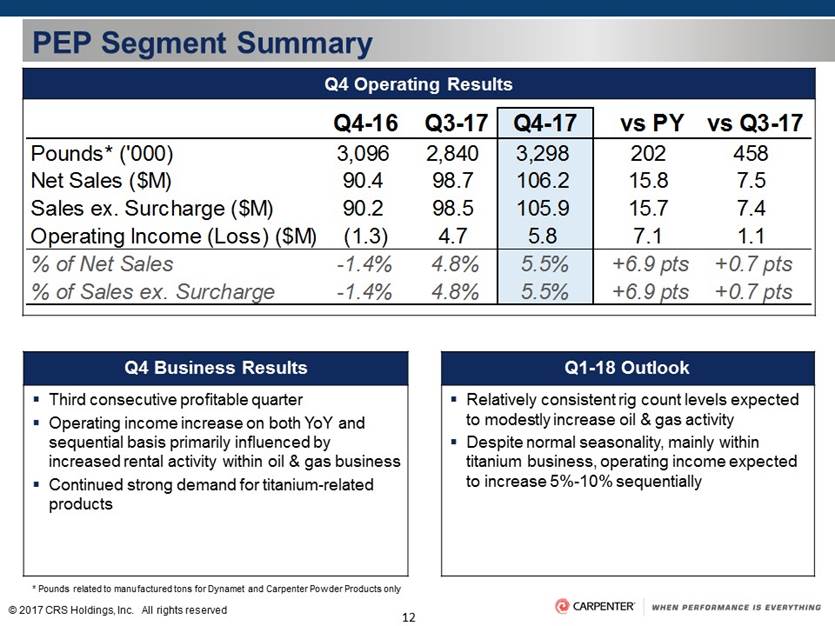
PEP Segment Summary Q4 Business Results Q1-18 Outlook Third consecutive profitable quarter Operating income increase on both YoY and sequential basis primarily influenced by increased rental activity within oil & gas business Continued strong demand for titanium-related products Relatively consistent rig count levels expected to modestly increase oil & gas activity Despite normal seasonality, mainly within titanium business, operating income expected to increase 5%-10% sequentially Q4 Operating Results * Pounds related to manufactured tons for Dynamet and Carpenter Powder Products only SAO Q4-16 Q3-17 Q4-17 vs PY vs Q3-17 Pounds* ('000) 3,096 2,840 3,298 202 458 Net Sales ($M) 90.4 98.7 106.2 15.8 7.5 Sales ex. Surcharge ($M) 90.2 98.5 105.9 15.7 7.4 Operating Income (Loss) ($M) (1.3) 4.7 5.8 7.1 1.1 % of Net Sales -1.4% 4.8% 5.5% +6.9 pts +0.7 pts % of Sales ex. Surcharge -1.4% 4.8% 5.5% +6.9 pts +0.7 pts PEP Q4-16 Q3-17 Q4-17 vs PY vs Q3-17 Pounds ('000) 2,956 3,096 2,512 (444) (584) Sales ex. Surcharge ($M) 91.4 90.2 80.4 (11.0) (9.8) Op Inc ex. EID ($M) (0.4) (1.3) (2.8) (2.4) (1.5) % of Sales ex. Surcharge -0.4% -1.4% -3.5% -3.1% -2.1% Q4-16 90.2 Q4-17 vs PY Op Income Adjusted ($M)* 63.5 #REF! 35.1 (28.4) Diluted EPS Reported $ 0.57 #REF! $ (0.03) $ (0.60) Diluted EPS Adjusted** $ 0.57 $ 0.32 $ (0.25)
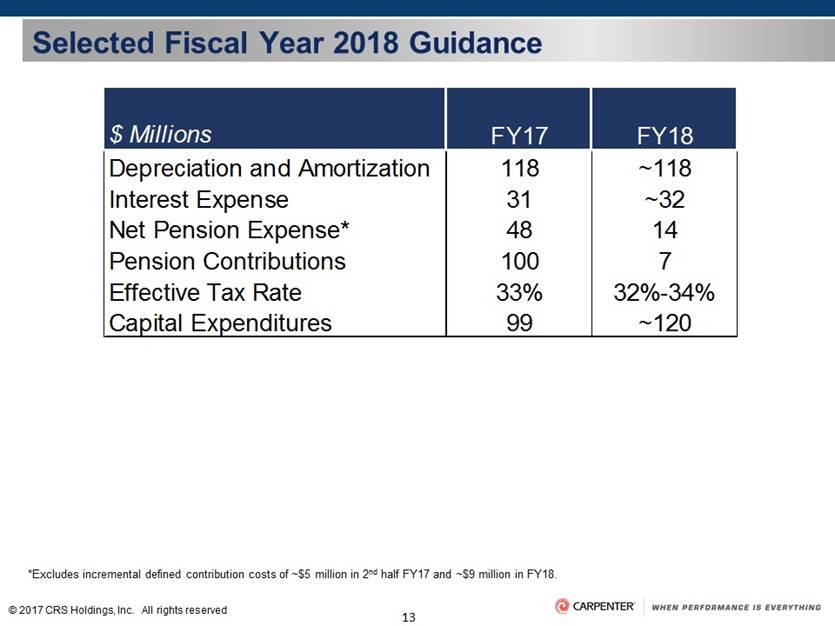
Selected Fiscal Year 2018 Guidance *Excludes incremental defined contribution costs of ~$5 million in 2nd half FY17 and ~$9 million in FY18. $ Millions FY17 FY18 Depreciation and Amortization 118 ~118 Interest Expense 31 ~32 Net Pension Expense* 48 14 Pension Contributions 100 7 Effective Tax Rate 33% 32%-34% Capital Expenditures 99 ~120
4th Quarter and Fiscal Year 2017 Closing Comments Tony Thene President and Chief Executive Officer
Reflections on Paris Air Show Customers’ feedback and activity demonstrates our solutions-focused approach is resonating Signed new customer agreements as well as expanded product relationships with existing customers Activity spanned sub-markets, solution types and geographies, highlighting our diverse industry participation Introduced new titanium powder offering as well as expanded additive manufacturing capabilities Solutions focus gaining market share and presenting opportunities to expand relationships

Closing Comments Strong Finish to the Year, Commercial and Manufacturing Strategies Delivering Results, Focused on Strengthening Long-Term Growth Profile Improved market conditions, stronger mix and solid execution drove strong Q4 performance Remain well positioned across attractive end-use markets Solutions focused commercial strategy driving backlog growth and expanding customer and market opportunities Solid growth in Aerospace and Defense end-use market due to broad solutions portfolio and participation in engine platform ramp Near-term oil & gas sub-market uncertainty given current operating environment; positioned for growth over long-term Implementation of Carpenter Operating Model across all facilities unlocking further productivity and manufacturing efficiencies Advancing our titanium powder and additive manufacturing capabilities Actively managing our business and optimally positioning Carpenter for long term growth Solid financial position provides strategic flexibility

Appendix of Non-GAAP Schedules
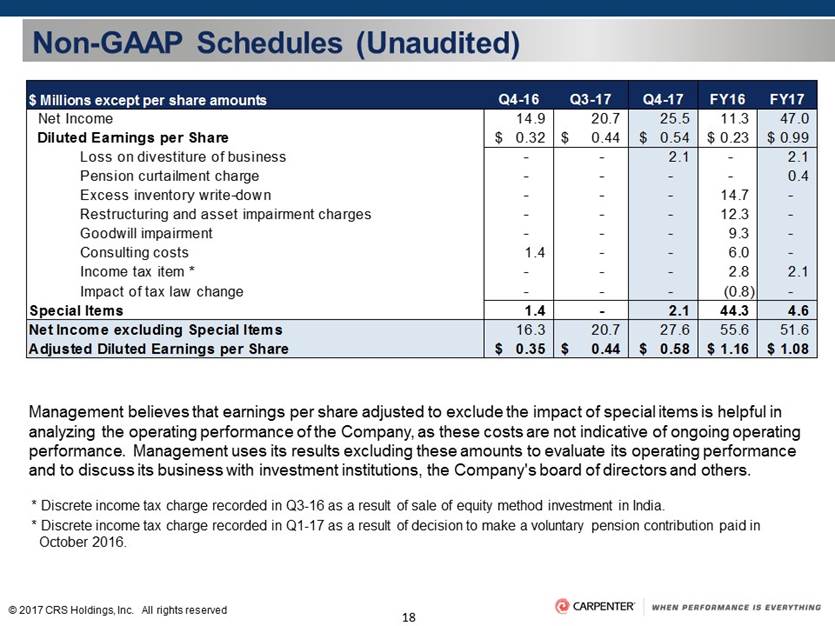
Non-GAAP Schedules (Unaudited) Management believes that earnings per share adjusted to exclude the impact of special items is helpful in analyzing the operating performance of the Company, as these costs are not indicative of ongoing operating performance. Management uses its results excluding these amounts to evaluate its operating performance and to discuss its business with investment institutions, the Company's board of directors and others. * Discrete income tax charge recorded in Q3-16 as a result of sale of equity method investment in India. * Discrete income tax charge recorded in Q1-17 as a result of decision to make a voluntary pension contribution paid in October 2016. $ Millions except per share amounts Q4-16 Q3-17 Q4-17 FY16 FY17 Net Income 14.9 20.7 25.5 11.3 47.0 Diluted Earnings per Share 0.32 $ 0.44 $ 0.54 $ 0.23 $ 0.99 $ Loss on divestiture of business - - 2.1 - 2.1 Pension curtailment charge - - - - 0.4 Excess inventory write-down - - - 14.7 - Restructuring and asset impairment charges - - - 12.3 - Goodwill impairment - - - 9.3 - Consulting costs 1.4 - - 6.0 - Income tax item * - - - 2.8 2.1 Impact of tax law change - - - (0.8) - Special Items 1.4 - 2.1 44.3 4.6 Net Income excluding Special Items 16.3 20.7 27.6 55.6 51.6 Adjusted Diluted Earnings per Share 0.35 $ 0.44 $ 0.58 $ 1.16 $ 1.08 $
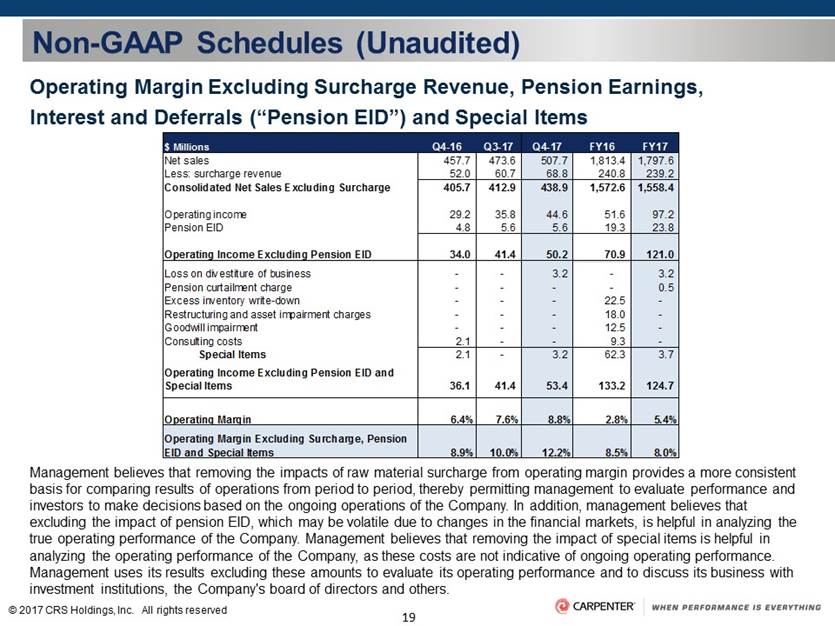
Non-GAAP Schedules (Unaudited) Operating Margin Excluding Surcharge Revenue, Pension Earnings, Interest and Deferrals (“Pension EID”) and Special Items Management believes that removing the impacts of raw material surcharge from operating margin provides a more consistent basis for comparing results of operations from period to period, thereby permitting management to evaluate performance and investors to make decisions based on the ongoing operations of the Company. In addition, management believes that excluding the impact of pension EID, which may be volatile due to changes in the financial markets, is helpful in analyzing the true operating performance of the Company. Management believes that removing the impact of special items is helpful in analyzing the operating performance of the Company, as these costs are not indicative of ongoing operating performance. Management uses its results excluding these amounts to evaluate its operating performance and to discuss its business with investment institutions, the Company's board of directors and others. Q4-16 Q3-17 Q4-17 FY16 FY17 Net sales 457.7 473.6 507.7 1,813.4 1,797.6 Less: surcharge revenue 52.0 60.7 68.8 240.8 239.2 Consolidated Net Sales Excluding Surcharge 405.7 412.9 438.9 1,572.6 1,558.4 Operating income 29.2 35.8 44.6 51.6 97.2 Pension EID 4.8 5.6 5.6 19.3 23.8 Operating Income Excluding Pension EID 34.0 41.4 50.2 70.9 121.0 Loss on divestiture of business - - 3.2 - 3.2 Pension curtailment charge - - - - 0.5 Excess inventory write-down - - - 22.5 - Restructuring and asset impairment charges - - - 18.0 - Goodwill impairment - - - 12.5 - Consulting costs 2.1 - - 9.3 - Special Items 2.1 - 3.2 62.3 3.7 36.1 41.4 53.4 133.2 124.7 6.4% 7.6% 8.8% 2.8% 5.4% 8.9% 10.0% 12.2% 8.5% 8.0% $ Millions Operating Margin Excluding Surcharge, Pension EID and Special Items Operating Income Excluding Pension EID and Special Items Operating Margin
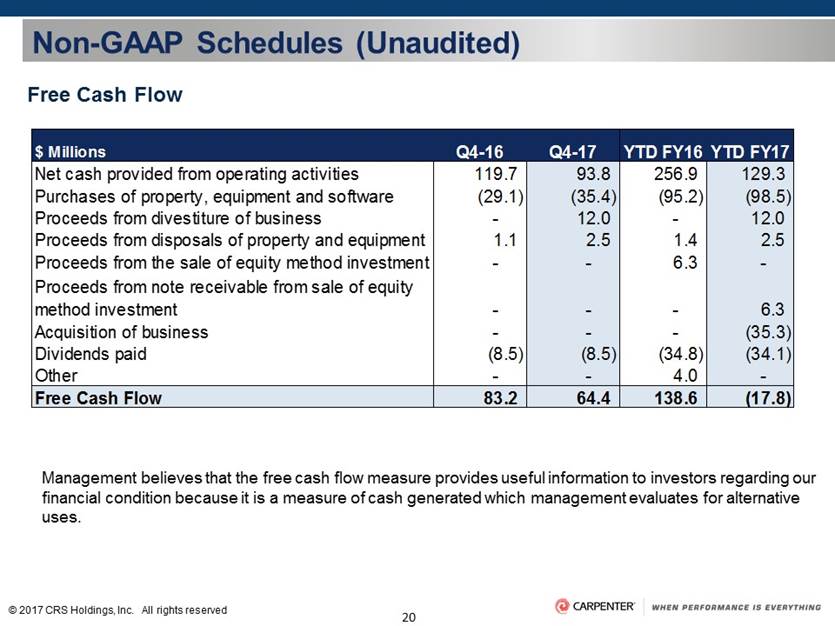
Non-GAAP Schedules (Unaudited) Management believes that the free cash flow measure provides useful information to investors regarding our financial condition because it is a measure of cash generated which management evaluates for alternative uses. Free Cash Flow Q4-16 Q4-17 YTD FY16 YTD FY17 Net cash provided from operating activities 119.7 93.8 256.9 129.3 Purchases of property, equipment and software (29.1) (35.4) (95.2) (98.5) Proceeds from divestiture of business - 12.0 - 12.0 1.1 2.5 1.4 2.5 - - 6.3 - - - - 6.3 - - - (35.3) Dividends paid (8.5) (8.5) (34.8) (34.1) Other - - 4.0 - Free Cash Flow 83.2 64.4 138.6 (17.8) $ Millions Proceeds from disposals of property and equipment Proceeds from the sale of equity method investment Acquisition of business Proceeds from note receivable from sale of equity method investment