Attached files
| file | filename |
|---|---|
| EX-99.1 - EX-99.1 - Cadence Bancorporation | cade-ex991_6.htm |
| 8-K - 8-K-EARNINGSRELEASE-20170630 - Cadence Bancorporation | cade-8k_20170726.htm |

ANALYST PRESENTATION February 7, 2017 Paul B. Murphy, Jr. Chairman and CEO Second Quarter 2017 Financial Results July 27, 2017 Exhibit 99.2
Disclaimers This communication contains forward-looking statements within the meaning of the Private Securities Litigation Reform Act of 1995. These forward-looking statements reflect our current views with respect to, among other things, future events and our results of operations, financial condition and financial performance. These statements are often, but not always, made through the use of words or phrases such as “may,” “should,” “could,” “predict,” “potential,” “believe,” “will likely result,” “expect,” “continue,” “will,” “anticipate,” “seek,” “estimate,” “intend,” “plan,” “projection,” “would” and “outlook,” or the negative version of those words or other comparable words of a future or forward-looking nature. These forward-looking statements are not historical facts, and are based on current expectations, estimates and projections about our industry, management’s beliefs and certain assumptions made by management, many of which, by their nature, are inherently uncertain and beyond our control. Accordingly, we caution you that any such forward-looking statements are not guarantees of future performance and are subject to risks, assumptions and uncertainties that are difficult to predict. Although we believe that the expectations reflected in these forward-looking statements are reasonable as of the date made, actual results may prove to be materially different from the results expressed or implied by the forward-looking statements. Such factors include, without limitation, the “Risk Factors” referenced in our Registration Statement on Form S-1 filed with the Securities and Exchange Commission (SEC), other risks and uncertainties listed from time to time in our reports and documents filed with the SEC, including our Annual Reports on Form 10-K and Quarterly Reports on Form 10-Q, and the following factors: business and economic conditions generally and in the financial services industry, nationally and within our current and future geographic market areas; economic, market, operational, liquidity, credit and interest rate risks associated with our business; lack of seasoning in our loan portfolio; deteriorating asset quality and higher loan charge-offs; the laws and regulations applicable to our business; our ability to achieve organic loan and deposit growth and the composition of such growth; increased competition in the financial services industry, nationally, regionally or locally; our ability to maintain our historical earnings trends; our ability to raise additional capital to implement our business plan; material weaknesses in our internal control over financial reporting; systems failures or interruptions involving our information technology and telecommunications systems or third-party servicers; the composition of our management team and our ability to attract and retain key personnel; the fiscal position of the U.S. federal government and the soundness of other financial institutions; the composition of our loan portfolio, including the identify of our borrowers and the concentration of loans in energy-related industries and in our specialized industries; the portion of our loan portfolio that is comprised of participations and shared national credits; and the amount of nonperforming and classified assets we hold. Cadence can give no assurance that any goal or plan or expectation set forth in forward-looking statements can be achieved and readers are cautioned not to place undue reliance on such statements. The forward-looking statements are made as of the date of this communication, and Cadence does not intend, and assumes no obligation, to update any forward-looking statement to reflect events or circumstances after the date on which the statement is made or to reflect the occurrence of unanticipated events or circumstances, except as required by applicable law. Certain of the financial measures and ratios we present are supplemental measures that are not required by, or are not presented in accordance with, U.S. generally accepted accounting principles (GAAP). We refer to these financial measures and ratios as “non-GAAP financial measures.” We consider the use of select non-GAAP financial measures and ratios to be useful for financial and operational decision making and useful in evaluating period-to-period comparisons. These non-GAAP financial measures should not be considered a substitute for financial information presented in accordance with GAAP and you should not rely on non-GAAP financial measures alone as measures of our performance. More information regarding non-GAAP financial measures, including a reconciliation of non-GAAP financial measures to the comparable GAAP financial measures, is included in our earnings release and in the appendix to this presentation.
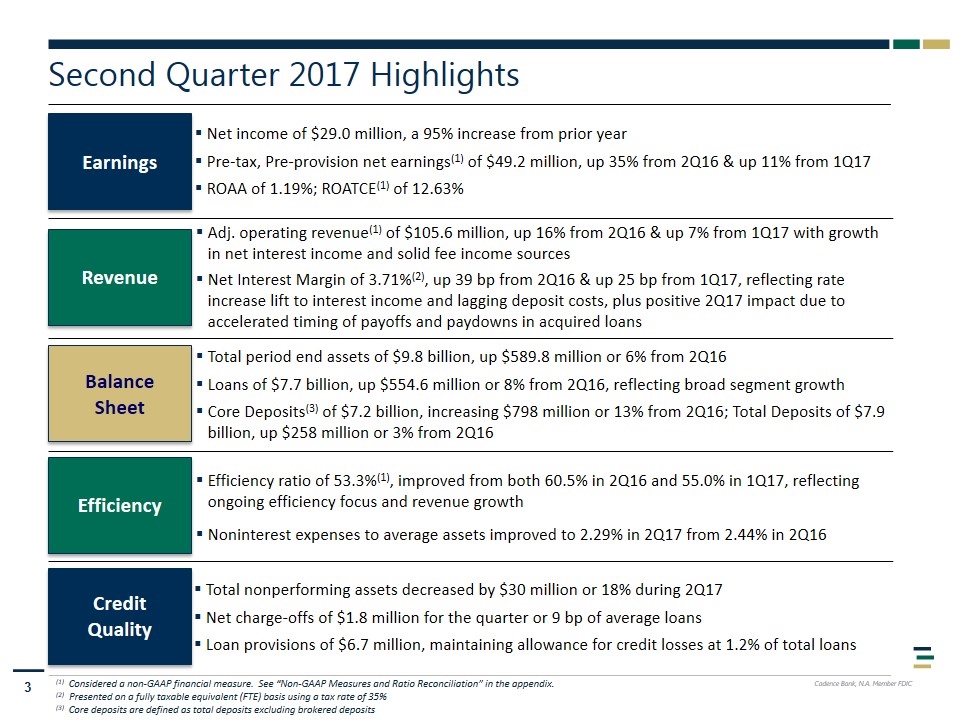
Second Quarter 2017 Highlights Earnings Net income of $29.0 million, a 95% increase from prior year Pre-tax, Pre-provision net earnings(1) of $49.2 million, up 35% from 2Q16 & up 11% from 1Q17 ROAA of 1.19%; ROATCE(1) of 12.63% Revenue Balance Sheet Efficiency Credit Quality (1) Considered a non-GAAP financial measure. See “Non-GAAP Measures and Ratio Reconciliation” in the appendix. (2) Presented on a fully taxable equivalent (FTE) basis using a tax rate of 35% (3) Core deposits are defined as total deposits excluding brokered deposits Adj. operating revenue(1) of $105.6 million, up 16% from 2Q16 & up 7% from 1Q17 with growth in net interest income and solid fee income sources Net Interest Margin of 3.71%(2), up 39 bp from 2Q16 & up 25 bp from 1Q17, reflecting rate increase lift to interest income and lagging deposit costs, plus positive 2Q17 impact due to accelerated timing of payoffs and paydowns in acquired loans Total period end assets of $9.8 billion, up $589.8 million or 6% from 2Q16 Loans of $7.7 billion, up $554.6 million or 8% from 2Q16, reflecting broad segment growth Core Deposits(3) of $7.2 billion, increasing $798 million or 13% from 2Q16; Total Deposits of $7.9 billion, up $258 million or 3% from 2Q16 Efficiency ratio of 53.3%(1), improved from both 60.5% in 2Q16 and 55.0% in 1Q17, reflecting ongoing efficiency focus and revenue growth Noninterest expenses to average assets improved to 2.29% in 2Q17 from 2.44% in 2Q16 Total nonperforming assets decreased by $30 million or 18% during 2Q17 Net charge-offs of $1.8 million for the quarter or 9 bp of average loans Loan provisions of $6.7 million, maintaining allowance for credit losses at 1.2% of total loans
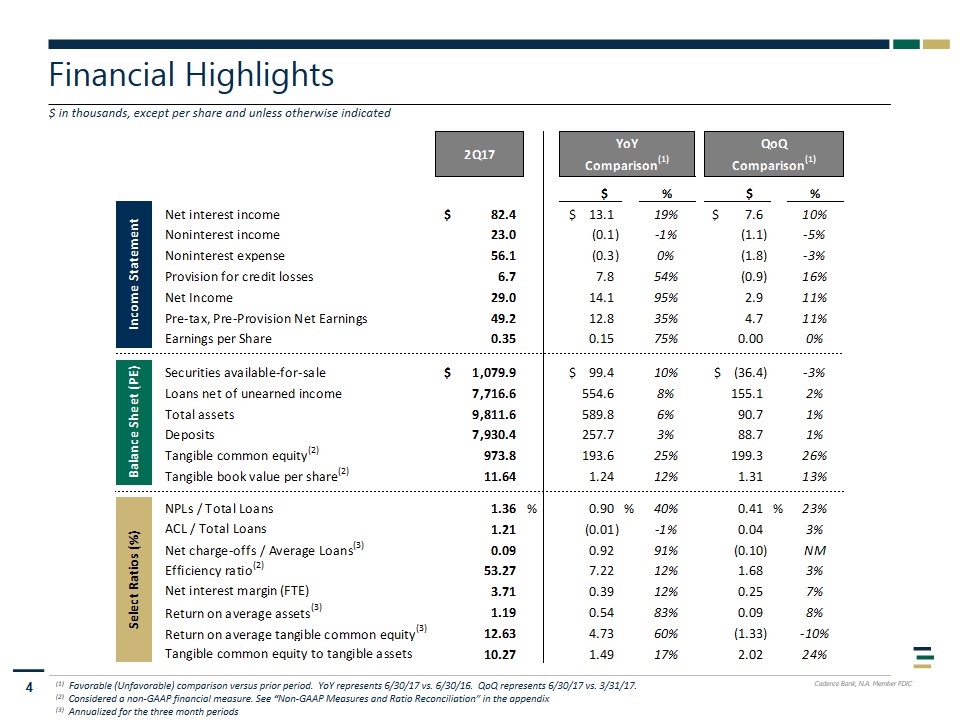
Financial Highlights $ in thousands, except per share and unless otherwise indicated (1) Favorable (Unfavorable) comparison versus prior period. YoY represents 6/30/17 vs. 6/30/16. QoQ represents 6/30/17 vs. 3/31/17. (2) Considered a non-GAAP financial measure. See “Non-GAAP Measures and Ratio Reconciliation” in the appendix (3) Annualized for the three month periods
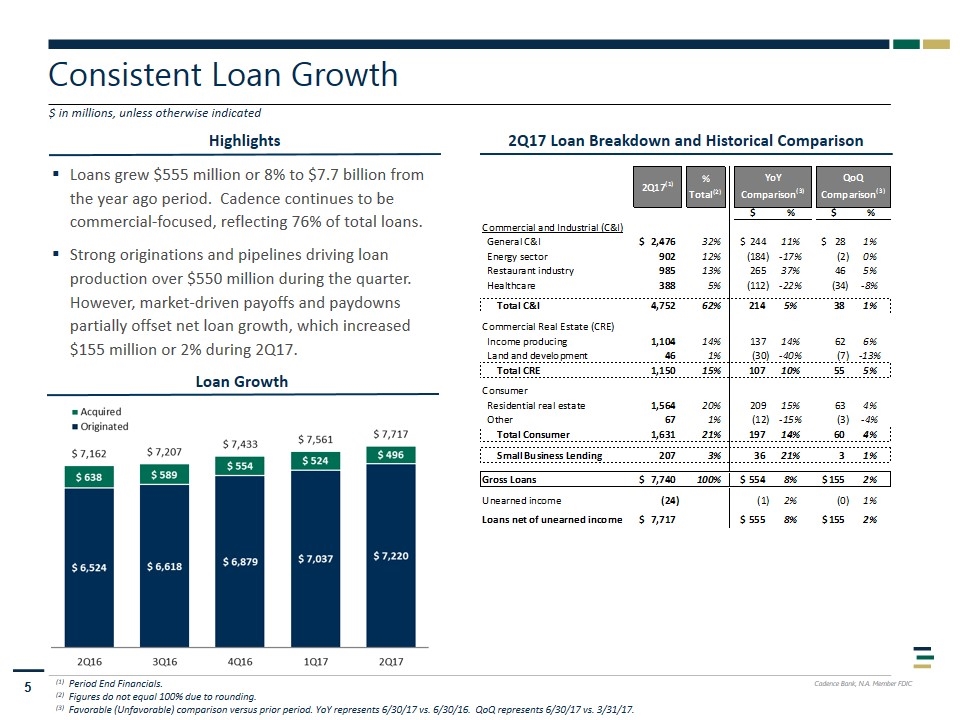
Highlights Consistent Loan Growth $ in millions, unless otherwise indicated Loan Growth Loans grew $555 million or 8% to $7.7 billion from the year ago period. Cadence continues to be commercial-focused, reflecting 76% of total loans. Strong originations and pipelines driving loan production over $550 million during the quarter. However, market-driven payoffs and paydowns partially offset net loan growth, which increased $155 million or 2% during 2Q17. (1) Period End Financials. (2) Figures do not equal 100% due to rounding. (3) Favorable (Unfavorable) comparison versus prior period. YoY represents 6/30/17 vs. 6/30/16. QoQ represents 6/30/17 vs. 3/31/17. 2Q17 Loan Breakdown and Historical Comparison
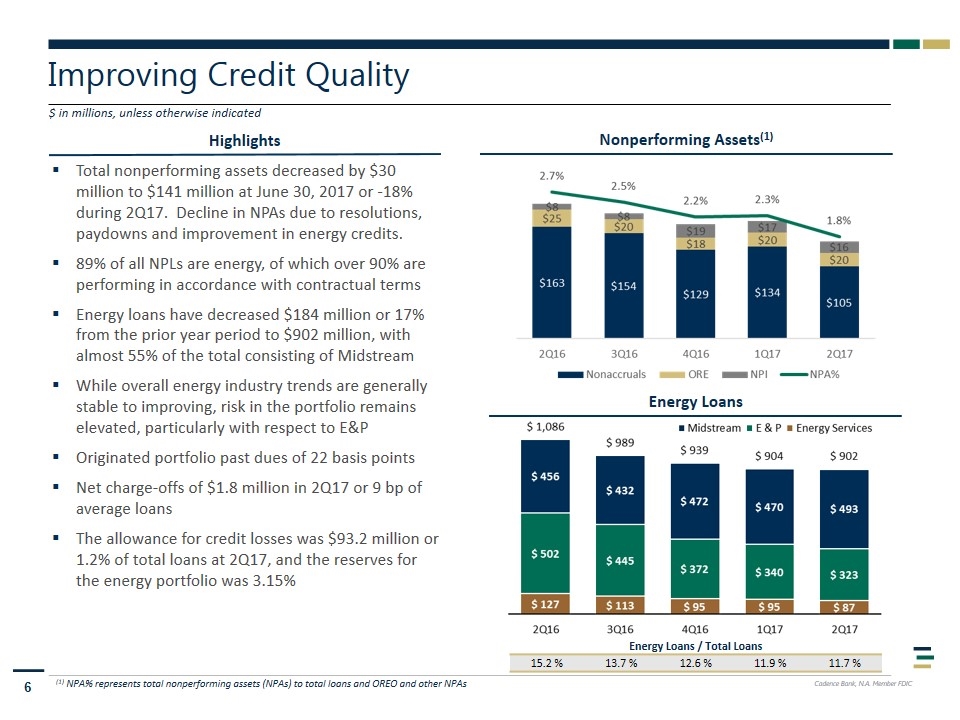
Improving Credit Quality $ in millions, unless otherwise indicated Nonperforming Assets(1) Highlights Energy Loans Total nonperforming assets decreased by $30 million to $141 million at June 30, 2017 or -18% during 2Q17. Decline in NPAs due to resolutions, paydowns and improvement in energy credits. 89% of all NPLs are energy, of which over 90% are performing in accordance with contractual terms Energy loans have decreased $184 million or 17% from the prior year period to $902 million, with almost 55% of the total consisting of Midstream While overall energy industry trends are generally stable to improving, risk in the portfolio remains elevated, particularly with respect to E&P Originated portfolio past dues of 22 basis points Net charge-offs of $1.8 million in 2Q17 or 9 bp of average loans The allowance for credit losses was $93.2 million or 1.2% of total loans at 2Q17, and the reserves for the energy portfolio was 3.15% (1) NPA% represents total nonperforming assets (NPAs) to total loans and OREO and other NPAs Energy Loans / Total Loans 15.2 % 13.7 % 12.6 % 11.9 % 11.7 %
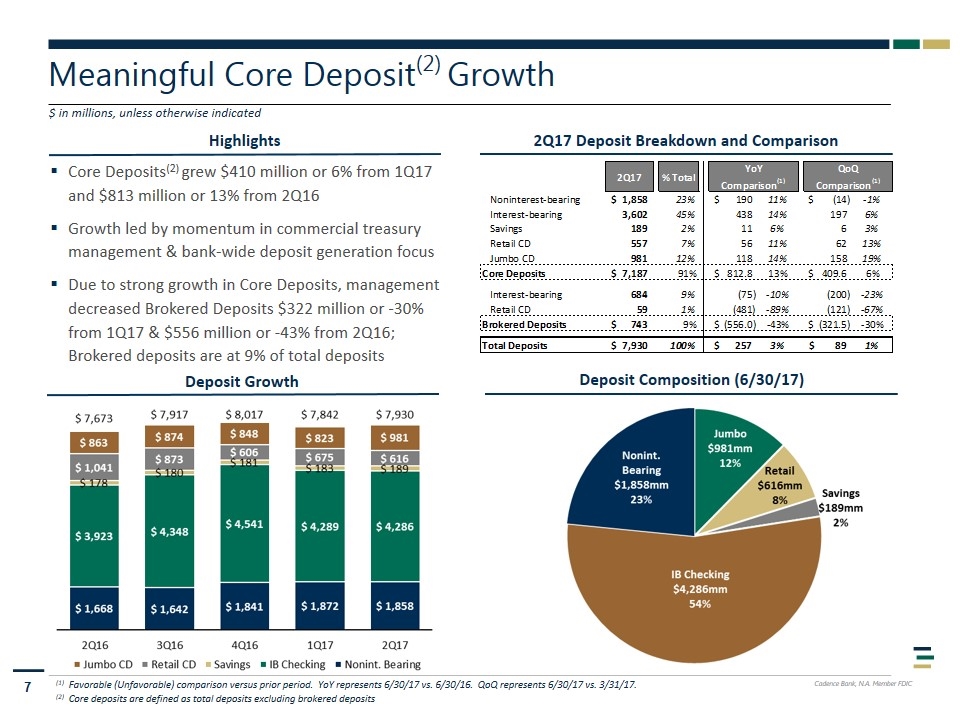
Highlights Meaningful Core Deposit(2) Growth $ in millions, unless otherwise indicated Deposit Growth 2Q17 Deposit Breakdown and Comparison Core Deposits(2) grew $410 million or 6% from 1Q17 and $813 million or 13% from 2Q16 Growth led by momentum in commercial treasury management & bank-wide deposit generation focus Due to strong growth in Core Deposits, management decreased Brokered Deposits $322 million or -30% from 1Q17 & $556 million or -43% from 2Q16; Brokered deposits are at 9% of total deposits (1) Favorable (Unfavorable) comparison versus prior period. YoY represents 6/30/17 vs. 6/30/16. QoQ represents 6/30/17 vs. 3/31/17. (2) Core deposits are defined as total deposits excluding brokered deposits Deposit Composition (6/30/17) Cadence Branch
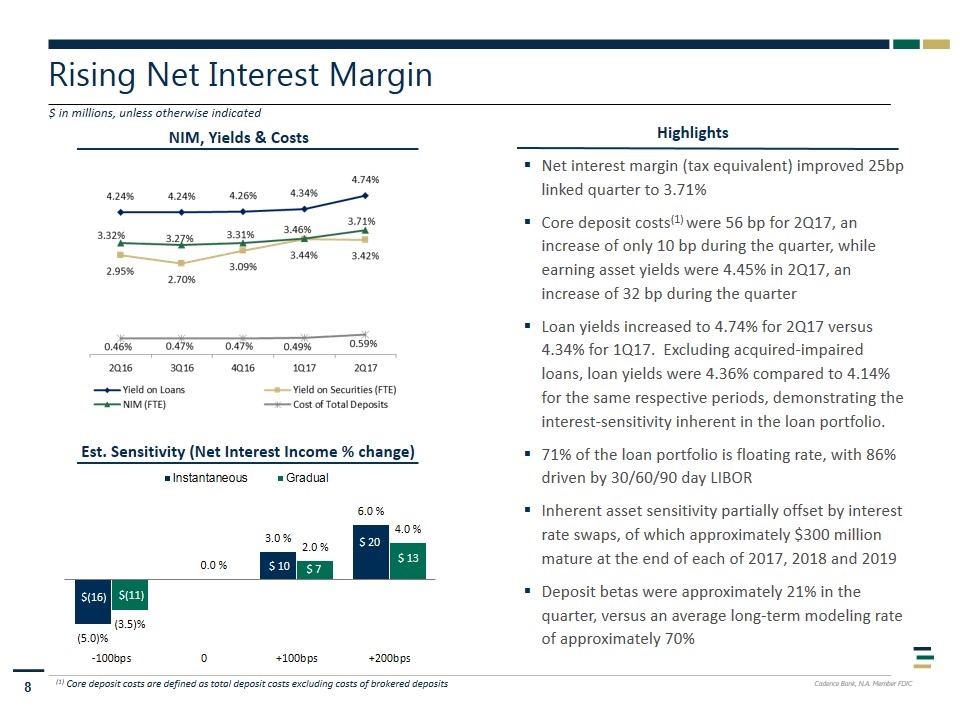
Rising Net Interest Margin $ in millions, unless otherwise indicated Highlights Net interest margin (tax equivalent) improved 25bp linked quarter to 3.71% Core deposit costs(1) were 56 bp for 2Q17, an increase of only 10 bp during the quarter, while earning asset yields were 4.45% in 2Q17, an increase of 32 bp during the quarter Loan yields increased to 4.74% for 2Q17 versus 4.34% for 1Q17. Excluding acquired-impaired loans, loan yields were 4.36% compared to 4.14% for the same respective periods, demonstrating the interest-sensitivity inherent in the loan portfolio. 71% of the loan portfolio is floating rate, with 86% driven by 30/60/90 day LIBOR Inherent asset sensitivity partially offset by interest rate swaps, of which approximately $300 million mature at the end of each of 2017, 2018 and 2019 Deposit betas were approximately 21% in the quarter, versus an average long-term modeling rate of approximately 70% NIM, Yields & Costs Est. Sensitivity (Net Interest Income % change) (1) Core deposit costs are defined as total deposit costs excluding costs of brokered deposits
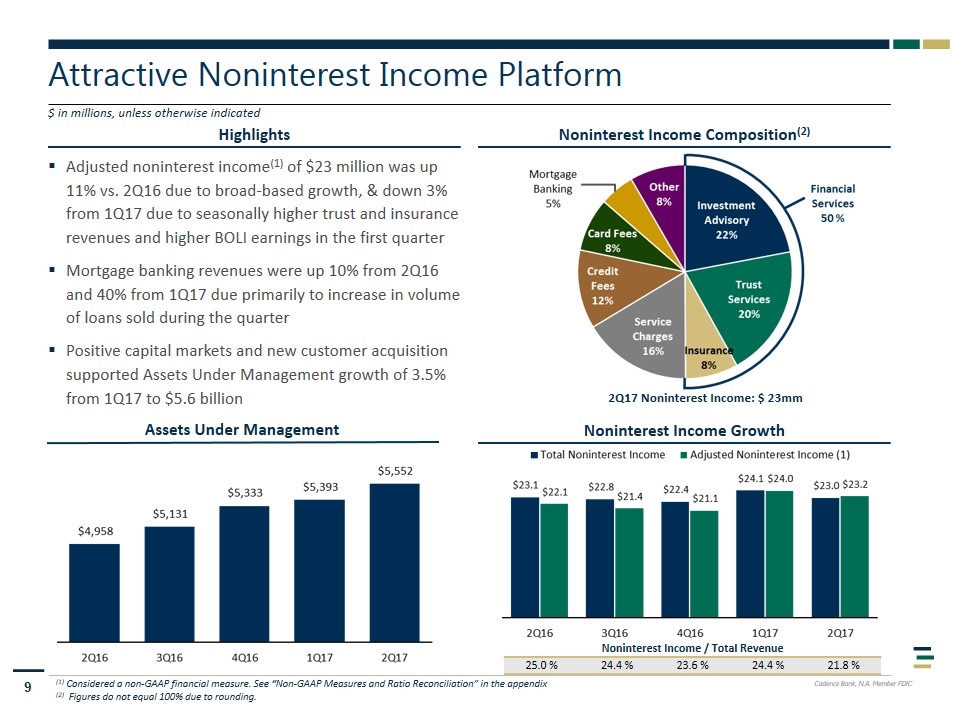
Highlights Attractive Noninterest Income Platform Noninterest Income Composition(2) Noninterest Income Growth $ in millions, unless otherwise indicated 2Q17 Noninterest Income: $ 23mm Adjusted noninterest income(1) of $23 million was up 11% vs. 2Q16 due to broad-based growth, & down 3% from 1Q17 due to seasonally higher trust and insurance revenues and higher BOLI earnings in the first quarter Mortgage banking revenues were up 10% from 2Q16 and 40% from 1Q17 due primarily to increase in volume of loans sold during the quarter Positive capital markets and new customer acquisition supported Assets Under Management growth of 3.5% from 1Q17 to $5.6 billion Assets Under Management (1) Considered a non-GAAP financial measure. See “Non-GAAP Measures and Ratio Reconciliation” in the appendix (2) Figures do not equal 100% due to rounding. Noninterest Income / Total Revenue 25.0 % 24.4 % 23.6 % 24.4 % 21.8 %
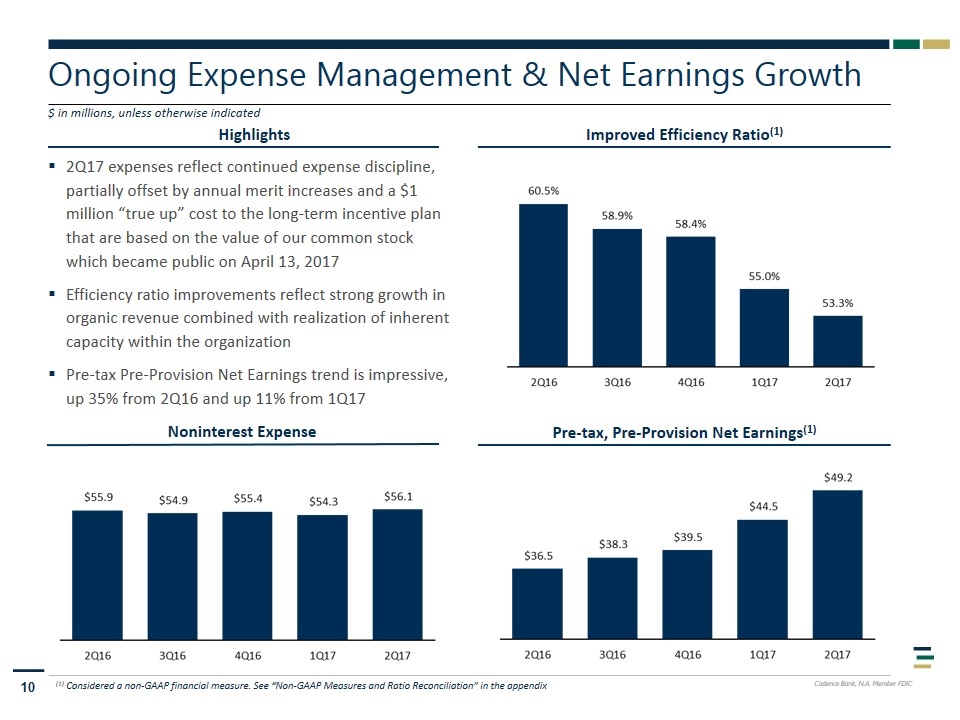
Highlights Ongoing Expense Management & Net Earnings Growth Improved Efficiency Ratio(1) Pre-tax, Pre-Provision Net Earnings(1) $ in millions, unless otherwise indicated 2Q17 expenses reflect continued expense discipline, partially offset by annual merit increases and a $1 million “true up” cost to the long-term incentive plan that are based on the value of our common stock which became public on April 13, 2017 Efficiency ratio improvements reflect strong growth in organic revenue combined with realization of inherent capacity within the organization Pre-tax Pre-Provision Net Earnings trend is impressive, up 35% from 2Q16 and up 11% from 1Q17 Noninterest Expense (1) Considered a non-GAAP financial measure. See “Non-GAAP Measures and Ratio Reconciliation” in the appendix
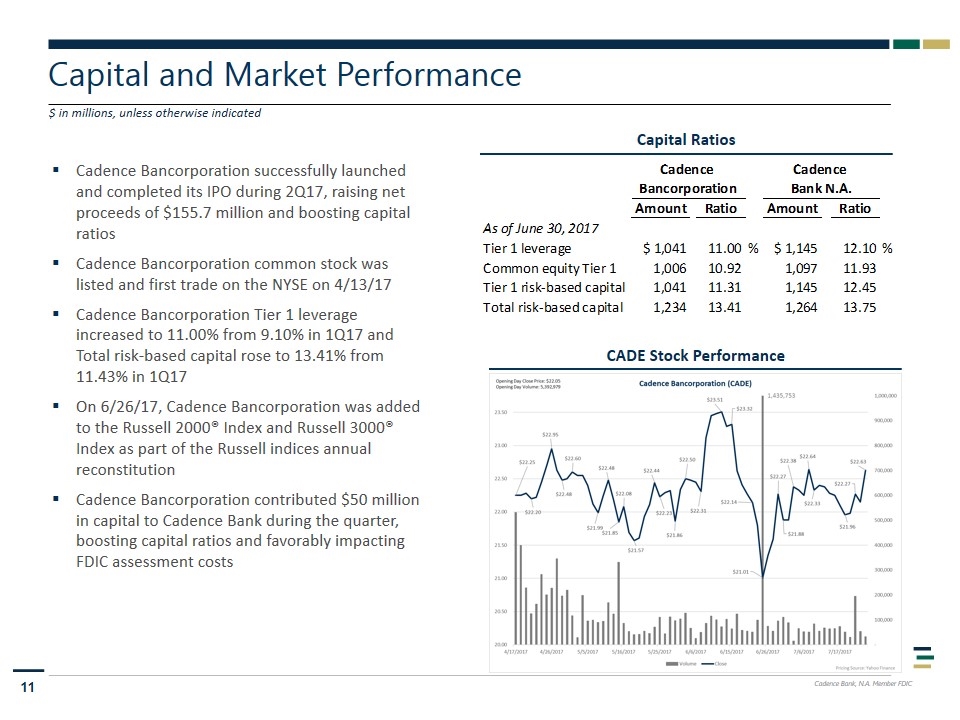
Capital and Market Performance $ in millions, unless otherwise indicated Capital Ratios Cadence Bancorporation successfully launched and completed its IPO during 2Q17, raising net proceeds of $155.7 million and boosting capital ratios Cadence Bancorporation common stock was listed and first trade on the NYSE on 4/13/17 Cadence Bancorporation Tier 1 leverage increased to 11.00% from 9.10% in 1Q17 and Total risk-based capital rose to 13.41% from 11.43% in 1Q17 On 6/26/17, Cadence Bancorporation was added to the Russell 2000® Index and Russell 3000® Index as part of the Russell indices annual reconstitution Cadence Bancorporation contributed $50 million in capital to Cadence Bank during the quarter, boosting capital ratios and favorably impacting FDIC assessment costs CADE Stock Performance
Appendix
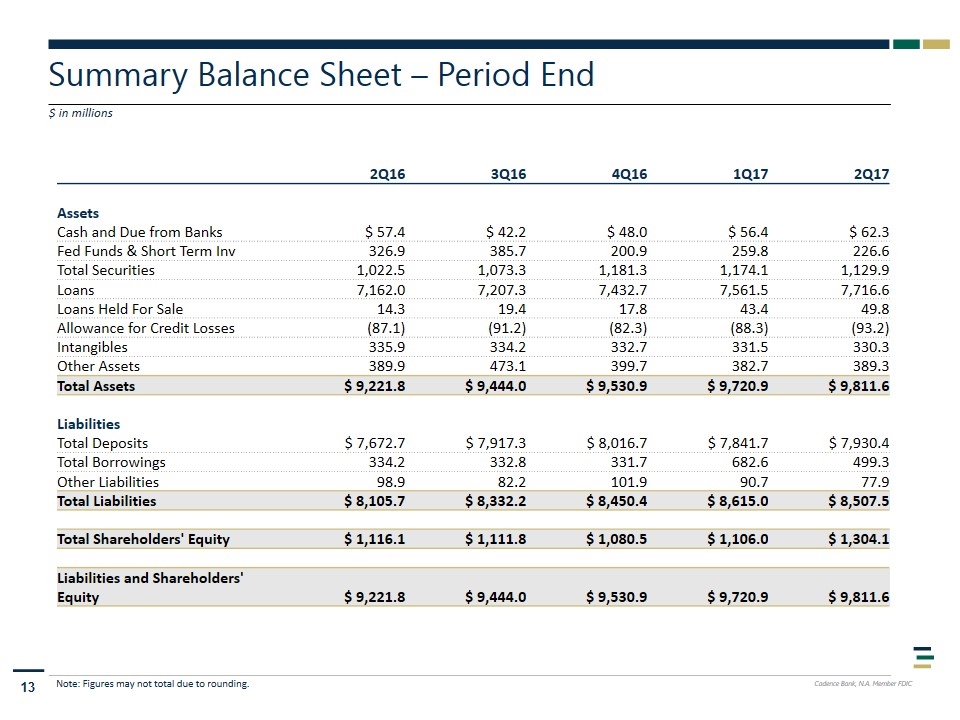
Summary Balance Sheet – Period End $ in millions Note: Figures may not total due to rounding. 2Q16 3Q16 4Q16 1Q17 2Q17 Assets Cash and Due from Banks $ 57.4 $ 42.2 $ 48.0 $ 56.4 $ 62.3 Fed Funds & Short Term Inv 326.9 385.7 200.9 259.8 226.6 Total Securities 1,022.5 1,073.3 1,181.3 1,174.1 1,129.9 Loans 7,162.0 7,207.3 7,432.7 7,561.5 7,716.6 Loans Held For Sale 14.3 19.4 17.8 43.4 49.8 Allowance for Credit Losses (87.1) (91.2) (82.3) (88.3) (93.2) Intangibles 335.9 334.2 332.7 331.5 330.3 Other Assets 389.9 473.1 399.7 382.7 389.3 Total Assets $ 9,221.8 $ 9,444.0 $ 9,530.9 $ 9,720.9 $ 9,811.6 Liabilities Total Deposits $ 7,672.7 $ 7,917.3 $ 8,016.7 $ 7,841.7 $ 7,930.4 Total Borrowings 334.2 332.8 331.7 682.6 499.3 Other Liabilities 98.9 82.2 101.9 90.7 77.9 Total Liabilities $ 8,105.7 $ 8,332.2 $ 8,450.4 $ 8,615.0 $ 8,507.5 Total Shareholders' Equity $ 1,116.1 $ 1,111.8 $ 1,080.5 $ 1,106.0 $ 1,304.1 Liabilities and Shareholders' Equity $ 9,221.8 $ 9,444.0 $ 9,530.9 $ 9,720.9 $ 9,811.6
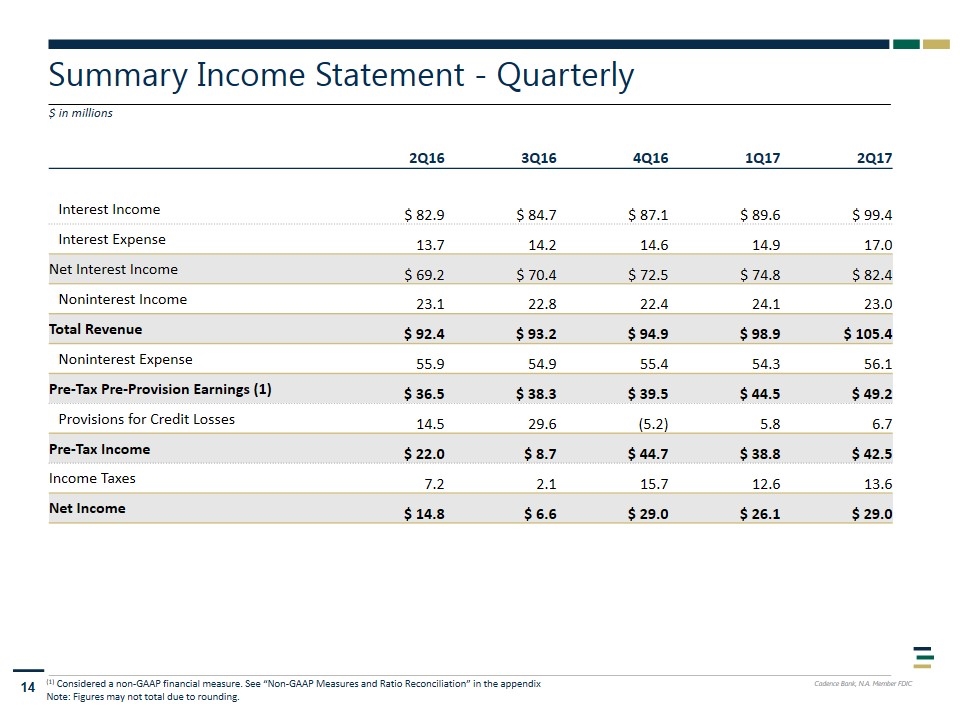
Summary Income Statement - Quarterly $ in millions (1) Considered a non-GAAP financial measure. See “Non-GAAP Measures and Ratio Reconciliation” in the appendix Note: Figures may not total due to rounding. 2Q16 3Q16 4Q16 1Q17 2Q17 Interest Income $ 82.9 $ 84.7 $ 87.1 $ 89.6 $ 99.4 Interest Expense 13.7 14.2 14.6 14.9 17.0 Net Interest Income $ 69.2 $ 70.4 $ 72.5 $ 74.8 $ 82.4 Noninterest Income 23.1 22.8 22.4 24.1 23.0 Total Revenue $ 92.4 $ 93.2 $ 94.9 $ 98.9 $ 105.4 Noninterest Expense 55.9 54.9 55.4 54.3 56.1 Pre-Tax Pre-Provision Earnings (1) $ 36.5 $ 38.3 $ 39.5 $ 44.5 $ 49.2 Provisions for Credit Losses 14.5 29.6 (5.2) 5.8 6.7 Pre-Tax Income $ 22.0 $ 8.7 $ 44.7 $ 38.8 $ 42.5 Income Taxes 7.2 2.1 15.7 12.6 13.6 Net Income $ 14.8 $ 6.6 $ 29.0 $ 26.1 $ 29.0
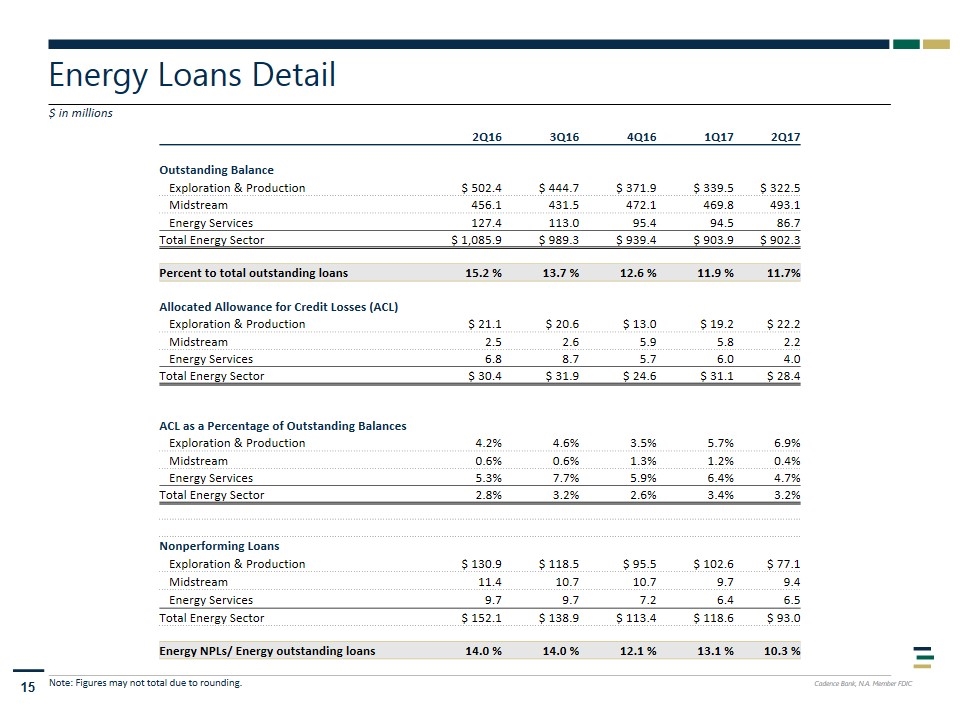
Energy Loans Detail $ in millions Note: Figures may not total due to rounding. 2Q16 3Q16 4Q16 1Q17 2Q17 Outstanding Balance Exploration & Production $ 502.4 $ 444.7 $ 371.9 $ 339.5 $ 322.5 Midstream 456.1 431.5 472.1 469.8 493.1 Energy Services 127.4 113.0 95.4 94.5 86.7 Total Energy Sector $ 1,085.9 $ 989.3 $ 939.4 $ 903.9 $ 902.3 Percent to total outstanding loans 15.2 % 13.7 % 12.6 % 11.9 % 11.7% Allocated Allowance for Credit Losses (ACL) Exploration & Production $ 21.1 $ 20.6 $ 13.0 $ 19.2 $ 22.2 Midstream 2.5 2.6 5.9 5.8 2.2 Energy Services 6.8 8.7 5.7 6.0 4.0 Total Energy Sector $ 30.4 $ 31.9 $ 24.6 $ 31.1 $ 28.4 ACL as a Percentage of Outstanding Balances Exploration & Production 4.2% 4.6% 3.5% 5.7% 6.9% Midstream 0.6% 0.6% 1.3% 1.2% 0.4% Energy Services 5.3% 7.7% 5.9% 6.4% 4.7% Total Energy Sector 2.8% 3.2% 2.6% 3.4% 3.2% Nonperforming Loans Exploration & Production $ 130.9 $ 118.5 $ 95.5 $ 102.6 $ 77.1 Midstream 11.4 10.7 10.7 9.7 9.4 Energy Services 9.7 9.7 7.2 6.4 6.5 Total Energy Sector $ 152.1 $ 138.9 $ 113.4 $ 118.6 $ 93.0 Energy NPLs/ Energy outstanding loans 14.0 % 14.0 % 12.1 % 13.1 % 10.3 %
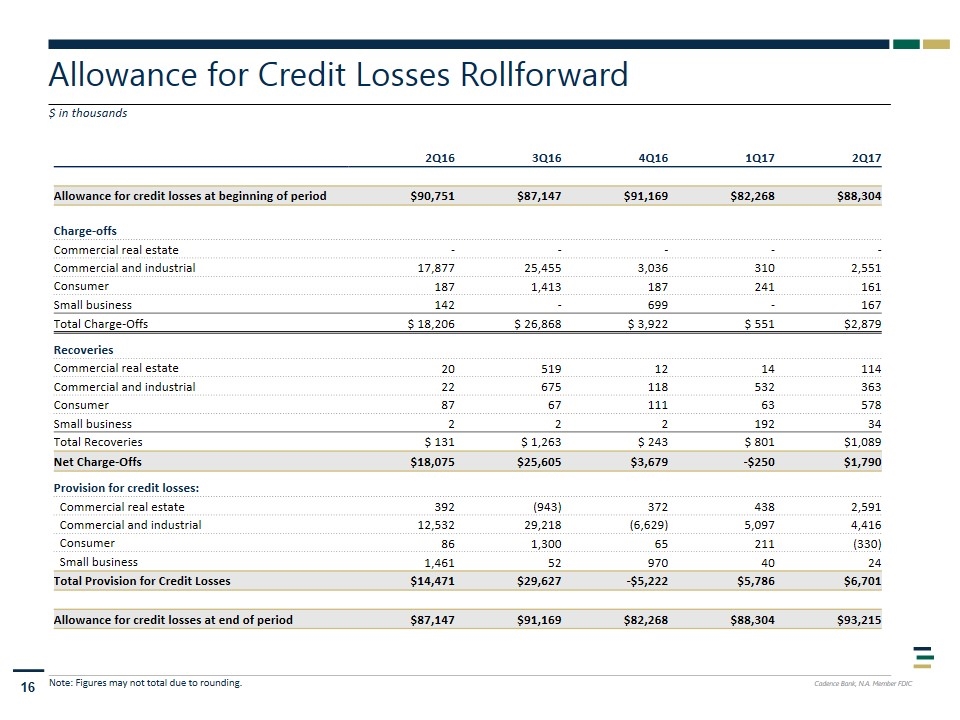
Allowance for Credit Losses Rollforward $ in thousands 2Q16 3Q16 4Q16 1Q17 2Q17 Allowance for credit losses at beginning of period $90,751 $87,147 $91,169 $82,268 $88,304 Charge-offs Commercial real estate - - - - - Commercial and industrial 17,877 25,455 3,036 310 2,551 Consumer 187 1,413 187 241 161 Small business 142 - 699 - 167 Total Charge-Offs $ 18,206 $ 26,868 $ 3,922 $ 551 $2,879 Recoveries Commercial real estate 20 519 12 14 114 Commercial and industrial 22 675 118 532 363 Consumer 87 67 111 63 578 Small business 2 2 2 192 34 Total Recoveries $ 131 $ 1,263 $ 243 $ 801 $1,089 Net Charge-Offs $18,075 $25,605 $3,679 -$250 $1,790 Provision for credit losses: Commercial real estate 392 (943) 372 438 2,591 Commercial and industrial 12,532 29,218 (6,629) 5,097 4,416 Consumer 86 1,300 65 211 (330) Small business 1,461 52 970 40 24 Total Provision for Credit Losses $14,471 $29,627 -$5,222 $5,786 $6,701 Allowance for credit losses at end of period $87,147 $91,169 $82,268 $88,304 $93,215 Note: Figures may not total due to rounding.
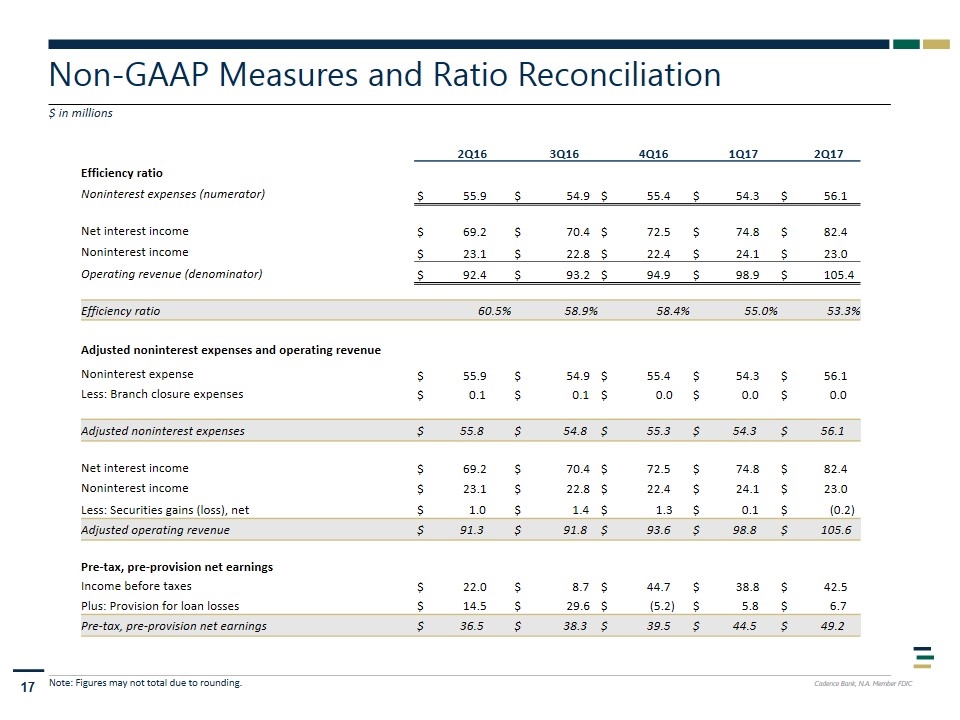
Non-GAAP Measures and Ratio Reconciliation $ in millions 2Q16 3Q16 4Q16 1Q17 2Q17 Efficiency ratio Noninterest expenses (numerator) $ 55.9 $ 54.9 $ 55.4 $ 54.3 $ 56.1 Net interest income $ 69.2 $ 70.4 $ 72.5 $ 74.8 $ 82.4 Noninterest income $ 23.1 $ 22.8 $ 22.4 $ 24.1 $ 23.0 Operating revenue (denominator) $ 92.4 $ 93.2 $ 94.9 $ 98.9 $ 105.4 Efficiency ratio 60.5% 58.9% 58.4% 55.0% 53.3% Adjusted noninterest expenses and operating revenue Noninterest expense $ 55.9 $ 54.9 $ 55.4 $ 54.3 $ 56.1 Less: Branch closure expenses $ 0.1 $ 0.1 $ 0.0 $ 0.0 $ 0.0 Adjusted noninterest expenses $ 55.8 $ 54.8 $ 55.3 $ 54.3 $ 56.1 Net interest income $ 69.2 $ 70.4 $ 72.5 $ 74.8 $ 82.4 Noninterest income $ 23.1 $ 22.8 $ 22.4 $ 24.1 $ 23.0 Less: Securities gains (loss), net $ 1.0 $ 1.4 $ 1.3 $ 0.1 $ (0.2) Adjusted operating revenue $ 91.3 $ 91.8 $ 93.6 $ 98.8 $ 105.6 Pre-tax, pre-provision net earnings Income before taxes $ 22.0 $ 8.7 $ 44.7 $ 38.8 $ 42.5 Plus: Provision for loan losses $ 14.5 $ 29.6 $ (5.2) $ 5.8 $ 6.7 Pre-tax, pre-provision net earnings $ 36.5 $ 38.3 $ 39.5 $ 44.5 $ 49.2 Note: Figures may not total due to rounding.
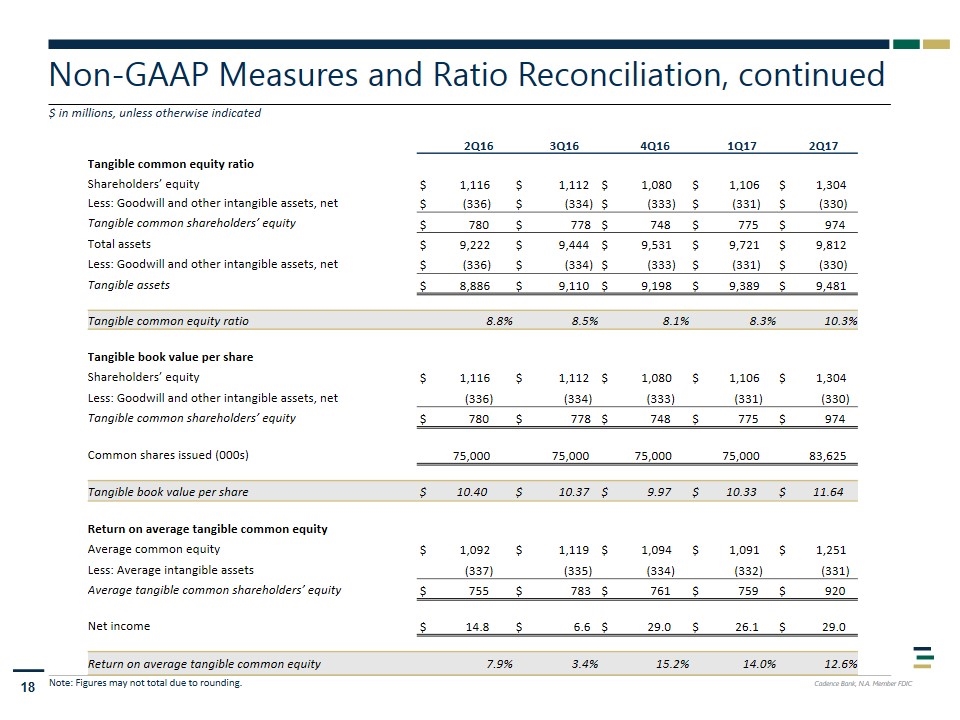
Non-GAAP Measures and Ratio Reconciliation, continued 2Q16 3Q16 4Q16 1Q17 2Q17 Tangible common equity ratio Shareholders’ equity $ 1,116 $ 1,112 $ 1,080 $ 1,106 $ 1,304 Less: Goodwill and other intangible assets, net $ (336) $ (334) $ (333) $ (331) $ (330) Tangible common shareholders’ equity $ 780 $ 778 $ 748 $ 775 $ 974 Total assets $ 9,222 $ 9,444 $ 9,531 $ 9,721 $ 9,812 Less: Goodwill and other intangible assets, net $ (336) $ (334) $ (333) $ (331) $ (330) Tangible assets $ 8,886 $ 9,110 $ 9,198 $ 9,389 $ 9,481 Tangible common equity ratio 8.8% 8.5% 8.1% 8.3% 10.3% Tangible book value per share Shareholders’ equity $ 1,116 $ 1,112 $ 1,080 $ 1,106 $ 1,304 Less: Goodwill and other intangible assets, net (336) (334) (333) (331) (330) Tangible common shareholders’ equity $ 780 $ 778 $ 748 $ 775 $ 974 Common shares issued (000s) 75,000 75,000 75,000 75,000 83,625 Tangible book value per share $ 10.40 $ 10.37 $ 9.97 $ 10.33 $ 11.64 Return on average tangible common equity Average common equity $ 1,092 $ 1,119 $ 1,094 $ 1,091 $ 1,251 Less: Average intangible assets (337) (335) (334) (332) (331) Average tangible common shareholders’ equity $ 755 $ 783 $ 761 $ 759 $ 920 Net income $ 14.8 $ 6.6 $ 29.0 $ 26.1 $ 29.0 Return on average tangible common equity 7.9% 3.4% 15.2% 14.0% 12.6% Note: Figures may not total due to rounding. $ in millions, unless otherwise indicated
