Attached files
| file | filename |
|---|---|
| 8-K - CHINA FUND INC | fp0026874_8k.htm |

Data as of 6/30/17
Manager's Commentary
Market Review
June was another good month for the Greater China equity markets, with the MSCI Golden Dragon Index (the "Benchmark") advancing by 2.5% in US dollar ("USD") terms. In line with global equities, Greater China markets have been supported by a strong liquidity environment and ongoing upgrades to corporate earnings expectations amid a stabilizing economic environment. Over the past month, technology stocks continued to outperform the market, led by internet giants such as Alibaba Group Holding Ltd. ("Alibaba"), as well as iPhone supply chain companies in Hong Kong and Taiwan. The consumer discretionary sector also saw impressive returns, which were primarily led by automobile companies including Geely Automobile Holdings Ltd.
Over the month, Morgan Stanley Capital International's ("MSCI's") announcement to include China A- shares came as a positive surprise for most investors. While the initial impact is widely expected to be limited, market participants are excited about the long-term symbolic implications. Investing in the China A-shares market will move from off benchmark decisions to an active asset allocation decision. China, including offshore and onshore equities should then, over time, become an asset class on its own.
Fund Review
The China Fund, Inc. (the "Fund") underperformed the Benchmark in June; with stock selection in the technology sector being the largest detractor from performance. In particular, the Fund was underweight in some of the best performing technology stocks including Alibaba, AAC Technology and Mediatek, the latter two were not held in the portfolio. In contrast, our overweight in Digital China Holdings Ltd., an information technology services company that did not participate in the internet and iPhone 8 rallies, hurt performance. China technology stocks have rebounded by 45% in USD terms over the first half of 2017. We are wary of chasing the tech rally given the stretched sector valuations at 31x price-to-earnings, and their high correlation to US equity markets through NASDAQ listed China American Depositary Receipts ("ADRs").
On the positive side, financial stocks were the largest contributors to performance in June. One of the top contributors was China Merchants Bank Co. Ltd., the leading joint stock bank in China. We believe its strong retail banking franchise should translate into sustainable loan growth and superior profitability compared to its state-owned peers. This name remains one of the top active overweight positions in our portfolio.
Outlook
A combination of corporate earnings recoveries, alleviated concerns over an economic slowdown in China, and fund inflows into emerging markets have supported more than 20% gains in Greater China equities this year. However, we feel China is still one of the most unloved markets with the MSCI China Index still 8% below its peak level prior to the global financial crisis; while the MSCI World Index has increased by almost 50% during the same period. With the inclusion of China A-shares, China is expected to become increasingly important within the MSCI benchmarks. Therefore, many China bears may be pressured to narrow their underweights position in China.
So far this year, Greater China stock returns have been dominated by a relatively narrow group of companies with near term catalysts, such as internet companies and iPhone 8 component suppliers. However, experience has taught us that performance, supported by near term earnings or sales momentum, is generally short lived without sustainable growth potential. Therefore we are utilizing the opportunity to take profit from recent outperformers and rotate into laggards with underappreciated secular growth potential.
|
In Brief
|
|
|
Fund Data
|
|
|
Description
|
Seeks to achieve long-term capital appreciation through investments in China companies.
|
|
Listing Date (NYSE)
|
July 10, 1992
|
|
Total Fund Assets (millions)
|
$323.2
|
|
Median Market Cap (in billions)
|
$9.4
|
|
Distribution Frequency
|
Annual
|
|
Management Firm
|
Allianz Global Investors U.S. LLC
|
|
Portfolio Management
|
Christina Chung, CFA, CMA Lead Portfolio Manager
|
|
Performance (US$ Returns)
(as of 6/30/17)
|
||
|
Fund
|
Benchmark1
|
|
|
One Month
|
2.19%
|
2.48%
|
|
Three Month
|
7.48%
|
9.53%
|
|
One Year
|
26.12%
|
30.91%
|
|
Three Year
|
5.35%
|
7.97%
|
|
Net Asset Value / Market Price
|
|
|
Net Asset Value (NAV) / Market Price at Inception
|
$13.15 / $14.26
|
|
NAV / Market Price (as of 6/30/17)
|
$20.56 / $18.68
|
|
High / Low Ranges (52-Week)
|
|
|
High / Low NAV
|
$20.84 / $16.57
|
|
High / Low Market Price
|
$18.77 / $14.19
|
|
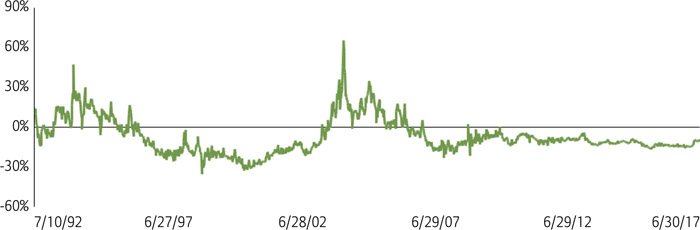
Premium/Discount to NAV (as of 6/30/17)
|
-9.14%
|
|
Fund Data (Common Shares)
|
|
|
Shares Outstanding
|
15,722,675
|
|
Average Daily Volume
|
28,210
|
|
Expense Ratio
|
1.53%
|
Fund Manager

Christina Chung, CFA, CMA
Lead Portfolio Manager
| 1. |
MSCI Golden Dragon Index.
|

The China Fund, Inc.
Proposed Manager Change
On March 31, 2017, the Fund announced that its Board of Directors had selected Open Door Investment Management, Ltd. ("Open Door") to become its Investment Manager, subject to stockholder approval at a Special Meeting of Stockholders that is now expected to be held in July. Open Door, with offices in Shanghai and San Francisco, is expected to provide the Fund with a Greater China investment strategy that focuses more on smaller capitalization and entrepreneurial companies than do most other investment funds investing in the Greater China markets. Open Door believes that this strategy will differentiate the Fund from other closed-end funds and exchange-traded funds, with index-anchored, large-capitalization approaches to investing in Greater China.
Investment Objective
The investment objective of the Fund is to achieve long-term capital appreciation. The Fund seeks to achieve its objective through investment in the equity securities of companies and other entities with significant assets, investments, production activities, trading or other business interests in China or which derive a significant part of their revenue from China.
The Fund has an operating policy that the Fund will invest at least 80% of its assets in China companies. For this purpose, 'China companies' are (i) companies for which the principal securities trading market is in China; (ii) companies for which the principal securities trading market is outside of China or in companies organized outside of China, that in both cases derive at least 50% of their revenues from goods or services sold or produced, or have at least 50% of their assets in China; or (iii) companies organized in China. Under the policy, China means the People's Republic of China, including Hong Kong, and Taiwan. The Fund will provide its stockholders with at least 60 days' prior notice of any change to this policy.
|
Returns For Periods Ended June 30, 2017*
|
||||||||
|
1 Month
|
3 Month
|
YTD
|
1 Year
|
3 Year
|
5 Year
|
10 Year
|
Inception
|
|
|
NAV
|
2.19%
|
7.48%
|
18.09%
|
26.12%
|
5.35%
|
9.43%
|
6.33%
|
10.31%
|
|
Market Price
|
3.55%
|
12.39%
|
24.12%
|
32.58%
|
6.17%
|
9.11%
|
7.35%
|
9.53%
|
|
MSCI Golden Dragon Index
|
2.48%
|
9.53%
|
23.49%
|
30.91%
|
7.97%
|
10.46%
|
5.12%
|
—
|
|
Calendar Year Returns
|
||||||||
|
2009
|
2010
|
2011
|
2012
|
2013
|
2014
|
2015
|
2016
|
|
|
NAV
|
72.83%
|
27.26%
|
-24.37%
|
12.12%
|
18.31%
|
7.82%
|
-5.50%
|
0.59%
|
|
Market Price
|
72.19%
|
23.60%
|
-27.51%
|
20.52%
|
12.70%
|
5.29%
|
-6.38%
|
-0.47%
|
|
MSCI Golden Dragon Index
|
67.12%
|
13.60%
|
-18.35%
|
22.65%
|
7.25%
|
8.06%
|
-7.12%
|
5.75%
|
Past performance is not a guide to future returns.
| * |
Annualized for periods greater than one year.
|
Source: State Street Bank and Trust Company. Source for index data: MSCI as at June 30, 2017. Investment returns are historical and do not guarantee future results. Investment returns reflect changes in net asset value and market price per share during each period and assumes that dividends and capital gains distributions, if any, were reinvested. The net asset value (NAV) percentages are not an indication of the performance of a shareholder's investment in the Fund, which is based on market price. NAV performance includes the deduction of management fees and other expenses. Market price performance does not include the deduction of brokerage commissions and other expenses of trading shares and would be lower had such commissions and expenses been deducted. It is not possible to invest directly in an index.
Premium/Discount
|
Sector Allocation
|
||
|
Fund
|
Benchmark1
|
|
|
Information Technology
|
40.24%
|
35.91%
|
|
Financials
|
19.20%
|
23.81%
|
|
Industrials
|
9.87%
|
6.08%
|
|
Telecom Services
|
9.08%
|
4.81%
|
|
Real Estate
|
6.52%
|
7.74%
|
|
Consumer Discretionary
|
6.01%
|
8.85%
|
|
Energy
|
2.21%
|
3.02%
|
|
Consumer Staples
|
1.53%
|
2.05%
|
|
Utilities
|
1.08%
|
3.67%
|
|
Health Care
|
1.07%
|
1.25%
|
|
Materials
|
0.23%
|
2.82%
|
|
Other assets & liabilities
|
2.96%
|
0.00%
|
Source: IDS GmbH - Analysis and Reporting Services, a subsidiary of Allianz SE.
|
Country Allocation
|
||
|
Fund
|
Benchmark1
|
|
|
China
|
72.22%
|
75.32%
|
|
Hong Kong Red Chips
|
25.34%
|
8.69%
|
|
Hong Kong 'H' shares
|
15.55%
|
19.10%
|
|
Equity linked securities ('A' shares)
|
0.86%
|
0.00%
|
|
China 'A' & 'B' shares
|
0.00%
|
0.11%
|
|
Other Hong Kong securities
|
30.47%
|
31.88%
|
|
Others
|
0.00%
|
15.54%
|
|
Taiwan
|
24.82%
|
24.68%
|
|
Other assets & liabilities
|
2.96%
|
0.00%
|
|
Top 10 Holdings
|
|
|
TAIWAN SEMIC CO LTD (Taiwan)
|
9.21%
|
|
TENCENT HOLDINGS LTD (China)
|
8.42%
|
|
ALIBABA GROUP HOLDING LTD (China)
|
6.22%
|
|
CHINA MERCHANTS BANK CO LTD (China)
|
5.34%
|
|
SUN HUNG KAI PROPERTIES LTD (H.K.)
|
5.15%
|
|
PING AN INSURANCE (China)
|
3.90%
|
|
CHINA UNICOM HONG KONG LTD (China)
|
3.43%
|
|
HK EXCHANGES & CLEARING LTD (H.K.)
|
3.36%
|
|
HON HAI PRECISION INDU (Taiwan)
|
3.02%
|
|
LARGAN PRECISION CO LTD (Taiwan)
|
2.66%
|
|
Portfolio Characteristics
|
||
|
Fund
|
Benchmark1
|
|
|
P/E Ratio
|
15.06
|
14.33
|
|
P/B Ratio
|
1.70
|
1.61
|
|
Issues in Portfolio
|
47
|
284
|
|
Foreign Holdings (%)
|
97.04
|
100.00
|
|
Other assets & liabilities (%)
|
2.96
|
0.00
|
|
Yield (%)
|
2.43
|
2.52
|
Source: IDS GmbH - Analysis and Reporting Services, a subsidiary of Allianz SE.
| 1. |
MSCI Golden Dragon Index.
|
The China Fund, Inc.
|
Distribution History (10 Year)
|
|||||||
|
Declaration Date
|
Ex-dividend Date
|
Record Date
|
Payable Date
|
Distribution/
Share
|
Income
|
Long-term
Capital Gain
|
Short-term
Capital Gain
|
|
12/7/07
|
12/19/07
|
12/21/07
|
1/25/08
|
$12.12000
|
$0.28000
|
$9.00000
|
$2.84000
|
|
12/8/08
|
12/22/08
|
12/24/08
|
1/23/09
|
$5.81740
|
$0.48130
|
$5.33610
|
—
|
|
12/9/09
|
12/22/09
|
12/24/09
|
12/29/09
|
$0.25570
|
$0.25570
|
—
|
—
|
|
12/8/10
|
12/21/10
|
12/24/10
|
12/29/10
|
$2.27420
|
$0.37460
|
$1.89960
|
—
|
|
12/8/11
|
12/21/11
|
12/23/11
|
12/29/11
|
$2.99640
|
$0.17420
|
$2.82220
|
—
|
|
12/10/12
|
12/20/12
|
12/24/12
|
12/28/12
|
$3.25170
|
$0.34730
|
$2.90440
|
—
|
|
12/13/13
|
12/19/13
|
12/23/13
|
12/27/13
|
$3.31400
|
$0.43870
|
$2.87530
|
—
|
|
12/8/14
|
12/18/14
|
12/22/14
|
1/5/15
|
$3.76510
|
$0.29820
|
$3.46690
|
—
|
|
12/16/15
|
12/23/15
|
12/28/15
|
1/6/16
|
$1.49580
|
$0.21330
|
$0.84620
|
$0.43630
|
|
12/9/16
|
12/19/16
|
12/21/16
|
1/5/17
|
$0.46780
|
$0.46780
|
—
|
—
|
Distribution/Share includes Income, Long-term Capital gains and Short-term Capital gains.
The China Fund NAV Performance of $10,000 since inception
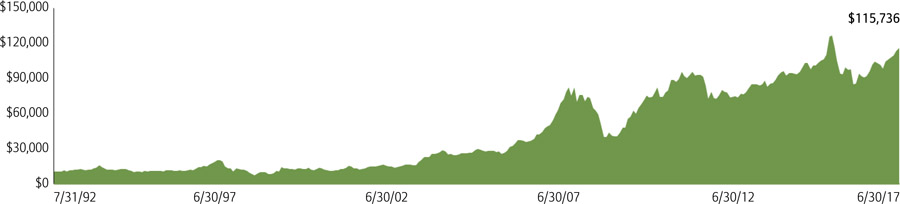
Past performance is not a guide to future returns.
Index Description
MSCI Golden Dragon Index
The MSCI Golden Dragon Index captures the equity market performance of large and mid cap China securities (H shares, B shares, Red-Chips and P-Chips) and non-domestic China securities listed in Hong Kong and Taiwan.
It is not possible to invest directly in an index.
The China Fund, Inc.
Portfolio in Full
|
Sector
|
Company (exchange ticker)
|
Market Price
|
Holding
|
Value US$
|
% of net assets
|
|
Information Technology
|
40.24
|
||||
|
TAIWAN SEMICONDUCTOR MANUFACTURING CO LTD
|
2330
|
208.50
|
4,341,000
|
29,753,402
|
9.21
|
|
TENCENT HOLDINGS LTD
|
700
|
279.20
|
760,900
|
27,215,383
|
8.42
|
|
ALIBABA GROUP HOLDING LTD
|
BABA
|
140.90
|
142,647
|
20,098,962
|
6.22
|
|
HON HAI PRECISION INDUSTRY CO LTD
|
2317
|
117.00
|
2,537,100
|
9,758,077
|
3.02
|
|
LARGAN PRECISION CO LTD
|
3008
|
4,850.00
|
54,000
|
8,609,467
|
2.66
|
|
DELTA ELECTRONICS INC
|
2308
|
166.50
|
1,274,359
|
6,975,042
|
2.16
|
|
DIGITAL CHINA HOLDINGS LTD
|
861
|
6.01
|
7,444,000
|
5,731,289
|
1.77
|
|
ADVANTECH CO LTD
|
2395
|
215.50
|
774,199
|
5,484,546
|
1.70
|
|
BAIDU INC
|
BIDU
|
178.86
|
24,101
|
4,310,705
|
1.33
|
|
PRIMAX ELECTRONICS LTD
|
4915
|
62.40
|
1,985,000
|
4,071,795
|
1.26
|
|
YY INC
|
YY
|
58.03
|
62,990
|
3,655,310
|
1.13
|
|
SEMICONDUCTOR MANUFACTURING INTERNATIONAL CORP
|
981
|
9.05
|
2,470,900
|
2,864,674
|
0.89
|
|
GOLDPAC GROUP LTD
|
3315
|
2.35
|
5,021,000
|
1,511,574
|
0.47
|
|
Financials
|
19.20
|
||||
|
CHINA MERCHANTS BANK CO LTD
|
3968
|
23.55
|
5,723,500
|
17,267,285
|
5.34
|
|
PING AN INSURANCE GROUP CO OF CHINA LTD
|
2318
|
51.45
|
1,911,000
|
12,595,561
|
3.90
|
|
HONG KONG EXCHANGES & CLEARING LTD
|
388
|
201.80
|
419,700
|
10,850,046
|
3.36
|
|
CHINA CONSTRUCTION BANK CORP
|
939
|
6.05
|
10,814,000
|
8,381,335
|
2.59
|
|
CATHAY FINANCIAL HOLDING CO LTD
|
2882
|
50.10
|
2,880,000
|
4,743,195
|
1.47
|
|
FUBON FINANCIAL HOLDING CO LTD
|
2881
|
48.45
|
2,805,000
|
4,467,530
|
1.38
|
|
CITIC SECURITIES CO LTD
|
6030
|
16.14
|
1,810,000
|
3,742,429
|
1.16
|
|
Industrials
|
9.87
|
||||
|
CHINA EVERBRIGHT INTERNATIONAL LTD
|
257
|
9.74
|
5,616,000
|
7,007,410
|
2.17
|
|
CN STATE CONSTRUCTION INTERNATIONAL HOLDINGS LTD
|
3311
|
13.36
|
2,906,000
|
4,973,631
|
1.54
|
|
CK HUTCHISON HOLDINGS LTD
|
1
|
98.00
|
310,000
|
3,891,878
|
1.20
|
|
QINGDAO PORT INTERNATIONAL CO LTD
|
6198
|
4.50
|
6,077,000
|
3,503,267
|
1.08
|
|
BEIJING ENTERPRISES HOLDINGS LTD
|
392
|
37.65
|
704,500
|
3,397,954
|
1.05
|
|
KING SLIDE WORKS CO LTD
|
2059
|
427.00
|
239,000
|
3,354,799
|
1.04
|
|
JARDINE MATHESON HOLDINGS LTD
|
J36
|
64.20
|
51,100
|
3,280,620
|
1.02
|
|
ZHUZHOU CRRC TIMES ELECTRIC CO LTD
|
3898
|
38.30
|
505,300
|
2,479,245
|
0.77
|
|
Telecom Services
|
9.08
|
||||
|
CHINA UNICOM HONG KONG LTD
|
762
|
11.60
|
7,466,000
|
11,094,748
|
3.43
|
|
CHINA MOBILE LTD
|
941
|
82.85
|
709,000
|
7,525,064
|
2.33
|
|
PCCW LTD
|
8
|
4.44
|
8,623,000
|
4,904,704
|
1.52
|
|
CHUNGHWA TELECOM CO LTD
|
2412
|
108.00
|
846,000
|
3,003,550
|
0.93
|
|
HUTCHISON TELECOMMUNICATIONS HK HOLDINGS LTD
|
215
|
2.75
|
7,974,000
|
2,809,185
|
0.87
|
|
Real Estate
|
6.52
|
||||
|
SUN HUNG KAI PROPERTIES LTD
|
16
|
114.70
|
1,132,000
|
16,633,410
|
5.15
|
|
CHINA OVERSEAS LAND & INVESTMENT LTD
|
688
|
22.85
|
1,516,000
|
4,437,689
|
1.37
|
|
Consumer Discretionary
|
6.02
|
||||
|
JD.COM
|
JD
|
39.22
|
180,193
|
7,067,169
|
2.19
|
|
QINGLING MOTORS CO LTD
|
1122
|
2.51
|
14,816,000
|
4,764,048
|
1.47
|
|
SANDS CHINA LTD
|
1928
|
35.75
|
810,800
|
3,713,310
|
1.15
|
|
CITIGROUP GLOBAL MARKETS HOLD
(exch. for CHINA CYTS TOURS HOLDIN)
|
N/A
|
3.11
|
888,827
|
2,764,252
|
0.86
|
|
LI & FUNG LTD
|
494
|
2.84
|
3,128,000
|
1,138,037
|
0.35
|
|
Energy
|
2.21
|
||||
|
CNOOC LTD
|
883
|
8.55
|
4,815,000
|
5,273,924
|
1.63
|
|
CHINA OILFIELD SERVICES LTD
|
2883
|
6.26
|
2,338,000
|
1,874,953
|
0.58
|
|
Consumer Staples
|
1.53
|
||||
|
CHINA MENGNIU DAIRY CO LTD
|
2319
|
15.30
|
1,508,000
|
2,955,726
|
0.91
|
|
VINDA INTERNATIONAL HOLDINGS LTD
|
3331
|
15.80
|
984,000
|
1,991,699
|
0.62
|
The China Fund, Inc.
Portfolio in Full
|
Sector
|
Company (exchange ticker)
|
Market Price
|
Holding
|
Value US$
|
% of net assets
|
|
Utilities
|
1.08
|
||||
|
CHINA RESOURCES POWER HOLDINGS CO LTD
|
836
|
15.32
|
1,778,000
|
3,489,490
|
1.08
|
|
Health Care
|
1.07
|
||||
|
CSPC PHARMACEUTICAL GROUP LTD
|
1093
|
11.40
|
2,364,000
|
3,452,421
|
1.07
|
|
Materials
|
0.23
|
||||
|
TIANGONG INTERNATIONAL CO LTD
|
826
|
0.68
|
8,612,000
|
750,213
|
0.23
|
Source: State Street Bank and Trust Company, IDS GmbH - Analysis and Reporting Services, a subsidiary of Allianz SE.
Important Information:
Holdings are subject to change daily. The Fund seeks to achieve its objective through investment in the equity securities of companies and other entities with significant assets, investments, production activities, trading or other business interests in China or which derive a significant part of their revenue from China. Investing in non-U.S. securities entails additional risks, including political and economic risk and the risk of currency fluctuations, as well as lower liquidity. These risks, which can result in greater price volatility, will generally be enhanced in less diversified funds that concentrate investments in a particular geographic region.
The information contained herein has been obtained from sources believed to be reliable but Allianz Global Investors U.S. LLC and its affiliates do not warrant the information to be accurate, complete or reliable. The opinions expressed herein are subject to change at any time and without notice. Past performance is not indicative of future results. This material is not intended as an offer or solicitation for the purchase or sale of any financial instrument. Investors should consider the investment objectives, risks, charges and expenses of any mutual fund carefully before investing. This and other information is contained in the Fund's annual and semiannual reports, proxy statement and other Fund information, which may be obtained by contacting your financial advisor or visiting the Fund's website at www.chinafundinc.com. This information is unaudited and is intended for informational purposes only. It is presented only to provide information on the Fund's holdings, performance and strategies. The Fund is a closed-end exchange traded management investment company. This material is presented only to provide information and is not intended for trading purposes. Closed-end funds, unlike open-end funds, are not continuously offered. After the initial public offering by a closed-end fund, its shares can be purchased and sold on the open market through a stock exchange, where shares may trade at a premium or a discount. The market price of holdings is subject to change daily.
P/E is a ratio of security price to earnings per share. Typically, an undervalued security is characterized by a low P/E ratio, while an overvalued security is characterized by a high P/E ratio. P/B is a ratio of the current stock price to the book value. This is used to identify undervalued stocks. Dividend yield is the annual percentage of return earned by an investor on a common or preferred stock. The average dividend yield is the dividend rate divided by current share price.
©2017 Allianz Global Investors Distributors LLC.
|
Investment Products: Not FDIC Insured | May Lose Value | Not Bank Guaranteed
|
FS-CHN-0617
|