Attached files
| file | filename |
|---|---|
| EX-99.1 - EX-99.1 - VALMONT INDUSTRIES INC | a17-18166_1ex99d1.htm |
| 8-K - 8-K - VALMONT INDUSTRIES INC | a17-18166_18k.htm |
Exhibit 99.2
2Q 2017 Earnings Call Presentation

2 These slides contain (and the accompanying oral discussion will contain) “forward-looking statements” within the meaning of the Private Securities Litigation Reform Act of 1995. Such statements involve known and unknown risks. uncertainties and other factors that could cause the actual results of the Company to differ materially from the results expressed or implied by such statements. including general economic and business conditions. conditions affecting the industries served by the Company and its subsidiaries. conditions affecting the Company’s customers and suppliers. competitor responses to the Company’s products and services. the overall market acceptance of such products and services. the integration of acquisitions and other factors disclosed in the Company’s periodic reports filed with the Securities and Exchange Commission. Consequently such forward-looking statements should be regarded as the Company’s current plans. estimates and beliefs. The Company does not undertake and specifically declines any obligation to publicly release the results of any revisions to these forward-looking statements that may be made to reflect any future events or circumstances after the date of such statements or to reflect the occurrence of anticipated or unanticipated events. Forward-looking Statement Disclosure
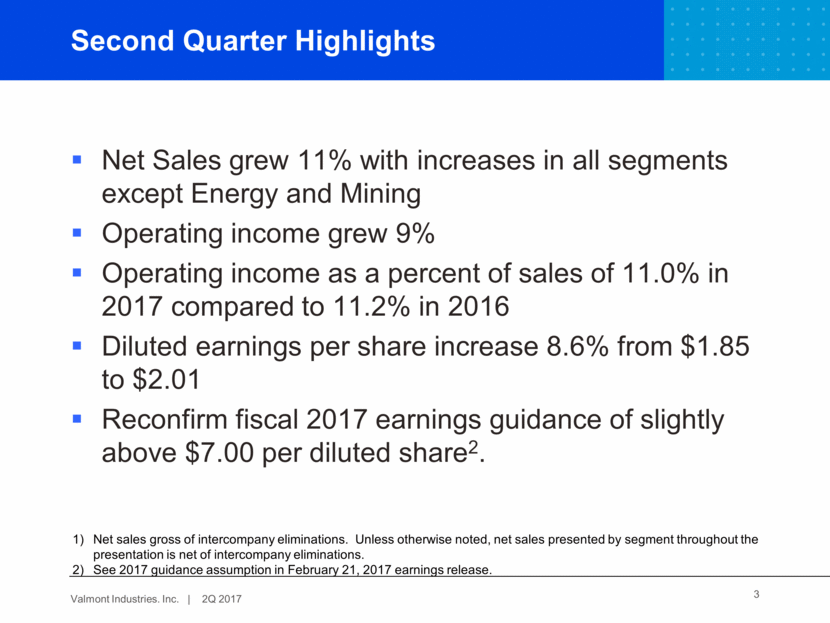
3 Net Sales grew 11% with increases in all segments except Energy and Mining Operating income grew 9% Operating income as a percent of sales of 11.0% in 2017 compared to 11.2% in 2016 Diluted earnings per share increase 8.6% from $1.85 to $2.01 Reconfirm fiscal 2017 earnings guidance of slightly above $7.00 per diluted share2. Second Quarter Highlights Net sales gross of intercompany eliminations. Unless otherwise noted, net sales presented by segment throughout the presentation is net of intercompany eliminations. See 2017 guidance assumption in February 21, 2017 earnings release.
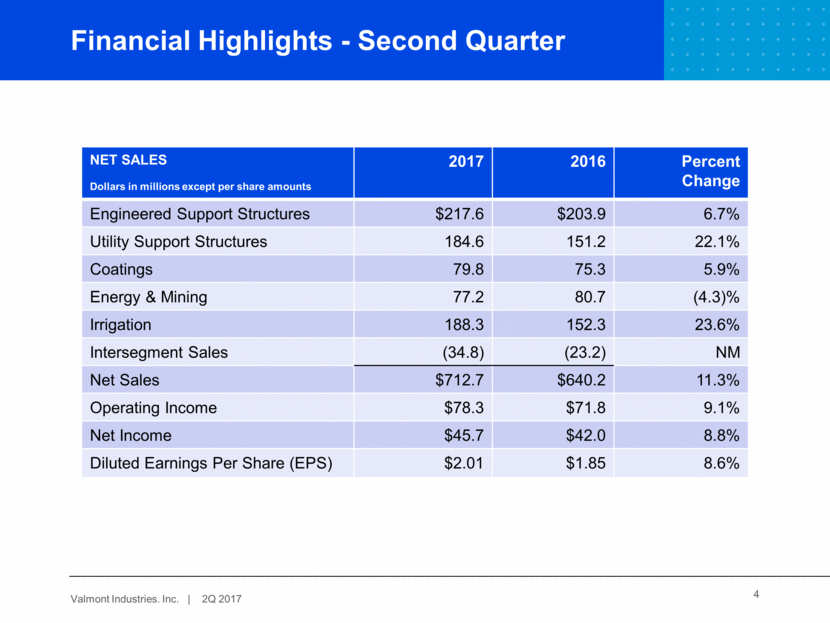
4 NET SALES Dollars in millions except per share amounts 2017 2016 Percent Change Engineered Support Structures $217.6 $203.9 6.7% Utility Support Structures 184.6 151.2 22.1% Coatings 79.8 75.3 5.9% Energy & Mining 77.2 80.7 (4.3)% Irrigation 188.3 152.3 23.6% Intersegment Sales (34.8) (23.2) NM Net Sales $712.7 $640.2 11.3% Operating Income $78.3 $71.8 9.1% Net Income $45.7 $42.0 8.8% Diluted Earnings Per Share (EPS) $2.01 $1.85 8.6% Financial Highlights - Second Quarter
5 Dollars in millions Operating Income 2Q 2017 Operating Income2Q 2016 Increase /Decrease Operating Income Percent 2Q 2017 Operating Income Percent 2Q 2016 Engineered SupportStructures $20.2 $20.8 (2.9%) 9.3% 10.2% Utility Support Structures 20.2 17.6 14.8% 10.9% 11.6% Coatings 12.1 14.0 (13.6%) 15.2% 18.6% Energy & Mining 3.9 3.3 18.2% 5.1% 4.1% Irrigation 34.7 31.0 11.7% 18.4% 20.4% LIFO adjustment (0.4) (3.1) NM Corporate (12.4) (11.8) (3.4%) Consolidated Operating Income $78.3 $71.8 9.1% 11.0% 11.2% Financial Highlights - Operating Income
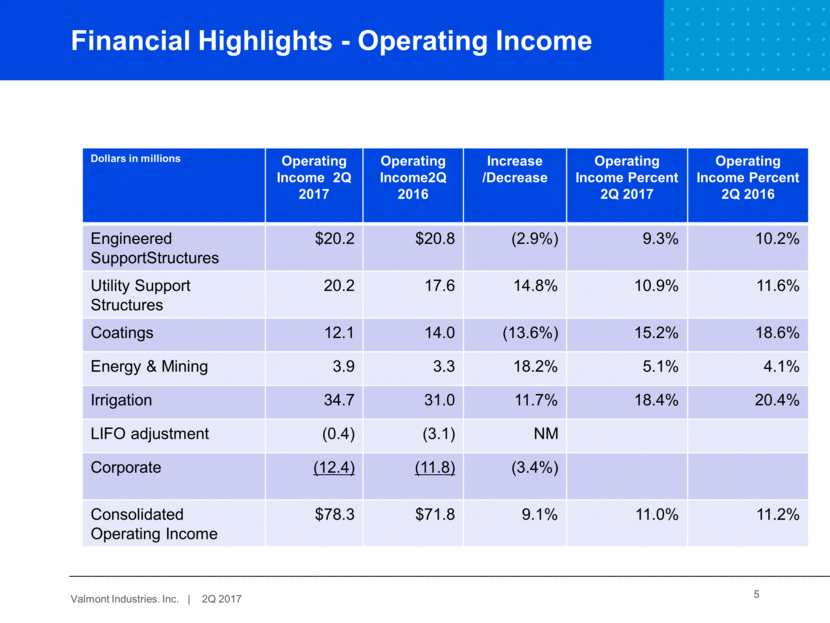
6 Engineered Support Structures – 2nd Qtr. 2016 Net Sales $195.8 Volume 9.1 Pricing/Mix 0.3 Acquisitions - Currency Translation (4.1) 2017 Net Sales $201.1 Slightly lower lighting and traffic sales in North America. EMEA markets remain sluggish due to lack of infrastructure investment Wireless communication sales increase globally, recovery in North American markets Margin compression due to rising steel costs in some cases not being fully recovered by price, particularly compared to last year when purchases of low cost steel in the first quarter translated into better second quarter margins. $ in millions Sales presented net of intersegment sales $20.2 $20.8 $- $5 $10 $15 $20 $25 Operating Income 2017 2016 $201.1 $195.8 $- $50 $100 $150 $200 $250 Net Sales 2017 2016
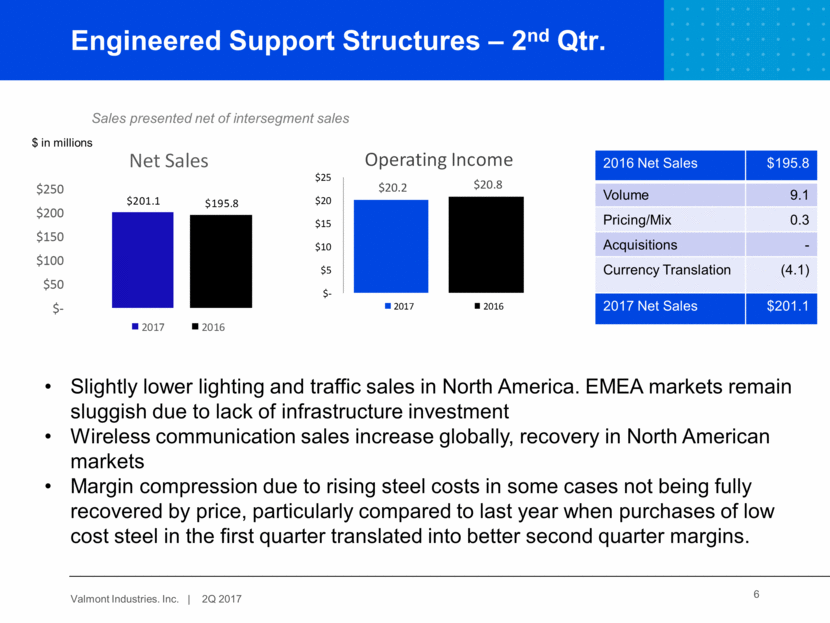
7 Utility Support Structures – 2nd Qtr. 2016 Net Sales $151.2 Volume 18.5 Pricing/Mix 13.9 Acquisitions - Currency Translation - 2017 Net Sales $183.6 Significant sales and volume increases. Some of the sales increase reflect customer pricing tied to steel cost increases Operating income increased due to the higher sales volumes partially offset by unfavorable product mix. Sales presented net of intersegment sales $ in millions $183.6 $151.2 $50 $75 $100 $125 $150 $175 $200 Net Sales 2017 2016 $20.2 $17.6 $- $5 $10 $15 $20 $25 Operating Income 2017 2016
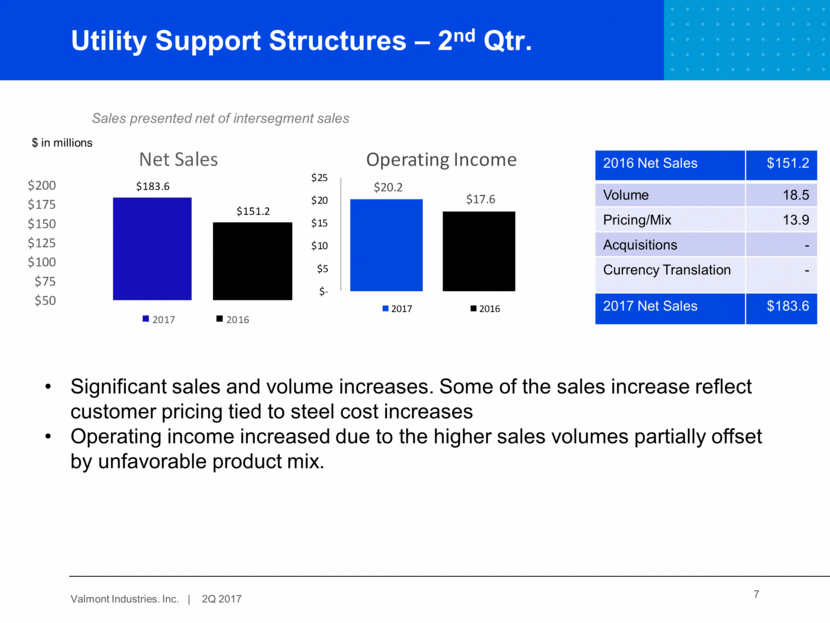
8 Coatings – 2nd Qtr. 2016 Net Sales $63.4 Volume (3.1) Pricing/Mix 4.8 Acquisitions - Currency Translation (0.5) 2017 Net Sales $64.6 Sales decreased in North America, less external and higher intercompany volumes Volumes increase in Asia-Pacific region—pricing recovery also achieved Reduced operating income attributed to lower external volumes and lagging zinc cost recovery in North America. Sales presented net of intersegment sales $ in millions $64.6 $63.4 $- $20 $40 $60 $80 Net Sales 2017 2016 $12.1 $14.0 $- $10 $20 Operating Income 2017 2016
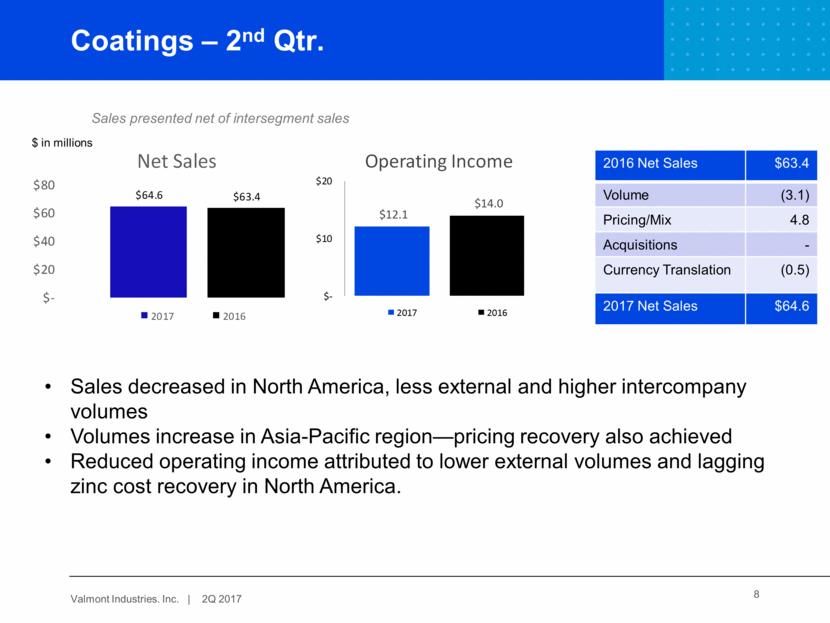
9 Energy and Mining – 2nd Qtr. 2016 Net Sales $79.3 Volume (3.1) Pricing/Mix 1.8 Acquisitions - Currency Translation (0.8) 2017 Net Sales $77.2 Access and Offshore sales decreased slightly Operating income increased with lower SG&A expense Outlook for unfavorable second-half comparisons—further weakness in oil & gas end markets, less favorable steel cost environment Sales presented net of intersegment sales $ in millions $77.2 $79.3 $50 $60 $70 $80 $90 Net Sales 2017 2016 $3.9 $3.3 $- $5 Operating Income 2017 2016
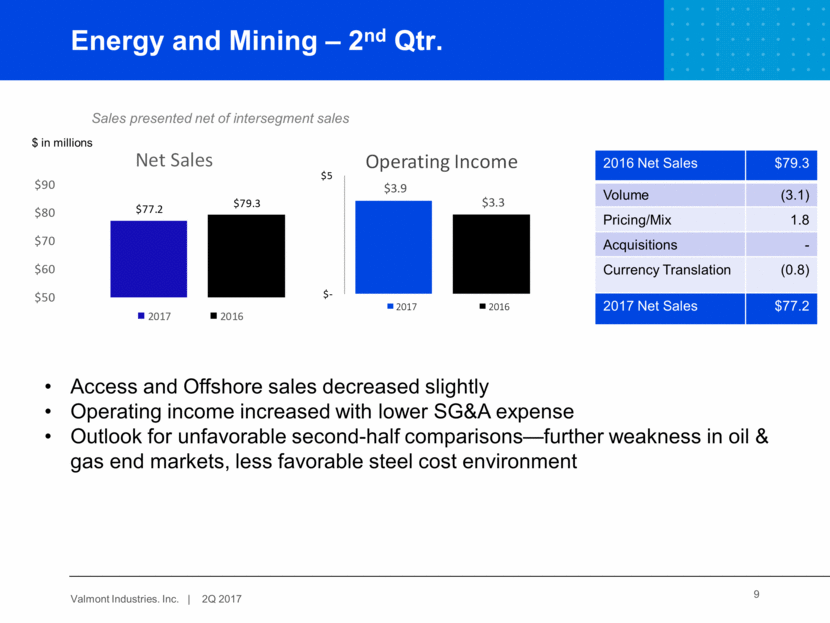
10 Irrigation – 2nd Qtr. 2016 Net Sales $150.5 Volume 29.2 Pricing/Mix 3.8 Acquisitions - Currency Translation 2.7 2017 Net Sales $186.2 International markets benefit from projects and stronger Latin American demand North America sales increased on stabilizing markets and uptick in markets outside the corn belt Service parts sales increase as irrigation machines log more hours than last year Operating income higher, operating income percent pressured by raw material costs Sales presented net of intersegment sales $ in millions $186.2 $150.5 $- $50 $100 $150 $200 Net Sales 2017 2016 $34.7 $31.0 $- $10 $20 $30 $40 Operating Income 2017 2016
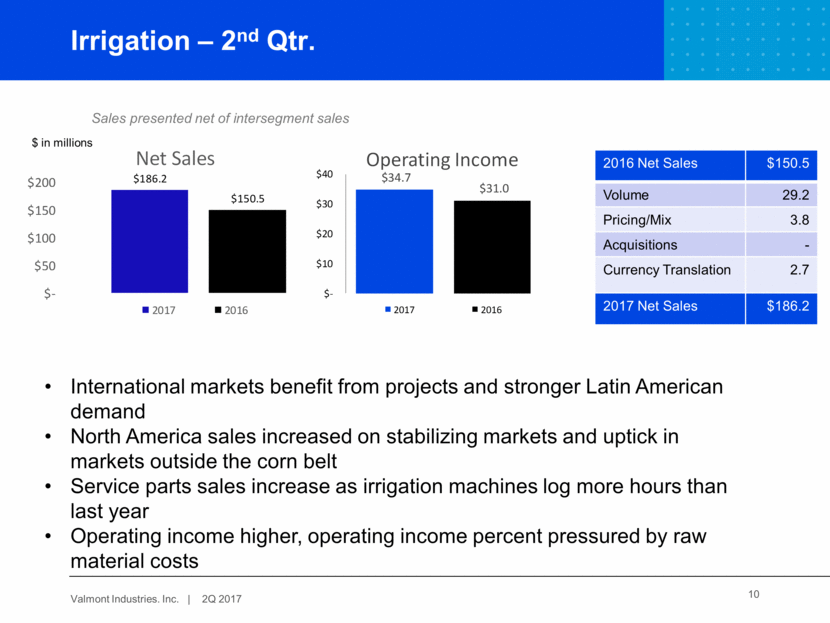
2Q 2017 Actual Credit Rating 11 Balance Sheet – 2nd Qtr. 2017 Goal: Maintain Investment-grade rating; Keep Debt/EBITDA from 1.5 to 2.5x Cash At 7/1/2017 $448M ($350M Ex. US) Total Debt $755M Debt/Adjusted EBITDA* 2.25 Adjusted S&P BBB+ Negative Moody’s Baa3 Stable * See the Company’s calculation at end of presentation. Debt Maturities – in Millions
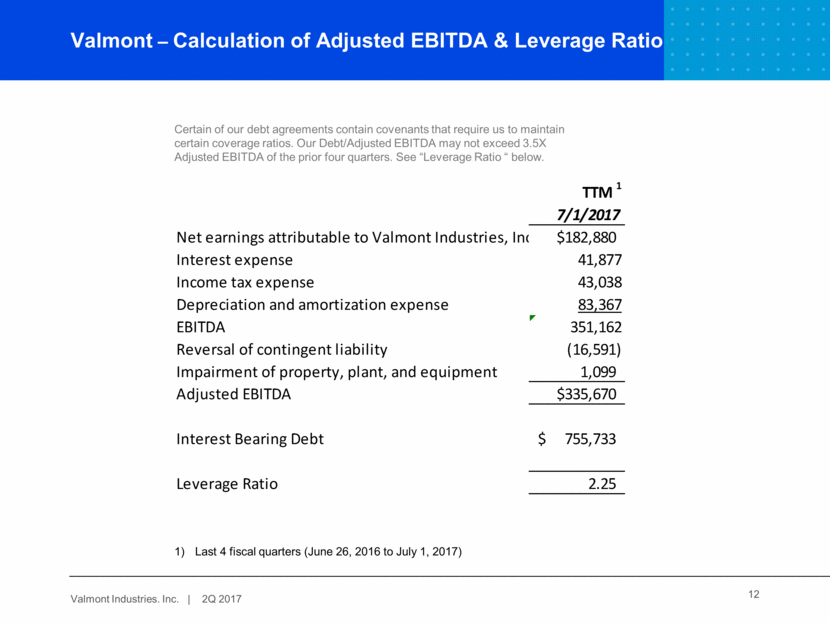
Valmont – Calculation of Adjusted EBITDA & Leverage Ratio 12 Last 4 fiscal quarters (June 26, 2016 to July 1, 2017) Certain of our debt agreements contain covenants that require us to maintain certain coverage ratios. Our Debt/Adjusted EBITDA may not exceed 3.5X Adjusted EBITDA of the prior four quarters. See “Leverage Ratio “ below. TTM 1 7/1/2017 Net earnings attributable to Valmont Industries, Inc. $182,880 Interest expense 41,877 Income tax expense 43,038 Depreciation and amortization expense 83,367 EBITDA 351,162 Reversal of contingent liability (16,591) Impairment of property, plant, and equipment 1,099 Adjusted EBITDA $335,670 Interest Bearing Debt $ 755,733 Leverage Ratio 2.25
