Attached files
| file | filename |
|---|---|
| EX-99.1 - EX-99.1 - Select Energy Services, Inc. | a17-18116_1ex99d1.htm |
| EX-4.1 - EX-4.1 - Select Energy Services, Inc. | a17-18116_1ex4d1.htm |
| EX-2.1 - EX-2.1 - Select Energy Services, Inc. | a17-18116_1ex2d1.htm |
| 8-K - 8-K - Select Energy Services, Inc. | a17-18116_18k.htm |
Exhibit 99.2
July 2017 Merger with Rockwater Energy Solutions Exhibit 99.2

Disclaimer Statement 2 Cautionary Statement Regarding Forward Looking Statements All statements in this communication other than statements of historical facts are forward-looking statements which contain our current expectations about our future results. We have attempted to identify any forward-looking statements by using words such as "expect", "will", "estimate" and other similar expressions. Although we believe that the expectations reflected, and the assumptions or bases underlying our forward-looking statements are reasonable, we can give no assurance that such expectations will prove to be correct. Such statements are not guarantees of future performance or events and are subject to known and unknown risks and uncertainties that could cause our actual results, events or financial positions to differ materially from those included within or implied by such forward-looking statements. Factors that could cause our actual results to differ materially from the results contemplated by such forward-looking statements include, but are not limited to the factors discussed or referenced in the "Risk Factors" section of the prospectus we filed with the U.S. Securities and Exchange Commission on April 24, 2017, relating to our recently completed initial public offering. You should not place undue reliance on our forward-looking statements. Any forward-looking statement speaks only as of the date on which such statement is made, and we undertake no obligation to publicly update or revise any forward-looking statement, whether as a result of new information, future events, changed circumstances or otherwise, unless required by law. Additional Information and Where to Find It In connection with the proposed transaction, Select Energy Services, Inc. (the “Company”) intends to file relevant materials with the Securities and Exchange Commission (the “SEC”), including the Company’s information statement in preliminary and definitive form. Stockholders are advised to read all relevant documents filed with the SEC, including the Company’s information statement, because they will contain important information about the proposed transaction. These documents will be available at no charge on the SEC’s website at www.sec.gov. In addition, documents will also be available for free from the Company by contacting the Company at 1820 N I-35, Gainesville, TX 76240 or (940)-668-1818.
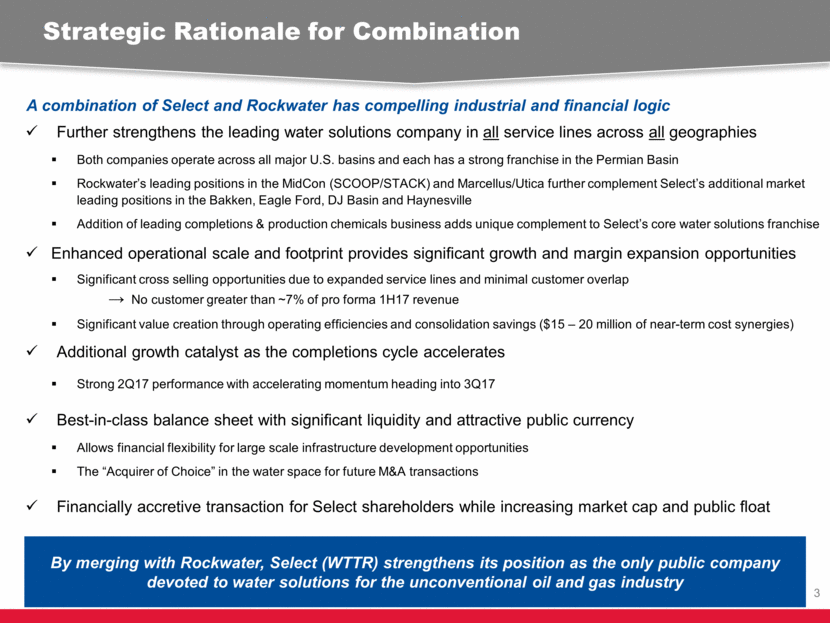
By merging with Rockwater, Select (WTTR) strengthens its position as the only public company devoted to water solutions for the unconventional oil and gas industry A combination of Select and Rockwater has compelling industrial and financial logic Strategic Rationale for Combination 3 Further strengthens the leading water solutions company in all service lines across all geographies Both companies operate across all major U.S. basins and each has a strong franchise in the Permian Basin Rockwater’s leading positions in the MidCon (SCOOP/STACK) and Marcellus/Utica further complement Select’s additional market leading positions in the Bakken, Eagle Ford, DJ Basin and Haynesville Addition of leading completions & production chemicals business adds unique complement to Select’s core water solutions franchise Enhanced operational scale and footprint provides significant growth and margin expansion opportunities Significant cross selling opportunities due to expanded service lines and minimal customer overlap No customer greater than ~7% of pro forma 1H17 revenue Significant value creation through operating efficiencies and consolidation savings ($15 – 20 million of near-term cost synergies) Additional growth catalyst as the completions cycle accelerates Strong 2Q17 performance with accelerating momentum heading into 3Q17 Best-in-class balance sheet with significant liquidity and attractive public currency Allows financial flexibility for large scale infrastructure development opportunities The “Acquirer of Choice” in the water space for future M&A transactions Financially accretive transaction for Select shareholders while increasing market cap and public float
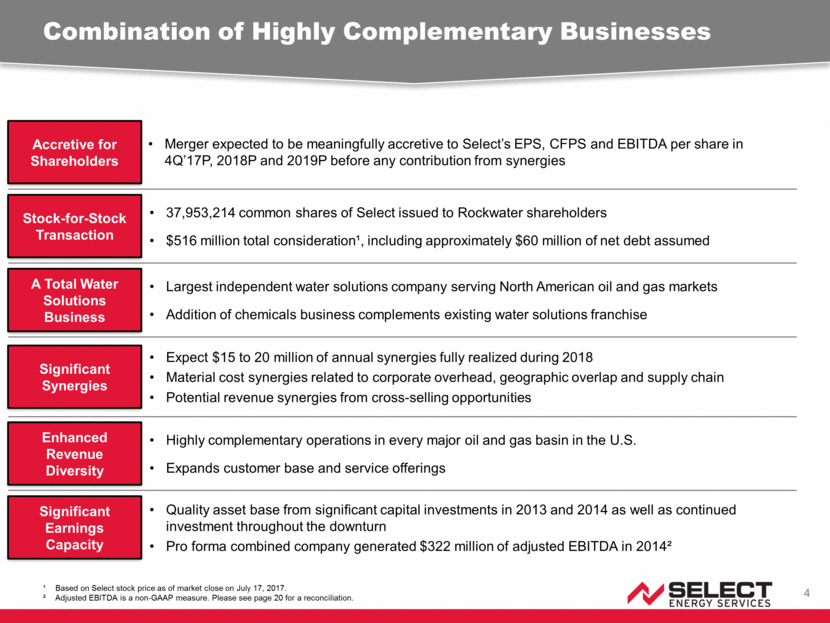
Combination of Highly Complementary Businesses 4 Merger expected to be meaningfully accretive to Select’s EPS, CFPS and EBITDA per share in 4Q’17P, 2018P and 2019P before any contribution from synergies Accretive for Shareholders 37,953,214 common shares of Select issued to Rockwater shareholders $516 million total consideration¹, including approximately $60 million of net debt assumed Stock-for-Stock Transaction Largest independent water solutions company serving North American oil and gas markets Addition of chemicals business complements existing water solutions franchise A Total Water Solutions Business Expect $15 to 20 million of annual synergies fully realized during 2018 Material cost synergies related to corporate overhead, geographic overlap and supply chain Potential revenue synergies from cross-selling opportunities Significant Synergies Highly complementary operations in every major oil and gas basin in the U.S. Expands customer base and service offerings Enhanced Revenue Diversity Quality asset base from significant capital investments in 2013 and 2014 as well as continued investment throughout the downturn Pro forma combined company generated $322 million of adjusted EBITDA in 2014² Significant Earnings Capacity ¹ Based on Select stock price as of market close on July 17, 2017. ² Adjusted EBITDA is a non-GAAP measure. Please see page 20 for a reconciliation.
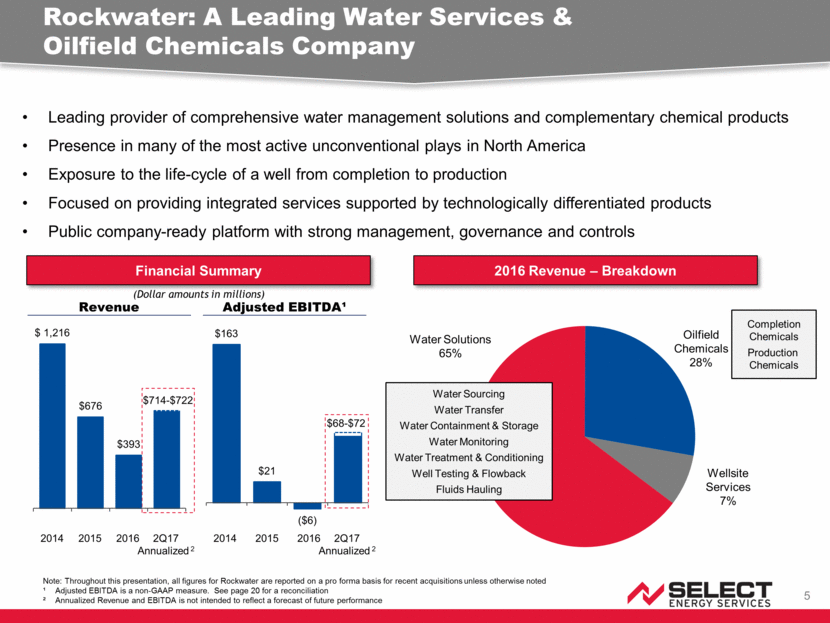
Rockwater: A Leading Water Services & Oilfield Chemicals Company 5 Leading provider of comprehensive water management solutions and complementary chemical products Presence in many of the most active unconventional plays in North America Exposure to the life-cycle of a well from completion to production Focused on providing integrated services supported by technologically differentiated products Public company-ready platform with strong management, governance and controls Note: Throughout this presentation, all figures for Rockwater are reported on a pro forma basis for recent acquisitions unless otherwise noted ¹ Adjusted EBITDA is a non-GAAP measure. See page 20 for a reconciliation ² Annualized Revenue and EBITDA is not intended to reflect a forecast of future performance 2016 Revenue – Breakdown Financial Summary Revenue Adjusted EBITDA¹ (Dollar amounts in millions) Completion Chemicals Production Chemicals Water Sourcing Water Transfer Water Containment & Storage Water Monitoring Water Treatment & Conditioning Well Testing & Flowback Fluids Hauling 2014 2015 2016 2Q17 Annualized 2 2014 2015 2016 2Q17 Annualized 2 Water Solutions 65% Oilfield Chemicals 28% Wellsite Services 7% $676 $393 $ 1,216 $714 - $722 $163 $21 ($6) $68 - $72
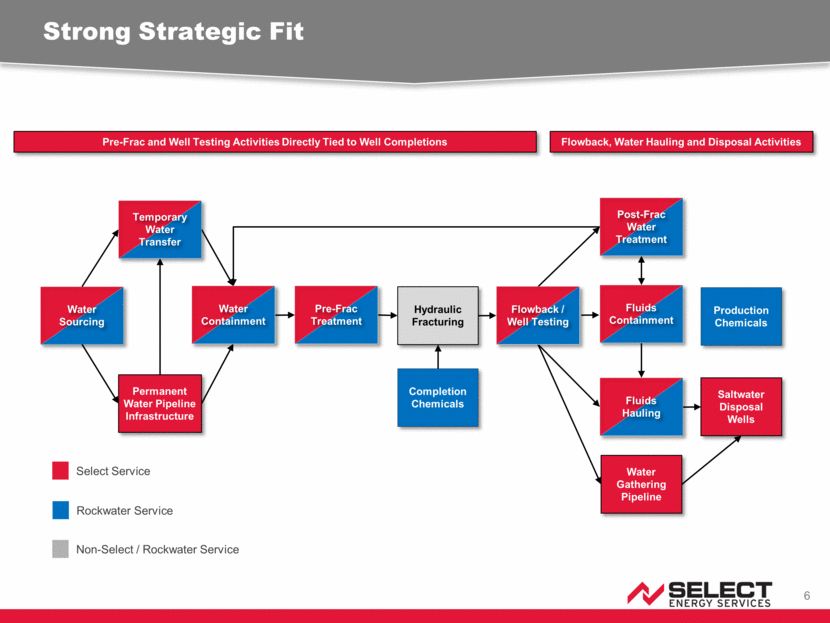
Water Sourcing Strong Strategic Fit 6 Permanent Water Pipeline Infrastructure Saltwater Disposal Wells Hydraulic Fracturing Water Gathering Pipeline Completion Chemicals Production Chemicals Pre-Frac and Well Testing Activities Directly Tied to Well Completions Flowback, Water Hauling and Disposal Activities Select Service Non-Select / Rockwater Service Rockwater Service Temporary Water Transfer Water Containment Pre-Frac Treatment Flowback / Well Testing Fluids Containment Post-Frac Water Treatment Fluids Hauling
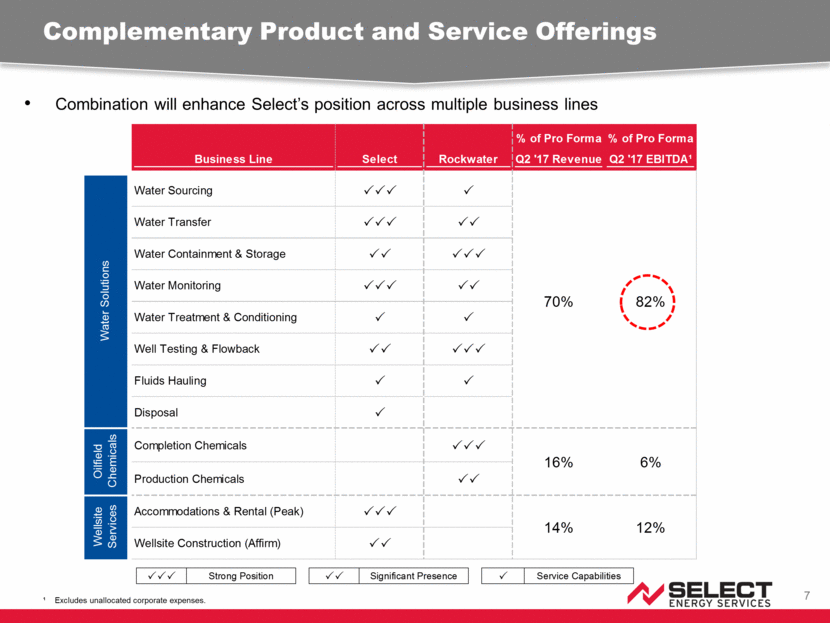
Complementary Product and Service Offerings 7 Combination will enhance Select’s position across multiple business lines ¹ Excludes unallocated corporate expenses. % of Pro Forma % of Pro Forma Business Line Select Rockwater Q2 '17 Revenue Q2 '17 EBITDA¹ Water Sourcing PPP P Water Transfer PPP PP Water Containment & Storage PP PPP Water Monitoring PPP PP Water Treatment & Conditioning P P Well Testing & Flowback PP PPP Fluids Hauling P P Disposal P Completion Chemicals PPP Production Chemicals PP Accommodations & Rental (Peak) PPP Wellsite Construction (Affirm) PP 82% 6% Wellsite Services Oilfield Chemicals Water Solutions 16% 70% 14% 12% PPP Strong Position PP Significant Presence P Service Capabilities
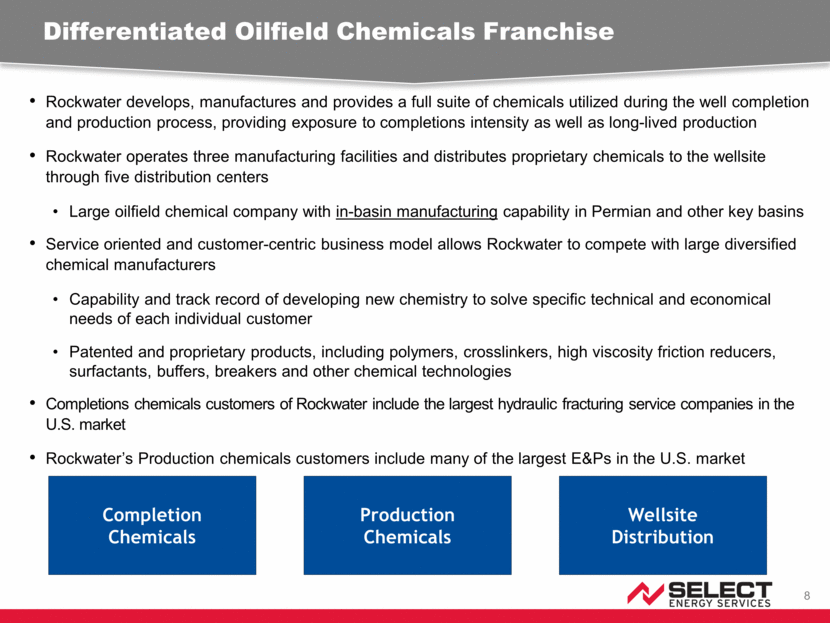
Rockwater develops, manufactures and provides a full suite of chemicals utilized during the well completion and production process, providing exposure to completions intensity as well as long-lived production Rockwater operates three manufacturing facilities and distributes proprietary chemicals to the wellsite through five distribution centers Large oilfield chemical company with in-basin manufacturing capability in Permian and other key basins Service oriented and customer-centric business model allows Rockwater to compete with large diversified chemical manufacturers Capability and track record of developing new chemistry to solve specific technical and economical needs of each individual customer Patented and proprietary products, including polymers, crosslinkers, high viscosity friction reducers, surfactants, buffers, breakers and other chemical technologies Completions chemicals customers of Rockwater include the largest hydraulic fracturing service companies in the U.S. market Rockwater’s Production chemicals customers include many of the largest E&Ps in the U.S. market Differentiated Oilfield Chemicals Franchise 8 Completion Chemicals Production Chemicals Wellsite Distribution
Attractive Relative Valuation 9 Ratio of Enterprise Value to Tangible Adjusted Book Value¹,² ¹ Source: Capital IQ. As of July 17, 2017. ² Tangible adjusted book value defined as shareholders’ equity plus net debt less goodwill and other intangible assets. ³ Tangible adjusted book values as of May 31, 2017. Pro forma excluding potential purchase price accounting adjustments. 4 Median result of CEU, FTK and NR. 5 Median result of FMSA, SND and SLCA. 6 Median result of FRAC, NCSM, PUMP, RES, SOI, SPN and TUSK. Excludes companies that recently emerged from bankruptcy. 2.0x 2.2x 2.3x 2.6x 2.6x 4.9x 0.0x 1.0x 2.0x 3.0x 4.0x 5.0x Rockwater³ Pro Forma³ Select³ Frac Sand Companies ? OFS Chemicals ? SMID - Cap Completions Exposure ?
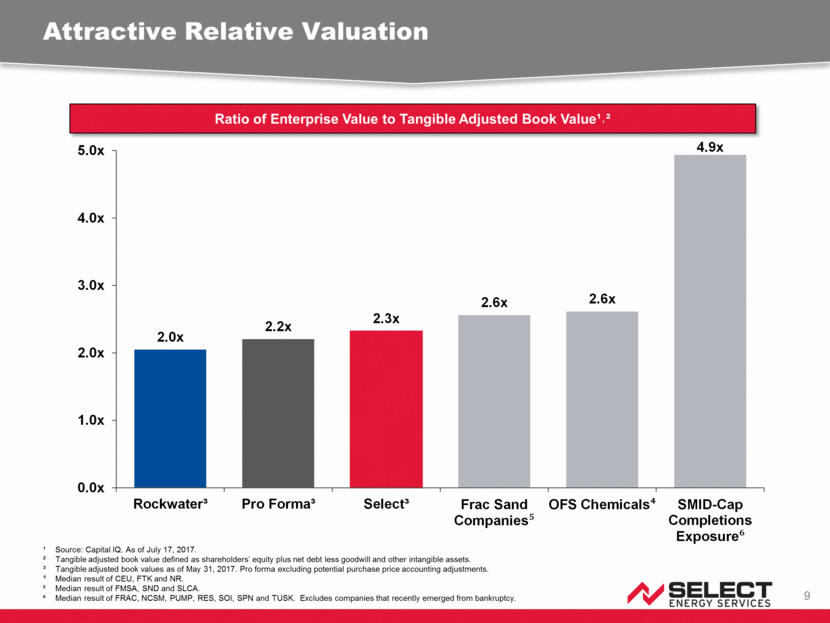
Q2 2017 Preliminary Financial Results 10 Represents sequential revenue and incremental adjusted EBITDA margin growth vs Q1 2017 Gross Profit before any depreciation and amortization Adjusted EBITDA is a non-GAAP measure. See page 20 for a reconciliation. Excludes synergies. ($ in millions) Strong Q2 results for both companies driven by continued ramp in completions activity, with significant momentum heading into the third quarter Strong incremental margin growth despite limited contribution from improved pricing in the quarter Select Rockwater Pro Forma Combined Low High Low High Low High Revenue 132 $ 134 $ 178 $ 180 $ 310 $ 314 $ Revenue Growth % 1 32% 34% 35% 36% 34% 35% Gross Profit 2 34 $ 36 $ 29 $ 31 $ 63 $ 67 $ Gross Margin % 26% 27% 16% 17% 20% 21% Adj. EBITDA 3 26 $ 27 $ 17 $ 18 $ 43 $ 45 $ Adj. EBITDA % 20% 20% 10% 10% 14% 14% Incremental Margins 1 38% 39% 30% 31% 33% 34%
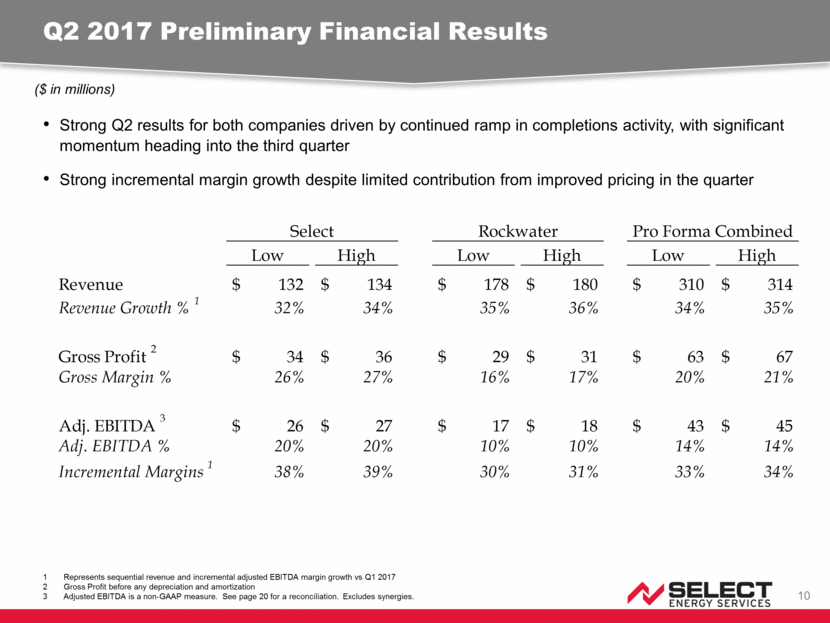
Expansion of Earnings Base and Capacity 11 Source: Capital IQ. As of July 17, 2017. Annualized EBITDA is not intended to reflect a forecast of future performance. Total enterprise value WTTR and Pro Forma based on midpoint of Q2 range ($ in millions) Q2 ‘17P Annualized EBITDA¹ (Wall Street Consensus Estimates, Except WTTR; Pro Forma excluding synergies) 2014 EBITDA¹ (Pro Forma excluding synergies) RES SLCA Pro Forma FMSA TTI SPN WTTR FRAC HCLP CJ CEU PUMP TUSK BAS NR SOI NCSM FTK Mkt. Cap. 4,610 $ 2,777 $ 1,282 $ 840 $ 334 $ 1,674 $ 826 $ 1,824 $ 915 $ 2,251 $ 1,271 $ 1,196 $ 730 $ 742 $ 664 $ 557 $ 1,008 $ 532 $ TEV 2 4,506 2,631 1,277 1,487 1,194 2,808 761 1,892 1,041 2,136 1,536 1,128 721 928 751 559 1,097 580 TEV/EBITDA 3 13.0x 8.7x 7.2x 9.1x 8.1x 25.1x 7.2x 19.2x 11.5x 23.9x 19.7x 15.5x 12.6x 16.7x 17.6x 21.2x n/m n/m $1,217 $624 $394 $322 $319 $247 $243 $167 $160 $150 $148 $144 $94 $47 $0 $500 $1,000 $1,500 SPN RES FMSA Pro Forma BAS SLCA CJ NR WTTR CEU TTI HCLP FTK FRAC NCSM PUMP SOI TUSK n/a n/a n/a n/a $346 $303 $163 $148 $112 $99 $91 $89 $78 $73 $55 $43 $26 $2 $0 $0 $100 $200 $300 $400 RES SLCA Pro Forma FMSA TTI SPN WTTR FRAC HCLP CJ CEU PUMP TUSK BAS NR SOI NCSM FTK $172 - $180 $57 $104 - $108
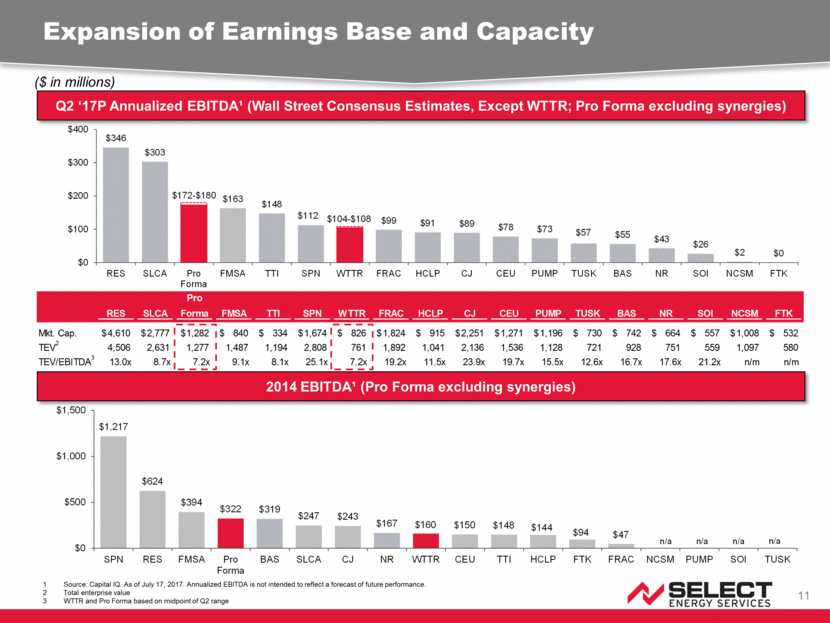
Revenue Mix and Geographic Diversification 12 Source: Management estimates based on midpoint of projected range Regional breakout of estimated revenue for U.S. Water Solutions segment Select Standalone Q2’ 2017 Pro Forma Combined Q2’ 2017 Select Revenue By Business Segment¹ Water Solutions Oilfield Chemicals Wellsite Services Total Revenue: $133 Million Total Revenue: $312 Million Pro Forma Combined Q2’ 2017 Select Revenue By Region¹ Revenue by Region 2 80% 20% 70% 16% 14% Region % of Total Permian 32% Mid-Con 18% Eagle Ford 14% Bakken 13% Rockies 11% Northeast 8% Haynesville 4%
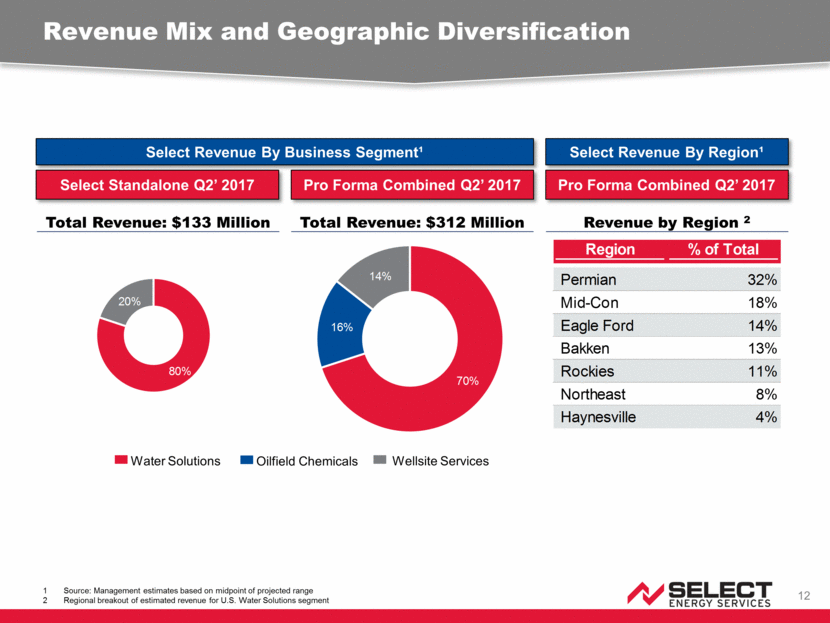
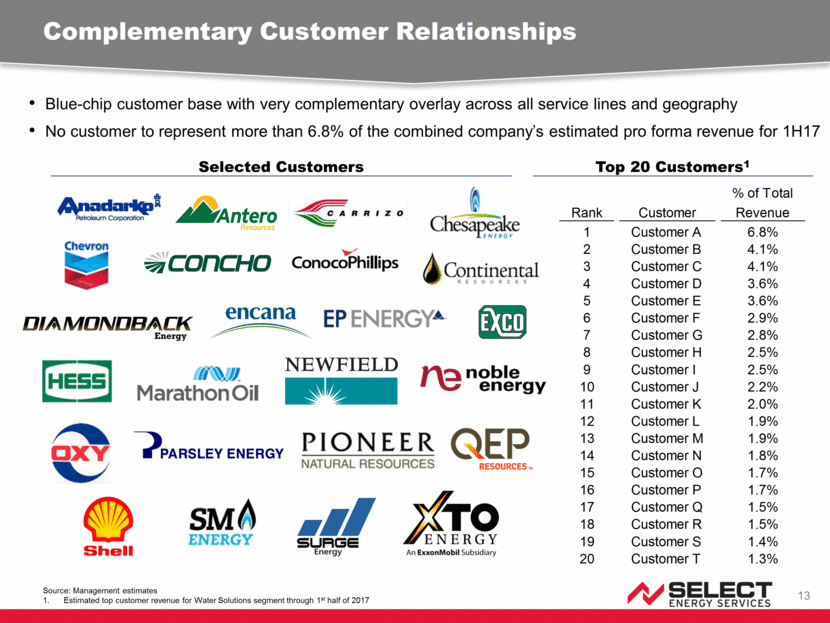
Complementary Customer Relationships 13 Source: Management estimates Estimated top customer revenue for Water Solutions segment through 1st half of 2017 Blue-chip customer base with very complementary overlay across all service lines and geography No customer to represent more than 6.8% of the combined company’s estimated pro forma revenue for 1H17 Selected Customers Top 20 Customers1 Rank Customer % of Total Revenue 1 Customer A 6.8% 2 Customer B 4.1% 3 Customer C 4.1% 4 Customer D 3.6% 5 Customer E 3.6% 6 Customer F 2.9% 7 Customer G 2.8% 8 Customer H 2.5% 9 Customer I 2.5% 10 Customer J 2.2% 11 Customer K 2.0% 12 Customer L 1.9% 13 Customer M 1.9% 14 Customer N 1.8% 15 Customer O 1.7% 16 Customer P 1.7% 17 Customer Q 1.5% 18 Customer R 1.5% 19 Customer S 1.4% 20 Customer T 1.3%
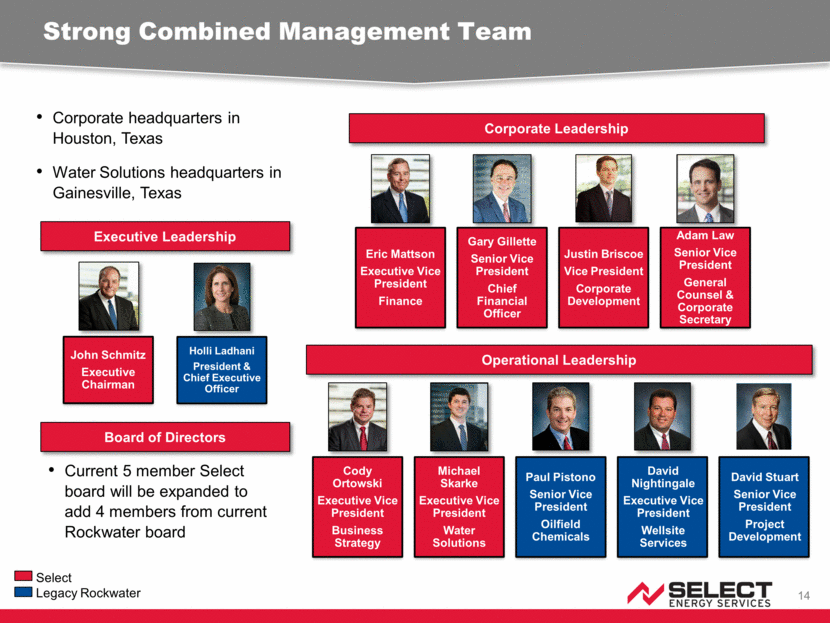
Strong Combined Management Team 14 Select Legacy Rockwater David Nightingale Executive Vice President Wellsite Services Paul Pistono Senior Vice President Oilfield Chemicals Cody Ortowski Executive Vice President Business Strategy Michael Skarke Executive Vice President Water Solutions Adam Law Senior Vice President General Counsel & Corporate Secretary Justin Briscoe Vice President Corporate Development John Schmitz Executive Chairman Holli Ladhani President & Chief Executive Officer Executive Leadership Corporate Leadership Operational Leadership Corporate headquarters in Houston, Texas Water Solutions headquarters in Gainesville, Texas David Stuart Senior Vice President Project Development Eric Mattson Executive Vice President Finance Gary Gillette Senior Vice President Chief Financial Officer Current 5 member Select board will be expanded to add 4 members from current Rockwater board Board of Directors
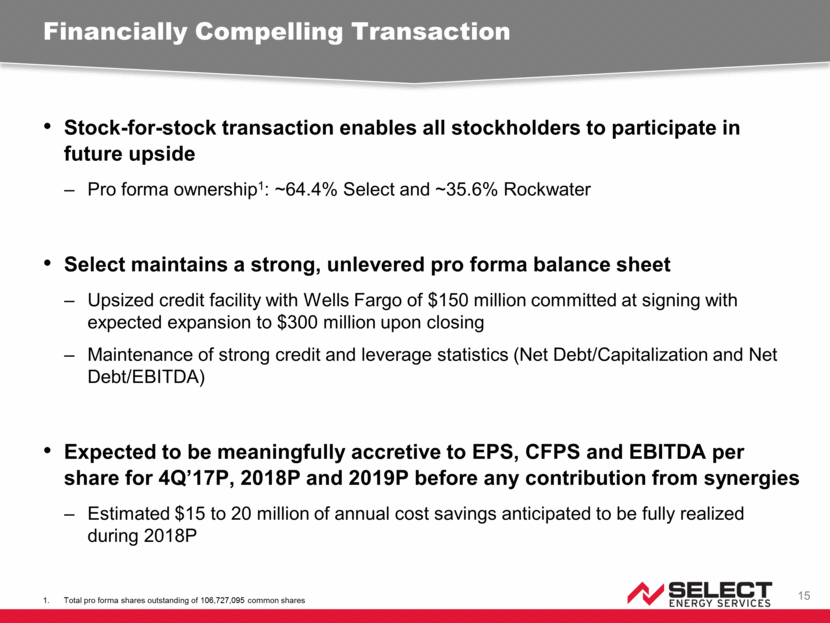
Stock-for-stock transaction enables all stockholders to participate in future upside Pro forma ownership1: ~64.4% Select and ~35.6% Rockwater Select maintains a strong, unlevered pro forma balance sheet Upsized credit facility with Wells Fargo of $150 million committed at signing with expected expansion to $300 million upon closing Maintenance of strong credit and leverage statistics (Net Debt/Capitalization and Net Debt/EBITDA) Expected to be meaningfully accretive to EPS, CFPS and EBITDA per share for 4Q’17P, 2018P and 2019P before any contribution from synergies Estimated $15 to 20 million of annual cost savings anticipated to be fully realized during 2018P Financially Compelling Transaction 15 Total pro forma shares outstanding of 106,727,095 common shares
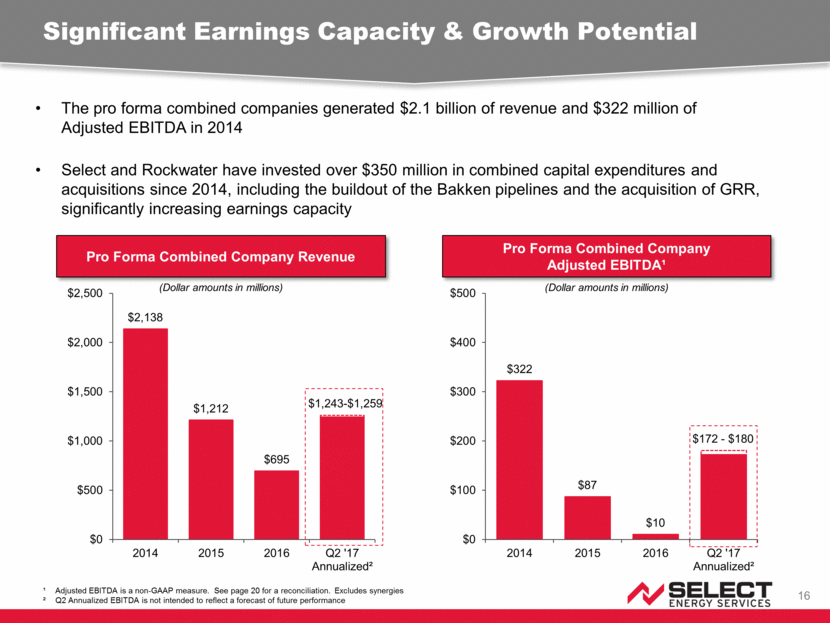
Significant Earnings Capacity & Growth Potential 16 The pro forma combined companies generated $2.1 billion of revenue and $322 million of Adjusted EBITDA in 2014 Select and Rockwater have invested over $350 million in combined capital expenditures and acquisitions since 2014, including the buildout of the Bakken pipelines and the acquisition of GRR, significantly increasing earnings capacity ¹ Adjusted EBITDA is a non-GAAP measure. See page 20 for a reconciliation. Excludes synergies ² Q2 Annualized EBITDA is not intended to reflect a forecast of future performance Pro Forma Combined Company Adjusted EBITDA¹ Pro Forma Combined Company Revenue (Dollar amounts in millions) (Dollar amounts in millions) $2,138 $1,212 $695 $0 $500 $1,000 $1,500 $2,000 $2,500 2014 2015 2016 Q2 '17 Annualized² $1,243 - $1,259 $322 $87 $10 $0 $100 $200 $300 $400 $500 2014 2015 2016 Q2 '17 Annualized² $172 - $180
Best-in-class balance sheet with significant liquidity and attractive public currency Upsized credit facility allows financial flexibility for large scale infrastructure development opportunities and future M&A transactions Balance Sheet and Liquidity Provides Flexibility 17 Pro Forma Balance Sheet As Of May 31, 2017¹ (Dollar amounts in millions) Includes $300 million ABL facility expected to be in place upon deal closing Combined book equity before potential purchase price accounting adjustments Estimated current borrowing base availability under $300 million ABL facility Cash 83.6 $ Bank Debt 59.3 Accrued Lease Obligations 19.6 Total Debt 78.9 Net Debt (4.7) $ Book Equity 2 1,047.8 Liquidity: Cash 83.6 $ Plus: Available Undrawn Revolver 3 235.0 Less: Bank Debt Outstanding (59.3) Less: Outstanding Letters of Credit (20.5) Total Liquidity 238.8 $
By merging with Rockwater, Select (WTTR) strengthens its position as the only public company devoted to water solutions for the unconventional oil and gas industry A combination of Select and Rockwater has compelling industrial and financial logic Strategic Rationale for Combination 18 Further strengthens the leading water solutions company in all service lines across all geographies Both companies operate across all major U.S. basins and each has a strong franchise in the Permian Basin Rockwater’s leading positions in the MidCon (SCOOP/STACK) and Marcellus/Utica further complement Select’s additional market leading positions in the Bakken, Eagle Ford, DJ Basin and Haynesville Addition of leading completions & production chemicals business adds unique complement to Select’s core water solutions franchise Enhanced operational scale and footprint provides significant growth and margin expansion opportunities Significant cross selling opportunities due to expanded service lines and minimal customer overlap No customer greater than ~7% of pro forma 1H17 revenue Significant value creation through operating efficiencies and consolidation savings ($15 – 20 million of near-term cost synergies) Additional growth catalyst as the completions cycle accelerates Strong 2Q17 performance with accelerating momentum heading into 3Q17 Best-in-class balance sheet with significant liquidity and attractive public currency Allows financial flexibility for large scale infrastructure development opportunities The “Acquirer of Choice” in the water space for future M&A transactions Financially accretive transaction for Select shareholders while increasing market cap and public float
Appendix: Non-GAAP Reconciliation 19
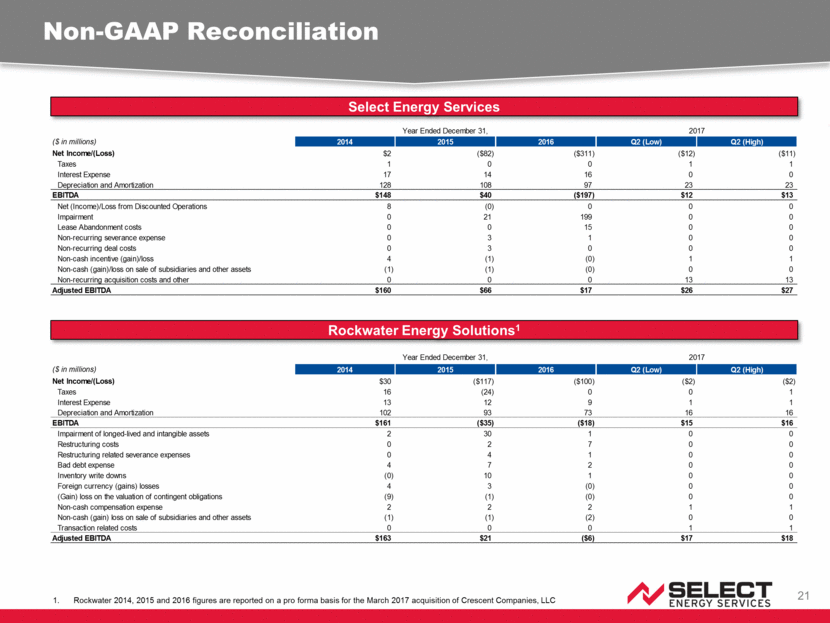
Non-GAAP Reconciliation 20 We view EBITDA and Adjusted EBITDA as important indicators of performance. We define EBITDA as net income, plus taxes, interest expense, and depreciation and amortization. We define Adjusted EBITDA as EBITDA plus/(minus) loss/(income) from discontinued operations, plus any impairment charges or asset write-offs pursuant to GAAP, plus/(minus) non-cash losses/(gains) on the sale of assets or subsidiaries, non-recurring compensation expense, non-cash compensation expense, and non-recurring or unusual expenses or charges, including severance expenses, transaction costs, or facilities-related exit and disposal-related expenditures. Our board of directors, management and investors use EBITDA and Adjusted EBITDA to assess our financial performance because it allows them to compare our operating performance on a consistent basis across periods by removing the effects of our capital structure (such as varying levels of interest expense), asset base (such as depreciation and amortization) and items outside the control of our management team. We present EBITDA and Adjusted EBITDA because we believe they provide useful information regarding the factors and trends affecting our business in addition to measures calculated under GAAP. EBITDA and Adjusted EBITDA are not financial measures presented in accordance with GAAP. We believe that the presentation of these non-GAAP financial measures will provide useful information to investors in assessing our financial performance and results of operations. Net income is the GAAP measure most directly comparable to EBITDA and Adjusted EBITDA. Our non-GAAP financial measures should not be considered as alternatives to the most directly comparable GAAP financial measure. Each of these non-GAAP financial measures has important limitations as an analytical tool due to exclusion of some but not all items that affect the most directly comparable GAAP financial measures. You should not consider EBITDA or Adjusted EBITDA in isolation or as substitutes for an analysis of our results as reported under GAAP. Because EBITDA and Adjusted EBITDA may be defined differently by other companies in our industry, our definitions of these non-GAAP financial measures may not be comparable to similarly titled measures of other companies, thereby diminishing their utility. The following table presents a reconciliation of EBITDA and Adjusted EBITDA to our net income (loss), which is the most directly comparable GAAP measure for the periods presented:
Non-GAAP Reconciliation 21 Select Energy Services Rockwater Energy Solutions1 Rockwater 2014, 2015 and 2016 figures are reported on a pro forma basis for the March 2017 acquisition of Crescent Companies, LLC Year Ended December 31, 2017 ($ in millions) 2014 2015 2016 Q2 (Low) Q2 (High) Net Income/(Loss) $30 ($117) ($100) ($2) ($2) Taxes 16 (24) 0 0 1 Interest Expense 13 12 9 1 1 Depreciation and Amortization 102 93 73 16 16 EBITDA $161 ($35) ($18) $15 $16 Impairment of longed-lived and intangible assets 2 30 1 0 0 Restructuring costs 0 2 7 0 0 Restructuring related severance expenses 0 4 1 0 0 Bad debt expense 4 7 2 0 0 Inventory write downs (0) 10 1 0 0 Foreign currency (gains) losses 4 3 (0) 0 0 (Gain) loss on the valuation of contingent obligations (9) (1) (0) 0 0 Non-cash compensation expense 2 2 2 1 1 Non-cash (gain) loss on sale of subsidiaries and other assets (1) (1) (2) 0 0 Transaction related costs 0 0 0 1 1 Adjusted EBITDA $163 $21 ($6) $17 $18 Year Ended December 31, 2017 ($ in millions) 2014 2015 2016 Q2 (Low) Q2 (High) Net Income/(Loss) $2 ($82) ($311) ($12) ($11) Taxes 1 0 0 1 1 Interest Expense 17 14 16 0 0 Depreciation and Amortization 128 108 97 23 23 EBITDA $148 $40 ($197) $12 $13 Net (Income)/Loss from Discounted Operations 8 (0) 0 0 0 Impairment 0 21 199 0 0 Lease Abandonment costs 0 0 15 0 0 Non-recurring severance expense 0 3 1 0 0 Non-recurring deal costs 0 3 0 0 0 Non-cash incentive (gain)/loss 4 (1) (0) 1 1 Non-cash (gain)/loss on sale of subsidiaries and other assets (1) (1) (0) 0 0 Non-recurring acquisition costs and other 0 0 0 13 13 Adjusted EBITDA $160 $66 $17 $26 $27
