Attached files
| file | filename |
|---|---|
| EX-99.1 - EX-99.1 - Guaranty Bancorp | gbnk-20170719xex99_1.htm |
| EX-2.1 - EX-2.1 - Guaranty Bancorp | gbnk-20170719xex2_1.htm |
| 8-K - 8-K - Guaranty Bancorp | gbnk-20170719x8k.htm |
 1 July 19, 2017 ANNOUNCES ACQUISITION OF CASTLE ROCK BANK HOLDING COMPANY
 Forward Looking Statements 2 This presentation contains forward-looking statements, which are included in accordance with the “safe harbor” provisions of the Private Securities Litigation Reform Act of 1995. In some cases, you can identify forward-looking statements by terminology such as “may,” “will,” “should,” “could,” “expects,” “plans,” “intends,” “anticipates,” “believes,” “estimates,” “predicts,” “potential,” or “continue,” or the negative of such terms and other comparable terminology that are predictions of or indicated future events or trends and that do not relate solely to historical matters. You can also identify forward-looking statements by discussions of strategy, plans or intentions. Forward-looking statements depend on assumptions, data or methods that may be incorrect or imprecise and we may not be able to realize them. We do not guarantee that the transactions and events described will happen as described (or that they will happen at all). These forward-looking statements involve known and unknown risks, uncertainties and other factors that may cause Guaranty Bancorp’s (“the Company”) actual results, performance or achievements to be materially different from any future results, performance or achievements expressed or implied by such forward-looking statements. Such factors include, among others, economic, political and market conditions and fluctuations; competition; the possibility that the expected benefits related to the proposed transaction may not materialize as expected; the proposed transaction not being timely completed, if completed at all; prior to the completion of the proposed transaction, Castle Rock Bank Holding Company’s or Castle Rock Bank’s (hereafter referred to as “Castle Rock”) business experiencing disruptions due to transaction-related uncertainty or other factors making it more difficult to maintain relationships with employees, customers, other business partners or governmental entities, difficulty retaining key employees, and the parties being unable to successfully implement integration strategies or to achieve expected synergies and operating efficiencies within the expected time-frames or at all; and other factors identified in our filings with the Securities and Exchange Commission (the “SEC”). For a discussion of such risks and uncertainties, which could cause actual results to differ from those contained in the forward-looking statements, see “Risk Factors” and the forward-looking statement disclosure contained in the Company’s Annual Report on Form 10-K, filed with the SEC on February 28, 2017. When relying on forward-looking statements to make decisions with respect to the Company, investors and others are cautioned to consider these and other risks and uncertainties. The Company can give no assurance that any goal or plan or expectation set forth in any forward-looking statement can be achieved and readers are cautioned not to place undue reliance on such statements, which speak only as of the date made. The forward-looking statements are made as of the date of this presentation, and, except as may otherwise be required by law, the Company does not intend, and assumes no obligation, to update the forward-looking statements or to update the reasons why actual results could differ from those projected in the forward-looking statements. Pro forma, projected and estimated numbers are used for illustrative purposes and are not forecasts, and actual results may differ materially. Investors and security holders are urged to read the Company’s Annual Report on Form 10-K, Quarterly Reports on Form 10-Q and other documents filed by the Company with the SEC. The documents filed by the Company with the SEC may be obtained at the Company’s website at www.gbnk.com or at the SEC's website at www.sec.gov. These documents may also be obtained free of charge from the Company by directing a request to: Guaranty Bancorp, 1331 Seventeenth St., Suite 200, Denver, CO 80202, Attention: Christopher Treece/Investor Relations; Telephone 303-675-1194.
 3 Transaction Rationale, Structure and Value Strategic Rationale .Strengthens GBNK’s position as one of the premier community banks headquartered in Colorado with $3.6 billion in pro forma assets .Increases GBNK’s presence in rapidly growing Douglas County with an estimated pro forma total of $208 million in deposits in the county, which would rank the company 5th in deposit market share .Castle Rock’s high quality franchise has a solid core deposit base with excess liquidity .$147.8 million in total assets .58.5% loan/deposit ratio .26.3% noninterest bearing deposits .Low total cost of funds at 0.28% .In line with stated strategic goals of growing market share along the Colorado Front Range (1) $16.0 million in tangible equity excludes accumulated other comprehensive income/loss. (2) Subject to downward adjustment if closing occurs before December 31, 2017. (3) Subject to adjustment if Castle Rock’s consolidated Tangible Book Value (excluding accumulated comprehensive income/loss) is less than $16.0 million. .Merger consideration of 100% GBNK stock (840,639 shares) .Subject to delivery of minimum consolidated tangible equity of $16.0 million(1)(2) .Aggregate transaction value of approximately $23.0 million(3) .Pro forma ownership of 97.1% for GBNK and 2.9% for Castle Rock Transaction Structure and Value
 4 (1)Deal value / $15.9 million minimum tangible common equity required. (2)Castle Rock’s last twelve months earnings adjusted for S-corp status using 34% tax rate. (3)Assumes 100% phase-in of cost savings in 2018. (4)As of closing, pro forma TBV per share is expected to increase by approximately $0.18 per share before transaction expenses. TBV earn back period is calculated using cross over method, but is not applicable given the immediate TBV pro forma accretion at closing. Multiples, Financial Impact and Assumptions Valuation Multiples .Deal value / tangible book value of 1.45x based on consolidated June 30, 2017 tangible common equity of $15.9 million(1) .Deal value / last twelve months earnings of 15.3x(2) Financially Attractive .Projected earnings accretion to EPS in 2018 of $0.04, or 2.5%(3) .Projected internal rate of return in excess of 19% .Immediate tangible book value per share increase at closing(4) Assumptions .Estimated cost savings of approximately 60% of Castle Rock’s expected 2017 non-interest expense, fully implemented by the second quarter 2018 .Fair value mark of approximately 4.1% on Castle Rock’s loan portfolio .Pre-tax merger expenses of approximately $3.0 million, including contract termination fees Closing .Customary regulatory approvals and Castle Rock shareholder approval (over 93% of Castle Rock shares subject to voting and support agreements) .Expected first quarter 2018; intent is to merge banks at close, with Guaranty Bank and Trust Company as surviving bank
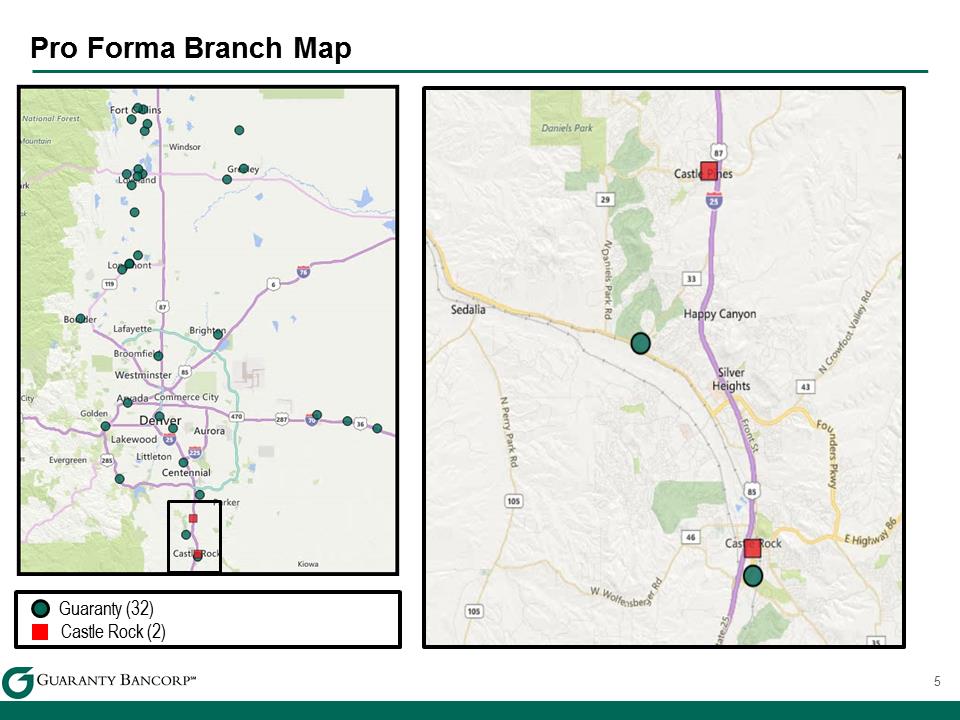 Pro Forma Branch Map 5 Guaranty (32) Castle Rock (2) 1
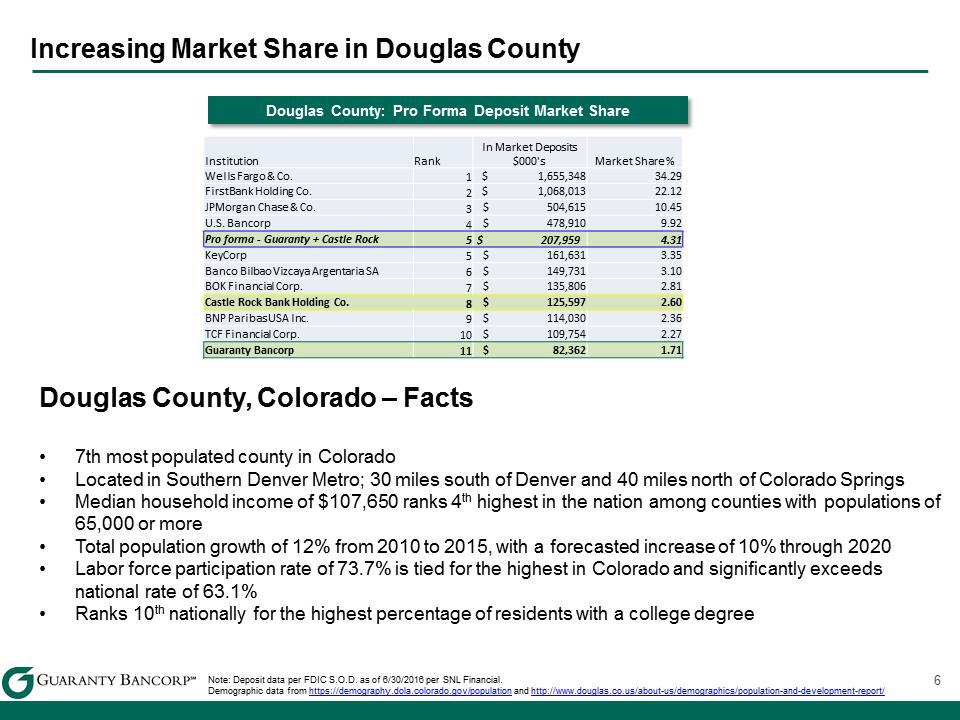 Note: Deposit data per FDIC S.O.D. as of 6/30/2016 per SNL Financial. Demographic data from https://demography.dola.colorado.gov/population and http://www.douglas.co.us/about-us/demographics/population-and-development-report/ 6 Increasing Market Share in Douglas County Douglas County: Pro Forma Deposit Market Share Institution Rank In Market Deposits $000's Market Share % Wells Fargo & Co. 1 $1,655,348 34.29 FirstBank Holding Co. 2 $1,068,013 22.12 JPMorgan Chase & Co. 3 $504,615 10.45 U.S. Bancorp 4 $478,910 9.92 Pro forma - Guaranty + Castle Rock 5 $207,959 4.31 KeyCorp 5 $161,631 3.35 Banco Bilbao Vizcaya Argentaria SA 6 $149,731 3.10 BOK Financial Corp. 7 $135,806 2.81 Castle Rock Bank Holding Co. 8 $125,597 2.60 BNP Paribas USA Inc. 9 $114,030 2.36 TCF Financial Corp. 10 $109,754 2.27 Guaranty Bancorp 11 $82,362 1.71 Douglas County, Colorado – Facts •7th most populated county in Colorado •Located in Southern Denver Metro; 30 miles south of Denver and 40 miles north of Colorado Springs •Median household income of $107,650 ranks 4th highest in the nation among counties with populations of 65,000 or more •Total population growth of 12% from 2010 to 2015, with a forecasted increase of 10% through 2020 •Labor force participation rate of 73.7% is tied for the highest in Colorado and significantly exceeds national rate of 63.1% •Ranks 10th nationally for the highest percentage of residents with a college degree
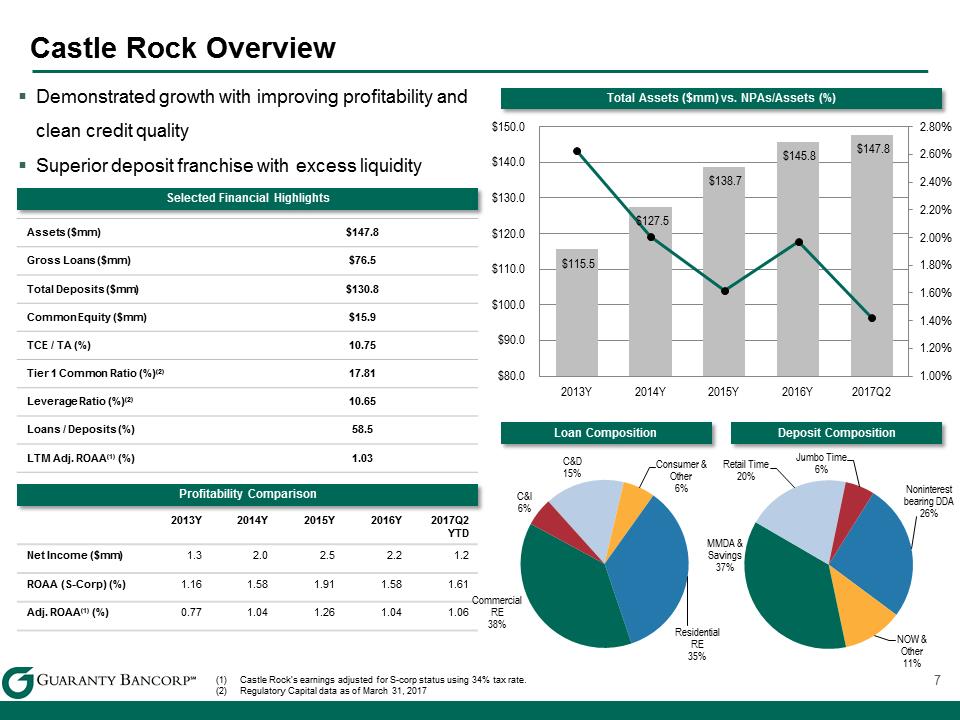 Assets ($mm) $147.8 Gross Loans ($mm) $76.5 Total Deposits ($mm) $130.8 Common Equity ($mm) $15.9 TCE / TA (%) 10.75 Tier 1 Common Ratio (%)(2) 17.81 Leverage Ratio (%)(2) 10.65 Loans / Deposits (%) 58.5 LTM Adj. ROAA(1) (%) 1.03 7 (1)Castle Rock’s earnings adjusted for S-corp status using 34% tax rate. (2)Regulatory Capital data as of March 31, 2017 Castle Rock Overview Selected Financial Highlights Profitability Comparison Total Assets ($mm) vs. NPAs/Assets (%) .Demonstrated growth with improving profitability and clean credit quality .Superior deposit franchise with excess liquidity 2013Y 2014Y 2015Y 2016Y 2017Q2 YTD Net Income ($mm) 1.3 2.0 2.5 2.2 1.2 ROAA (S-Corp) (%) 1.16 1.58 1.91 1.58 1.61 Adj. ROAA(1) (%) 0.77 1.04 1.26 1.04 1.06 Loan Composition Deposit Composition C&D 15% Consumer & Other 6% Residential RE 35% Commercial RE 38% C&I 6% Noninterest bearing DDA 26% NOW & Other 11% MMDA & Savings 37% Retail Time 20% Jumbo Time 6% $115.5 $127.5 $138.7 $145.8 $147.8 1.00% 1.20% 1.40% 1.60% 1.80% 2.00% 2.20% 2.40% 2.60% 2.80% $80.0 $90.0 $100.0 $110.0 $120.0 $130.0 $140.0 $150.02013Y 2014Y 2015Y 2016Y 2017Q2
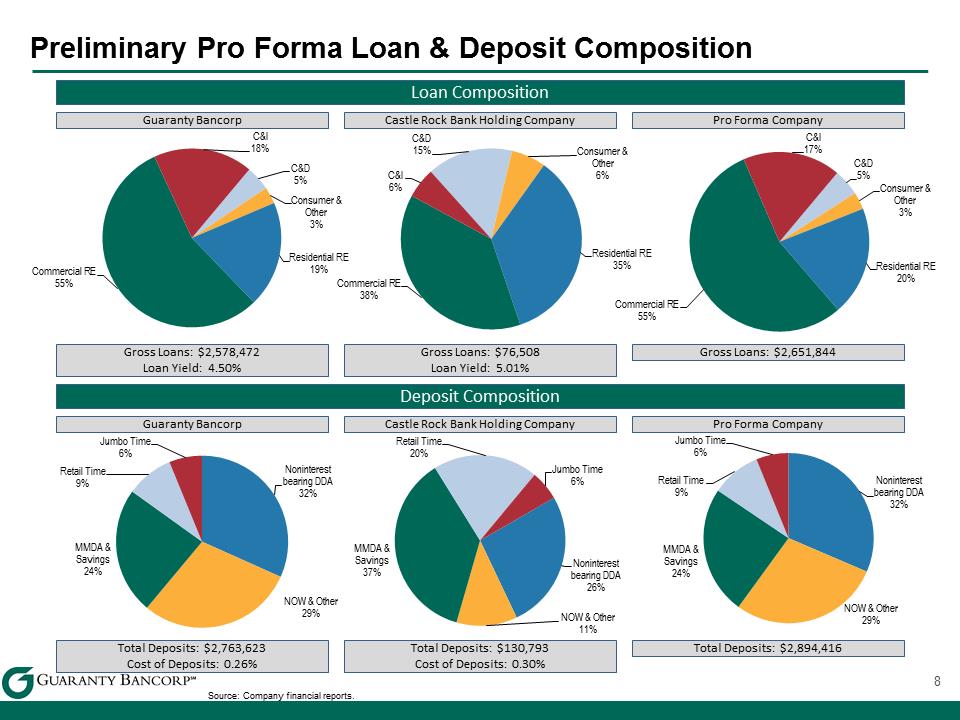 Source: Company financial reports. Preliminary Pro Forma Loan & Deposit Composition 8 Guaranty Bancorp Castle Rock Bank Holding Company Pro Forma Company Loan Composition Guaranty Bancorp Castle Rock Bank Holding Company Pro Forma Company Deposit Composition Gross Loans: $2,578,472 Loan Yield: 4.50% Gross Loans: $76,508 Loan Yield: 5.01% Gross Loans: $2,651,844 Total Deposits: $2,763,623 Cost of Deposits: 0.26% Total Deposits: $130,793 Cost of Deposits: 0.30% Total Deposits: $2,894,416 C&D 5% Consumer & Other 3% Residential RE 20% Commercial RE 55% C&I 17% C&D 15% Consumer & Other 6% Residential RE 35% Commercial RE 38% C&I 6% C&D 5% Consumer & Other 3% Residential RE 19% Commercial RE 55% C&I 18% Noninterest bearing DDA 32% NOW & Other 29% MMDA & Savings 24% Retail Time 9% Jumbo Time 6% Noninterest bearing DDA 26% NOW & Other 11% MMDA & Savings 37% Retail Time 20% Jumbo Time 6% Noninterest bearing DDA 32% NOW & Other 29% MMDA & Savings 24% Retail Time 9% Jumbo Time 6%