Attached files
| file | filename |
|---|---|
| 8-K - FIRST HORIZON CORP | c88916_8k.htm |
Exhibit 99.1

First Horizon National Corporation Second Quarter 2017 Earnings July 14, 2017

Disclaimer 2 Forward - Looking Statements This communication contains certain “forward - looking statements” within the meaning of the Private Securities Litigation Reform Act of 1995 with respect to our beliefs, plans, goals, expectations, and estimates. Forward - looking statements are not a representation of historical information, but instead pertain to future operatio ns, strategies, financial results or other developments. The words “believe,” “expect,” “anticipate,” “intend,” “estimate,” “should,” “is likely,” “will,” “going forward,” and other expressions that indi cat e future events and trends identify forward - looking statements. Forward - looking statements are necessarily based upon estimates and assumptions that are inherently subject to significant busin ess, operational, economic and competitive uncertainties and contingencies, many of which are beyond the control of First Horizon and Capital Bank, which announced a proposed transaction on May 4, 2017, and many of which, with respect to future business decisions and actions, are subject to change. Examples of uncertainties and contingencies include, among other important fact ors : global, general, and local economic and business conditions, including economic recession or depression; expectations of and actual timing and amount of interest rate movements, including the slop e a nd shape of the yield curve, which can have a significant impact on a financial services institution; market and monetary fluctuations, including fluctuations in mortgage markets; inflation or de fla tion; customer, investor, competitor, regulatory, and legislative responses to any or all of these conditions; demand for First Horizon’s and Capital Bank’s product offerings; the actions of the Securitie s a nd Exchange Commission (SEC), the Financial Accounting Standards Board (FASB), the Office of the Comptroller of the Currency (OCC), the Board of Governors of the Federal Reserve System (Federal Re ser ve), the Federal Deposit Insurance Corporation (FDIC), the Financial Industry Regulatory Authority (FINRA), the U.S. Department of the Treasury (Treasury), the Municipal Securities Rulemaking Bo ard (MSRB), the Consumer Financial Protection Bureau (CFPB), the Financial Stability Oversight Council (Council), the Public Company Accounting Oversight Board (PCAOB), and other regulators and agencies, including in connection with the regulatory approval process associated with the merger; pending, threatened, or possible future regulatory, administrative, and judicial outcomes, action s, and proceedings; current or future Executive orders; changes in laws and regulations applicable to First Horizon and Capital Bank; the possibility that the proposed transaction will not close when e xpe cted or at all because required regulatory, shareholder or other approvals are not received or other conditions to the closing are not satisfied on a timely basis or at all; the possibility that the antic ipa ted benefits of the transaction will not be realized when expected or at all, including as a result of the impact of, or problems arising from, the integration of the two companies or as a result of the str ength of the economy and competitive factors in the areas where First Horizon and Capital Bank do business; the possibility that the transaction may be more expensive to complete than anticipated, includ ing as a result of unexpected factors or events; diversion of management’s attention from ongoing business operations and opportunities; potential adverse reactions or changes to business or employee rel ationships, including those resulting from the announcement or completion of the transaction; First Horizon’s and Capital Bank’s success in executing their respective business plans and st rat egies and managing the risks involved in the foregoing; and other factors that may affect future results of First Horizon and Capital Bank. Additional factors that could cause results to differ materially from those contemplated by forward - looking statements can be fo und in First Horizon’s Annual Report on Form 10 - K for the year ended December 31, 2016, and in its subsequent Quarterly Reports on Form 10 - Q filed with the SEC and available in the “Investor Relati ons” section of First Horizon’s website, http://www.firsthorizon.com, under the heading “SEC Filings” and in other documents First Horizon files with the SEC, and in Capital Bank’s Annual Report on Form 10 - K for the year ended December 31, 2016 and in its subsequent Quarterly Reports on Form 10 - Q, including for the quarter ended March 31, 2017, filed with the SEC and available in the “Investo r Relations” section of Capital Bank’s website, www.CapitalBank - US.com, under the heading “Financials & Filings” and in other documents Capital Bank files with the SEC. Important Other Information In connection with the proposed transaction, First Horizon has filed with the SEC a Registration Statement on Form S - 4 (No. 333 - 219052) that includes a preliminary Joint Proxy Statement of First Horizon and Capital Bank and a preliminary Prospectus of First Horizon, as well as other relevant documents concerning the proposed t ran saction. First Horizon will file a definitive Joint Proxy Statement/ Prospectus under the Registration Statement in the future, along with certain additional documents concerning the proposed tr ans action. The proposed transaction involving First Horizon and Capital Bank will be submitted to First Horizon’s shareholders and Capital Bank’s stockholders for their consideration. This communication do es not constitute an offer to sell or the solicitation of an offer to buy any securities or a solicitation of any vote or approval. SHAREHOLDERS OF FIRST HORIZON AND CAPITAL BANK ARE URGED TO READ THE RE GIS TRATION STATEMENT AND THE JOINT PROXY STATEMENT/PROSPECTUS REGARDING THE TRANSACTION AND ANY OTHER RELEVANT DOCUMENTS FILED WITH THE SEC, AS WELL AS ANY AMENDMENTS OR SUPPLEMENTS TO THOSE DOCUMENTS, BECAUSE THEY DO AND WILL CONTAIN IMPORTANT INFORMATION. Shareholders will be able to obtain a free copy of the definitive joi nt proxy statement/prospectus, as well as other filings containing information about First Horizon and Capital Bank, without charge, at the SEC’s website (http://www.sec.gov). Copies of the de fin itive joint proxy statement/prospectus and the filings with the SEC that will be incorporated by reference in the joint proxy statement/prospectus can also be obtained, without charge, by directing a r equest to Clyde A Billings, Jr., First Horizon National Corporation, 165 Madison, 8th Floor, Memphis, TN 38103, telephone 901.523.5679, or Capital Bank Financial Corp., Attention: Secretary, 4725 Pi edm ont Row Drive, Suite 110, Charlotte, NC 28210. Participants in the Solicitation First Horizon, Capital Bank, and certain of their respective directors, executive officers and employees may be deemed to be par ticipants in the solicitation of proxies in respect of the proposed transaction. Information regarding First Horizon’s directors and executive officers is available in its definitive proxy stat eme nt, which was filed with the SEC on March 13, 2017, and certain of its Current Reports on Form 8 - K. Information regarding Capital Bank’s directors and executive officers is available in its definitive proxy statement, which was filed with SEC on April 28, 2017, and certain of its Current Reports on Form 8 - K. Other information regarding the participants in the proxy solicitation and a description of their d irect and indirect interests, by security holdings or otherwise, will be contained in the joint proxy statement/prospectus and other relevant materials filed with the SEC. Free copies of this docume nt, when it becomes available, may be obtained as described in the preceding paragraph.
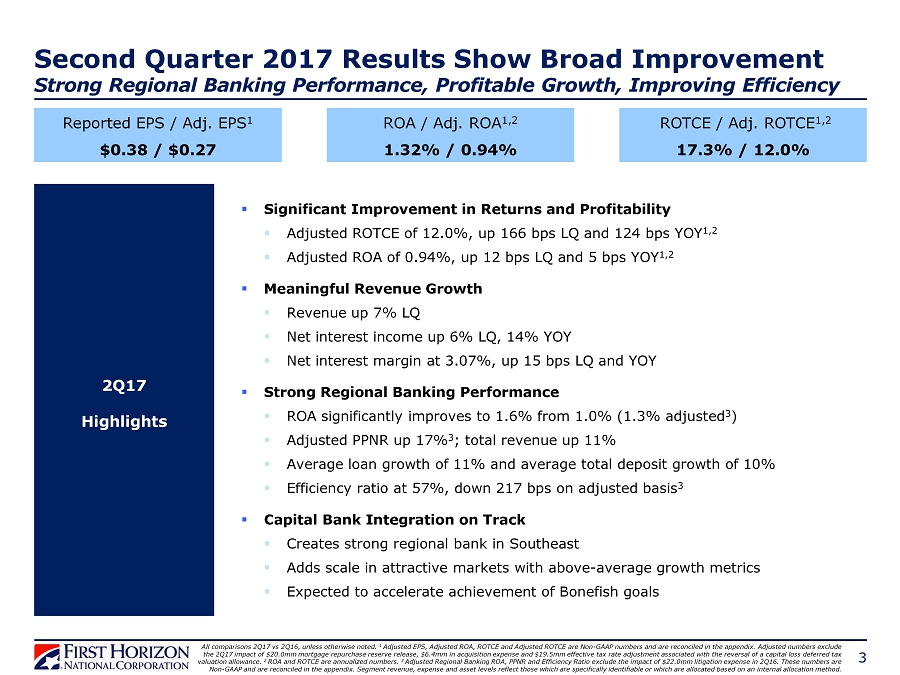
3 Second Quarter 2017 Results Show Broad Improvement Strong Regional Banking Performance, Profitable Growth, Improving Efficiency All comparisons 2Q17 vs 2Q16, unless otherwise noted. 1 Adjusted EPS, Adjusted ROA, ROTCE and Adjusted ROTCE are Non - GAAP numbers and are reconciled in the appendix. Adjusted numbers e xclude the 2Q17 impact of $20.0mm mortgage repurchase reserve release, $6.4mm in acquisition expense and $19.5mm effective t ax rate adjustment associated with the reversal of a capital loss deferred tax valuation allowance. 2 ROA and ROTCE are annualized numbers. 3 Adjusted Regional Banking ROA, PPNR and Efficiency Ratio exclude the impact of $22.0mm litigation expense in 2Q16. These numb ers are Non - GAAP and are reconciled in the appendix. Segment revenue, expense and asset levels reflect those which are specifically iden tifiable or which are allocated based on an internal allocation method. Reported EPS / Adj. EPS 1 $0.38 / $0.27 ROA / Adj. ROA 1,2 1.32% / 0.94% ROTCE / Adj. ROTCE 1,2 17.3% / 12.0% 2Q17 Highlights ▪ Significant Improvement in Returns and Profitability ▪ Adjusted ROTCE of 12.0%, up 166 bps LQ and 124 bps YOY 1,2 ▪ Adjusted ROA of 0.94%, up 12 bps LQ and 5 bps YOY 1,2 ▪ Meaningful Revenue Growth ▪ Revenue up 7% LQ ▪ Net interest income up 6% LQ, 14% YOY ▪ Net interest margin at 3.07%, up 15 bps LQ and YOY ▪ Strong Regional Banking Performance ▪ ROA significantly improves to 1.6% from 1.0% (1.3% adjusted 3 ) ▪ Adjusted PPNR up 17% 3 ; total revenue up 11% ▪ Average loan growth of 11% and average total deposit growth of 10% ▪ Efficiency ratio at 57%, down 217 bps on adjusted basis 3 ▪ Capital Bank Integration on Track ▪ Creates strong regional bank in Southeast ▪ Adds scale in attractive markets with above - average growth metrics ▪ Expected to accelerate achievement of Bonefish goals

FINANCIAL RESULTS 4

$ in millions Financial Results 1Q17 2 Q16 Financial Results Demonstrate Strong Momentum Solid Revenue Improvement, PPNR Up LQ and YOY 5 Net Interest Income Fee Income PPNR 1 2 Q17 $201 Expense $128 $110 $218 $91 2 Q17 vs +14% - 12% +16% - 4% +61% +6% +9% +31% - 2 % +68% Net Income Avail to Common Numbers may not add to total due to rounding. LQ – Linked quarter. NM - Not Meaningful. 1 Pre - provision net revenue is not a GAAP number but is used in regulatory stress test reporting. The presentation of PPNR follows the regula tor y definition . 2 Adjusted Expense, PPNR, Pre - Tax Income, NIAC and EPS are adjusted for notable items, are Non - GAAP numbers and are reconciled i n the appendix. $112 +24% +32% Pre - Tax Income $19.2 +8% +2% Average Loans ($B) $22.5 +11% - 1% Average Deposits ($B) Total Revenue $328 +2% +7% $0.38 +58% +65% EPS Loan Loss Provision $(2) NM NM Adjusted Expense 2 Adjusted PPNR 1,2 $232 +1% +4% $96 +5% +14% Adjusted Pre - Tax Income 2 $99 +12% +16% ▪ Diluted EPS of $0.38; Adjusted EPS of $0.27, up 17% LQ ▪ Adjusted PPNR growth of 14% LQ highlights strong Regional Bank performance and continued expense discipline ▪ Revenue up 7% LQ from net interest income growth and higher fee income ▪ NII up 6% LQ from steady loan growth and net interest spread improvement ▪ Average deposits down LQ on planned outflow of market - indexed deposits to improve funding mix ▪ Regional Banking average deposits up 2% LQ ▪ Effective tax rate of 15% in 2Q17 positively impacted by tax adjustment; expect ~23% effective tax rate for 2H17 before normalizing at ~32% in 2018 $17 - 43% - 36% Taxes 2Q17 Notable Items Mortgage repurchase reserve release + $20.0 Acquisition expense - $6.4 Effective tax rate adjustment associated with the reversal of a capital loss deferred tax valuation allowance + $19.5 ($mm) 1 Q17 $190 $117 $84 $222 $54 $85 $18.8 $22.8 $307 $0.23 $(1) $222 $84 $85 Actuals $27 Adjusted NIAC 2 $63 +15% +17% Adjusted EPS 2 $0.27 +14% +17% $54 $0.23
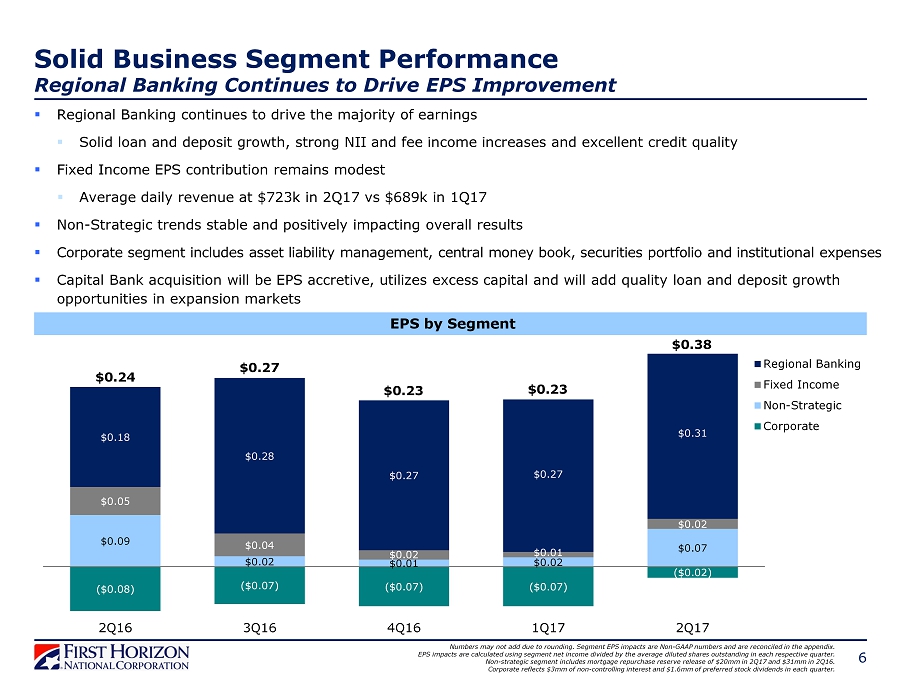
Solid Business Segment Performance Regional Banking Continues to Drive EPS Improvement 6 ($0,08) ($0,07) ($0,07) ($0,07) ($0,02) $0,09 $0,02 $0,01 $0,02 $0,07 $0,05 $0,04 $0,02 $0,01 $0,02 $0,18 $0,28 $0,27 $0,27 $0,31 2Q16 3Q16 4Q16 1Q17 2Q17 Regional Banking Fixed Income Non-Strategic Corporate $0.24 $0.27 $0.23 $0.23 $0.38 ▪ Regional Banking continues to drive the majority of earnings ▪ Solid loan and deposit growth, strong NII and fee income increases and excellent credit quality ▪ Fixed Income EPS contribution remains modest ▪ Average daily revenue at $723k in 2Q17 vs $689k in 1Q17 ▪ Non - Strategic trends stable and positively impacting overall results ▪ Corporate segment includes asset liability management, central money book, securities portfolio and institutional expenses ▪ Capital Bank acquisition will be EPS accretive, utilizes excess capital and will add quality loan and deposit growth opportunities in expansion markets EPS by Segment Numbers may not add due to rounding. Segment EPS impacts are Non - GAAP numbers and are reconciled in the appendix. EPS impacts are calculated using segment net income divided by the average diluted shares outstanding in each respective quar ter . Non - strategic segment includes mortgage repurchase reserve release of $20mm in 2Q17 and $31mm in 2Q16. Corporate reflects $3mm of non - controlling interest and $1.6mm of preferred stock dividends in each quarter.
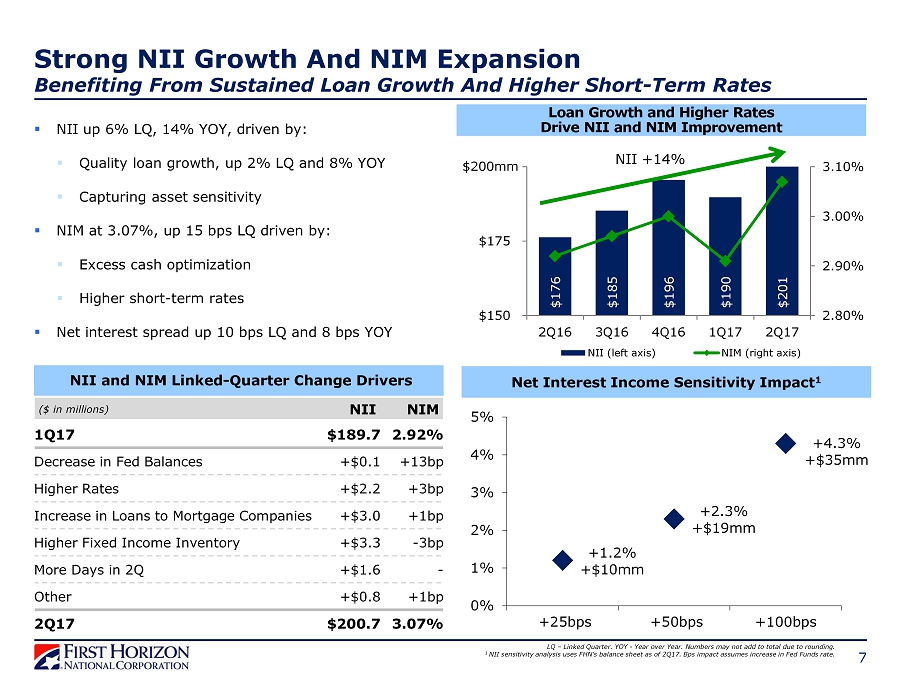
$176 $185 $196 $190 $201 2,80% 2,90% 3,00% 3,10% $150 $175 $200 2Q16 3Q16 4Q16 1Q17 2Q17 NII (left axis) NIM (right axis) 7 Strong NII Growth And NIM Expansion Benefiting From Sustained Loan Growth And Higher Short - Term Rates ▪ NII up 6% LQ, 14% YOY, driven by: ▪ Quality loan growth, up 2% LQ and 8% YOY ▪ Capturing asset sensitivity ▪ NIM at 3.07%, up 15 bps LQ driven by: ▪ Excess cash optimization ▪ Higher short - term rates ▪ Net interest spread up 10 bps LQ and 8 bps YOY NII and NIM Linked - Quarter Change Drivers LQ – Linked Quarter. YOY - Year over Year. Numbers may not add to total due to rounding. 1 NII sensitivity analysis uses FHN’s balance sheet as of 2Q17. Bps impact assumes increase in Fed Funds rate. ($ in millions) NII NIM 1Q17 $189.7 2.92% Decrease in Fed Balances +$0.1 +13bp Higher Rates +$2.2 +3bp Increase in Loans to Mortgage Companies +$3.0 +1bp Higher Fixed Income Inventory +$3.3 - 3bp More Days in 2Q +$1.6 - Other +$0.8 +1bp 2Q17 $200.7 3.07% Loan Growth and Higher Rates Drive NII and NIM Improvement Net Interest Income Sensitivity Impact 1 $200mm NII +14% +1.2% +$10mm +2.3% +$19mm +4.3% +$35mm 0% 1% 2% 3% 4% 5% +25bps +50bps +100bps

$ in millions Financial Results 8 Numbers may not add to total due to rounding. LQ – Linked Quarter. YOY - Year over Year. 1 Pre - provision net revenue is not a GAAP number but is used in regulatory stress test reporting. The presentation of PPNR follows the regulatory definition. 2 Adjusted Expense, PPPNR and Pre - Tax Income a re adjusted for notable items, are Non - GAAP numbers and are reconciled i n the appendix. ▪ Profitability strong ▪ PPNR 1 up 9% LQ ▪ Pre - tax income up 12% LQ ▪ NII up 4% LQ and 13% YOY ▪ Efficiency ratio at 57% in 2Q17, down 135 bps LQ ▪ Loan loss provision reflects excellent credit quality trends in both commercial and consumer portfolios ▪ NPLs down 13% LQ and 29% YOY ▪ 30+ day delinquencies improved 11 bps LQ and 3 bps YOY ▪ Net charge - offs of $3.0mm in 2Q17 Regional Banking Revenue up 6% LQ, 11% YOY Driven by Strong NII and Solid Fee Income Strong YOY Average Deposit and Loan Growth $15,9 B $17,7 B 2Q16 2Q17 $18,4 B $20,1 B 2Q16 2Q17 +11% +10% Average Deposits Average Loans Actuals 1Q17 Net Interest Income Fee Income Expense 2 Q17 $202 $65 $153 2 Q17 vs +13% +6% - 7% $193 $59 $148 1Q17 + 4% +10% +3% 2 Q16 Net Income $73 $65 +74% +12% Adjusted Expense 2 Adjusted PPNR 1,2 $153 $148 +7% +3% $114 $104 +17% +9% Loan Loss Provision $0 - 98% $3 - 92% PPNR 1 $114 $104 +51% +9% Pre - Tax Income $114 $101 +77% +12% Total Revenue $267 +11% $252 +6% Adjusted Pre - Tax Income 2 Average Loans ($B) $114 $101 +32% +12% $17.7 $17.2 +11% +3% Average Deposits ($B) $20.1 $19.7 +10% +2%

9 Regional Banking Loan Growth Remains Healthy Commercial Pipelines Solid LQ – Linked Quarter. YOY - Year over Year. Numbers may not add to total due to rounding. ▪ Regional Banking average loans up 11% YOY and 3% LQ ▪ Average Commercial loans up 14% YOY and 3% LQ ▪ Loan growth driven by Loans to Mortgage Companies, Asset - Based Lending, Wealth Management and core Commercial lending areas ▪ All regional markets experienced growth LQ ▪ Middle TN and Mid - Atlantic markets up 10% YOY Loans to Mortgage Companies Volume Remains Strong Average Loan Growth by Lending Area $17,2B $17,7B 1Q17 Other Consumer Asset-Based Lending Private Client/ Wealth Mgmt Commercial Loans to Mortgage Companies 2Q17 $(107) $(57) $57 $108 $167 $312 ($ in mm) $2,9 $3,3 $3,3 $3,4 $3,3 $2,2 $2,5 $2,0 $1,5 $2,1 $1B $2B $3B 2Q16 3Q16 4Q16 1Q17 2Q17 Commitments PE Balance ▪ Dwell times down 13% YOY to 14 days ▪ Number of customers up 22%

10 Segment Allowance for Loan Losses $146 $151 $154 $156 $153 $53 $50 $48 $46 $44 0,5% 0,7% 0,9% 1,1% 1,3% 1,5% $100 $140 $180 $220 2Q16 3Q16 4Q16 1Q17 2Q17 Regional Banking Non-Strategic Consolidated Ratio (Right Axis) Net Charge - Offs Asset Quality Remains Excellent Stable Credit Trends Reflect Strong Underwriting Discipline -0,05% 0,00% 0,05% 0,10% 0,15% 0,20% -$3 $0 $3 $6 $9 2Q16 3Q16 4Q16 1Q17 2Q17 NCOs $ Provision $ NCO %¹ (Right Axis) $9mm ▪ Allowance to loans ratio reflects continued improvement in commercial and consumer portfolios ▪ NPAs decreased 11% LQ and 28% YOY ▪ 30+ day delinquencies improved 12 bps LQ and 5 bps YOY ▪ Net charge - offs of $3mm in 2Q17 vs $1mm net recoveries in 1Q17 and $8mm in 2Q16 Numbers may not add to total due to rounding. LQ – Linked Quarter. YOY - Year over Year. 1 Net charge - off % is annualized and as % of average loans. 2 NPAs as % of period - end loans + foreclosed real estate and 30+ Del as % of period - end loans. Asset Quality Highlights $200 $202 $202 $202 $197 2Q16 3Q16 4Q16 1Q17 2Q17 NCOs 1 0.19% 0.05% NM NM 0.06% NPAs 2 1.03% 0.85% 0.80% 0.80% 0.68% 30+ Day Del 2 0.32% 0.32% 0.34% 0.39% 0.27% $220mm

Capital Bank Integration On Track 11 Integration Progress ▪ Executing towards comprehensive pre - merger integration planning ▪ Cross - company integration team with established leads in all functional areas ▪ Merger Project Office (MPO) established and staffed in May/June 2017 ▪ Leveraging success of 13 combined prior acquisitions, experienced M&A team to lead MPO 2Q17 2H17 1H18 2019 ▪ Regulatory applications filed ▪ Preliminary S - 4 filed ▪ Shareholder meeting ▪ Anticipated deal closing in 4Q17 ▪ Branding ▪ Conversion to FHN system ▪ Fully - phased in cost saves Anticipated Integration Timeline

12 2Q17 Reported (GAAP) Adjusted 3 Long - Term Targets ROTCE 1 17.3% 12.0% 15.0%+ ROA 1 1.32% 0.94% 1.10 – 1.30% CET1 2 9.8% 8.0 – 9.0% NIM 1 3.07% 3.25 – 3.50% NCO / Average Loans 1 0.06% 0.20 - 0.60% Fee Income / Revenue 39% 40 - 50% Efficiency Ratio 66% 71% 60 - 65% 1 ROTCE, ROA, NIM, and NCO / Average Loans are annualized. ROTCE is a Non - GAAP number and reconciled in the appendix. 2 Current quarter is an estimate. 3 Adjusted ROTCE, ROA and Efficiency Ratio are Non - GAAP and are reconciled to the comparative GAAP numbers ROE, ROA and Efficiency Ratio in the appendix. Building Long - Term Earnings Power: Bonefish Targets Focused on Growing Our Company Selectively and Profitably While Positioning Our Balance Sheet for Sustainable, Higher Returns in the Long Term Risk Adjusted Margin Total Assets Earning Assets Pre-tax Income Tax Rate Annualized Net Charge-Offs 0.20% - 0.60% % Fee Income 30% - 40% Efficiency Ratio 60% - 65% Return on Tangible Common Equity 15%+ Equity / Assets Common Equity Tier 1 8% - 9% Return on Assets 1.10% - 1.30% Net Interest Margin 3.25% - 3.50%

13 Building the Foundation for Attractive Long - Term Earnings Power ▪ Expanding banking relationships with emphasis on economic profit ▪ Continued balance sheet growth momentum ▪ Focused on ongoing expense discipline ▪ Optimizing use of capital deployment ▪ Merger integration with Capital Bank on track Successfully Executing on Key Priorities FHN Is Well Positioned For Attractive Long - Term Earnings Power

APPENDIX 14

Notable Items 15 1Q 2Q 3Q 1 Pre - tax loss associated with legal matters in the Regional Banking segment ($22.0mm in 2Q16 and $2.7mm in 4Q16) and Non - Strategic segment ($4.0mm in 2Q16, $4.5mm in 3Q16 and $2.0mm in 4Q16). 2 Pre - tax expense reversal associated with legal matters in the Regional Banking segment. 4Q 2016 Pre - Tax Amount Branch Impairment $(3.7)mm $(26.0)mm Litigation Accrual 1 Valuation Adjustment for Derivatives Related to Prior Sales of Visa Class B Shares $(2.5)mm $4.4mm Gain Primarily Related to Recoveries Associated with Prior Mortgage Servicing Sales Litigation Accrual 1 Litigation Accrual Reversal 2 $(4.5)mm $4.3mm Litigation Accrual 1 $(4.7)mm 2017 Pre/After Tax Amount None $20.0mm Mortgage Repurchase Reserve Release Effective tax rate adjustment associated with the reversal of a capital loss deferred tax valuation allowance $19.5mm Acquisition Expense $(6.4)mm Mortgage Repurchase Reserve Release $31.4mm

16 2Q17 Credit Quality Summary by Portfolio Numbers may not add to total due to rounding. Data as of 2Q17. NM - Not meaningful. 1 Credit card, Permanent Mortgage, and Other. 2 Credit card, OTC, and Other Consumer. 3 Non - performing loan % excludes held - for - sale loans. 4 Net charge - offs are annualized. 5 Exercised clean - up calls on jumbo securitizations in 1Q13, 3Q12, 2Q11, and 4Q10, which are now on balance sheet in the Corporate segment. ($ in millions) CRE HE & HELOC Other 1 Total Permanent Mortgage Commercial (C&I & Other) HE & HELOC Permanent Mortgage Other 2 Total Period End Loans $12,178 $2,212 $3,695 $444 $18,529 $63 $420 $722 $249 $6 $19,989 30+ Delinquency 0.03% 0.01% 0.46% 0.81% 0.13% 6.52% - 2.62% 2.38% 1.95% 0.27% Dollars $4 $0 $17 $4 $24 $4 - $19 $6 $0 $53 NPL 3 % 0.17% 0.07% 0.54% 0.09% 0.23% 2.90% 0.95% 7.64% 10.30% 1.93% 0.65% Dollars $21 $2 $20 $0 $43 $2 $4 $55 $26 $0 $130 Net Charge-offs 4 % 0.04% NM NM 2.21% 0.07% NM NM NM 0.56% NM 0.06% Dollars $1 ($0) ($1) $2 $3 NM ($0) ($1) $0 ($0) $3 Allowance $91 $30 $18 $14 $153 NM $1 $28 $14 $0 $197 Allowance / Loans % 0.75% 1.38% 0.48% 3.13% 0.83% NM 0.34% 3.90% 5.80% 0.35% 0.99% Allowance / Net Charge-offs 17.85x NM NM 1.44x 12.65x NM NM NM NM NM 18.14x Commercial (C&I & Other) FHNC Regional Banking Corporate 5 Non-Strategic

17 Select C&I and CRE Portfolio Metrics Data as of 2Q17. Numbers may not add to total due to rounding. CRE retail exposure categories defined in the appendix. ▪ $12.6B C&I portfolio , diversified by industry ▪ Includes ~$525mm of retail exposure ▪ $2.2B CRE portfolio, diversified by geography and product type and comprises 11% of PE total loans ▪ Retail CRE at ~$500mm in 2Q17 ▪ Strong credit quality ▪ Mini - perm/Non - Construction of 76% ▪ Commercial (C&I and CRE) net charge - offs were $1.1mm for the quarter ▪ Gross charge - offs were $1.9mm with recoveries of $0.7mm CRE: Retail Exposure CRE: Collateral Type CRE: Geographic Distribution Retail 23% Hospit ality 13% TN 28% NC 19% GA 13% Industrial 12% Office 17% Land 1% Multi - Family 31% Other 18% TX 11% MS 5% SC 6% Regional Banking 2Q17 Average Commercial Loans Healthcare 3% Correspondent 3% Energy 1% Specialty Lending Areas Commercial Real Estate 16% Loans to Mortgage Companies 12% Franchise Finance 5% Commercial 33% Asset Based Lending 13% Anchor ed 33% Single - Tenant 22% Unanc hored 21% Shado w Anchor ed 18% Power Center 6%

18 Consumer Portfolio Overview $0,9 $0,6 $0,0 $0,5 $1,0 In Draw In Repayment HELOC Draw vs Repayment Balances Percent of Home Equity Portfolio: Months Left in Draw Period 18% 8% 6% 7% 7% 54% -10% 0% 10% 20% 30% 40% 50% 60% 0-12 13-24 25-36 37-48 49-60 >60 Home Equity Portfolio Characteristics 32,7% 32,0% 35,1% 38,2% 37,1% 30,0% 35,0% 40,0% $0,0 $0,4 $0,8 $1,2 2Q16 3Q16 4Q16 1Q17 2Q17 Constant Pre-Payment Rate (Right Axis) Non - Strategic Consumer Real Estate Run - Off $1.2B $1.0B Numbers may not add to total due to rounding. ($ in millions) 2Q16 3Q16 4Q16 1Q17 2Q17 Beginning Balance $114 $67 $67 $65 $65 Net Realized Losses $(16) $(0) $(1) $(0) $(8) Provision $(31) $(0) $(1) $(0) $(22) Ending Balance $67 $67 $65 $65 $35 Mortgage Repurchase Reserve First Second Total Balance ($B) $3.2 $1.2 $4.4 Original FICO 756 737 751 Refreshed FICO 757 728 749 Original CLTV 79% 81% 79% Full Doc 96% 79% 92% Owner Occupied 96% 95% 96% HELOCS ($B) $0.5 $1.0 $1.5 Weighted Average HELOC Utilization 42% 49% 47%

Fixed Income Maintains Stable Profitability in Soft Market Coastal Securities Adds New Revenue Stream, Diversifies Product Mix ▪ Fixed income average daily revenue (ADR) at $723k in 2Q17 vs $689k in 1Q17 and $1.1mm in 2Q16 ▪ LQ increase reflects Coastal acquisition, partially offset by a decrease in legacy FTN revenues ▪ YOY decrease was driven by muted trading activity as a result of challenging market conditions such as increased rates, a flattening yield curve and low market volatility ▪ Delivers consistently strong return on capital and provides counter - cyclicality to Regional Banking segment ▪ Business model adaptable to shifting market conditions due to highly variable expense structure 19 Fixed Income Revenue and Expense $0,0 $0,5 $1,0 $1,5 $0 $25 $50 $75 $100 2Q13 2Q14 2Q15 2Q16 2Q17 Revenue (left axis) Expense (left axis) ADR (right axis) $100mm $1.5mm LQ – Linked Quarter. YOY - Year over Year.
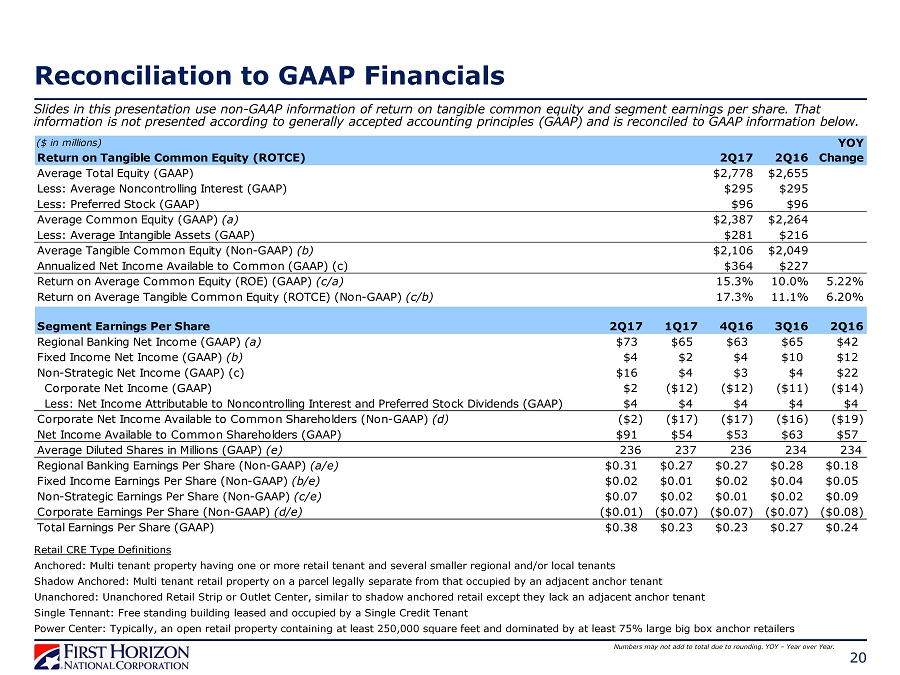
Reconciliation to GAAP Financials 20 Slides in this presentation use non - GAAP information of return on tangible common equity and segment earnings per share. That information is not presented according to generally accepted accounting principles (GAAP ) and is reconciled to GAAP information below. Numbers may not add to total due to rounding. YOY – Year over Year. Retail CRE Type Definitions Anchored: Multi tenant property having one or more retail tenant and several smaller regional and/or local tenants Shadow Anchored: Multi tenant retail property on a parcel legally separate from that occupied by an adjacent anchor tenant Unanchored: Unanchored Retail Strip or Outlet Center, similar to shadow anchored retail except they lack an adjacent anchor tenant Single Tennant: Free standing building leased and occupied by a Single Credit Tenant Power Center: Typically , an open retail property containing at least 250,000 square feet and dominated by at least 75% large big box anchor retailers ($ in millions) YOY Return on Tangible Common Equity (ROTCE) 2Q17 2Q16 Change Average Total Equity (GAAP) $2,778 $2,655 Less: Average Noncontrolling Interest (GAAP) $295 $295 Less: Preferred Stock (GAAP) $96 $96 Average Common Equity (GAAP) (a) $2,387 $2,264 Less: Average Intangible Assets (GAAP) $281 $216 Average Tangible Common Equity (Non-GAAP) (b) $2,106 $2,049 Annualized Net Income Available to Common (GAAP) (c) $364 $227 Return on Average Common Equity (ROE) (GAAP) (c/a) 15.3% 10.0% 5.22% Return on Average Tangible Common Equity (ROTCE) (Non-GAAP) (c/b) 17.3% 11.1% 6.20% Regional Banking Net Income (GAAP) (a) $73 $65 $63 $65 $42 Fixed Income Net Income (GAAP) (b) $4 $2 $4 $10 $12 Non-Strategic Net Income (GAAP) (c) $16 $4 $3 $4 $22 Corporate Net Income (GAAP) $2 ($12) ($12) ($11) ($14) Less: Net Income Attributable to Noncontrolling Interest and Preferred Stock Dividends (GAAP) $4 $4 $4 $4 $4 Corporate Net Income Available to Common Shareholders (Non-GAAP) (d) ($2) ($17) ($17) ($16) ($19) Net Income Available to Common Shareholders (GAAP) $91 $54 $53 $63 $57 Average Diluted Shares in Millions (GAAP) (e) 236 237 236 234 234 Regional Banking Earnings Per Share (Non-GAAP) (a/e) $0.31 $0.27 $0.27 $0.28 $0.18 Fixed Income Earnings Per Share (Non-GAAP) (b/e) $0.02 $0.01 $0.02 $0.04 $0.05 Non-Strategic Earnings Per Share (Non-GAAP) (c/e) $0.07 $0.02 $0.01 $0.02 $0.09 Corporate Earnings Per Share (Non-GAAP) (d/e) ($0.01) ($0.07) ($0.07) ($0.07) ($0.08) Total Earnings Per Share (GAAP) $0.38 $0.23 $0.23 $0.27 $0.24 Segment Earnings Per Share 2Q17 1Q17 4Q16 3Q16 2Q16

Reconciliation to GAAP Financials 21 Slides in this presentation use non - GAAP information of FHN adjusted noninterest expense, PPNR, pre - tax income, net income available to common, earnings per share, ROTCE, ROA, and efficiency ratio. That information is not presented according to generally accepted accounting principles (GAAP ) and is reconciled to GAAP information below. Numbers may not add to total due to rounding. Refer to slide 15 for additional detail on notable items. LQ – Linked Quarter. YOY – Year over Year. 1 Pre - provision net revenue is not a GAAP number but is used in regulatory stress test reporting. The presentation of PPNR follows the regulatory definition. 2 Tax - affected notable items assume an effective tax rate of ~39%. ($ in millions) Adjusted Noninterest Expense 2Q17 1Q17 2Q16 LQ YOY Noninterest Expense (GAAP) $218 $222 $227 -2% -4% Less: Notable Items (GAAP) ($14) ($3) Adjusted Noninterest Expense (Non-GAAP) $232 $222 $230 4% 1% Adjusted Pre-Provision Net Revenue Pre-Provision Net Revenue 1 $110 $84 $95 30% 16% Plus: Notable Items (GAAP) ($14) ($3) Adjusted Pre-Provision Net Revenue $96 $84 $92 14% 5% Adjusted Pre-Tax Income Pre-Tax Income (GAAP) $112 $85 $91 32% 24% Plus: Notable Items (GAAP) ($14) ($3) Adjusted Pre-Tax Income (Non-GAAP) $99 $85 $88 16% 12% Adjusted Net Income Available to Common / Earnings Per Share Net Income Available to Common (GAAP) $91 $54 $57 68% 61% Plus: Tax-Affected Notable Items (GAAP) 2 ($28) ($2) Adjusted Net Income Available to Common (Non-GAAP) $63 $54 $55 17% 15% Divided: Average Common Diluted Shares (GAAP) 236 237 234 Adjusted Earnings Per Share (Non-GAAP) $0.27 $0.23 $0.23 17% 14% LQ YOY Annualized Adjusted Net Income Available to Common (Non-GAAP) $252 $219 $220 Average Tangible Common Equity (Non-GAAP) $2,106 $2,120 $2,049 Adjusted Return on Tangible Common Equity (Non-GAAP) 12.0% 10.3% 10.7% 1.66% 1.24% Adjusted Return on Assets Net Income (GAAP) $95 $58 $61 Plus: Tax-affected Notable Items (GAAP) 2 ($28) ($2) Annualized Adjusted Net Income (Non-GAAP) $270 $237 $238 Average Total Assets (GAAP) $28,876 $28,806 $26,829 Adjusted Return on Assets (Non-GAAP) 0.94% 0.82% 0.89% 0.12% 0.05% Adjusted Efficiency Ratio Adjusted Noninterest Expense (Non-GAAP) $232 $222 $230 Revenue Excluding Securities Gains (GAAP) $328 $307 $322 Adjusted Efficiency Ratio (Non-GAAP) 71% 72% 71% Adjusted Return on Tangible Common Equity (ROTCE) BPS Change % Change
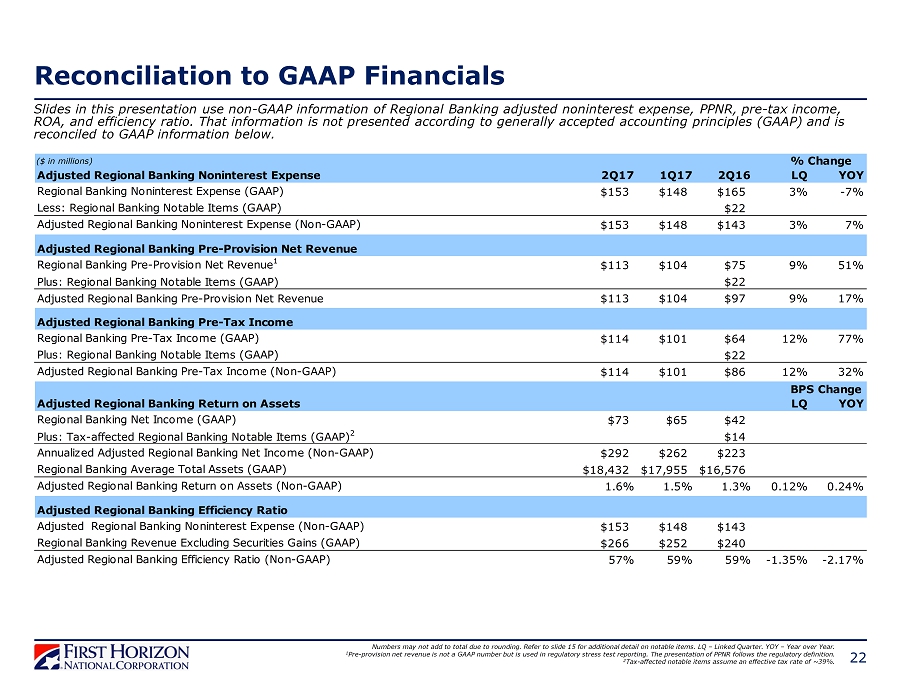
Reconciliation to GAAP Financials 22 Slides in this presentation use non - GAAP information of Regional Banking adjusted noninterest expense, PPNR, pre - tax income, ROA, and efficiency ratio. That information is not presented according to generally accepted accounting principles (GAAP ) and is reconciled to GAAP information below. Numbers may not add to total due to rounding. Refer to slide 15 for additional detail on notable items . LQ – Linked Quarter. YOY – Year over Year. 1 Pre - provision net revenue is not a GAAP number but is used in regulatory stress test reporting. The presentation of PPNR follows the regulatory definition. 2 Tax - affected notable items assume an effective tax rate of ~39%. ($ in millions) Adjusted Regional Banking Noninterest Expense 2Q17 1Q17 2Q16 LQ YOY Regional Banking Noninterest Expense (GAAP) $153 $148 $165 3% -7% Less: Regional Banking Notable Items (GAAP) $22 Adjusted Regional Banking Noninterest Expense (Non-GAAP) $153 $148 $143 3% 7% Adjusted Regional Banking Pre-Provision Net Revenue Regional Banking Pre-Provision Net Revenue 1 $113 $104 $75 9% 51% Plus: Regional Banking Notable Items (GAAP) $22 Adjusted Regional Banking Pre-Provision Net Revenue $113 $104 $97 9% 17% Adjusted Regional Banking Pre-Tax Income Regional Banking Pre-Tax Income (GAAP) $114 $101 $64 12% 77% Plus: Regional Banking Notable Items (GAAP) $22 Adjusted Regional Banking Pre-Tax Income (Non-GAAP) $114 $101 $86 12% 32% LQ YOY Regional Banking Net Income (GAAP) $73 $65 $42 Plus: Tax-affected Regional Banking Notable Items (GAAP) 2 $14 Annualized Adjusted Regional Banking Net Income (Non-GAAP) $292 $262 $223 Regional Banking Average Total Assets (GAAP) $18,432 $17,955 $16,576 Adjusted Regional Banking Return on Assets (Non-GAAP) 1.6% 1.5% 1.3% 0.12% 0.24% Adjusted Regional Banking Efficiency Ratio Adjusted Regional Banking Noninterest Expense (Non-GAAP) $153 $148 $143 Regional Banking Revenue Excluding Securities Gains (GAAP) $266 $252 $240 Adjusted Regional Banking Efficiency Ratio (Non-GAAP) 57% 59% 59% -1.35% -2.17% Adjusted Regional Banking Return on Assets BPS Change % Change