Attached files
| file | filename |
|---|---|
| EX-32.1 - EX-32.1 - AeroVironment Inc | avav-20170430ex3210f313d.htm |
| EX-31.2 - EX-31.2 - AeroVironment Inc | avav-20170430ex312948bba.htm |
| EX-31.1 - EX-31.1 - AeroVironment Inc | avav-20170430ex311069797.htm |
| EX-23.1 - EX-23.1 - AeroVironment Inc | avav-20170430ex231564f45.htm |
| EX-21.1 - EX-21.1 - AeroVironment Inc | avav-20170430ex211eb5ba2.htm |
| EX-10.39 - EX-10.39 - AeroVironment Inc | avav-20170430ex1039734cb.htm |
| EX-10.36 - EX-10.36 - AeroVironment Inc | avav-20170430ex1036b3177.htm |
| EX-10.17 - EX-10.17 - AeroVironment Inc | avav-20170430ex10170b927.htm |
| EX-10.15 - EX-10.15 - AeroVironment Inc | avav-20170430ex1015c748b.htm |
| EX-10.10 - EX-10.10 - AeroVironment Inc | avav-20170430ex1010971ed.htm |
UNITED STATES
SECURITIES AND EXCHANGE COMMISSION
Washington, D.C. 20549
FORM 10‑K
|
☒ |
Annual Report Pursuant to Section 13 or 15(d) of the Securities Exchange Act of 1934 |
|
For the fiscal year ended April 30, 2017 |
|
|
☐ |
Transition Report Pursuant to Section 13 or 15(d) of the Securities Exchange Act of 1934 |
|
For the transition period from to |
|
Commission file number 001‑33261
AEROVIRONMENT, INC.
(Exact name of registrant as specified in its charter)
|
Delaware |
95‑2705790 |
|
(State or other jurisdiction of incorporation or organization) |
(I.R.S. Employer Identification No.) |
|
800 Royal Oaks Drive, Suite 210 |
|
|
Monrovia, CA |
91016 |
|
(Address of Principal Executive Offices) |
(Zip Code) |
|
Registrant’s telephone number, including area code: (626) 357‑9983 |
|
Securities registered pursuant to Section 12(b) of the Act:
|
Title of Class |
|
Name of each exchange on which registered |
|
Common Stock, par value $0.0001 per share |
|
The NASDAQ Stock Market LLC |
Securities registered pursuant to Section 12(g) of the Act:
None
Indicate by check mark if the registrant is a well‑known seasoned issuer, as defined in Rule 405 of the Securities Act. Yes ☐ No ☒
Indicate by check mark if the registrant is not required to file reports pursuant to Section 13 or 15(d) of the Act. Yes ☐ No ☒
Indicate by check mark whether the registrant (1) has filed all reports required to be filed by Section 13 or 15(d) of the Securities Exchange Act of 1934 during the preceding 12 months (or for such shorter period that the registrant was required to file such reports), and (2) has been subject to such filing requirements for the past 90 days. Yes ☒ No ☐
Indicate by check mark whether the registrant has submitted electronically and posted on its corporate Web site, if any, every Interactive Data File required to be submitted and posted pursuant to Rule 405 of Regulation S‑T (§232.405 of this chapter) during the preceding 12 months (or for such shorter period that the registrant was required to submit and post such files). Yes ☒ No ☐
Indicate by check mark if disclosure of delinquent filers pursuant to Item 405 of Regulation S‑K is not contained herein, and will not be contained, to the best of registrant’s knowledge, in definitive proxy or information statements incorporated by reference in Part III of this Form 10‑K or any amendment to this Form 10‑K. ☒
Indicate by check mark whether the registrant is a large accelerated filer, an accelerated filer, a non-accelerated filer, a smaller reporting company, or an emerging growth company. See the definitions of “large accelerated filer,” “accelerated filer,” “smaller reporting company,” and “emerging growth company” in Rule 12b-2 of the Exchange Act.
Large accelerated filer ☐ Accelerated filer ☒Smaller reporting company ☐
Non-accelerated filer ☐ (Do not check if a smaller reporting company) Emerging growth company ☐
If an emerging growth company, indicate by check mark if the registrant has elected not to use the extended transition period for complying with any new or revised financial accounting standards provided pursuant to Section 13(a) of the Exchange Act. ☐
Indicate by check mark whether the registrant is a shell company (as defined in Rule 12b‑2 of the Act). Yes ☐ No ☒
The aggregate market value of the voting stock held by non‑affiliates of the registrant, based on the closing price on the NASDAQ Global Select Market on October 29, 2016 was approximately $504.9 million.
As of June 20, 2017, the issuer had 23,729,911 shares of common stock, par value $0.0001 per share, issued and outstanding.
DOCUMENTS INCORPORATED BY REFERENCE
Portions of the registrant’s definitive proxy statement to be filed with the Securities and Exchange Commission pursuant to Regulation 14A not later than 120 days after the conclusion of the registrant’s fiscal year ended April 30, 2017, are incorporated by reference into Part III of this Form 10‑K.
INDEX TO FORM 10‑K
1
Forward‑Looking Statements
This Annual Report on Form 10‑K, or Annual Report, contains forward‑looking statements, which reflect our current views about future events and financial results. We have made these statements in reliance on the safe harbor created by the Private Securities Litigation Reform Act of 1995 (set forth in Section 27A of the Securities Act of 1933, as amended, or the Securities Act, and Section 21E of the Securities Exchange Act of 1934, as amended, or the Exchange Act). Forward‑looking statements include our views on future financial results, financing sources, product development, capital requirements, market growth and the like, and are generally identified by terms such as “may,” “will,” “should,” “could,” “targets,” “projects,” “predicts,” “contemplates,” “anticipates,” “believes,” “estimates,” “expects,” “intends,” “plans” and similar words. Forward‑looking statements are merely predictions and therefore inherently subject to uncertainties and other factors which could cause the actual results to differ materially from the forward‑looking statement. These uncertainties and other factors include, among other things:
|
· |
unexpected technical and marketing difficulties inherent in major research and product development efforts; |
|
· |
availability of U.S. government funding for defense procurement and research and development programs; |
|
· |
the extensive regulatory requirements governing our contracts with the U.S. government and the results of any audit or investigation of our compliance therewith; |
|
· |
our ability to remain a market innovator and to create new market opportunities; |
|
· |
the potential need for changes in our long‑term strategy in response to future developments; |
|
· |
unexpected changes in significant operating expenses, including components and raw materials; |
|
· |
changes in the supply, demand and/or prices for our products and services; |
|
· |
increased competition, including from firms that have substantially greater resources than we have and in the UAS business from lower‑cost consumer drone manufacturers who may seek to enhance their systems’ capabilities over time; |
|
· |
the complexities and uncertainty of obtaining and conducting international business, including export compliance and other reporting requirements; |
|
· |
the impact of potential security and cyber threats; |
|
· |
uncertainty in the customer adoption rate of commercial use unmanned aircraft systems and electric vehicles; |
|
· |
changes in the regulatory environment; and |
|
· |
general economic and business conditions in the United States and elsewhere in the world. |
Set forth below in Item 1A, “Risk Factors” are additional significant uncertainties and other factors affecting forward‑looking statements. The reader should understand that the uncertainties and other factors identified in this Annual Report are not a comprehensive list of all the uncertainties and other factors that may affect forward‑looking statements. We do not undertake any obligation to update or revise any forward‑looking statements or the list of uncertainties and other factors that could affect those statements.
2
Overview
We design, develop, produce, support and operate a technologically‑advanced portfolio of products and services for government agencies, businesses and consumers. We supply unmanned aircraft systems (“UAS”) and related services to organizations within the U.S. Department of Defense (“DoD”) and to international allied governments, and tactical missile systems and related services primarily to organizations within the U.S. Government. We also supply charging systems and services for electric vehicles, or EVs, and power cycling and test systems to commercial, consumer and government customers. We derive the majority of our revenue from these business areas and we believe that the markets for these solutions have significant growth potential. Additionally, we believe that some of the innovative potential products and services in our research and development pipeline will emerge as new growth platforms in the future, creating additional market opportunities.
Our success with current products and services stems from our investment in research and development and our ability to invent and deliver advanced solutions, utilizing proprietary and commercially available technologies, to help our government, commercial and consumer customers operate more effectively and efficiently. We develop these highly innovative solutions by working very closely with our key customers in each segment of our business to solve their most important challenges related to our areas of expertise. Our core technological capabilities, developed through more than 45 years of innovation, include lightweight aerostructures; power electronics; electric propulsion systems; efficient electric power generation, conversion, and storage systems; high‑density energy packaging; miniaturization; digital data links (“DDL”); aircraft sensors; controls integration; systems integration; engineering optimization; electric propulsion; vertical takeoff fixed wing flight and autonomy, each coupled with professional field service capabilities.
Our UAS business segment focuses primarily on the design, development, production, marketing, support and operation of innovative UAS and tactical missile systems and the delivery of UAS‑related services that provide situational awareness, remote sensing, multi‑band communications, force protection and other information and mission effects to increase the safety and effectiveness of our customers’ operations. Our Efficient Energy Systems, or EES, business segment focuses primarily on the design, development, production, marketing, support and operation of innovative efficient electric energy systems that address the growing demand for electric transportation solutions.
Our Strategy
As a technology solutions provider, our strategy is to develop innovative, safe and reliable new solutions that provide customers with valuable benefits and enable us to create new markets or market segments, gain market share and grow as market adoption increases. We believe that by introducing new solutions that provide customers with compelling value we are able to create new markets or market segments and then grow our positions within those markets or market segments profitably, instead of entering existing markets and competing directly against large, incumbent competitors that may possess advantages in scope, scale, resources and relationships.
We intend to grow our business by preserving a leadership position in the UAS, tactical missile system, electric vehicle charging system and power cycling and test system markets, and by creating new solutions that enable us to create and establish leadership positions in new markets. Key components of this strategy include the following:
Expand our market leadership to grow existing markets and create new adjacent markets. Our small UAS, tactical missile systems, electric vehicle charging systems and power cycling and test systems enjoy leading positions in their respective markets. We intend to increase the penetration of our small UAS products and services within the U.S. military, the military forces of allied nations, other government agencies and non‑government organizations, including commercial entities, and to increase the penetration of our tactical missile systems within the U.S. military and allied nations. We believe that the broad adoption of our small UAS by the U.S. military will continue to spur demand by allied nations, and that our efforts to pursue new applications are creating opportunities beyond the early adopter military market. We similarly intend to increase the penetration of our electric vehicle charging systems and services, and our power cycling and test systems, into existing and new customer segments globally.
3
Deliver innovative new solutions. Customer‑focused innovation is the primary driver of our growth. We plan to continue pursuing internal and customer‑funded research and development to develop better, more capable products, services and business models, both in response to and in anticipation of emerging customer needs. In some cases, these innovations result in upgrades to existing offerings, expanding their value among existing customers and markets. In other cases, these innovations become entirely new solutions that position us to address new markets, customers and business opportunities. We believe focused research and development investments will allow us to deliver innovative new products and services that address market needs within and outside of our current target markets, and enable us to create new opportunities for growth. We view strategic partners as a means by which to further the reach of our innovative solutions through access to new markets, customers and complementary capabilities.
Foster our entrepreneurial culture and continue to attract, develop and retain highly‑skilled personnel. Our company culture encourages innovation and an entrepreneurial spirit, which helps to attract and retain highly‑skilled professionals. We intend to preserve this culture to encourage the development of the innovative, highly technical system solutions and business models that give us our competitive advantage. A core component of our culture is our intent to demonstrate trust and integrity in all of our interactions, contributing to a positive work environment and engendering loyalty among our employees and customers.
Preserve our agility and flexibility. We respond rapidly to evolving markets, solve complicated customer problems, and strive to deliver new products, services and capabilities quickly, efficiently and affordably relative to available alternatives. We believe our agility and flexibility help us to strengthen our relationships with customers and partners. We intend to maintain our agility and flexibility, which we believe to be important sources of differentiation when we compete against organizations with more extensive resources.
Effectively manage our growth portfolio for long‑term value creation. Our production and development programs and services position us for investment opportunities that we believe will deliver long‑term growth by providing our customers with valuable new capabilities. We evaluate each opportunity independently and within the context of other investment opportunities to determine its relative timing and potential, and thereby its priority. This process helps us to make informed decisions regarding potential growth capital requirements and supports how we allocate resources based on relative risks and returns to maximize long‑term value creation, which is a key element of our growth strategy.
Customers
We sell the majority of our UAS and tactical missile systems and services to organizations within the DoD, including the U.S. Army, Marine Corps, Special Operations Command, Air Force and Navy. Our EES business segment generates revenue from commercial, consumer and, to a lesser extent, government customers.
During our fiscal year ended April 30, 2017, we generated approximately 18% of our revenue from the U.S. Army pursuant to orders placed under contract by the U.S. Army on behalf of itself as well as several other organizations within the DoD. Other U.S. government agencies and government subcontractors accounted for 37% of our sales revenue, while purchases by foreign, commercial and consumer customers accounted for the remaining 45% of sales revenue during our fiscal year ended April 30, 2017.
Technology, Research and Development
Technological Competence and Intellectual Property
Our company was founded by the late Dr. Paul B. MacCready, the former Chairman of our board of directors and an internationally renowned innovator who was instrumental in establishing our entrepreneurial and creative culture. This culture has consistently enabled us to attract and retain highly‑motivated, talented employees and has established our reputation as an innovative leader in the industries in which we compete.
The innovations developed by our company and our founder include, among others: the world’s first effective human‑powered and manned solar‑powered airplanes; the first modern passenger electric car, the EV1 prototype for
4
General Motors; the world’s highest flying airplane in level flight, Helios™, a solar‑powered unmanned aircraft system that reached over 96,000 feet above sea level in 2001; Global Observer, the world’s first liquid hydrogen‑fueled unmanned aircraft system; the Nano Hummingbird™, the world’s first flapping wing unmanned aircraft system capable of precise hover and omni‑directional flight; TurboCord™, the smallest, most portable UL‑listed 240‑volt EV charger; and Blackwing™, the first submarine-launched unmanned aircraft system deployed by the U.S. Navy. The Smithsonian Institution possesses seven vehicles developed by our company or our founder in its permanent collection. Our history of innovation excellence is the result of our talented, creative and skilled employees whom we encourage to invent and develop innovative new solutions.
A component of our ongoing innovation is a screening process that helps our business managers identify early market needs, which assists us in making timely investments into critical technologies necessary to develop solutions to address these needs. Similarly, we manage new product and business concepts through a commercialization process that balances spending, resources, time and intellectual property considerations against market requirements and potential returns on investment. Strongly linking our technology and business development activities to customer needs in attractive growth markets constitutes an important element of this process. Through the process we revisit our customer requirement assumptions to evaluate continued investment and to help ensure that our products and services deliver high value.
As a result of our commitment to research and development, we possess an extensive portfolio of intellectual property in the form of patents, trade secrets, copyrights and trademarks across a broad range of UAS and advanced energy technologies. As of April 30, 2017, we had 168 U.S. patents issued; 113 U.S. patent applications pending; 17 active Patent Cooperation Treaty applications; and numerous foreign patents and applications. In many cases, when appropriate and to preserve confidentiality, we opt to protect our intellectual property through trade secrets as opposed to filing for patent protection.
The U.S. government has licenses to some of our intellectual property that was specifically developed in performance of government contracts, and may use or authorize others to use this intellectual property. In some cases we fund the development of certain intellectual property to maximize its value and limit its use by potential competitors. While we consider the development and protection of our intellectual property to be integral to the future success of our business, at this time we do not believe that a loss or limitation of rights to any particular piece of our intellectual property would have a material adverse effect on our overall business.
Research, Development and Commercialization Projects
A core component of our business strategy is the focused development and commercialization of innovative solutions that we believe can become new products or services that enable us to create large new markets or accelerate the growth of our current products and services. We invest in an active pipeline of these commercialization projects that range in maturity from technology validation to early market adoption. We cannot predict when, if ever, we will successfully commercialize these projects, or the exact level of capital expenditures they could require, which could be substantial.
For the fiscal years ended April 30, 2017, 2016 and 2015, our internal research and development spending amounted to 12%, 16% and 18%, of our revenue, respectively, and customer‑funded research and development spending amounted to an additional 16%, 20% and 14%, of our revenue, respectively.
Sales and Marketing
Our marketing strategy is based on developing leadership positions in new markets that we create through the introduction of innovation solutions that improve customer operational effectiveness and efficiency. Our ability to operate in an agile, flexible manner helps us achieve first mover advantage and work closely with early customers to achieve the successful adoption of our solutions. Once we establish a market position we work to maintain our leadership position while growing our revenue by expanding sales and through continuous innovation and customer support. Our reputation for innovation is a key component of our brand and has been acknowledged through a variety of awards and recognized in numerous articles in domestic and international publications. We have U.S. registered
5
trademarks for AeroVironment, AV, Switchblade, Raven, Wasp, Snipe, EV Solutions, TurboCord, PosiCharge, BMID, and Battery RX, and have several other pending applications for trademark registration.
International Sales
We contract with international sales representatives and team with domestic organizations in a number of foreign markets and believe that these markets represent growth opportunities for our business. Our international sales accounted for approximately 36%, 28% and 9%, of our revenue for the fiscal years ended April 30, 2017, 2016 and 2015, respectively.
Competition
We believe that the principal competitive factors in the markets for our products and services include product performance; safety; features; acquisition cost; lifetime operating cost, including maintenance and support; ease of use; rapid integration with existing equipment and processes; quality; reliability; customer support; and brand and reputation.
Manufacturing and Operations
We pursue a lean and efficient production strategy across our business segments, focusing on rapid prototyping, supply chain management, final assembly, integration, quality and final acceptance testing. Using concurrent engineering techniques within an integrated product team structure, we rapidly prototype design concepts and products, while working to optimize our designs to meet manufacturing requirements, mission capabilities and customer specifications. Within this framework we develop our products with feedback and input from manufacturing, quality, supply chain management, key suppliers, logistics personnel and customers. We incorporate this input into product designs in an effort to maximize the efficiency and quality of our products. As a result, we believe that we significantly reduce the time required to move a product from its design phase to full‑rate production deliveries while achieving high reliability, quality and yields.
We outsource certain production activities, such as the fabrication of structures, the manufacture of electronic printed circuit board subassemblies, payload components and the medium to high volume production of our EV charging products, to qualified suppliers, with many of whom we have long‑term relationships. This outsourcing enables us to focus on final assembly, system integration and test processes for our products, ensuring high levels of quality and reliability. We forge strong relationships with key suppliers based on their ability to grow with our production needs and support our growth plans. We continue to expand upon our suppliers’ expertise to improve our existing products and develop new solutions. We rely on both single and multiple suppliers for certain components and subassemblies. See “Risk Factors—If critical components or raw materials used to manufacture our products become scarce or unavailable, then we may incur delays in manufacturing and delivery of our products, which could damage our business” for more information. All of our production system operations incorporate internal and external quality programs and processes to increase acceptance rates, reduce lead times and lower cost.
Customer Funded Research and Development
We actively pursue externally funded projects that help us to strengthen our technological capabilities. Our UAS business segment submits bids to large research customers such as the Defense Advanced Research Projects Agency, the U.S. Air Force, the U.S. Army and the U.S. Special Operations Command for projects that we believe have future commercial application. Providing these services contributes to the development and enhancement of our technical competencies. In an effort to manage the ability of our key technical personnel to support multiple, high‑value research and development initiatives, we attempt to limit the volume of customer funded research and development projects that we accept. This process enables us to focus these personnel on projects we believe offer the greatest current and future value to our business.
6
Seasonality
Historically, and more pronounced in recent years, our revenues in the second half of our fiscal year have exceeded our revenues in the first half of our fiscal year. The factors that affect our revenue recognition between accounting periods include the timing of new contract awards, the availability of U.S. government and international government funding, lead time to manufacture our family of systems to customer specification, customer acceptance and other regulatory requirements. We expect this trend to continue in our fiscal year 2018.
Raw Materials and Suppliers
Historically, we have not experienced significant delays in the supply or availability of our key raw materials or components provided by our suppliers, nor have we experienced a significant price increase for raw materials or components. We do not anticipate any such delays or significant price increases in our fiscal year 2018.
Contract Mix
The table below shows our revenue for the periods indicated by contract type, including both government and commercial sales:
|
|
|
Fiscal Year Ended |
|
|
||||||
|
|
|
April 30, |
|
|
||||||
|
|
|
2017 |
|
|
2016 |
|
|
2015 |
|
|
|
Fixed-price contracts |
|
79 |
% |
|
78 |
% |
|
85 |
% |
|
|
Cost-reimbursable contracts |
|
21 |
% |
|
22 |
% |
|
15 |
% |
|
Employees
As of April 30, 2017, we had 661 full‑time employees, of whom 218 were in research and development and engineering, 58 were in sales and marketing, 242 were in operations and 143 were general and administrative personnel. We believe that we have a good relationship with our employees.
Backlog
We define funded backlog as unfilled firm orders for products and services for which funding currently is appropriated to us under the contract by the customer. As of April 30, 2017 and 2016, our funded backlog was approximately $78.0 million and $65.8 million, respectively. We expect that approximately 97% of our funded backlog will be filled during our fiscal year ending April 30, 2018.
In addition to our funded backlog, we had unfunded backlog of $24.6 million and $16.7 million as of April 30, 2017 and 2016, respectively. We define unfunded backlog as the total remaining potential order amounts under cost reimbursable and fixed price contracts with multiple one‑year options, and indefinite delivery, indefinite quantity, or IDIQ contracts. Unfunded backlog does not obligate the U.S. government to purchase goods or services. There can be no assurance that unfunded backlog will result in any orders in any particular period, if at all. Management believes that unfunded backlog does not provide a reliable measure of future estimated revenue under our contracts. Unfunded backlog does not include the remaining potential value associated with a U.S. Army IDIQ‑type contract for small UAS because that contract was awarded to five companies in 2012, including AeroVironment, and we cannot be certain that we will receive all task orders issued against the contract.
Because of possible future changes in delivery schedules and/or cancellations of orders, backlog at any particular date is not necessarily representative of actual sales to be expected for any succeeding period, and actual sales for the year may not meet or exceed the backlog represented. Our backlog is typically subject to large variations from quarter to quarter as existing contracts expire, are renewed, or new contracts are awarded. A majority of our contracts, specifically our IDIQ contracts, do not obligate the U.S. government to purchase any goods or services. Additionally, all
7
U.S. government contracts included in backlog, whether or not they are funded, may be terminated at the convenience of the U.S. government.
Other Information
AeroVironment, Inc. was originally incorporated in the State of California in July 1971 and reincorporated in Delaware in 2006.
Our principal executive offices are located at 800 Royal Oaks Drive, Suite 210, Monrovia, California 91016. Our telephone number is (626) 357‑9983. Our website home page is http://www.avinc.com. We make our website content available for information purposes only. It should not be relied upon for investment purposes, nor is it incorporated by reference into this Annual Report.
We make our annual reports on Form 10‑K, quarterly reports on Form 10‑Q, current reports on Form 8‑K and proxy statements for our annual stockholders’ meetings, as well as any amendments to those reports, available free of charge through our website as soon as reasonably practical after we electronically file that material with, or furnish it to, the Securities and Exchange Commission, or SEC. You can learn more about us by reviewing our SEC filings. Our SEC reports can be accessed through the investor relations page of our web site at http://investor.avinc.com. These reports may also be obtained at the SEC’s public reference room at 100 F. Street, N.E., Washington, DC 20549. The SEC also maintains a web site at www.sec.gov that contains our reports, proxy statements and other information regarding us.
Unmanned Aircraft Systems
Our UAS business segment addresses the increasing economic and security value of network‑centric intelligence, surveillance and reconnaissance, or ISR, communications, remote sensing and effects delivery with innovative UAS and tactical missile system solutions.
Industry Background
Small UAS
The market for small UAS has grown significantly since the early 2000s driven largely by the demands associated with the global threat environment and the resulting procurement by military customers, the early adopters for this technology. Small UAS now represent an accepted and enduring capability for the military. The U.S. military’s transformation into a smaller, more agile force that operates via a network of observation, communication and precision targeting technologies accelerated following the terrorist attacks of September 11, 2001, as it required improved, distributed observation and targeting of enemy combatants who operate in small groups, often embedded in dense population centers or dispersed in remote locations. We believe that UAS, which range from large systems, such as Northrop Grumman’s Global Hawk and General Atomics’ Predator, Sky Warrior, Reaper and Gray Eagle, to small systems, such as our Raven, Wasp AE, Puma AE and Snipe, serve as integral components of today’s military force. These systems provide critical observation and communications capabilities serving the increasing demand for actionable intelligence, while reducing risk to individual “warfighters.” Small UAS can provide real‑time observation and communication capabilities to the small units who control them. As airspace regulations in the U.S. and other nations evolve to accommodate the commercial use of small UAS, we are furthering the application of small UAS technology in new markets such as energy, precision agriculture, transportation, infrastructure and public safety. We expect further growth through the introduction of UAS technology and services to these emerging commercial applications.
Tactical Missile Systems
The development of weapons capable of rapid deployment and precision strike while minimizing the risk to surrounding civilians, property and operators accelerated in recent years due to advances in enabling technologies. Weapons such as laser‑guided missiles, “smart” bombs and GPS‑guided artillery shells have dramatically improved the accuracy of strikes against hostile targets. When ground forces find themselves engaged in a firefight or near a target,
8
their ability to employ a precision weapon system quickly and easily can mean the difference between mission success and failure. A rapidly deployable solution could address emerging requirements beyond ground engagements for use in other types of situations and from a variety of sea, air and land platforms. We believe that embedding a precision lethal payload into a remotely controlled, man‑portable delivery system provides warfighters with a valuable and more cost‑effective alternative to existing airborne and land‑based missile systems.
Large UAS
We believe a market opportunity exists for large UAS that can fly for long periods of time to provide continuous remote sensing and communications in an affordable manner over great distances. Existing solutions such as communications satellites and manned and unmanned aircraft address some of the emerging demand for this capability, but do so at relatively high financial and resource costs. Geosynchronous satellites provide fixed, continuous communications capabilities to large portions of the globe, but they operate more than 20,000 miles from the surface of the earth, therefore limiting the bandwidth they can provide and requiring relatively larger, higher power ground stations. Remote sensing satellites typically operate at lower altitudes, but are unable to maintain geosynchronous positions, meaning they are moving with respect to the surface of the earth, resulting in a limited presence over specific areas of interest and significant periods of time during which they are not present over those areas. UAS that are capable of operating in an affordable manner for extended periods of time over an area of interest without gaps in availability while carrying a communications or observation payload could help to satisfy this need.
Our UAS Solutions
We supply our UAS products and services to multiple customers inside and outside of the United States. For the fiscal years ended April 30, 2017, 2016 and 2015, our UAS segment products and services accounted for 86%, 89% and 85%, of our revenue, respectively.
Small UAS Products
Our small UAS, including Raven, Wasp AE, Puma AE and Snipe, are designed to operate reliably a few hundred feet above the ground in a wide range of environmental conditions, providing a vantage point from which to deliver valuable information. Military forces employ our small UAS to deliver intelligence, surveillance and reconnaissance (“ISR”), and communications, including real‑time tactical reconnaissance, tracking, combat assessment and geographic data, directly to the small tactical unit or individual operator, thereby increasing flexibility in mission planning and execution. In commercial applications, we operate our small UAS as part of a turnkey information solution to deliver advanced analysis and prescriptive actions that can reduce costs, enhance safety and increase revenue. Our small UAS wirelessly transmit critical live video and other information generated by their payload of electro‑optical, infrared or other sensors directly to a hand‑held ground control unit, enabling the operator to view and capture images, during the day or at night, on the control unit. Certain sensors generate a volume of data significantly larger than wireless bandwidth can accommodate, requiring the transfer of data once the air vehicle has landed. Our ground control systems allow the operator to control the aircraft by programming it for GPS‑based autonomous navigation using operator‑designated way‑points, or by manual flight operation. The ground control systems are designed for durability and ease of use in harsh environments and incorporate a user‑friendly, intuitive user interface. All of our fixed wing small UAS currently in production for military customers operate from our common ground control system.
We designed our small UAS to be transportable by a single person, assembled without tools in less than five minutes and launched and operated by one or two people, with limited training required. The efficient and reliable electric motors used in all of our small UAS are powered by modular battery packs that can be replaced quickly, enabling rapid return to flight. We designed all of our small UAS to be reusable for hundreds of flights under normal operating circumstances and to be recovered through an autonomous landing feature that enables a controlled descent to a designated location.
9
In military applications, our small UAS provide forward aerial observation capabilities that enable tactical commanders to observe around the next corner, to the next intersection or past a ridgeline in real‑time. This information facilitates faster, safer movement through urban, rural and mountainous environments and can enable troops to be proactive based on field intelligence rather than reactive to attack. Moreover, by providing this information, our systems reduce the risk to warfighters and to the surrounding population by providing the ability to tailor the military response to the threat. U.S. military personnel regularly use our small UAS, such as Raven, for missions such as force protection, combat observation and damage assessment. These reusable systems are easy to transport, assemble and operate and are relatively quiet when flying at typical operational altitudes of 200 to 300 feet above ground level, the result of our efficient electric propulsion systems. Furthermore, their small size makes them difficult to see from the ground. In addition, the low cost of our small UAS relative to larger systems and alternatives makes it practical for customers to deploy these assets directly to warfighters.
In emerging commercial applications, our small UAS enable enterprises to manage valuable assets such as crops, powerlines and railroad infrastructure, more effectively and safely than previously possible. Our Quantix data collection drone and our commercial information services, consisting of trained operators, advanced sensors, cloud‑based data processing and application‑specific analysis, are designed to provide our customers with more accurate and timely information regarding their infrastructure, such as pipelines, roads and bridges, and can provide companies with agriculture operations with more accurate and timely information regarding their crops. Better and more timely information can translate into more efficient maintenance activities that prevent downtime, in the case of the energy industry, and more efficient use of scarce resources such as water, for agriculture.
Our small UAS offering also includes spare equipment, alternative payload modules, batteries, chargers, repair services and customer support. We provide training by our highly‑skilled instructors, who typically have extensive military experience, and continuous refurbishment and repair services for our products. By maintaining close contact with our customers and users in the field, we gather critical feedback on our products and incorporate that information into ongoing product development and research and development efforts. This approach enables us to improve our solutions in response to, and in anticipation of, evolving customer needs.
Each system in our small UAS portfolio typically includes multiple aircraft, our common and interoperable hand‑held ground control system and an array of spare parts and accessories. Our current small UAS portfolio consists of the following aircraft:
|
Small |
|
|
|
|
|
|
|
|
|
|
|
|
|
|
|
|
UAS |
|
Wingspan |
|
Weight |
|
|
|
Standard |
|
Range |
|
Flight Time |
|
||
|
Product |
|
(ft.) |
|
(lbs.) |
|
Recovery |
|
Sensors |
|
(mi.)(1) |
|
(min.)(1) |
|
||
|
Puma AE |
|
9.2 |
|
14 |
|
Vertical autonomous landing capable (ground or water) |
|
Mechanical pan, tilt, zoom and digital zoom electro-optical and infrared |
|
9.0 |
|
|
|
210 |
|
|
Raven |
|
4.5 |
|
4.5 |
|
Vertical autonomous landing capable |
|
Mechanical pan, tilt, zoom and digital zoom electro-optical and infrared |
|
6.0 |
|
60 |
- |
90 |
|
|
Wasp AE |
|
3.3 |
|
2.8 |
|
Vertical autonomous landing capable (ground or water) |
|
Mechanical pan, tilt, zoom and digital zoom electro-optical and infrared |
|
3.0 |
|
|
|
50 |
|
|
Snipe |
|
0.8 |
|
0.3 |
|
Vertical takeoff and landing |
|
Mechanical tilt, electro-optical and infrared |
|
0.6 |
|
|
|
15 |
|
|
(1) |
Represents point‑to‑point minimum customer‑mandated specifications for all operating conditions. In optimal conditions, the performance of our products may significantly exceed these specifications. Our DDL relay can enable operational modes that can extend range significantly. |
The ground control system serves as the primary interface between the operator and the aircraft, and allows the operator to control the direction, speed and altitude of the aircraft as well as the orientation of the sensors to view the visual information they produce through real‑time, streaming video and metadata. Our common ground control system interfaces with each of our air vehicles, except Snipe, providing a common user interface with each of our air vehicles. In addition to the thousands of air vehicles delivered to our customers, thousands of ground control systems are also in our customers’ hands.
The Snipe nano quadrotor is an unmanned aircraft system tailored to the needs of frontline troops who need immediate situational awareness. Snipe incorporates an advanced touch screen interface to control the system and view the information produced by the air vehicle’s onboard sensors. Highly portable and easy to assemble, operate and stow, snipe is designed to provide rapid airborne information within one kilometer of its launch point in situations where time is short and risk is high.
10
Our line of miniature gimbaled sensor payloads provides small UAS operators with enhanced observation and target tracking functionality. Our DDL is integrated into Puma AE, Raven and Wasp AE and Snipe systems, enhancing their capabilities, and ultimately, the utility of our small UAS by enabling more efficient radio spectrum utilization and communications security. Small UAS incorporating our DDL offer many more channels as compared to our analog link, increasing the number of air vehicles that can operate in a given area. Additionally, our DDL enables each air vehicle to operate as an Internet‑Protocol addressable hub capable of routing and relaying video, voice and data to and from multiple other nodes on this ad hoc network. This capability enables beyond line‑of‑sight operation of our small UAS, further enhancing their value proposition to our customers.
Tactical Missile Systems Products
Our tactical missile systems consist of tube-launched aircraft that deploy with the push of a button, fly at higher speeds than our small UAS, and perform either effects delivery or reconnaissance missions. Switchblade, the first of our tactical missile systems products, can be transported in its launch tube, within a backpack, and deployed within minutes to defend against lethal threats such as snipers and mortar teams. With a high level of precision, including a custom warhead, wave-off, loiter and re-engagement capabilities, Switchblade can neutralize a target rapidly and accurately without causing collateral damage. Furthermore, because it streams live electro-optical and thermal video to its operator, Switchblade can be called off in the final moments prior to a strike should the situation require, minimizing damage to non-combatants. Blackwing, a variant of Switchblade, launches from a submerged submarine and carries extra batteries instead of a warhead, providing longer flight time for reconnaissance operations.
UAS Logistics Services
In support of our small UAS we offer a suite of services that help to ensure the successful operation of our products by our customers. These services generate incremental revenue for the company and provide us with continuous feedback to understand the utility of our systems, anticipate our customers’ needs and develop additional customer insights. We believe that this ongoing feedback loop enables us to continue to provide our customers with innovative solutions that help them succeed. We provide spare parts as well as repair, refurbishment and replacement services in a manner that seeks to minimize supply chain delays, and we support our customers with spare parts, replacement aircraft and support whenever and wherever they need them. One of our facilities also serves as the primary depot for repairs and spare parts.
We provide comprehensive training services to support all of our small UAS. Our highly‑skilled instructors typically have extensive military experience. We deploy training teams throughout the continental United States and abroad to support our customers’ training needs on both production and development‑stage systems.
UAS Customer Funded Research and Development
We provide engineering services in support of customer‑funded research and development projects, delivering new value‑added technology solutions to our customers. These types of projects typically involve developing new system solutions and technology or new capabilities for existing solutions that we introduce as retrofits or upgrades. We recognize customer‑funded research and development projects as revenue.
UAS Technology, Research and Development
Our primary areas of technological competence represent the sum of numerous technical skills and capabilities that help to differentiate our approach and product offerings. The following list highlights a number of our key UAS technological capabilities:
|
· |
lightweight, low speed aerostructures and aerodynamic design; |
|
· |
miniaturized avionics and micro/nano unmanned aircraft systems; |
11
|
· |
image stabilization and target tracking; |
|
· |
autonomous systems; |
|
· |
payload design, development, miniaturization and integration; |
|
· |
electric propulsion systems; |
|
· |
high altitude long endurance flight operations; |
|
· |
fluid dynamics; |
|
· |
miniature, low power wireless digital communications; |
|
· |
vertical takeoff and landing fixed‑wing flight unmanned aircraft systems; and |
|
· |
system integration and optimization. |
Two of our UAS and tactical missile systems development initiatives are described below:
Tactical Missile System Variants. We pioneered our first rapidly deployable, high‑precision tactical missile system, called Switchblade, for use by ground forces. Switchblade is now employed by the U.S. military to provide force protection to its troops overseas in combat operations. During a multitude of demonstrations over the course of several years, multiple potential customers requested modifications to Switchblade to accommodate their specific mission requirements. We performed a number of successful demonstrations and are now developing several variants to Switchblade for new customers and applications, including deployment from sea and air vehicles. Blackwing, a submarine-launched reconnaissance system, represents one of the variants. Other variants have transitioned into production and sale to U.S. customers. We believe these new variants have the potential to expand our tactical missile systems opportunities significantly.
Commercial Unmanned Aircraft Systems‑Based Information Solutions. In the same way our small UAS provide situational awareness to military customers, we can employ our small UAS with advanced sensors to scan vast or inaccessible infrastructure, plants or wildlife, then process and analyze the resulting data to produce actionable information for a wide variety of companies in industries that include energy, agriculture and natural resource management. Our Quantix data collection drone is designed for highly automated scanning of more than 400 acres in its 45 minute flight time. Equipped with fixed electro-optical and multi-spectral sensors, Quantix takes off, flies its designated mission, then lands itself at its launch point. Its data can be viewed immediately after landing by transferring a memory card from the Quantix to its commercial tablet controller pre-loaded with custom software. Further automated analysis can be performed by uploading the data to the AeroVironment Decision Support System, or AV DSS, a cloud-based platform for processing, analyzing and storing collected data. We have developed this capability based on extensive work with early adopters for anticipated adoption in what could be a large market.
UAS Sales and Marketing
We organize our U.S. UAS business development team members by market and customer and we locate team members in close proximity to the customers they support, where possible. Our program managers are organized by product and focus on designing optimal solutions and contract fulfillment, as well as internalizing feedback from customers and users. By maintaining assigned points of contact with our customers, we believe that we are able to maintain our relationships, service existing contracts effectively and gain vital feedback to improve our responsiveness and product offerings.
12
UAS Manufacturing and Operations
Continued investment in infrastructure has established our manufacturing capability to meet demand with scalable capacity. We have the manufacturing infrastructure to produce UAS products at high rates, support initial low rate production for new UAS development programs and tactical missile systems and execute initial low‑rate production of large UAS. By drawing upon experienced personnel across various manufacturing industries including aerospace, automotive and volume commodities, we have instituted lean production systems and leverage our International Organization for Standardization, or ISO, certification, integrated supply chain strategy, document control systems and process control methodologies for production. Presently, we perform small UAS and tactical missile systems manufacturing at the 85,000 square foot manufacturing facility we established in 2005. This ISO 9001:2008 certified manufacturing facility is designed to accommodate demand of up to 1,000 aircraft per month. ISO 9001:2008 refers to a set of voluntary standards for quality management systems. These standards are established by the ISO to govern quality management systems used worldwide. Companies that receive ISO certification have passed audits performed by a Registrar Accreditation Board‑certified auditing company. These audits evaluate the effectiveness of companies’ quality management systems and their compliance with ISO standards. Some companies and government agencies view ISO certification as a positive factor in supplier assessments.
UAS Competition
The market for military small UAS continues to evolve in response to changing technologies, shifting customer needs and expectations and the potential introduction of new products. We believe that a number of established domestic and international defense contractors have developed or are developing small UAS that continue to compete, or will compete, directly with our products. Some of these contractors have significantly greater financial and other resources than we possess. Our current principal small UAS competitors include Elbit Systems Ltd., L‑3 Technologies, Inc. and Lockheed Martin Corporation. We do not view large UAS such as Northrop Grumman Corporation’s Global Hawk, General Atomics, Inc.’s Predator and its derivatives, The Boeing Company’s ScanEagle and Textron Inc.’s Shadow as direct competitors to our small UAS because they perform different missions, do not typically deliver their information directly to front‑line ground forces and are not hand‑launched and controlled. However, we cannot be certain that these platforms will not become direct competitors in the future. Potential competition from consumer-focused drone manufacturers could emerge as their capabilities increase and their prices remain low relative to existing military solutions, which could result in some level of military consideration even if such drones do not meet traditional military performance specifications.
The market for long endurance UAS is in an early stage of development. As a result, this category is not well defined and is characterized by multiple potential solutions. An existing contractor that claims to provide long endurance UAS is Northrop Grumman Corporation with its Global Hawk. Several aerospace and defense contractors are pursuing this market opportunity with proposed very long duration UAS, including The Boeing Company, Airbus, Aurora Flight Sciences Corporation, Lockheed Martin Corporation and Northrop Grumman Corporation. Some internet technology companies have acquired small firms that focus on this type of capability and represent potential future competitors. Companies pursuing airships (high altitude aircraft that are kept buoyant by a body of gas that is lighter than air) as a solution for this market include Lockheed Martin Corporation and Northrop Grumman Corporation. Companies pursuing satellites as a solution for this market include The Boeing Company, Lockheed Martin Corporation, General Dynamics Corporation, EADS N.V., Ball Corporation and Orbital Sciences Corporation.
The market for tactical missile systems is in an early stage of development, but it is evolving rapidly. Competitors in this market include Textron Inc., Raytheon Company and Lockheed Martin Corporation.
The market for commercial UAS products and services is in an early stage of development, but is evolving rapidly, generating a great deal of interest as government regulations evolve to accommodate commercial UAS operations in the National Airspace System and in the airspace systems of other countries. Given the breadth of applications and the diversity of industries that could benefit from UAS technology, a growing number of potential competitors in this market include consumer drone manufacturers who seek to enhance their systems’ capabilities over time; other small UAS manufacturers, including large aerospace companies; aerial surveying and mapping service
13
providers; ground‑based surveying and mapping service providers; satellite imagery providers; and specialty system manufacturers, software as a service and service providers aiming to address specific market segments. The emerging non‑military market is attracting numerous additional competitors and significant venture capital funding given perceived lower barriers to entry and a much more fragmented marketplace as compared to the military market. Potential additional competitors include start‑up companies providing low cost solutions.
We believe that the principal competitive factors in the markets for our UAS products and services include product performance, features, acquisition cost, lifetime operating cost, including maintenance and support, ease of use, integration with existing equipment and processes, quality, reliability, customer support, brand and reputation.
UAS Regulation
Due to the fact that we contract with the DoD and other agencies of the U.S. government, we are subject to extensive federal regulations, including the Federal Acquisition Regulations, Defense Federal Acquisitions Regulations, Truth in Negotiations Act, Foreign Corrupt Practices Act, False Claims Act and the regulations promulgated under the DoD Industrial Security Manual, which establishes the security guidelines for classified programs and facilities as well as individual security clearances. The federal government audits and reviews our performance on contracts, pricing practices, cost structure, and compliance with applicable laws, regulations and standards. Like most government contractors, our contracts are audited and reviewed on a continual basis by federal agencies, including the Defense Contract Management Agency, or DCMA, and the Defense Contract Audit Agency, or DCAA.
Certain of these regulations impose substantial penalties for violations, including suspension or debarment from government contracting or subcontracting for a period of time. We monitor all of our contracts and contractual efforts to minimize the possibility of any violation of these regulations.
In addition, we are subject to industry‑specific regulations due to the nature of the products and services we provide. For example, certain aspects of our business are subject to further regulation by additional U.S. government authorities, including (i) the FAA, which regulates airspace for all air vehicles in the U.S. National Airspace System, (ii) the National Telecommunications and Information Administration and the Federal Communications Commission, which regulate the wireless communications upon which our UAS depend in the United States and (iii) the Defense Trade Controls of the U.S. Department of State that administers the International Traffic in Arms Regulations, which regulate the export of controlled technical data, defense articles and defense services. In 2006, the FAA issued a clarification of its existing policies stating that, in order to engage in public use of small UAS in the U.S. National Airspace System, a public (government) operator must obtain a Certificate of Authorization, or COA, from the FAA or fly in restricted airspace. The FAA’s COA approval process requires that the public operator certify the airworthiness of the aircraft for its intended purpose, that a collision with another aircraft or other airspace user is extremely improbable, that the small unmanned aircraft system complies with appropriate cloud and terrain clearances and that the operator or spotter of the small unmanned aircraft system is generally within one half‑mile laterally and 400 feet vertically of the small unmanned aircraft system while in operation. Furthermore, the FAA’s clarification of existing policy states that the rules for radio‑controlled hobby aircraft do not apply to public or commercial use of small UAS. In 2012, the U.S. Congress mandated that the FAA develop rules that provide for the integration of small UAS into the U.S. National Airspace System by September 30, 2015.
The FAA issued the first restricted type certificate for the commercial operation of an unmanned aircraft over American soil to our Puma AE system in 2014. Under a COA, we operated Puma AE systems in the Prudhoe Bay area of Alaska to support a major oil and gas customer. The Secretary of Transportation has the authority to determine whether an airworthiness certificate is required for a UAS to operate safely in the U.S. National Airspace System. On September 25, 2014 the FAA began issuing case‑by‑case authorization for certain unmanned aircraft to perform commercial operations prior to the finalization of the rules providing for the integration of small UAS into the U.S. National Airspace System. As of May 11, 2015 the FAA had granted us four exemptions for the use of our small UAS, including Puma AE systems, for agriculture, aerial survey, and patrol operations and for inspections of fixed infrastructures in controlled environments. On June 21, 2016 the FAA released its final rules that allow routine use of certain small UAS in the U.S. National Airspace System. The FAA rules, which went into effect in August 2016, provide safety rules for small UAS (under 55 pounds) conducting non‑recreational operations. The rules limit flights to
14
visual‑line‑of‑sight daylight operation, unless the UAS has anti-collision lights in which case twilight operation is permitted. The final rule also addresses height and speed restrictions, operator certification, optional use of a visual observer, aircraft registration and marking and operational limits, including prohibiting flights over unprotected people on the ground who are not directly participating in the operation of the UAS.
Furthermore, our non‑U.S. operations are subject to the laws and regulations of foreign jurisdictions, which may include regulations that are more stringent than those imposed by the U.S. government on our U.S. operations.
UAS Government Contracting Process
We sell the significant majority of our small UAS and tactical missile system products and services as the prime contractor under contracts with the U.S. government. Certain important aspects of our government contracts are described below.
UAS Bidding Process
Most of our current government contracts were awarded through a competitive bidding process. The U.S. government awards competitive‑bid contracts based on proposal evaluation criteria established by the procuring agency. Competitive‑bid contracts are awarded after a formal bid and proposal competition among providers. Interested contractors prepare a bid and proposal in response to the agency’s request for proposal or request for information. A bid and proposal is usually prepared in a short time period in response to a deadline and requires the extensive involvement of numerous technical and administrative personnel. Following award, competitive‑bid contracts may be challenged by unsuccessful bidders.
UAS Funding
The funding of U.S. government programs is subject to congressional appropriations. Although multi‑year contracts may be authorized in connection with major procurements, Congress generally appropriates funds on a fiscal year basis, even though a program may continue for many years. Consequently, programs are often only partially funded initially, and additional funds are committed only as Congress makes further appropriations.
The U.S. military funds its contracts for our full‑rate production UAS either through operational needs statements or as programs of record. Operational needs statements represent allocations of discretionary spending or reallocations of funding from other government programs. Funding for our production of initial Raven system deliveries, for example, was provided through operational needs statements. We define a program of record as a program which, after undergoing extensive DoD review and product testing, is included in the five‑year government budget cycle, meaning that funding is allocated for purchases under these contracts during the five‑year cycle, absent affirmative action by the customer or Congress to change the budgeted amount. Despite being included in the five-year budget cycle, funding for these programs is subject to annual approval.
UAS Material Government Contract Provisions
All contracts with the U.S. government contain provisions, and are subject to laws and regulations, that give the government rights and remedies not typically found in commercial contracts, including rights that allow the government to:
|
· |
terminate existing contracts for convenience, in whole or in part, when it is in the interest of the government to do so; |
|
· |
terminate contracts for default upon the occurrence of certain enumerated events; |
|
· |
unilaterally modify contracts with regard to certain performance requirements; |
15
|
· |
cancel multi‑year contracts and related orders, if funds for contract performance for any subsequent year become unavailable; |
|
· |
potentially obtain rights in, or ownership to, intellectual property associated with products and systems developed or delivered by a contractor as a result of its performance of the contract; |
|
· |
adjust contract costs and fees on the basis of audits completed by its agencies; |
|
· |
suspend or debar a contractor from doing business with the U.S. government; and |
|
· |
control or prohibit the export of certain items. |
Generally, government contracts are subject to oversight audits by government representatives. Compensation, if any, in the event of a termination for default is limited to payment for work completed at the time of termination. In the event of a termination for convenience, the contractor may receive the contract price for completed work, as well as its costs of performance of terminated work including an allowance for profit and reasonable termination settlement costs.
UAS Government Contract Categories
We have three types of government contracts, each of which involves a different payment methodology and level of risk related to the cost of performance. These basic types of contracts are typically referred to as fixed‑price contracts, cost reimbursable contracts, including cost‑plus‑fixed fee, cost‑plus‑award fee, and cost‑plus‑incentive fee, and time‑and‑materials contracts.
In some cases, depending on the urgency of the project and the complexity of the contract negotiation, we will enter into a Letter Contract prior to finalizing the terms of a definitive fixed‑price, cost reimbursable or time‑and‑materials definitive contract. A Letter Contract is a written preliminary contractual instrument that provides limited initial funding and authorizes us to begin immediately manufacturing supplies or performing services while negotiating the definitive terms of the procurement.
Fixed‑Price. These contracts are not subject to adjustment by reason of costs incurred in the performance of the contract. With this type of contract, we assume the risk that we will not be able to perform at a cost below the fixed‑price, except for costs incurred because of contract changes ordered by the customer. Upon the U.S. government’s termination of a fixed‑price contract, generally we would be entitled to payment for items delivered to and accepted by the U.S. government and, if the termination is at the U.S. government’s convenience, for payment of fair compensation for work performed plus the costs of settling and paying claims by any terminated subcontractors, other settlement expenses and a reasonable allowance for profit on the costs incurred.
Cost Reimbursable. Cost reimbursable contracts include cost‑plus‑fixed fee contracts, cost‑plus‑award fee contracts and cost‑plus‑incentive fee contracts, each of which are described below. Under each type of contract, we assume the risk that we may not be able to recover costs if they are not allowable under the contract terms or applicable regulations, or if the costs exceed the contract funding.
|
· |
Cost‑plus‑fixed fee contracts are cost reimbursable contracts that provide for payment of a negotiated fee that is fixed at the inception of the contract. This fixed fee does not vary with actual cost of the contract, but may be adjusted as a result of changes in the work to be performed under the contract. This contract type poses less risk of loss than a fixed‑price contract, but our ability to win future contracts from the procuring agency may be adversely affected if we fail to perform within the maximum cost set forth in the contract. |
16
|
· |
A cost‑plus‑award fee contract is a cost reimbursable contract that provides for a fee consisting of a base amount, which may be zero, fixed at inception of the contract and an award amount, based upon the government’s satisfaction with the performance under the contract. With this type of contract, we assume the risk that we may not receive the award fee, or only a portion of it, if we do not perform satisfactorily. |
|
· |
A cost‑plus‑incentive fee contract is a cost reimbursable contract that provides for an initially negotiated fee to be adjusted later by a formula based on the relationship of total allowable costs to total target costs. |
We typically experience lower profit margins and lower risk under cost reimbursable contracts than under fixed‑price contracts. Upon the termination of a cost reimbursable contract, generally we would be entitled to reimbursement of our allowable costs and, if the termination is at the U.S. government’s convenience, a total fee proportionate to the percentage of work completed under the contract.
Time‑and‑Materials. Under a time‑and‑materials contract, our compensation is based on a fixed hourly rate established for specified labor or skill categories. We are paid at the established hourly rates for the hours we expend performing the work specified in the contract. Labor costs, overhead, general and administrative costs and profit are included in the fixed hourly rate. Materials, subcontractors, travel and other direct costs are reimbursed at actual costs plus an amount for material handling. We make critical pricing assumptions and decisions when developing and proposing time‑and‑materials labor rates. We risk reduced profitability if our actual costs exceed the costs incorporated into the fixed hourly labor rate. One variation of a standard time‑and‑materials contract is a time‑and‑materials, award fee contract. Under this type of contract, a positive or negative incentive can be earned based on achievement against specific performance metrics.
UAS Indefinite Delivery Indefinite Quantity Contract Form
The U.S. government frequently uses IDIQ contracts and IDIQ‑type contract forms, such as cost reimbursable and fixed price contracts with multiple one‑year options, to obtain fixed‑price, cost reimbursable and time‑and‑materials contractual commitments to provide products or services over a period of time pursuant to established general terms and conditions. At the time of the award of an IDIQ contract or IDIQ‑type contract, the U.S. government generally commits to purchase only a minimal amount of products or services from the contractor to whom such contract is awarded.
After award of an IDIQ contract the U.S. government may issue task orders for specific services or products it needs. The competitive process to obtain task orders under an award contract is limited to the pre‑selected contractors. If an IDIQ contract has a single prime contractor, then the award of task orders is limited to that contractor. If the contract has multiple prime contractors, then the award of the task order is competitively determined among only those prime contractors.
IDIQ and IDIQ‑type contracts typically have multi‑year terms and unfunded ceiling amounts that enable, but do not commit, the U.S. government to purchase substantial amounts of products and services from one or more contractors.
Efficient Energy Systems
Our EES business segment addresses the increasing economic, environmental and energy security value of electric transportation with solutions for developing, manufacturing and charging electric vehicles.
17
Industry Background
Electric Vehicle Charging Systems
Plug‑in electric vehicles (PEVs) and advanced hybrid electric vehicles (HEVs) require on‑board battery packs to provide the electricity that powers their operation. These battery packs vary in chemistry, size, weight, shape, and energy storage capacity. As drivers operate electric vehicles, their battery packs discharge electricity similar to the way an internal combustion vehicle’s gasoline tank supplies fuel to the engine as it is driven. Upon discharging the battery pack, the driver of an electric vehicle must either replace it with a fully charged pack, if it is removable, or recharge the pack while it remains in the vehicle. Because of the differences in battery sizes and composition, as well as the manner in which each vehicle is operated and the type of electric service available, a variety of charging systems exist to support these vehicles. These charging systems range from relatively slow charging devices that require many hours to completely recharge a battery pack to very fast chargers that can do so in minutes.
Passenger Electric Vehicle Charging Systems
Numerous factors contribute to a growing interest among consumers, governments and automakers in vehicles that do not rely solely on fossil fuels. These factors include:
|
· |
concerns regarding the environmental impact of resource extraction and carbon emissions associated with fossil fuel‑based transportation; |
|
· |
awareness of the geopolitical and economic costs associated with the current dependence on petroleum imports; |
|
· |
anticipation of future energy price volatility; |
|
· |
the increasing demand for automobiles in large, rapidly growing markets such as China and India and the resulting anticipated growth in demand for fossil fuels; and |
|
· |
government and private investments in “clean” technologies. |
In response to these factors most major automotive manufacturers around the world are developing and introducing modern PEVs for everyday transportation. Vehicles in this class incorporate battery electric drive systems either in a dedicated format in which an onboard battery pack supplies electricity to one or more electric motors, or in an advanced hybrid design, in which an onboard battery pack provides electricity to an electric motor, and a small onboard internal combustion engine recharges the battery as needed. A PEV requires that its battery pack be recharged from an external power source or be replaced with a fully charged battery pack. An advanced HEV does not require recharging from an external power source because an onboard gasoline powered internal combustion engine recharges the battery pack, but using an external power source can minimize gasoline consumption and vehicle carbon emissions.
Most EVs recharge using external systems installed at home, work and at public places such as shopping centers, supermarkets, highway rest stops, and locations similar to gasoline refueling stations. With a growing number of new consumer electric vehicle models now deployed, and additional models scheduled to follow, there exists demand for charging infrastructure to enable their safe, reliable and practical recharging.
The rate at which a passenger electric vehicle battery pack can be recharged depends on a number of factors including battery type, size, ambient temperature, the capacity of the vehicle’s onboard controller to convert electricity to
18
the proper format for storage in a battery pack, its ability to receive high current charging and the amount of power available. Electric vehicle charging systems may be segmented into three general categories.
|
Level |
|
Infrastructure Requirement |
|
Recharge Time |
|
|
Level 1 |
|
Power cord with safety features that plugs into a dedicated 120‑volt AC outlet |
|
Capable of slow recharge that could require up to 24 hours or more for certain battery packs |
|
|
Level 2, known as Electric Vehicle Supply Equipment |
|
A hard‑wired or portable device that requires a dedicated 240‑volt AC circuit |
|
Capable of fully recharging most battery packs in two to six hours |
|
|
Level 3, DC or fast/quick charge |
|
Typically requires installation onto a three‑phase, 480‑volt AC circuit |
|
Capable of nearly fully recharging battery packs designed to accept such a charge in 30 minutes |
|
We believe that broad adoption of passenger electric vehicles requires a mix of these types of charging systems, distributed so as to make them accessible to drivers when and where they need them. The adoption of passenger electric vehicles also necessitates supporting services, such as: experienced electrical assessment and installation, the integration of PEVs and charging systems into smart grids and the ability to monitor and manage the use of electricity and provide for various payment methods and plans such as subscription and credit card point‑of‑sale.
Industrial Electric Vehicle Charging Systems
Industrial electric vehicles have been in use extensively for decades. In industrial environments such as factories, distribution centers and airports, fast charge technology, which charges a battery with a high electrical current while the battery remains in the vehicle, eliminates the need for frequent battery changing and a dedicated battery room. This approach increases productivity, reduces operating costs and improves facility safety. The earliest adopters of fast charge technology include the automotive and air transportation industries. Large food and retail industry customers now also utilize fast charge technology.
Industrial electric vehicles rely on large onboard lead-acid batteries that can consume up to 17 cubic feet and weigh up to 3,500 pounds. In multi‑shift fleet operations, traditional slow charging systems require users to exchange vehicle batteries throughout the day because these batteries discharge their energy through vehicle usage and there is insufficient vehicle downtime to recharge them during a shift. As a result, drivers must leave their work areas when the battery reaches a low state of charge and drive to a dedicated battery changing room, which often occupies valuable floor space and is frequently located far from a driver’s work area. The driver, or in some cases a dedicated battery attendant, must then remove the battery from the vehicle, place it on a storage rack, connect it to a conventional battery charger, identify a fully‑charged battery, move it into the vehicle’s battery compartment and reconnect the battery to the motor before the driver may return to the work area. These battery changes take place every day in facilities around the world, resulting in reduced material movement and increased operating costs. Furthermore, depending on the type of battery, conventional battery chargers can require up to eight hours to recharge the battery, which then must cool for up to an additional eight hours before it is ready to be used again. Consequently, depending on vehicle usage and the number of shifts in an operation, a fleet may require more than one battery per vehicle, which necessitates additional storage space, chargers and maintenance time. Moreover, the high levels of heat generated by conventional battery chargers during their normal use can cause excessive evaporation of the water contained in the battery and damage to the battery’s components. Over time, this evaporation of fluid and subsequent damage to components result in battery degradation and adversely affect the battery’s life. Lithium battery chemistry is emerging as a potentially transformative motive power solution for industrial EVs that offers benefits in charging time, size, weight and capacity. We believe that industrial battery charging solutions that can also support lithium ion battery packs will be well positioned for this emerging trend.
Power Cycling and Test Systems
Developers and manufacturers of electric and hybrid electric vehicles typically conduct a variety of tests on the electric propulsion and energy storage systems that convert electricity to motion. These tests include simulating the consumption, conversion and storage of electricity through a range of operating scenarios, and long‑term testing to
19
simulate the rigors of real‑world driving. Developers of battery packs, electric motors and fuel cells also test their devices to validate design hypotheses and identify potential operating issues. Customers include commercial, government, military and university research and development labs as well as commercial manufacturing facilities.
Our EES Solutions
EES Products
Our EES business segment produces electric transportation and industrial productivity solutions for commercial, consumer and government customers, develops new potential electric transportation solutions and performs engineering services. These solutions consist of: (i) electric vehicle charging systems, services and related solutions for plug‑in passenger vehicles; (ii) PosiCharge industrial electric vehicle charging systems for electric material handling vehicles and airport ground support equipment; and (iii) power cycling and test systems for developers and manufacturers of EVs as well as battery packs, electric motors and fuel cells. For the fiscal years ended April 30, 2017, 2016 and 2015, EES sales accounted for 14%, 11% and 15%, respectively, of our revenue. We believe that the markets for our electric vehicle charging systems and power cycling and test systems continue to develop and that continued diversification of our customer base and the increasing adoption of electric vehicles will support increased penetration into target markets.
Passenger Electric Vehicle Charging Systems
In response to automakers’ introductions of PEVs and broader trends favoring electric transportation, we have developed solutions to support the adoption and use of PEVs by nearly every major automaker and many startups worldwide. Our initial EV charging technology emerged from our development of the GM Impact, the first modern EV. Over two decades we improved the technology, deployed it to industrial markets, and adapted it for the current generation of EVs. We believe that most EV drivers will charge their vehicles overnight at their homes. Those without a charging location at home or who make trips beyond the range of their vehicle’s battery pack will require public or workplace charging infrastructure. Our strategy is to offer a charging infrastructure solution, including TurboCord portable dual voltage level 2 charging cords, overnight home chargers, public chargers, installation services, data collection systems and communications through multiple wired and wireless data communications options. We offer an integrated solution designed to enable the broad adoption and the practical use of PEVs and HEVs.
A component of our strategy is to develop relationships across multiple channels that lever our strengths and provide complementary pathways to market. We have announced several such agreements to date with leading auto manufacturers, electric utilities and state and municipal governments.
We believe these relationships represent a valuable position from which to expand our charging infrastructure footprint. We continue to work with automakers, utilities and government agencies at multiple levels as well as with private industry to explore business models and to promote our solutions.
In addition to the thousands of level 2 charging systems we have deployed in North America, we have also deployed PEV fast charging systems, which we view as a powerful tool that can help enable the broader adoption of PEVs.
Passenger Electric Vehicle Charging Services
We have established broad geographic coverage in North America to provide installation and repair services for our growing footprint of passenger electric vehicle charging systems. We identify, qualify, select, train, certify and monitor the performance of these contractors and equip them with proprietary tools, expertise and web‑based information systems to facilitate the successful installation and support of our charging systems as this market opportunity grows. Our 24‑hour customer service center provides support to answer customer inquiries and promote a high level of customer satisfaction.
20
The appearance of our products and services can readily be customized to support our partners’ marketing programs. This capability is designed to enable automakers, utilities, government agencies and other businesses to deliver a branded solution to their customers that will enhance their customer relationships.
PosiCharge Industrial Electric Vehicle Charging System
Developed from our work on electric and HEVs and advanced battery systems in the 1990s, PosiCharge industrial electric vehicle charging systems quickly and safely recharge industrial electric vehicle batteries while the batteries remain in the vehicle during regularly scheduled breaks and at other times when the vehicle is not in use. By eliminating battery changing, PosiCharge systems improve supply chain productivity by returning time to the vehicle operator to complete more work. Furthermore, because of their advanced efficient energy capabilities, PosiCharge systems can reduce the amount of electricity required to support industrial electric vehicles by several hundred dollars per year per vehicle, as compared to less efficient conventional battery chargers. Many customers who implement our charging systems in their facilities are able to re‑purpose the battery changing room floor space for more productive activities and create a safer working environment, as drivers or battery attendants no longer need to exchange large lead‑acid batteries continually.
The proprietary battery charging algorithms built into PosiCharge systems, which are tailored to battery type, brand and size, maximize the rate at which they deliver energy into the battery while minimizing heat generation and its damaging effects on the battery’s internal components. We developed these algorithms over years of advanced battery testing and usage. We believe our work to develop these algorithms contributed to the major battery manufacturers offering warranties for the use of their batteries with our charging systems, which provided a critical assurance to customers that our rapid charging systems would not harm their batteries. In combination with a weekly equalization charge that balances all the cells within the battery pack, our “intelligent” charging process enhances the performance of batteries. We believe that competing rapid and conventional charging systems, which lack our current and voltage regulating tailored charge algorithms and monitoring capabilities, may actually contribute to lower battery performance and lifespan, ultimately resulting in higher battery costs and degraded vehicle performance.
Our PosiCharge offering is focused on providing smart, efficient products to enhance the charging process and help customers maximize the life and performance of their industrial fleets by managing and extending the lives of their batteries, and thereby increasing the productivity of their drivers.
Power Cycling and Test Systems
We supply a line of power cycling and test systems to research and development organizations that focus on electric propulsion systems, electric generation systems and electricity storage systems. Customers employ these systems to test batteries, electric motors, electric and hybrid drive trains and fuel cell systems.
Our line of DC test systems has the flexibility to perform a variety of electric load tests. With a power range (+/−5kW to +/−800kW) of bi‑directional DC equipment, our power cycling and test systems can handle a wide variety of DC supply or load requirements—from lead acid to the latest lithium‑ion battery chemistries to fuel cells with integrated power electronics. In addition, these systems can emulate any drive train component, enabling the testing of individual components or partial drive trains accurately and realistically, and allowing hardware‑in‑the‑loop testing. We also offer flexible software control options via the C language Remote Operation System and Windows‑based languages such as LabVIEW or CAN.
EES Technology
The following list highlights a number of our key EES technological capabilities:
|
· |
battery management and testing; |
|
· |
power electronics and controls; |
21
|
· |
efficient electric drive systems and controls; |
|
· |
high‑density energy packaging; |
|
· |
efficient electric power generation, storage and management; |
|
· |
charging algorithms and thermal management; |
|
· |
on/off grid controls and controls integration; |
|
· |
system integration and optimization; and |
|
· |
web‑based real‑time data collection and reporting. |
EES Sales and Marketing
Passenger Electric Vehicle Charging Systems
As the market for PEVs evolves, we are pursuing numerous potential sales channels for our products and services. We continue to seek to partner with auto manufacturers, utilities, government agencies and others to position ourselves for an increase in demand for charging solutions associated with electric and HEV adoption. We also sell our charging products to consumers, both directly and via major retailers. We have a broad network of licensed electrical contractors whom we train and certify to install and service home and public charging systems. To enable this installation and service network we have developed an e‑commerce platform to integrate customers’ orders, inventory management, dispatching and provisioning, billing and product and service traceability. This platform, along with our broad network, is designed to support our growth as we pursue numerous electric vehicle charging opportunities.
Industrial Electric Vehicle Charging Systems
We primarily sell our PosiCharge industrial electric vehicle charging systems through a dedicated, direct sales force complemented by a network of resellers and industrial battery and lift‑truck dealers. The sales team targets large entities with the potential for domestic and international enterprise adoption of our solutions. The sales team also coordinates distribution of PosiCharge systems through battery and lift‑truck dealers. These dealers’ relationships with, and proximity to, our customers’ facilities enable them to sell our solutions and provide post‑sale service to our customers. We believe that these dealers are well suited to address the large number of smaller and geographically dispersed customers with industrial vehicle fleets. When evaluating a facility for its ability to benefit from PosiCharge systems, we typically perform a detailed analysis of the customer’s operations. This analysis allows us to quantify the benefit projected for a PosiCharge system implementation, helping customers to determine for themselves if the business case is sufficiently compelling.
Power Cycling and Test Systems
We sell our power cycling and test systems through a dedicated, direct sales force and through a network of international distributors and representatives who have access to the research and development and manufacturing organizations that procure and use these types of systems. Given the distances involved, we enable and often rely on our international distributors to provide service in support of our customers.
EES Manufacturing and Operations
We perform assembly and testing of our power cycling and test systems at our 85,000 square foot, ISO 9001:2008 and ISO14001:2004 certified facility. We designed the portion of this facility where we perform such assembly and testing operations for flexibility, using a work cell model for final assembly and have included fixtures optimized for final testing. We utilize contract manufacturing for the production of the majority of our PosiCharge
22
industrial electric vehicle charging systems. We have also implemented a contract manufacturing strategy to support our passenger electric and HEV charging systems business opportunity.
EES Competition
Competitors in the emerging market for passenger electric and HEV charging systems include focused charging system suppliers such as ChargePoint, Inc. and ClipperCreek, Inc. and large industrial electrical device suppliers such as Bosch Automotive Service Solutions LLC, Delta Electronics, Inc., Eaton Corporation, Leviton Manufacturing Co., Inc., Schneider Electric SA, The ABB Group and Siemens AG.
The primary direct competitors to PosiCharge systems are other fast charge suppliers, including Aker Wade Power Technologies LLC, Minit‑Charger, PowerDesigners, LLC, and EnerSys. Some of the major industrial motive battery suppliers have aligned themselves with fast charge suppliers. In addition, our PosiCharge systems compete against the traditional method of battery changing. Competitors in this area include suppliers of battery changing equipment and infrastructure, designers of battery changing rooms, battery manufacturers and dealers who may experience reduced sales volume because PosiCharge systems reduce or eliminate the need for extra batteries.
Direct competitors for our power cycling and test systems include Bitrode Corporation and Digatron Power Electronics.
We believe that the principal competitive factors in the markets for our products and services include product performance, safety, features, acquisition cost, lifetime operating cost, including maintenance and support, ease of use, integration with existing equipment, quality, reliability, customer support, brand and reputation.
For additional financial information with respect to our UAS and EES segments, please see Note 20 to our consolidated financial statements, which are included in Item 8, “Financial Statements and Supplementary Data” of this Annual Report.
General Business Risks
We rely heavily on sales to the U.S. government, particularly to agencies of the Department of Defense.
Historically, we have derived a significant portion of our total sales and substantially all of our small UAS sales from the U.S. government and its agencies. Sales to the U.S. government, either as a prime contractor or subcontractor, represented approximately 55% of our revenue for the fiscal year ended April 30, 2017. The DoD, our principal U.S. government customer, accounted for approximately 37% of our revenue for the fiscal year ended April 30, 2017. We believe that the success and growth of our business for the foreseeable future will continue to depend to a significant degree on our ability to win government contracts, in particular from the DoD. Many of our government customers are subject to budgetary constraints and our continued performance under these contracts, or award of additional contracts from these agencies, could be jeopardized by spending reductions, including constraints on government spending imposed by the Budget Control Act of 2011 and its subsequent amendments, or budget cutbacks at these agencies. The funding of U.S. government programs is uncertain and dependent on continued congressional appropriations and administrative allotment of funds based on an annual budgeting process. We cannot assure you that current levels of congressional funding for our products and services will continue and that our business will not decline. Additionally, the U.S. military funds our contracts primarily through operational needs statements, and to a lesser extent, through programs of record, which provides us with less visibility and certainty on future funding allocations for our contracts. Furthermore, all of our contracts with the U.S. government are terminable by the U.S. government at will. A significant decline in government expenditures generally, or with respect to programs for which we provide products, could adversely affect our business and prospects. Our operating results may also be negatively impacted by other developments that affect these government programs generally, including the following:
|
· |
changes in government programs that are related to our products and services; |
23
|
· |
adoption of new laws or regulations relating to government contracting or changes to existing laws or regulations; |
|
· |
changes in political or public support for security and defense programs; |
|
· |
delays or changes in the government appropriations and budget process; |
|
· |
uncertainties associated with the current global threat environment and other geo‑political matters; and |
|
· |
delays in the payment of our invoices by government payment offices. |
These developments and other factors could cause governmental agencies to reduce their purchases under existing contracts, to exercise their rights to terminate contracts at‑will or to abstain from renewing contracts, any of which would cause our revenue to decline and could otherwise harm our business, financial condition and results of operations.
Military transformation and changes in overseas operational levels may affect future procurement priorities and existing programs, which could limit demand for our UAS.
Over the last decade, operational activity in Afghanistan and Iraq led to adoption and an increase in demand for our small UAS. More recently, the U.S. military has reduced its presence and operational activity in Afghanistan and Iraq, reducing demand for certain of our small UAS products from prior levels. We cannot predict whether the reduction in overseas operational levels will continue, how future procurement priorities related to defense transformation will be impacted or how changes in the threat environment will impact opportunities for our small UAS business in terms of existing, additional or replacement programs. If defense transformation or overseas operations cease or slow down, then our business, financial condition and results of operations could be impacted negatively.
We operate in evolving markets, which makes it difficult to evaluate our business and future prospects.
Our UAS, EV charging systems and other energy technologies are sold in new and rapidly evolving markets. The commercial UAS market and EV markets are in early stages of customer adoption. Accordingly, our business and future prospects may be difficult to evaluate. We cannot accurately predict the extent to which demand for our products will increase, if at all. The challenges, risks and uncertainties frequently encountered by companies in rapidly evolving markets could impact our ability to do the following:
|
· |
generate sufficient revenue to maintain profitability; |
|
· |
acquire and maintain market share; |
|
· |
achieve or manage growth in our operations; |
|
· |
develop and renew contracts; |
|
· |
attract and retain additional engineers and other highly‑qualified personnel; |
|
· |
successfully develop and commercially market new products; |
|
· |
adapt to new or changing policies and spending priorities of governments and government agencies; and |
|
· |
access additional capital when required and on reasonable terms. |
24
If we fail to address these and other challenges, risks and uncertainties successfully, our business, results of operations and financial condition would be materially harmed.
We face competition from other firms, many of which have substantially greater resources.
The defense industry is highly competitive and generally characterized by intense competition to win contracts. Our current principal small UAS competitors include Elbit Systems Ltd., L‑3 Technologies, Inc. and Lockheed Martin Corporation. We do not view large UAS such as Northrop Grumman Corporation’s Global Hawk, General Atomics, Inc.’s Predator and related products, The Boeing Company’s ScanEagle and Textron Inc.’s Shadow as direct competitors because they perform different missions, do not typically deliver their information directly to front‑line ground forces, and are not hand launched and controlled. However, we cannot be certain that these platforms will not become direct competitors in the future. Some of these firms have substantially greater financial, management, research and marketing resources than we have. Our UAS services business also faces competition from smaller businesses that can provide training and logistics services for multiple UAS platforms, including our small UAS.
The primary direct competitors to our PosiCharge industrial EV charging system business are other fast charge suppliers, including Aker Wade Power Technologies LLC, PowerDesigners, LLC and Minit‑Charger as well as industrial battery manufacturers that distribute fast charging systems from these suppliers. The primary direct competitors to our power cycling and test system business are other test system suppliers, including Bitrode Corporation and Digatron Firing Circuits. Our primary competitors in the emerging market for passenger EV charging systems include charging system suppliers such as ChargePoint, Inc. and ClipperCreek, Inc. and large industrial electrical device suppliers such as Bosch Automotive Service Solutions LLC, Delta Electronics, Inc., Eaton Corporation, Leviton Manufacturing Co., Inc., Schneider Electric SA, the ABB Group and Siemens AG. Our EV charging system installation and support services business faces competition from local licensed electricians as well as larger electrical service providers.
Our competitors may be able to provide customers with different or greater capabilities or benefits than we can provide in areas such as technical qualifications, past contract performance, geographic presence, price and the availability of key professional personnel, including those with security clearances. Furthermore, many of our competitors may be able to utilize their substantially greater resources and economies of scale to develop competing products and technologies, manufacture in high volumes more efficiently, divert sales away from us by winning broader contracts or hire away our employees by offering more lucrative compensation packages. Small business competitors in our services businesses may be able to offer more cost competitive services, due to their lower overhead costs, and take advantage of small business incentive and set‑aside programs for which we are ineligible. In the event that the market for small UAS or EV charging systems and services expands, we expect that competition will intensify as additional competitors enter the market and current competitors expand their product lines. In order to secure contracts successfully when competing with larger, well‑financed companies, we may be forced to agree to contractual terms that provide for lower aggregate payments to us over the life of the contract, which could adversely affect our margins. In addition, larger diversified competitors serving as prime contractors may be able to supply underlying products and services from affiliated entities, which would prevent us from competing for subcontracting opportunities on these contracts. Our failure to compete effectively with respect to any of these or other factors could have a material adverse effect on our business, prospects, financial condition or operating results.
If the UAS, tactical missile systems, and commercial UAS markets do not experience significant growth, if we cannot expand our customer base or if our products do not achieve broad acceptance, then we may not be able to achieve our anticipated level of growth.
We cannot accurately predict the future growth rates or sizes of the markets for our products. Demand for our products may not increase, or may decrease, either generally or in specific markets, for particular types of products or during particular time periods. We believe the market for commercial UAS is nascent. Moreover, there are only a limited number of major programs under which the U.S. military, our primary customer, is currently funding the development or purchase of our UAS and tactical missile systems. Although we have expanded our UAS customer base to include foreign governments, and domestic non‑military agencies, we cannot assure you that our continued efforts to further increase our sales to these customers will be successful. The expansion of the UAS, tactical missile systems, and
25
commercial UAS markets in general, and the market for our products in particular, depends on a number of factors, including the following:
|
· |
customer satisfaction with these types of systems as solutions; |
|
· |
the cost, performance and reliability of our products and products offered by our competitors; |
|
· |
customer perceptions regarding the effectiveness and value of these types of systems; |
|
· |
limitations on our ability to market our UAS and tactical missile systems products and services outside the United States due to U.S. government regulations; |
|
· |
obtaining timely regulatory approvals, including, with respect to our small UAS business, access to airspace and wireless spectrum; and |
|
· |
marketing efforts and publicity regarding these types of systems. |
Even if UAS, tactical missile systems, and commercial UAS gain wide market acceptance, our products may not adequately address market requirements and may not continue to gain market acceptance. If these types of systems generally, or our products specifically, do not gain wide market acceptance, then we may not be able to achieve our anticipated level of growth and our revenue and results of operations would decline.
Our international business poses potentially greater risks than our domestic business.
We derived approximately 36% of our revenue from international sales during the fiscal year ended April 30, 2017 compared to 28% for the fiscal year ended April 30, 2016. We expect to continue to derive an increasing portion of our revenue from international sales. Our international revenue and operations are subject to a number of material risks, including the following:
|
· |
the unavailability of, or difficulties in obtaining any, necessary U.S. governmental authorizations for the export of our products to certain foreign jurisdictions; |
|
· |
regulatory requirements that may adversely affect our ability to operate in foreign jurisdictions, sell certain products or repatriate profits to the United States; |
|
· |
the complexity and necessity of using foreign representatives and consultants; |
|
· |
the complexities of operating a business in an international location through a subsidiary or joint venture structure that may include foreign business partners, subcontractors and suppliers; |
|
· |
the complexity of shipping our products internationally through multiple jurisdictions with varying legal requirements; |
|
· |
difficulties in enforcing agreements and collecting receivables through foreign legal systems and other relevant legal issues, including fewer legal protections for intellectual property; |
|
· |
potential fluctuations in foreign economies and in the value of foreign currencies and interest rates; |
|
· |
potential preferences by prospective customers to purchase from local (non‑U.S.) sources; |
|
· |
general economic and political conditions in the markets in which we operate; |
26
|
· |
laws or regulations relating to non‑U.S. military contracts that favor purchases from non‑U.S. manufacturers over U.S. manufacturers; |
|
· |
the imposition of tariffs, embargoes, export controls and other trade restrictions; and |
|
· |
different and changing legal and regulatory requirements, including those pertaining to anti-corruption, anti-boycott, data protection and privacy, employment law, intellectual property and contracts in the jurisdictions in which we currently operate or may operate in the future. |
Negative developments in any of these areas in one or more countries could result in a reduction in demand for our products, the cancellation or delay of orders already placed, threats to our intellectual property, difficulty in collecting receivables and a higher cost of doing business, any of which could negatively impact our business, financial condition or results of operations. While we have adopted policies and procedures to facilitate compliance with laws and regulations applicable to our international sales, our failure, or the failure by our employees or others working on our behalf, to comply with such laws and regulations may result in administrative, civil or criminal liabilities, including suspension or debarment from government contracts or suspension of our export privileges. Moreover, our sales, including sales to customers outside the United States, substantially all are denominated in U.S. dollars, and downward fluctuations in the value of foreign currencies relative to the U.S. dollar may make our products more expensive than other products, which could harm our business.
We could be prohibited from shipping our products to certain countries if we are unable to obtain U.S. government authorization regarding the export of our products, or if current or future export laws limit or otherwise restrict our business. In addition, failure to comply with export laws could result in fines, export restrictions and other sanctions and penalties.
We must comply with U.S. and other laws regulating the export of our products. In some cases, explicit authorization from the relevant U.S. government authorities is needed to export our products. The export regulations and the governing policies applicable to our business are subject to change. We cannot provide assurance that such export authorizations will be available for our products in the future. Compliance with these laws has not significantly limited our operations or our sales in the recent past, but could significantly limit them in the future. We maintain an export compliance program but there are risks that our compliance controls may be ineffective. We have voluntarily disclosed export violations to the U.S. Department of State, a number of which are currently under review by the department. The State Department has imposed significant fines, penalties and sanctions, including suspension of export privileges, on companies that have violated the export laws. If the State Department determines that the conduct in our voluntary disclosures warrants the imposition of significant fines, penalties or sanctions, it could have a material adverse impact on our business, operations and financial condition and limit or prevent us from being able to sell our products in certain international jurisdictions.
If we are unable to manage the increasing complexity of our business or achieve or manage our expected growth, our business could be adversely affected.
The complexity of our business has increased significantly over the last several years. We have expanded the number of business areas being pursued, shifting from primarily a U.S. government focused business to a business that includes substantial international product sales and added commercial services. This increased complexity and our expected growth has placed, and will continue to place, a strain on our management and our administrative, operational and financial infrastructure. We anticipate further growth of headcount and facilities will be required to address expansion in our product offerings and the geographic scope of our customer base. However, if we are unsuccessful in our efforts, our business could decline. Our success will depend in part upon the ability of our senior management to manage our increased complexity and expected growth effectively. To do so, we must continue to hire, train, manage and integrate a significant number of qualified managers and engineers. If our new employees perform poorly, or if we are unsuccessful in hiring, training, managing and integrating these new employees, or retaining these or our existing employees, then our business may experience declines.
27
To support our expected growth, we must continue to improve our operational, financial and management information systems. If we are unable to manage our growth while maintaining our quality of service, or if new systems that we implement to assist in managing our growth do not produce the expected benefits, then our business, prospects, financial condition or operating results could be adversely affected.
Any efforts to expand our offerings beyond our current markets may not succeed, which could negatively impact our operating results.
Until recently, we have focused on selling our small UAS to the U.S. military, our industrial EV fast charging and test systems to large industrial EV fleet operators primarily in North America, our power cycling and test systems primarily to research and development facilities in North America, and our EV charging systems to domestic commercial customers, distributors and consumers. We have, however, expanded our UAS sales into other government and commercial markets, and our industrial EV charging and power cycling and test systems and EV charging systems sales into international markets. Our efforts to expand our product offerings beyond our traditional markets may divert management resources from existing operations and require us to commit significant financial resources to unproven businesses that may not generate additional sales, either of which could significantly impair our operating results.
The markets in which we compete are characterized by rapid technological change, which requires us to develop new products and product enhancements, and could render our existing products obsolete.
Continuing technological changes in the market for our products could make our products less competitive or obsolete, either generally or for particular applications. Our future success will depend upon our ability to develop and introduce a variety of new capabilities and enhancements to our existing product offerings, as well as introduce a variety of new product offerings, to address the changing needs of the markets in which we offer our products. Delays in introducing new products and enhancements, the failure to choose correctly among technical alternatives or the failure to offer innovative products or enhancements at competitive prices may cause existing and potential customers to purchase our competitors’ products.
If we are unable to devote adequate resources to develop new products or cannot otherwise successfully develop new products or enhancements that meet customer requirements on a timely basis, our products could lose market share, our revenue and profits could decline, and we could experience operating losses.
The EV charging industry is especially dynamic. For example, a single fast charge connector communication protocol standard for the U.S. market has not yet been established, although other standards are emerging throughout the world. If we are unable to accurately anticipate fast charge standards that are adopted in our potential markets or develop products that meet such standards quickly enough to meet customer requirements, our EV charging systems could lose market share, our revenue and profits could decline, and we could experience operating losses.
We expect to incur substantial research and development costs and devote significant resources to identifying and commercializing new products and services, which could significantly reduce our profitability and may never result in revenue to us.
Our future growth depends on penetrating new markets, adapting existing products to new applications, and introducing new products and services that achieve market acceptance. We plan to incur substantial research and development costs as part of our efforts to design, develop and commercialize new products and services and enhance existing products. We spent $33.0 million, or 12% of our revenue, in our fiscal year ended April 30, 2017 on research and development activities. We believe that there are significant investment opportunities in a number of business areas. Because we account for research and development as an operating expense, these expenditures will adversely affect our earnings in the future. Further, our research and development programs may not produce successful results, and our new products and services may not achieve market acceptance, create additional revenue or become profitable, which could materially harm our business, prospects, financial results and liquidity.
28
Failure to obtain necessary regulatory approvals from the FAA or other governmental agencies, or limitations put on the use of small UAS in response to public privacy concerns, may prevent us from expanding the sales of our small UAS to non‑military customers in the United States.
The regulation of small UAS for commercial use in the United States is undergoing substantial change and the ultimate treatment is uncertain. In 2006, the FAA issued a clarification of its existing policies stating that, in order to engage in commercial use of small UAS in the U.S. National Airspace System, a public operator must obtain a COA from the FAA, or fly in restricted airspace. The FAA’s COA approval process requires that the public operator certify the airworthiness of the aircraft for its intended purpose, that a collision with another aircraft or other airspace user is extremely improbable, that the small unmanned aircraft system complies with appropriate cloud and terrain clearances and that the operator or spotter of the small unmanned aircraft system is generally within one half‑mile laterally and 400 feet vertically of the small unmanned aircraft system while in operation. Furthermore, the FAA’s clarification of existing policy stated that the rules for radio‑controlled hobby aircraft do not apply to public or commercial use of small UAS.
On February 14, 2012, the FAA Modernization and Reform Act of 2012 was enacted, establishing various deadlines for the FAA to allow expanded use of small UAS for both public and commercial applications. On June 21, 2016, the FAA released its final rules regarding the routine use of certain small UAS (under 55 pounds) in the U.S. National Airspace System pursuant to the act. The rules, which became effective in August 2016, provided safety regulations for small UAS conducting non‑recreational operations and contain various limitations and restrictions for such operations, including a requirement that operators keep UAS within visual-line-of-sight and prohibiting flights over unprotected people on the ground who are not directly participating in the operation of the UAS. We cannot assure you that these new rules will result in the expanded use of our small UAS by law enforcement or other non‑military government agencies or commercial entities and we may not be able to expand our sales of small UAS beyond our military customers, which could harm our business prospects.
In addition, there exists public concern regarding the privacy implications of U.S. commercial and law enforcement use of small UAS. This concern has included calls to develop explicit written policies and procedures establishing usage limitations. We cannot assure you that the response from regulatory agencies, customers and privacy advocates to these concerns will not delay or restrict the adoption of small UAS by non‑military customers.
Our products and services are complex and could have unknown defects or errors, which may give rise to claims against us, diminish our brand or divert our resources from other purposes.
Our UAS rely on complex avionics, sensors, user‑friendly interfaces and tightly‑integrated, electromechanical designs to accomplish their missions, and our EV charging and power cycling and test systems often rely upon the application of intellectual property for which there may have been little or no prior commercial application. Despite testing, our products have contained defects and errors and may in the future contain defects, errors or performance problems when first introduced, when new versions or enhancements are released, or even after these products have been used by our customers for a period of time. These problems could result in expensive and time‑consuming design modifications or warranty charges, delays in the introduction of new products or enhancements, significant increases in our service and maintenance costs, exposure to liability for damages, damaged customer relationships and harm to our reputation, any of which could materially harm our results of operations and ability to achieve market acceptance. In addition, increased development and warranty costs could be substantial and could reduce our operating margins.
The existence of any defects, errors, or failures in our products or the misuse of our products could also lead to product liability claims or lawsuits against us. A defect, error or failure in one of our UAS could result in injury, death or property damage and significantly damage our reputation and support for our UAS in general. We anticipate this risk will grow as our UAS begin to be used in U.S. domestic airspace and urban areas. While our PosiCharge industrial EV charging systems include certain safety mechanisms, these systems can deliver up to 600 amps of current in their application, and the failure, malfunction or misuse of these systems could result in injury or death. Our passenger electric and HEV charging systems and power cycling and test systems also have the potential to cause injury, death or property damage in the event that they are misused, malfunction or fail to operate properly due to unknown defects or errors.
29
Although we maintain insurance policies, we cannot provide assurance that this insurance will be adequate to protect us from all material judgments and expenses related to potential future claims or that these levels of insurance will be available in the future at economical prices or at all. A successful product liability claim could result in substantial cost to us. Even if we are fully insured as it relates to a claim, the claim could nevertheless diminish our brand and divert management’s attention and resources, which could have a negative impact on our business, financial condition and results of operations.
If critical components or raw materials used to manufacture our products become scarce or unavailable, then we may incur delays in manufacturing and delivery of our products, which could damage our business.
We obtain hardware components, various subsystems and systems from a limited group of suppliers. We do not have long‑term agreements with any of these suppliers that obligate them to continue to sell components, subsystems, systems or products to us. Our reliance on these suppliers involves significant risks and uncertainties, including whether our suppliers will provide an adequate supply of required components, subsystems, or systems of sufficient quality, will increase prices for the components, subsystems or systems and will perform their obligations on a timely basis.
In addition, certain raw materials and components used in the manufacture of our products are periodically subject to supply shortages, and our business is subject to the risk of price increases and periodic delays in delivery. Similarly, the market for electronic components is subject to cyclical reductions in supply. If we are unable to obtain components from third‑party suppliers in the quantities and of the quality that we require, on a timely basis and at acceptable prices, then we may not be able to deliver our products on a timely or cost‑effective basis to our customers, which could cause customers to terminate their contracts with us, increase our costs and seriously harm our business, results of operations and financial condition. Moreover, if any of our suppliers become financially unstable, or otherwise unable or unwilling to provide us with raw materials or components, then we may have to find new suppliers. It may take several months to locate alternative suppliers, if required, or to redesign our products to accommodate components from different suppliers. We may experience significant delays in manufacturing and shipping our products to customers and incur additional development, manufacturing and other costs to establish alternative sources of supply if we lose any of these sources or are required to redesign our products. We cannot predict if we will be able to obtain replacement components within the time frames that we require at an affordable cost, if at all.
Our earnings and profit margins may decrease based on the mix of our contracts and programs and other factors related to our contracts.
In general, we perform our production work under fixed‑price contracts and our repair and customer‑funded research and development work under cost‑plus‑fee contracts. Under fixed‑price contracts, we perform services under a contract at a stipulated price. Under cost‑plus‑fee contracts, which are subject to a contract ceiling amount, we are reimbursed for allowable costs and paid a fee, which may be fixed or performance based. We typically experience lower profit margins under cost‑plus‑fee contracts than under fixed‑price contracts, though fixed‑price contracts involve higher risks. In general, if the volume of services we perform under cost‑plus‑fee contracts increases relative to the volume of services we perform under fixed‑price contracts, we expect that our operating margin will decline. In addition, our earnings and margins may decrease depending on the costs we incur in contract performance, our achievement of other contract performance objectives and the stage of our performance at which our right to receive fees, particularly under incentive and award fee contracts, is finally determined.
We use estimates in accounting for many of our programs and changes in our estimates could adversely affect our future financial results.
Contract accounting requires judgments relative to assessing risks, including risks associated with estimating contract revenues and costs, assumptions for schedule and technical issues, customer‑directed delays and reductions in scheduled deliveries, and unfavorable resolutions of claims and contractual matters. Due to the size and nature of many of our contracts, the estimation of total revenues and cost at completion is complicated and subject to many variables. For example, we must make assumptions regarding the length of time to complete the contract because costs also include expected increases in wages and prices for materials; consider whether the intent of entering into multiple contracts was effectively to enter into a single project in order to determine whether such contracts should be combined or segmented;
30
consider incentives or penalties related to performance on contracts in estimating sales and profit rates, and record them when there is sufficient information for us to assess anticipated performance; and use estimates of award fees in estimating sales and profit rates based on actual and anticipated awards. Because of the significance of the judgments and estimation processes described above, it is likely that materially different amounts could be recorded if we used different assumptions or if the underlying circumstances were to change. Changes in underlying assumptions, circumstances or estimates may adversely affect our future results of operations and financial condition.
Cost overruns on our contracts could subject us to losses, decrease our operating margins and adversely affect our future business.
Fixed‑price contracts (including both government and commercial contracts) represented approximately 79% of our revenue for the fiscal year ended April 30, 2017. If we fail to anticipate technical problems, estimate costs accurately or control costs during our performance of fixed‑price contracts, then we may incur losses on these contracts because we absorb any costs in excess of the fixed price. Under cost‑plus‑fee contracts, if costs exceed the contract ceiling or are not allowable under the provisions of the contract or applicable regulations, then we may not be able to obtain reimbursement for all such costs. Under time and materials contracts, we are paid for labor at negotiated hourly billing rates and for certain expenses. Because many of our contracts involve advanced designs and innovative technologies, we may experience unforeseen technological difficulties and cost overruns. Under each type of contract, if we are unable to control the costs we incur in performing under the contract, then our financial condition and results of operations could be materially adversely affected. Cost overruns also may adversely affect our ability to sustain existing programs and obtain future contract awards.
Our senior management and key employees are important to our customer relationships and overall business.
We believe that our success depends in part on the continued contributions of our senior management and key employees. We rely on our executive officers, senior management and key employees to generate business and execute programs successfully. In addition, the relationships and reputation that members of our management team and key employees have established and maintain with government defense personnel contribute to our ability to maintain good customer relations and to identify new business opportunities. We do not have employment agreements with any of our executive officers or key employees, and these individuals could terminate their employment with us at any time. The loss of any of our executive officers, members of our senior management team or key employees could significantly delay or prevent the achievement of our business objectives and could materially harm our business and customer relationships and impair our ability to identify and secure new contracts and otherwise manage our business.
We must recruit and retain highly‑skilled employees to succeed in our competitive business.
We depend on our ability to recruit and retain employees who have advanced engineering and technical services skills and who work well with our customers. These employees are in great demand and are likely to remain a limited resource in the foreseeable future. If we are unable to recruit and retain a sufficient number of these employees, then our ability to maintain our competitiveness and grow our business could be negatively affected. In addition, because of the highly technical nature of our products, the loss of any significant number of our existing engineering personnel could have a material adverse effect on our business and operating results. Moreover, some of our U.S. government contracts contain provisions requiring us to staff a program with certain personnel the customer considers key to our successful performance under the contract. In the event we are unable to provide these key personnel or acceptable substitutes, the customer may terminate the contract.
Our business may be dependent upon our employees obtaining and maintaining required security clearances, as well as our ability to obtain security clearances for the facilities in which we perform sensitive government work.
Certain of our U.S. government contracts require our employees to maintain various levels of security clearances, and we are required to maintain certain facility security clearances complying with DoD requirements. The DoD has strict security clearance requirements for personnel who work on classified programs. Obtaining and maintaining security clearances for employees involves a lengthy process, and it is difficult to identify, recruit and retain employees who already hold security clearances. If our employees are unable to obtain security clearances in a timely
31
manner, or at all, or if our employees who hold security clearances are unable to maintain the clearances or terminate employment with us, then a customer requiring classified work could terminate the contract or decide not to renew it upon its expiration. In addition, we expect that many of the contracts on which we will bid will require us to demonstrate our ability to obtain facility security clearances and employ personnel with specified types of security clearances. To the extent we are not able to obtain facility security clearances or engage employees with the required security clearances for a particular contract, we may not be able to bid on or win new contracts, or effectively rebid on expiring contracts.
Our future profitability may be dependent upon achieving cost reductions and projected economies of scale from increasing manufacturing quantities of our products. Failing to achieve such reductions in manufacturing costs and projected economies of scale could materially adversely affect our business.
We have limited experience manufacturing our EV charging systems, small UAS and tactical missile systems in high volume. We do not know whether or when we will be able to develop efficient, low‑cost manufacturing capabilities and processes that will enable us to manufacture (or contract for the manufacture of) these products in commercial quantities while meeting the volume, speed, quality, price, engineering, design and production standards required to successfully market our products. Our failure to develop such manufacturing processes and capabilities in locations that can efficiently service our markets could have a material adverse effect on our business, financial condition, results of operations and prospects. Historically, we have produced PosiCharge industrial EV charging systems and power cycling and test systems only in limited production quantities. Our future profitability is, in part, dependent upon achieving increased savings from volume purchases of raw materials and component parts, achieving acceptable manufacturing yield and capitalizing on machinery efficiencies. We expect our suppliers to experience a sharp increase in demand for their products. As a result, we may not have reliable access to supplies that we require or be able to purchase such materials or components at cost effective prices. There is no assurance that we will ever be in a position to realize any material, labor and machinery cost reductions associated with higher purchasing power and higher production levels. Failure to achieve these cost reductions could adversely impact our business and financial results.
We face significant risks in overseeing our outsourcing of manufacturing processes as well as in the management of our inventory, and failure to properly oversee our manufacturing processes or to effectively manage our inventory levels may result in product recalls or supply imbalances that could harm our business.
We have contracted for the manufacture of certain EV charging systems with contract manufacturers. We sell these units directly and through distributors, as well as through our own online sales channels. We face significant risks if our contract manufacturers do not perform as expected. If we fail to effectively oversee the manufacturing process, including the work performed by our contract manufacturers, we could be negatively impacted by product recalls, poorly performing products and higher than anticipated warranty costs.
In connection with our manufacturing operations, we maintain a finished goods inventory of EV charging units in various locations, including with third party logistics providers. In addition, we also maintain a variety of parts and components in inventory to allow us to customize our UAS products for specific customer requirements, which parts are subject to obsolescence and expiration. Due to the long‑lead time for obtaining certain UAS product components and the manufacturing cycles, we need to make forecasts of demand and commit significant resources towards manufacturing our products. As such, we are subject to significant risks in managing the inventory needs of our business during the year, including estimating the appropriate demand for our products. Should orders and market conditions differ significantly from our estimates, our future results of operations could be materially adversely affected. In the future, we may be required to record write‑downs of finished products and materials on‑hand and/or additional charges for excess purchase commitments as a result of future changes in our sales forecasts or customer orders.
Due to the volatile and flammable nature of certain components of our products and equipment, fires or explosions may disrupt our business or cause significant injuries, which could adversely affect our financial results.
The development and manufacture of certain of our products involves the handling of a variety of explosive and flammable materials as well as high power equipment. From time to time, these activities may result in incidents that could cause us to temporarily shut down or otherwise disrupt some manufacturing processes, causing production delays and resulting in liability for workplace injuries and/or fatalities. We have safety and loss prevention programs that
32
require detailed reviews of process changes and new operations, along with routine safety audits of operations involving explosive materials, to mitigate such incidents, as well as a variety of insurance policies, however our insurance coverage may be inadequate to cover all claims and losses related to such incidents. We may experience such incidents in the future, which could result in production delays or otherwise have a material adverse effect on our business and financial condition.
The operation of UAS in urban environments may be subject to risks, such as accidental collisions and transmission interference, which may limit demand for our UAS in such environments and harm our business and operating results.
Urban environments may present certain challenges to the operators of UAS. UAS may accidentally collide with other aircraft, persons or property, which could result in injury, death or property damage and significantly damage the reputation of and support for UAS in general. As the usage of UAS has increased, particularly by military customers, the danger of such collisions has increased. Furthermore, the incorporation of our DDL technology into our UAS has increased the number of vehicles which can operate simultaneously in a given area and with this increase has come an increase in the risk of accidental collision. In addition, obstructions to effective transmissions in urban environments, such as large buildings, may limit the ability of the operator to utilize the aircraft for its intended purpose. The risks or limitations of operating UAS in urban environments may limit their value in such environments, which may limit demand for our UAS and consequently materially harm our business and operating results.
As a manufacturer of commercial UAS and electrical vehicle charging products and provider of electrical installation services to consumers, we are subject to various government regulations and may be subject to additional regulations in the future, violation of which could subject us to sanctions or otherwise harm our business.
As a manufacturer of consumer products, we are subject to significant government regulations, including, in the United States, those issued under the Consumer Products Safety Act, as well as those issued under product safety and consumer protection statutes in our international markets. In addition, certain of our electrical contracting services are subject to regulation by various government authorities. Failure to comply with any applicable product safety or consumer protection regulation could result in sanctions that could have a negative impact on our business, financial condition and results of operations.
Governments and regulatory agencies in the markets where we manufacture and sell products may enact additional regulations relating to product safety and consumer protection in the future, and may also increase the penalties for failure to comply with product safety and consumer protection regulations. In addition, one or more of our customers might require changes in our products, such as the non‑use of certain materials, in the future. Complying with any such additional regulations or requirements could impose increased costs on our business. Similarly, increased penalties for non‑compliance could subject us to greater expenses in the event any of our products were found to not comply with such regulations. Such increased costs or penalties could harm our business.
We could be the subject of future product liability suits or product recalls, which could harm our business.
We may be subject to involuntary product recalls or may voluntarily conduct a product recall. The costs associated with any future product recalls could be significant. In addition, any product recall, regardless of direct costs of the recall, may harm consumer perceptions of our products and have a negative impact on our future revenues and results of operations.
In addition to government regulation, products that have been or may be developed by us may expose us to potential liability from personal injury or property damage claims by the users of such products. There can be no assurance that a claim will not be brought against us in the future. While we maintain insurance coverage for product liability claims, our insurance may be inadequate to cover any such claims. Any successful claim could significantly harm our business, financial condition and results of operations.
33
Our quarterly operating results may vary widely.
Our quarterly revenue, cash flow and operating results have and may continue to fluctuate significantly in the future due to a number of factors, including the following:
|
· |
fluctuations in revenue derived from government contracts, including cost‑plus‑fee contracts and contracts with a performance‑based fee structure; |
|
· |
the size and timing of orders from military and other governmental agencies, including increased purchase requests from government customers for equipment and materials in connection with the U.S. government’s fiscal year end, which may affect our quarterly operating results; |
|
· |
the mix of products that we sell in the period; |
|
· |
seasonal fluctuations in customer demand for some of our products or services; |
|
· |
unanticipated costs incurred in the introduction of new products; |
|
· |
fluctuations in the adoption of our products in new markets; |
|
· |
our ability to win additional contracts from existing customers or other contracts from new customers; |
|
· |
cancellations, delays or contract amendments by our U.S. governmental agency and foreign government customers; |
|
· |
changes in policy or budgetary measures that adversely affect our U.S. governmental agency and foreign government customers; |
|
· |
the cost of complying with various regulatory requirements applicable to our business and the potential penalties or sanctions that could be imposed for non‑compliance; and |
|
· |
our ability to obtain the necessary export licenses for sales of our products and services to international customers. |
Changes in the volume of products and services provided under existing contracts and the number of contracts commenced, completed or terminated during any quarter may cause significant variations in our cash flow from operations because a relatively large amount of our expenses are fixed. We incur significant operating expenses during the start‑up and early stages of large contracts and typically do not receive corresponding payments in that same quarter. We may also incur significant or unanticipated expenses when contracts expire or are terminated or are not renewed. In addition, payments due to us from government agencies may be delayed due to billing cycles or as a result of failures of governmental budgets to gain congressional and presidential approval in a timely manner.
Shortfalls in available external research and development funding could adversely affect us.
We depend on our research and development activities to develop the core technologies used in our UAS and EES products and for the development of our future products. A portion of our research and development activities depends on funding by commercial companies and the U.S. government. U.S. government and commercial spending levels can be impacted by a number of variables, including general economic conditions, specific companies’ financial performance and competition for U.S. government funding with other U.S. government‑sponsored programs in the budget formulation and appropriation processes. Moreover, the U.S., state and local governments provide energy rebates and incentives to commercial companies, which directly impact the amount of research and development that companies appropriate for energy systems. To the extent that these energy rebates and incentives are reduced or eliminated,
34
company funding for research and development could be reduced. Any reductions in available research and development funding could harm our business, financial condition and operating results.
Variability and cyclicality in the market for electric industrial vehicles could adversely affect us.
Our PosiCharge industrial EV charging system products are purchased primarily by operators of fleets of electric industrial vehicles, such as forklift trucks and airport ground support equipment. Consequently, our ability to remain profitable depends in part on the varying conditions in the market for electric industrial vehicles. This market is subject to variability as it moves in response to cycles in the overall business environment and it is also particularly sensitive to the industrial, food and beverage, retail and air travel sectors, which generate a significant portion of the demand for such vehicles. Sales of electric industrial vehicles have historically been cyclical, with demand affected by such economic factors as industrial production, construction levels, demand for consumer and durable goods, interest rates and fuel costs. A significant decline in demand for electric industrial vehicles could adversely affect our revenue and prospects, which would harm our business, financial condition and operating results.
Our success in the emerging market for passenger electric and HEV charging systems will depend on numerous factors which are out of our control.
The passenger electric and HEV charging systems market is expected to grow rapidly, along with innovations in fast charging technologies. However, because the passenger electric charging systems market is relatively new, there is no guarantee that there will be strong consumer demand for charging systems. Demand for such systems could also be directly impacted by fuel costs; if fuel costs were to significantly decrease, the demand for EVs and charging systems could decline. Additionally, the elimination or expiration of government and economic incentives to support the adoption of EVs, such as tax credits and rebates, could also negatively affect demand for EVs and charging solutions. Further, the elimination or relaxation of minimum corporate average fuel economy (“CAFE”) standards or vehicle greenhouse gas emission regulations which encourage automakers to produce and sell electric vehicles, could also slow the adoption of EVs. If there is little consumer demand for our passenger electric charging systems, our revenue and prospects could be adversely affected, which would harm our business, financial and operating results. The rate of EV adoption is difficult to predict and has been slower than many in the industry have predicted to date.
Our industrial EV charging systems business is dependent upon our relationships with third parties with whom we do not have exclusive arrangements.
To remain competitive in the market for industrial EV charging systems, we must maintain our access to potential customers and ensure that the service needs of our customers are met adequately. In many cases, we rely on battery and industrial vehicle dealers for access to potential industrial EV charging system customers. Currently, several of our industrial EV charging system competitors are working with battery manufacturers to sell fast charging systems and batteries together. Cooperative agreements between our competitors and battery manufacturers could restrict our access to battery dealers and potential industrial EV charging systems customers, adversely affecting our revenue and prospects. Additionally, we rely on outside service providers to perform post‑sale services for our PosiCharge industrial EV charging system customers. If these service providers fail to perform these services as required or discontinue their business with us, then we could lose customers to competitors, which would harm our business, financial condition and operating results.
Our commercial UAS initiative and our electric and HEV charging system business are dependent upon our development of relationships with multiple stakeholders in those industries.
We have been selected by several major automakers to support the rollout of new model EVs across the United States and internationally with our home charging system and are building relationships with numerous potential customers and channel partners in various industries related to our commercial UAS initiative. Accordingly, we depend upon those relationships and the success of early customer engagements to expand our market penetration efforts. If one or more of our partnerships terminates prematurely, and we cannot establish similar relationships with other entities with direct access to end customers, we may not be able to develop a sustainable market for our home charging system or our commercial UAS solutions, which may delay commercialization or jeopardize the long‑term success of these initiatives.
35
We believe that the success and growth of our passenger EV charging and commercial UAS businesses for the foreseeable future will also depend on our ability to develop similar working relationships with other value chain members in the United States and internationally. While we have been working with other stakeholders to explore business models and to promote our solutions, there is no guarantee that we will be successful in doing so.
Our work for the U.S. government and international governments may expose us to security risks.
As a U.S. government contractor, we face various security threats, including cyber security attacks on our information technology infrastructure, attempts to gain access to our proprietary, financial, banking or classified information as well as threats to the physical security of our facilities and employees. Although we utilize various procedures and controls to monitor and mitigate these threats, there can be no assurance that these procedures and controls will be sufficient to prevent disruptions, the unauthorized release of confidential technical, financial or banking information or corruption of data. Accordingly, any significant operational delays, or any destruction, manipulation or improper use of our data, information systems or networks could adversely affect our financial results and damage the reputation for our products and services. Previous cyber attacks directed at us have not materially impacted our business or financial results, but the impact of future incidents cannot be predicted due to the evolving nature and complexity of cyber attacks. If we or our partners are subject to data security breaches, we may have a loss in sales or increased costs arising from the restoration or implementation of additional security measures, either of which could materially and adversely affect our business and financial results. Additionally, expenses resulting from cyber security attacks and other security risks may not be fully insured or otherwise mitigated, which could harm our financial results.
In addition, we work in international locations where there are high security risks, which could result in harm to our employees and contractors or substantial costs. Some of our services are performed in or adjacent to high‑risk locations, such as Iraq and Afghanistan, where the country or location is experiencing political, social or economic issues, or war or civil unrest. In those locations where we have employees or operations, we may incur substantial costs to maintain the safety of our personnel. Despite these precautions, the safety of our personnel in these locations may continue to be at risk, and we may in the future be negatively impacted by the loss of employees and contractors, which could harm our business and operating results.
We may not be able to obtain capital when desired on favorable terms, if at all, or without dilution to our stockholders.
We operate in emerging and rapidly evolving markets, which makes our prospects difficult to evaluate. It is possible that we may not generate sufficient cash flow from operations or otherwise have the capital resources to meet our future capital needs. If this occurs, then we may need additional financing to pursue our business strategies, including to:
|
· |
hire additional engineers and other personnel; |
|
· |
develop new or enhance existing products; |
|
· |
enhance our operating infrastructure; |
|
· |
fund working capital requirements; |
|
· |
acquire complementary businesses or technologies; or |
|
· |
otherwise respond to competitive pressures. |
If we raise additional funds through the issuance of equity or convertible debt securities, the percentage ownership of our stockholders could be significantly diluted, and these newly‑issued securities may have rights, preferences or privileges senior to those of existing stockholders. We cannot assure you that additional financing will be available on terms favorable to us, or at all. Our former line of credit contained, and future debt financing may contain,
36
covenants or other provisions that limit our operational or financial flexibility. In addition, certain of our customers require that we obtain letters of credit to support our obligations under some of our contracts.
Our investment portfolio includes investments in auction rate securities. Failures in the auctions for these securities affect our liquidity, coupled with deterioration in credit ratings of issuers of such securities and/or third parties insuring such investments may require us to adjust the carrying value of our investment through an impairment of earnings.
As of April 30, 2017, our $2.5 million of long‑term investments recorded at fair value consisted entirely of auction rate municipal bonds with maturities that range from approximately 2 to 17 years. These investments have characteristics similar to short‑term investments, because at pre‑determined intervals, generally ranging from 30 to 35 days, there is a new auction process at which the interest rates for these securities are reset to current interest rates. At the end of such period, we choose to roll‑over our holdings or redeem the investments for cash. A market maker facilitates the redemption of the securities and the underlying issuers are not required to redeem the investment within 365 days.
Since fiscal 2008, we have experienced failed auctions of our auction rate securities and there is no assurance that auctions on the remaining auction rate securities in our investment portfolio will succeed in the future. As a result, our ability to liquidate our investments in the near term may be limited, and our ability to recover the carrying value of our investments may be limited. An auction failure means that the parties wishing to sell securities were not able to do so. As of June 20, 2017, including the securities involved in failed auctions, we held approximately $2.0 million of these auction rate securities, all of which carry investment grade ratings. These investments are subject to general credit, liquidity, market and interest rate risks, which may be exacerbated by problems in the global credit markets. These and other related factors have affected various sectors of the financial markets and caused credit and liquidity issues. If the issuers of these securities are unable to successfully close future auctions or their credit ratings deteriorate, we may in the future be required to record an impairment charge on these investments. We currently believe these securities are not permanently impaired, primarily due to the government backing of the underlying securities. However, it could take until the final maturity of the underlying notes (up to 17 years) to realize our remaining investments’ purchase price of $2.2 million. Based on our ability to access our cash and cash equivalents, expected operating cash flows, and our other sources of cash, we do not anticipate that the current lack of liquidity on these investments will affect our ability to continue to operate our business in the ordinary course, however we can provide no assurance as to when these investments will again become liquid or as to whether we may ultimately have to recognize an impairment charge with respect to these investments.
Our cash may be subject to a risk of loss and we may be exposed to fluctuations in the market values of our portfolio investments and in interest rates.
Our assets include a significant amount of cash and investments. We adhere to an investment policy set by our Board of Directors which aims to preserve our financial assets, maintain adequate liquidity and maximize returns. We believe that our cash is held in institutions whose credit risk is minimal and that the value and liquidity of our deposits are accurately reflected in our consolidated financial statements as of April 30, 2017. We currently invest the majority of our cash in U.S. government securities, U.S. government agency securities, municipal bonds and high-grade corporate bonds, the performance of which are subject to additional market risks related to their respective issuers. Nearly all of our cash and bank deposits are not insured by the Federal Deposit Insurance Corporation, or the FDIC. Therefore, our cash and any bank deposits that we now hold or may acquire in the future may be subject to risks, including the risk of loss or of reduced value or liquidity. In the future, should we determine that there is a decline in value of any of our portfolio securities which is not temporary in nature, this would result in a loss being recognized in our consolidated statements of operations.
Unstable market and economic conditions may have serious adverse consequences on our business, financial condition and stock price.
Global credit and financial markets have experienced extreme disruptions in recent years, including severely diminished liquidity and credit availability, declines in consumer confidence, declines in economic growth, increases in
37
unemployment rates and uncertainty about economic stability. There can be no assurance that renewed deterioration in credit and financial markets and confidence in economic conditions will not occur. Our general business strategy may be adversely affected by any economic downturn, volatile business environment or continued unpredictable and unstable market conditions. If the current equity and credit markets deteriorate, or do not improve, it may make any necessary debt or equity financing more difficult, more costly and more dilutive. Failure to secure any necessary financing in a timely manner and on favorable terms could have a material adverse effect on our growth strategy, financial performance and stock price and could require us to delay or abandon implementing business initiatives. These events and the continuing market upheavals could adversely affect our business in a number of ways, including:
Potential Deferment of Purchases and Orders by Customers: Uncertainty about current and future global economic conditions may cause governments, including the U.S. government, which is our largest customer, consumers and businesses to modify, defer or cancel purchases in response to tighter credit, decreased cash availability and declining consumer confidence. Accordingly, future demand for our products could differ materially from our current expectations. Additionally, if customers are not successful in generating sufficient revenue or are precluded from securing financing, they may not be able to pay, or may delay payment of, accounts receivable that are owed to us. Any inability of current and/or potential customers to pay us for our products may adversely affect our earnings and cash flow.
Negative Impact from Increased Financial Pressures on Key Suppliers: Our ability to meet customers’ demands depends, in part, on our ability to obtain timely and adequate delivery of quality materials, parts and components from our suppliers. Certain of our hardware components and various subsystems are available only from a limited group of suppliers. If certain key suppliers were to become capacity constrained or insolvent as a result of a market downturn, then we may have to find new suppliers. We may experience significant delays in manufacturing and shipping our products to customers and incur additional development, manufacturing and other costs to establish alternative sources of supply if we lose any of these sources or are required to redesign our products. We cannot predict if we will be able to obtain replacement components within the time frames that we require at an affordable cost, if at all. In addition, credit constraints of key suppliers could result in accelerated payment of accounts payable by us, impacting our cash flow.
Customers’ Inability to Obtain Financing to Make Purchases from Us and/or Maintain Their Business: Some of our customers may require substantial financing in order to fund their operations and make purchases from us. The inability of these customers to obtain sufficient credit to finance purchases of our products, or otherwise meet their payment obligations to us could adversely impact our financial condition and results of operations. In addition, if a market downturn results in insolvencies for our customers, it could adversely impact our financial condition and results of operations.
Potential future acquisitions could be difficult to integrate, divert the attention of key personnel, disrupt our business, dilute stockholder value and impair our financial results.
We intend to consider strategic acquisitions that would add to our customer base, technological capabilities or system offerings. Acquisitions involve numerous risks, any of which could harm our business, including the following:
|
· |
difficulties in integrating the operations, technologies, products, existing contracts, accounting and personnel of the target company and realizing the anticipated synergies of the combined businesses; |
|
· |
difficulties in supporting and transitioning customers, if any, of the target company; |
|
· |
diversion of financial and management resources from existing operations; |
|
· |
the price we pay or other resources that we devote may exceed the value we realize, or the value we could have realized if we had allocated the purchase price or other resources to another opportunity; |
|
· |
risks of entering new markets in which we have limited or no experience; |
38
|
· |
potential loss of key employees, customers and strategic alliances from either our current business or the target company’s business; |
|
· |
assumption of unanticipated problems or latent liabilities, such as problems with the quality of the target company’s products or its regulatory compliance; and |
|
· |
inability to generate sufficient revenue to offset acquisition costs. |
Acquisitions also frequently result in the recording of goodwill and other intangible assets which are subject to potential impairments in the future that could harm our financial results. In addition, if we finance acquisitions by issuing equity, or securities convertible into equity, then our existing stockholders may be diluted, which could lower the market price of our common stock. If we finance acquisitions through debt, then such future debt financing may contain covenants or other provisions that limit our operational or financial flexibility.
If we fail to properly evaluate acquisitions or investments, then we may not achieve the anticipated benefits of any such acquisitions, and we may incur costs in excess of what we anticipate. The failure to successfully evaluate and execute acquisitions or investments or otherwise adequately address these risks could materially harm our business and financial results.
Environmental laws and regulations and unforeseen costs could impact our future earnings.
The manufacture and sale of our products in certain states and countries may subject us to environmental and other regulations. For example, we obtain a significant number of our electronics components from companies located in East Asia, where environmental rules may be less stringent than in the United States. Over time, the countries where these companies are located may adopt more stringent environmental regulations, resulting in an increase in our manufacturing costs. Given the increasing focus on environmental compliance by regulators and the general public, any incidence of non‑compliance could result in damage to our reputation beyond the fines and other sanctions that could be imposed. Furthermore, certain environmental laws, including the U.S. Comprehensive, Environmental Response, Compensation and Liability Act of 1980, impose strict, joint and several liability on current and previous owners or operators of real property for the cost of removal or remediation of hazardous substances and impose liability for damages to natural resources. These laws often impose liability even if the owner or operator did not know of, or was not responsible for, the release of such hazardous substances. These environmental laws also assess liability on persons who arrange for hazardous substances to be sent to disposal or treatment facilities when such facilities are later found to be contaminated. Such persons can be responsible for cleanup costs even if they never owned or operated the contaminated facility. Although we have never been named a responsible party at a contaminated site, we could be named a potentially responsible party in the future. We cannot assure you that such existing laws or future laws will not have a material adverse effect on our future earnings or results of operations.
Our business is subject to federal, state and international laws regarding data protection and privacy, as well as confidentiality obligations under various agreements, and a privacy breach could damage our reputation, expose us to litigation risk and adversely affect our business.
In connection with our business, we receive, collect, process and retain certain sensitive and confidential customer information. As a result, we are subject to increasingly rigorous federal, state and international laws regarding privacy and data protection. We also execute confidentiality agreements with various parties under which we are required to protect their confidential information. Compliance with these agreements and constantly evolving laws may cause us to incur significant costs or require changes to our business practices, which could reduce our revenue. If we fail to comply with these privacy and data protection laws, proceedings may be brought against us by governmental entities or others or penalties may be imposed on us, either of which could have a material adverse effect on our business, results of operations and financial condition. In addition, we could be subject to damages if we breach the confidentiality obligations in our agreements. While we rely, in part, on security services and software provided by outside vendors to protect sensitive and confidential customer information, there is no guarantee that the protections that we, or our outside vendors have implemented will prevent security breaches. In addition, we have access to certain of our customers’ proprietary systems that contain sensitive information and are liable to such customers for damages
39
caused by or employees’ and agents’ misuse of or access to such systems, including damages resulting from security breaches to such customers’ systems caused by us. Any actual, threatened or perceived security breach that could result in misappropriation, loss or other unauthorized disclosure of sensitive or confidential customer information could harm our reputation and relationship with customers and potential customers, expose us to litigation risk and liability and adversely affect our business.
Compliance with the SEC’s conflict minerals regulations may increase our costs and adversely impact the supply‑chain for our UAS and EES products.
In August 2012, the SEC adopted disclosure rules regarding a company’s use of conflict minerals in its products with substantial supply chain verification requirements in the event that the conflict minerals come from, or could have come from, the Democratic Republic of the Congo or adjoining countries. These rules and verification requirements will impose additional costs on us and on our suppliers, including costs related to determining the source of conflict minerals used in our products, which will adversely affect our results of operations. We are dependent on information supplied by our first tier suppliers in conducting due diligence into the origins of conflict minerals in our products and in complying with our SEC reporting obligations. To the extent that information we receive from our suppliers is inaccurate or inadequate, we may not be able to determine whether our products are conflict mineral‑free. We may face challenges in satisfying our customers who may require that our products be certified as conflict mineral‑free, which could place us at a competitive disadvantage and could harm our business. These regulations could also have the effect of limiting the pool of suppliers from which we source items containing conflict minerals, and we may be unable to obtain conflict‑free minerals at competitive prices, if at all, which could increase our costs and adversely affect our results of operations.
Our business and operations are subject to the risks of earthquakes and other natural catastrophic events.
Our corporate headquarters, research and development and manufacturing operations are located in Southern California, a region known for seismic activity and wild fires. A significant natural disaster, such as an earthquake, fire or other catastrophic event, could severely affect our ability to conduct normal business operations, and as a result, our future operating results could be materially and adversely affected.
We self-insure a portion of our health insurance program which may expose us to unexpected costs and negatively affect our results of operations.
We are self insured for employee medical claims, subject to individual and aggregate stop loss insurance policies. We estimate a liability for claims filed and incurred but not reported based upon recent claims experience and an analysis of the average period of time between the occurrence of a claim and the time it is reported to and paid by us. However, unanticipated changes in assumptions and management estimates underlying our recorded liabilities for medical claims could result in materially different amounts of expense than expected under our health insurance program, which could have an adverse material impact on our financial condition and results of operations.
Risks Related to Our U.S. Government Contracts
We are subject to extensive government regulation, and our failure to comply with applicable regulations could subject us to penalties that may restrict our ability to conduct our business.
As a contractor to the U.S. government, we are subject to and must comply with various government regulations that impact our revenue, operating costs, profit margins and the internal organization and operation of our business. The most significant regulations and regulatory authorities affecting our business include the following:
|
· |
the Federal Acquisition Regulations and supplemental agency regulations, which comprehensively regulate the formation and administration of, and performance under, U.S. government contracts; |
|
· |
the Truth in Negotiations Act, which requires certification and disclosure of all factual cost and pricing data in connection with contract negotiations; |
40
|
· |
the False Claims Act and the False Statements Act, which impose penalties for payments made on the basis of false facts provided to the government and on the basis of false statements made to the government, respectively; |
|
· |
the Foreign Corrupt Practices Act, which prohibits U.S. companies from providing anything of value to a foreign official to help obtain, retain or direct business, or obtain any unfair advantage; |
|
· |
the National Telecommunications and Information Administration and the Federal Communications Commission, which regulate the wireless spectrum allocations upon which UAS depend for operation and data transmission in the United States; |
|
· |
the Federal Aviation Administration, which regulates the use of airspace for all aircraft, including UAS operation in the United States; |
|
· |
the International Traffic in Arms Regulations, which regulate the export of controlled technical data, defense articles and defense services and restrict from which countries we may purchase materials and services used in the production of certain of our products; and |
|
· |
laws, regulations and executive orders restricting the use and dissemination of information classified for national security purposes and the exportation of certain products and technical data. |
Also, we need special security clearances and regulatory approvals to continue working on certain of our projects with the U.S. government. Classified programs generally will require that we comply with various executive orders, federal laws and regulations and customer security requirements that may include restrictions on how we develop, store, protect and share information, and may require our employees and facilities to obtain government security clearances. Our failure to comply with applicable regulations, rules and approvals or misconduct by any of our employees could result in the imposition of fines and penalties, the loss of security clearances, the loss of our government contracts or our suspension or debarment from contracting with the U.S. government generally, any of which could harm our business, financial condition and results of operations. We are also subject to certain regulations of comparable government agencies in other countries, and our failure to comply with these non‑U.S. regulations could also harm our business, financial condition or results of operations.
Our business could be adversely affected by a negative audit or investigation by the U.S. government.
U.S. government agencies, primarily the DCAA and the DCMA, routinely audit and investigate government contractors. These agencies review a contractor’s performance under its contracts, cost structure and compliance with applicable laws, regulations and standards. These agencies also may review the adequacy of, and a contractor’s compliance with, its internal control systems and policies, including the contractor’s purchasing, quality, accounting, property, estimating, compensation and management information systems.
Like most government contractors, our contracts are audited and reviewed on a continual basis by the DCMA and the DCAA. The indirect costs we incur in performing government contracts have been audited on an annual basis. The DCMA, disallowed a portion of the our executive compensation and other costs included in our fiscal 2006, 2007 and 2008 incurred cost claims and sought interest for all three years and penalties for fiscal 2006, based on the disallowed costs. We appealed these cost disallowances to the Armed Services Board of Contract Appeals. For fiscal 2006, as a result of partial settlements and a decision of the Armed Services Board of Contract Appeals in March 2016, the government’s remaining claims were dismissed with prejudice. All of the government’s claims related to our 2007 and 2008 incurred cost claims were settled as of October 2015 by payment to the government of $50,000 and the government’s claims related to our 2009 incurred cost claims were settled as of October 2015 without the payment of any consideration. The audit of our 2010 incurred cost claim was settled in April 2016 without payment of any consideration. Our incurred cost claims for fiscal years 2011 through 2014 were accepted as submitted during the fiscal year ended April 30, 2017. No consideration was paid. In addition, non‑audit reviews or investigations by the government may still be conducted on all of our government contracts.
41
Any costs found to be improperly allocated to a specific cost reimbursement contract will not be reimbursed, while such costs already reimbursed must be refunded. If an audit or investigation of our business were to uncover improper or illegal activities, then we could be subject to civil and criminal penalties and administrative sanctions, including termination of contracts, suspension of payments, fines and suspension or debarment from doing business with the U.S. government. We could experience serious harm to our reputation if allegations of impropriety or illegal acts were made against us, even if the allegations were inaccurate. In addition, responding to governmental audits or investigations may involve significant expense and divert management attention. If any of the foregoing were to occur, our financial condition and operating results could be materially adversely affected.
Moreover, if any of our administrative processes and business systems are found not to comply with the applicable requirements, we may be subjected to increased government scrutiny or required to obtain additional governmental approvals that could delay or otherwise adversely affect our ability to compete for or perform contracts. In December 2015, DCMA concluded that our purchasing system was not approved. In an April 2016 follow-up review the DCMA approved our purchasing system. An unfavorable outcome to such an audit or investigation by the DCAA, U.S. Department of Justice or DOJ, or other government agency, could materially adversely affect our competitive position, affect our ability to obtain new government business, and obtain the maximum price for our products and services, and result in a substantial reduction of our revenues.
If we were suspended or debarred from contracting with the federal government generally, or any specific agency, if our reputation or relationship with government agencies were impaired, or if the government otherwise ceased doing business with us or significantly decreased the amount of business it does with us, our revenue and operating results could be materially harmed. For example, in February 2010, we were notified by the DOJ that it had initiated a civil investigation into our cost charging practices with respect to government contracts. We resolved these claims with the DOJ in October 2013. Under the settlement agreement, we reimbursed the government for an amount erroneously charged to the government in our fiscal 2006 incurred cost claim submittal.
Some of our contracts with the U.S. government allow it to use inventions developed under the contracts and to disclose technical data to third parties, which could harm our ability to compete.
Some of our contracts allow the U.S. government to use, royalty‑free, or have others use, inventions developed under those contracts on behalf of the government. Some of the contracts allow the federal government to disclose technical data without constraining the recipient on how those data are used. The ability of third parties to use patents and technical data for government purposes creates the possibility that the government could attempt to establish alternative suppliers or to negotiate with us to reduce our prices. The potential that the government may release some of the technical data without constraint creates the possibility that third parties may be able to use this data to compete with us, which could have a material adverse effect on our business, results of operations or financial condition.
U.S. government contracts are generally not fully funded at inception and contain certain provisions that may be unfavorable to us, which could prevent us from realizing our contract backlog and materially harm our business and results of operations.
U.S. government contracts typically involve long lead times for design and development, and are subject to significant changes in contract scheduling. Congress generally appropriates funds on a fiscal year basis even though a program may continue for several years. Consequently, programs are often only partially funded initially, and additional funds are committed only as Congress makes further appropriations. The termination or reduction of funding for a government program would result in a loss of anticipated future revenue attributable to that program.
The actual receipt of revenue on awards included in backlog may never occur or may change because a program schedule could change or the program could be canceled, or a contract could be reduced, modified or terminated early.
In addition, U.S. government contracts generally contain provisions permitting termination, in whole or in part, at the government’s convenience or for contractor default. Since a substantial majority of our revenue is dependent on the procurement, performance and payment under our U.S. government contracts, the termination of one or more critical
42
government contracts could have a negative impact on our results of operations and financial condition. Termination arising out of our default could result in damage to our reputation, expose us to liability and have a material adverse effect on our ability to re‑compete for future contracts and orders. Moreover, several of our contracts with the U.S. government do not contain a limitation of liability provision, creating a risk of responsibility for indirect, incidental damages and consequential damages. These provisions could cause substantial liability for us, especially given the use to which our products may be put.
U.S. government contracts are subject to a competitive bidding process that can consume significant resources without generating any revenue.
U.S. government contracts are frequently awarded only after formal, protracted competitive bidding processes and, in many cases, unsuccessful bidders for U.S. government contracts are provided the opportunity to protest contract awards through various agency, administrative and judicial channels. We derive significant revenue from U.S. government contracts that were awarded through a competitive bidding process. Much of the UAS business that we expect to seek in the foreseeable future likely will be awarded through competitive bidding. Competitive bidding presents a number of risks, including the following:
|
· |
the need to bid on programs in advance of the completion of their design, which may result in unforeseen technological difficulties and cost overruns; |
|
· |
the substantial cost and managerial time and effort that must be spent to prepare bids and proposals for contracts that may not be awarded to us; |
|
· |
the need to estimate accurately the resources and cost structure that will be required to service any contract we are awarded; and |
|
· |
the expense and delay that may arise if our competitors protest or challenge contract awards made to us pursuant to competitive bidding, and the risk that any such protest or challenge could result in the delay of our contract performance, the distraction of management, the resubmission of bids on modified specifications, or in termination, reduction or modification of the awarded contract. |
We may not be provided the opportunity to bid on contracts that are held by other companies and are scheduled to expire if the government extends the existing contract. If we are unable to win particular contracts that are awarded through a competitive bidding process, then we may not be able to operate for a number of years in the market for goods and services that are provided under those contracts. If we are unable to win new contract awards over any extended period consistently, then our business and prospects will be adversely affected.
We are subject to procurement rules and regulations, which increase our performance and compliance costs under our U.S. government contracts.
We must comply with, and are affected by, laws and regulations relating to the formation, administration and performance of U.S. government contracts. These laws and regulations, among other things, require certification and disclosure of all cost and pricing data in connection with contract negotiation, define allowable and unallowable costs and otherwise govern our right to reimbursement under certain cost‑based U.S. government contracts, and restrict the use and dissemination of classified information and the exportation of certain products and technical data. These requirements, although customary in U.S. government contracts, increase our performance and compliance costs. These costs might increase in the future, reducing our margins, which could have a negative effect on our financial condition. Although we believe we have procedures in place to comply with these regulations and requirements, the regulations and requirements are complex and change frequently. Failure to comply with these regulations and requirements under certain circumstances could lead to suspension or debarment from U.S. government contracting or subcontracting for a period of time and could have a negative effect on our reputation and ability to receive other U.S. government contract awards in the future.
43
Risks Related to Our Intellectual Property
If we fail to protect, or incur significant costs in defending or enforcing our intellectual property and other proprietary rights, our business, financial condition and results of operations could be materially harmed.
Our success depends, in large part, on our ability to protect our intellectual property and other proprietary rights. We rely primarily on patents, trademarks, copyrights, trade secrets and unfair competition laws, as well as license agreements and other contractual provisions, to protect our intellectual property and other proprietary rights. However, a significant portion of our technology is not patented, and we may be unable or may not seek to obtain patent protection for this technology. In addition, the U.S. government has licenses under certain of our patents and certain other intellectual property that are developed or used in performance of government contracts, and it may use or authorize others to use such patents and intellectual property for government and other purposes. Moreover, existing U.S. legal standards relating to the validity, enforceability and scope of protection of intellectual property rights offer only limited protection, may not provide us with any competitive advantages, and our rights may be challenged by third parties. The laws of countries other than the United States may be even less protective of our intellectual property rights. Accordingly, despite our efforts, we may be unable to prevent third parties from infringing upon or misappropriating our intellectual property or otherwise gaining access to our technology. Unauthorized third parties may try to copy or reverse engineer our products or portions of our products or otherwise obtain and use our intellectual property. Moreover, many of our employees have access to our trade secrets and other intellectual property. If one or more of these employees leave our employment to work for one of our competitors, then they may disseminate this proprietary information, which may as a result damage our competitive position. If we fail to protect our intellectual property and other proprietary rights, then our business, results of operations or financial condition could be materially harmed. From time to time, we have initiated lawsuits to protect our intellectual property and other proprietary rights. Pursuing these claims is time consuming and expensive and could adversely impact our results of operations.
In addition, affirmatively defending our intellectual property rights and investigating whether any of our products or services violate the rights of others may entail significant expense. Our intellectual property rights may be challenged by others or invalidated through administrative processes or litigation. If we resort to legal proceedings to enforce our intellectual property rights or to determine the validity and scope of the intellectual property or other proprietary rights of others, then the proceedings could result in significant expense to us and divert the attention and efforts of our management and technical employees, even if we prevail.
We may be sued by third parties for alleged infringement of their proprietary rights, which could be costly, time‑consuming and limit our ability to use certain technologies in the future.
We may become subject to claims that our technologies infringe upon the intellectual property or other proprietary rights of third parties. Defending against, or otherwise addressing, any such claims, whether they are with or without merit, could be time‑consuming and expensive, and could divert our management’s attention away from the execution of our business plan. Moreover, any settlement or adverse judgment resulting from these claims could require us to pay substantial amounts or obtain a license to continue to use the disputed technology, or otherwise restrict or prohibit our use of the technology. We cannot assure you that we would be able to: obtain from the third party asserting the claim a license on commercially reasonable terms, if at all; develop alternative technology on a timely basis, if at all; or obtain a license to use a suitable alternative technology to permit us to continue offering, and our customers to continue using, our affected product. An adverse determination also could prevent us from offering our products to others. Infringement claims asserted against us may have a material adverse effect on our business, results of operations or financial condition.
Risks Relating to Securities Markets and Investment in Our Stock
The price of our common stock may fluctuate significantly.
The market prices for securities of emerging technology companies have historically been highly volatile, and the market has from time to time experienced significant price and volume fluctuations that are unrelated to the
44
operating performance of particular companies. The market price of our common stock may fluctuate significantly in response to a number of factors, most of which we cannot control, including the following:
|
· |
U.S. government spending levels, both generally and by our particular customers; |
|
· |
the volume of operational activity by the U.S. military; |
|
· |
delays in the payment of our invoices by government payment offices, resulting in potentially reduced earnings during a particular fiscal quarter; |
|
· |
announcements of new products or technologies, commercial relationships or other events relating to us or our industry or our competitors; |
|
· |
failure of any of our key products to gain market acceptance; |
|
· |
variations in our quarterly operating results; |
|
· |
perceptions of the prospects for the markets in which we compete; |
|
· |
changes in general economic conditions; |
|
· |
changes in securities analysts’ estimates of our financial performance; |
|
· |
regulatory developments in the United States and foreign countries; |
|
· |
fluctuations in stock market prices and trading volumes of similar companies; |
|
· |
news about the markets in which we compete or regarding our competitors; |
|
· |
terrorist acts or military action related to international conflicts, wars or otherwise; |
|
· |
sales of large blocks of our common stock, including sales by our executive officers, directors and significant stockholders; and |
|
· |
additions or departures of key personnel. |
In addition, the equity markets in general, and NASDAQ in particular, have experienced extreme price and volume fluctuations that have often been unrelated or disproportionate to the operating performance of companies. Further, the market prices of securities of emerging technology companies have been particularly volatile. These broad market and industry factors may affect the market price of our common stock adversely, regardless of our operating performance. In the past, following periods of volatility in the market price of a company’s securities, securities class action litigation often has been instituted against that company. This type of litigation, if instituted against us, could result in substantial costs and a diversion of management’s attention and resources.
Our management, whose interests may not be aligned with yours, is able to exert significant influence over all matters requiring stockholder approval.
As of June 17, 2017, our directors, executive officers and their affiliates collectively beneficially owned 2,916,128 shares, or approximately 12%, of our total outstanding shares of common stock. Accordingly, our directors and executive officers as a group may be able to exert significant influence over matters requiring stockholder approval, including the election of directors. The interests of our directors and executive officers may not be fully aligned with yours. Although there is no agreement among our directors and executive officers with respect to the voting of their shares, this concentration of ownership may delay, defer or even prevent a change in control of our company, and make
45
transactions more difficult or impossible without the support of all or some of our directors and executive officers. These transactions might include proxy contests, tender offers, mergers or other purchases of common stock that could give you the opportunity to realize a premium over the then‑prevailing market price for shares of our common stock.
Delaware law and anti‑takeover provisions in our organizational documents may discourage our acquisition by a third party, which could make it more difficult to acquire us and limit your ability to sell your shares at a premium.
Our certificate of incorporation and bylaws contain certain provisions that reduce the probability of a change of control or acquisition of our company, even if such a transaction would be beneficial to our stockholders. These provisions include, but are not limited to:
|
· |
The ability of our board of directors to issue preferred stock in one or more series of with such rights, obligations and preferences as the board may determine, without further vote or action by our stockholders; |
|
· |
Advanced notice procedures for stockholders to nominate candidates for election to the board of directors and for stockholders to submit proposals for consideration at a meeting of stockholders; |
|
· |
The absence of cumulative voting rights for our stockholders; |
|
· |
The classification of our board of directors, which effectively prevents stockholders from electing a majority of the directors at any one annual meeting of stockholders; |
|
· |
The limitation that directors may be removed only for cause by the affirmative vote of the holders of 662/3% of the total voting power of all of our outstanding securities entitled to vote in the election of directors, voting together as a single class; and |
|
· |
Restrictions on the ability of our stockholders to call a special meeting of stockholders. |
We are also subject to Section 203 of the Delaware General Corporation Law which, subject to certain exceptions, prohibits “business combinations” between a publicly‑held Delaware corporation and an “interested stockholder,” which is generally defined as a stockholder who becomes a beneficial owner of 15% or more of a Delaware corporation’s voting stock for a three‑year period following the date that such stockholder became an interested stockholder. This statute, as well as the provisions in our organizational documents, could have the effect of delaying, deterring or preventing certain potential acquisitions or a change in control of us.
Item 1B. Unresolved Staff Comments.
None.
All of our facilities are leased. Our corporate headquarters are located in Monrovia, California where we lease approximately 36,000 square feet under an agreement expiring in June 2024. We have several other leased facilities in California, Alabama and Virginia that are used for administration, research and development, logistics and manufacturing and have a total of approximately 375,000 square feet. Such leases expire between the end of 2017 and 2022. We believe that our facilities are adequate to meet our needs for the foreseeable future.
As of April 30, 2017 our business segments had significant operations at the following locations:
|
· |
UAS: Simi Valley, and CA; Huntsville, AL. |
|
· |
EES: Monrovia, CA; and Simi Valley, CA. |
|
· |
Corporate functions: Monrovia, CA; and Simi Valley, CA |
46
We are not currently a party to any material legal proceedings. We are, however, subject to lawsuits, government investigations, audits and other legal proceedings from time to time in the ordinary course of our business. It is not possible to predict the outcome of any legal proceeding with any certainty. The outcome or costs we incur in connection with a legal proceeding could adversely impact our operating results and financial position.
Item 4. Mine Safety Disclosure.
Not applicable.
47
Item 5. Market for Registrant’s Common Equity, Related Stockholder Matters and Issuer Purchases of Equity Securities.
Common Stock
The following table sets forth, for the periods indicated, the high and low sales prices for our common stock from May 1, 2015 through April 30, 2017. The following quotations reflect inter‑dealer prices, without retail mark‑up, mark‑down or commission, and may not represent actual transactions.
|
|
|
Fiscal Year Ended April 30, |
|
||||||||||
|
|
|
2017 |
|
2016 |
|
||||||||
|
|
|
High |
|
Low |
|
High |
|
Low |
|
||||
|
First Quarter |
|
$ |
32.44 |
|
$ |
26.02 |
|
$ |
29.22 |
|
$ |
25.01 |
|
|
Second Quarter |
|
$ |
30.08 |
|
$ |
22.16 |
|
$ |
27.00 |
|
$ |
19.10 |
|
|
Third Quarter |
|
$ |
29.42 |
|
$ |
23.40 |
|
$ |
30.65 |
|
$ |
21.86 |
|
|
Fourth Quarter |
|
$ |
29.96 |
|
$ |
25.42 |
|
$ |
29.94 |
|
$ |
23.13 |
|
On June 20, 2017, the closing sales price of our common stock as reported on the NASDAQ Global Select Market was $31.11 per share. As of June 20, 2017, there were 72 holders of record of our common stock.
Dividends
To date we have retained all earnings for use in the operation and expansion of our business and do not anticipate paying any cash dividends in the foreseeable future. Any future determination related to dividend policy will be made at the discretion of our board of directors and will depend upon, among other factors, our results of operations, financial condition, capital requirements, capital allocation policy, expected return on invested capital, contractual restrictions and such other factors as our board of directors deems relevant.
48
Stock Price Performance Graph
The following graph shows a comparison of cumulative returns on our common stock, based on the market price of the common stock, with the cumulative total returns of companies in the Russell 2000 Index and the SPADE Defense Index.
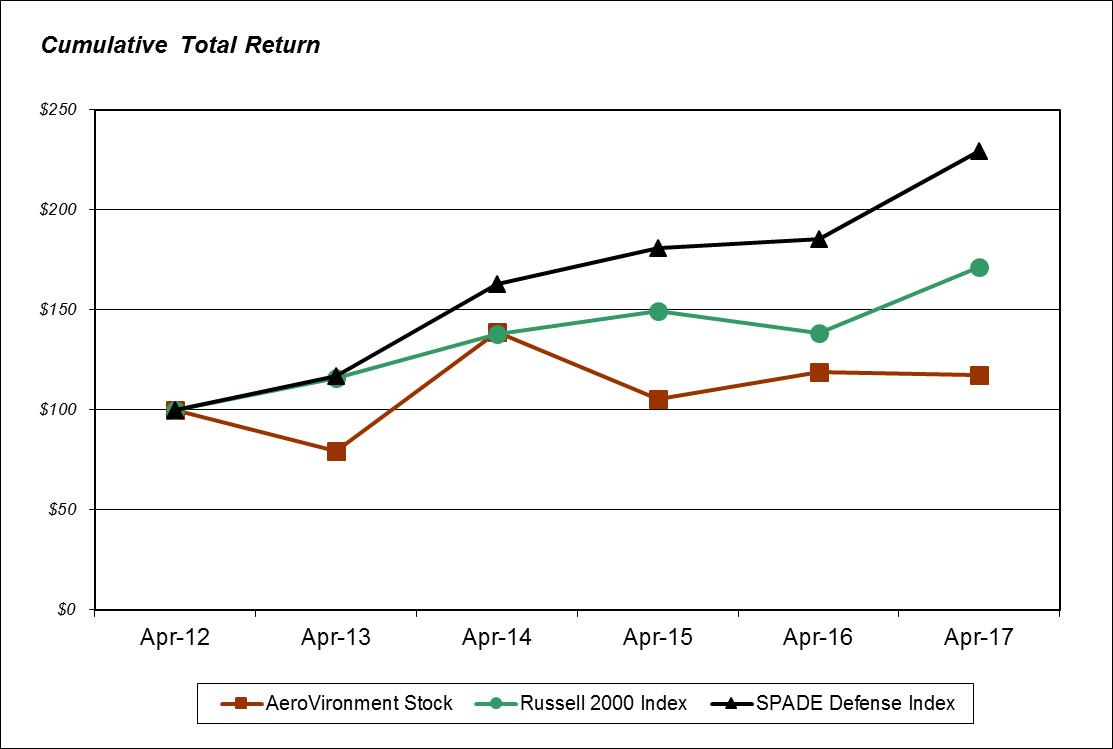
The following table shows the value of $100 invested on April 30, 2012 in AeroVironment, Inc., the Russell 2000 Index and the SPADE Defense Index.
|
|
|
Performance Graph Table ($) |
|
||||||||||
|
|
|
April 30, |
|
April 30 |
|
April 30, |
|
April 30, |
|
April 30 |
|
April 30, |
|
|
|
|
2012 |
|
2013 |
|
2014 |
|
2015 |
|
2016 |
|
2017 |
|
|
AeroVironment Stock |
|
100 |
|
80 |
|
139 |
|
105 |
|
119 |
|
117 |
|
|
Russell 2000 Index |
|
100 |
|
116 |
|
138 |
|
149 |
|
138 |
|
171 |
|
|
SPADE Defense Index |
|
100 |
|
117 |
|
163 |
|
181 |
|
185 |
|
230 |
|
The stock price performance shown on the graph above is not necessarily indicative of future price performance. Factual material was obtained from sources believed to be reliable, but we are not responsible for any errors or omissions contained therein. No portions of this graph shall be deemed incorporated by reference into any filing under the Securities Act, or the Exchange Act through any general statement incorporating by reference in its entirety the report in which this graph appears, except to the extent that we specifically incorporate this graph or a portion of it by reference. In addition, this graph shall not be deemed filed under either the Securities Act or the Exchange Act.
49
Issuer Purchases of Equity Securities
On September 24, 2015, we announced that on September 23, 2015 our Board of Directors authorized a share repurchase program (the “Share Repurchase Program”), pursuant to which we may repurchase up to $25 million of our common stock from time to time, in amounts and at prices we deem appropriate, subject to market conditions and other considerations. Share repurchases may be executed through open market transactions or negotiated purchases and may be made under a Rule 10b5-1 plan. There is no expiration date for the program. The Share Repurchase Program does not obligate us to acquire any particular amount of common stock and may be suspended at any time by our Board of Directors. We did not repurchase any shares during the fiscal year ended April 30, 2017. As of April 30, 2017, approximately $21.2 million remained authorized for future repurchases under this program.
Item 6. Selected Consolidated Financial Data.
The following selected financial data should be read in conjunction with our consolidated financial statements. The information set forth below is not necessarily indicative of results of future operations, and should be read in conjunction with Item 7, “Management’s Discussion and Analysis of Financial Condition and Results of Operations” and the consolidated financial statements and notes thereto included in Item 8, “Financial Statements and Supplementary Data” of this Annual Report in order to understand fully factors that may affect the comparability of the financial data presented below.
|
|
|
Year Ended April 30, |
|
|||||||||||||
|
|
|
2017 |
|
2016 |
|
2015 |
|
2014 |
|
2013 |
|
|||||
|
|
|
(In thousands, except per share data) |
|
|||||||||||||
|
Consolidated Income Statement Data: |
|
|
|
|
|
|
|
|
|
|
|
|
|
|
|
|
|
Revenue |
|
$ |
264,873 |
|
$ |
264,098 |
|
$ |
259,398 |
|
$ |
251,703 |
|
$ |
240,152 |
|
|
Net income attributable to AeroVironment |
|
$ |
12,479 |
|
$ |
8,966 |
|
$ |
2,895 |
|
$ |
13,718 |
|
$ |
10,426 |
|
|
Earnings per common share attributable to AeroVironment: |
|
|
|
|
|
|
|
|
|
|
|
|
|
|
|
|
|
Basic |
|
$ |
0.54 |
|
$ |
0.39 |
|
$ |
0.13 |
|
$ |
0.61 |
|
$ |
0.47 |
|
|
Diluted |
|
$ |
0.54 |
|
$ |
0.39 |
|
$ |
0.13 |
|
$ |
0.60 |
|
$ |
0.47 |
|
|
Weighted average common shares outstanding (basic): |
|
|
23,059 |
|
|
22,936 |
|
|
22,869 |
|
|
22,354 |
|
|
22,070 |
|
|
Weighted average common shares outstanding (diluted): |
|
|
23,308 |
|
|
23,153 |
|
|
23,146 |
|
|
22,719 |
|
|
22,390 |
|
|
Balance Sheet Data |
|
|
|
|
|
|
|
|
|
|
|
|
|
|
|
|
|
Total assets |
|
$ |
432,500 |
|
$ |
410,393 |
|
$ |
397,467 |
|
$ |
384,954 |
|
$ |
361,604 |
|
|
Capital lease obligations, current portion |
|
$ |
288 |
|
$ |
390 |
|
$ |
— |
|
$ |
— |
|
$ |
— |
|
|
Capital lease obligations, net of current portion |
|
$ |
161 |
|
$ |
449 |
|
$ |
— |
|
$ |
— |
|
$ |
— |
|
|
Other long-term obligations |
|
$ |
2,083 |
|
$ |
2,339 |
|
$ |
1,820 |
|
$ |
4,752 |
|
$ |
4,231 |
|
Item 7. Management’s Discussion and Analysis of Financial Condition and Results of Operations.
Introduction
The following discussion of our financial condition and results of operations should be read in conjunction with our “Selected Consolidated Financial Data” and our consolidated financial statements and notes thereto included herein as Item 8. This discussion contains forward‑looking statements. Refer to “Forward‑Looking Statements” on page 2 and “Risk Factors” beginning on page 23, for a discussion of the uncertainties, risks and assumptions associated with these statements.
50
Overview
We design, develop, produce, support and operate a technologically‑advanced portfolio of products. We supply unmanned aircraft systems (“UAS”) and related services to organizations within the U.S. Department of Defense (“DoD”) and to international allied governments, and tactical missile systems and related services primarily to organizations within the U.S. Government. We also supply charging systems and services for electric vehicles and power cycling and test systems to commercial, consumer and government customers. We derive the majority of our revenue from these business areas and we believe that the markets for these solutions have significant growth potential. Additionally, we believe that some of the innovative potential products in our research and development pipeline will emerge as new growth platforms in the future, creating additional market opportunities.
The success we have achieved with our current products and services stems from our investment in research and development and our ability to invent and deliver advanced solutions, utilizing our proprietary technologies, to help our government, commercial and consumer customers operate more effectively and efficiently. We develop these highly innovative solutions by working very closely with our key customers in each segment of our business and solving their most important challenges related to our areas of expertise. Our core technological capabilities, developed through more than 40 years of innovation, include lightweight aerostructures, power electronics, electric propulsion systems, efficient electric power generation, conversion, and storage systems, high‑density energy packaging, miniaturization, DDL, aircraft payloads, controls integration, systems integration and engineering optimization coupled with professional field service capabilities.
Our UAS business segment focuses primarily on the design, development, production, support and operation of innovative UAS and tactical missile systems that provide situational awareness, multi‑band communications, force protection and other mission effects to increase the security and effectiveness of our customers’ operations. Our Efficient Energy Systems, or EES, business segment focuses primarily on the design, development, production, marketing, support and operation of innovative efficient electric energy systems that address the growing demand for electric transportation solutions.
Revenue
We generate our revenue primarily from the sale, support and operation of our small UAS, tactical missile systems, electric vehicle charging systems and power cycling and test systems solutions. Support for our small UAS customers includes training, spare parts, product repair, product replacement, and the customer‑contracted operation of our small UAS by our personnel. We refer to these support activities, in conjunction with customer‑funded R&D, as our services operation. We derive most of our small UAS revenue from fixed‑price and cost‑plus‑fee contracts with the U.S. government, and most of our electric vehicle charging systems and power cycling and test systems revenue from sales and service to commercial customers.
Cost of Sales
Cost of sales consists of direct costs and allocated indirect costs. Direct costs include labor, materials, travel, subcontracts and other costs directly related to the execution of a specific contract. Indirect costs include overhead expenses, fringe benefits and other costs that are not directly charged to a specific contract.
Gross Margin
Gross margin is equal to revenue minus cost of sales. We use gross margin as a financial metric to help us understand trends in our direct costs and allocated indirect costs when compared to the revenue we generate.
Research and Development Expense
Research and development, or R&D, is an integral part of our business model. We normally conduct significant internally funded R&D. Our R&D activities focus specifically on creating capabilities that support our existing product portfolio as well as new solutions.
51
Selling, General and Administrative
Our selling, general and administrative expenses, or SG&A, include salaries and other expenses related to selling, marketing and proposal activities, and other administrative costs. Some SG&A expenses relate to market and business development activities that support both ongoing business areas as well as new and emerging market areas. These activities can be directly associated with developing requirements for and applications of capabilities created in our R&D activities. SG&A is an important financial metric that we analyze to help us evaluate the contribution of our selling, marketing and proposal activities to revenue generation.
Other Income and Expenses
Other income and expenses includes interest income, interest expense, amortization of capital lease payments, changes in fair value of certain financial investments, gains/losses on sale of available‑for‑sale equity securities, gains resulting from the purchase of a controlling interest in an entity formerly accounted for under the equity method, and losses from equity method investments.
Income Tax Expense
Our effective tax rates are substantially lower than the statutory rates primarily due to research and development tax credits.
Net loss (income) Attributable to Noncontrolling interests
Net loss attributable to noncontrolling interests includes the 15% interest in the income or losses of our Turkish joint venture, Altoy Savunma Sanayi ve Havacilik Anonim Sirketi (“Altoy”). We acquired a controlling interest in Altoy on February 1, 2017.
Critical Accounting Policies and Estimates
Management’s Discussion and Analysis of Financial Condition and Results of Operations discusses our consolidated financial statements, which have been prepared in accordance with accounting principles generally accepted in the United States. When we prepare these consolidated financial statements, we are required to make estimates and assumptions that affect the reported amounts of assets and liabilities and the disclosure of contingent assets and liabilities at the date of the financial statements and the reported amounts of revenue and expenses during the reporting period. Some of our accounting policies require that we make subjective judgments, including estimates that involve matters that are inherently uncertain. Our most critical estimates include those related to revenue recognition, inventories and reserves for excess and obsolescence, self‑insured liabilities, accounting for stock‑based awards, and income taxes. We base our estimates and judgments on historical experience and on various other factors that we believe to be reasonable under the circumstances, the results of which form the basis for our judgments about the carrying values of assets and liabilities that are not readily apparent from other sources. Our actual results may differ from these estimates under different assumptions or conditions.
We believe the following critical accounting estimates affect our more significant judgments and estimates used in preparing our consolidated financial statements. Please see Note 1 to our consolidated financial statements, which are included in Item 8 “Financial Statements and Supplementary Data” of this Annual Report, for our Organization and Significant Accounting Policies. There have been no material changes made to the critical accounting estimates during the periods presented in the consolidated financial statements.
Revenue Recognition
Significant management judgments and estimates must be made and used in connection with the recognition of revenue in any accounting period. Material differences in the amount of revenue in any given period may result if these judgments or estimates prove to be incorrect or if management’s estimates change on the basis of development of the
52
business or market conditions. Management judgments and estimates have been applied consistently and have been reliable historically. We believe that there are two key factors which impact the reliability of management’s estimates. The first of those key factors is that the terms of our contracts are typically less than six months. The short‑term nature of such contracts reduces the risk that material changes in accounting estimates will occur on the basis of market conditions or other factors. The second key factor is that we have hundreds of contracts in any given accounting period, which reduces the risk that any one change in an accounting estimate on one or several contracts would have a material impact on our consolidated financial statements or our two reporting segments’ measures of profit.
The substantial majority of our revenue is generated pursuant to written contractual arrangements to design, develop, manufacture and/or modify complex products, and to provide related engineering, technical and other services according to customer specifications. These contracts may be fixed price or cost‑reimbursable. We consider all contracts for treatment in accordance with authoritative guidance for contracts with multiple deliverables.
Revenue from product sales not under contractual arrangement is recognized at the time title and the risk and rewards of ownership pass, which typically occurs when the products are shipped and collection is reasonably assured.
Revenue and profits on fixed‑price contracts are recognized using percentage‑of‑completion methods of accounting. Revenue and profits on fixed‑price production contracts, whose units are produced and delivered in a continuous or sequential process, are recorded as units are delivered based on their selling prices, or the units‑of‑delivery method. Revenue and profits on other fixed‑price contracts with significant engineering as well as production requirements are recorded based on the ratio of total actual incurred costs to date to the total estimated costs for each contract, or the cost‑to‑cost method. Under percentage‑of‑completion methods of accounting, a single estimated total profit margin is used to recognize profit for each contract over its entire period of performance, which can exceed one year. Accounting for revenue and profits on a fixed‑price contract requires the preparation of estimates of (1) the total contract revenue, (2) the total costs at completion, which is equal to the sum of the actual incurred costs to date on the contract and the estimated costs to complete the contract’s statement of work and (3) the measurement of progress towards completion. The estimated profit or loss at completion on a contract is equal to the difference between the total estimated contract revenue and the total estimated cost at completion. Under the units‑of‑delivery method, sales on a fixed‑price type contract are recorded as the units are delivered during the period based on their contractual selling prices. Under the cost‑to‑cost method, sales on a fixed‑price type contract are recorded at amounts equal to the ratio of actual cumulative costs incurred divided by total estimated costs at completion, multiplied by (A) the total estimated contract revenue, less (B) the cumulative sales recognized in prior periods. The profit recorded on a contract in any period using either the units‑of‑delivery method or cost‑to‑cost method is equal to (X) the current estimated total profit margin multiplied by the cumulative sales recognized, less (Y) the amount of cumulative profit previously recorded for the contract. In the case of a contract for which the total estimated costs exceed the total estimated revenue, a loss arises, and a provision for the entire loss is recorded in the period that it becomes evident. The unrecoverable costs on a loss contract that are expected to be incurred in future periods are recorded in the program cost.
Revenue and profits on cost‑reimbursable type contracts are recognized as costs are incurred on the contract, at an amount equal to the costs plus the estimated profit on those costs. The estimated profit on a cost‑reimbursable contract is generally fixed or variable based on the contractual fee arrangement.
We review cost performance and estimates to complete at least quarterly and in many cases more frequently. Adjustments to original estimates for a contract’s revenue, estimated costs at completion and estimated profit or loss are often required as work progresses under a contract, as experience is gained and as more information is obtained, even though the scope of work required under the contract may not change, or if contract modifications occur. The impact of revisions in profit estimates for all types of contracts are recognized on a cumulative catch‑up basis in the period in which the revisions are made. During the fiscal years ended April 30, 2017, 2016 and 2015, changes in accounting estimates on fixed‑price contracts recognized using the percentage of completion method of accounting are presented below. Amounts representing contract change orders or claims are included in revenue only when they can be reliably estimated and their realization is probable. Incentives or penalties and awards applicable to performance on contracts are considered in estimating revenue and profit rates, and are recorded when there is sufficient information to assess anticipated contract performance.
53
For the years ended April 30, 2017, 2016 and 2015, favorable and unfavorable cumulative catch‑up adjustments included in cost of sales were as follows (in thousands):
|
|
|
Year Ended April 30, |
|
|||||||
|
|
|
2017 |
|
2016 |
|
2015 |
|
|||
|
|
|
|
|
|
|
|
|
|
|
|
|
Gross favorable adjustments |
|
$ |
464 |
|
$ |
479 |
|
$ |
885 |
|
|
Gross unfavorable adjustments |
|
|
(318) |
|
|
(210) |
|
|
(1,017) |
|
|
Net adjustments |
|
$ |
146 |
|
$ |
269 |
|
$ |
(132) |
|
For the year ended April 30, 2017, favorable cumulative catch‑up adjustments of $0.5 million were primarily due to final cost adjustments on 52 contracts, which individually were not material. For the same period, unfavorable cumulative catch‑up adjustments of $0.3 million were primarily related to higher than expected costs on 9 contracts, which individually were not material.
For the year ended April 30, 2016, favorable cumulative catch‑up adjustments of $0.5 million were primarily due to final cost adjustments on 19 contracts, which individually were not material. For the same period, unfavorable cumulative catch‑up adjustments of $0.2 million were primarily related to higher than expected costs on 15 contracts, which individually were not material.
For the year ended April 30, 2015, favorable cumulative catch‑up adjustments of $0.9 million were primarily due to final cost adjustments on 28 contracts, which individually were not material. For the same period, unfavorable cumulative catch‑up adjustments of $1.0 million were primarily related to higher than expected costs on 170 contracts, which individually were not material.
Inventories and Reserve for Excess and Obsolescence
Our policy for valuation of inventory, including the determination of obsolete or excess inventory, requires us to perform a detailed assessment of inventory at each balance sheet date, which includes a review of, among other factors, an estimate of future demand for products within specific time horizons, valuation of existing inventory, as well as product lifecycle and product development plans. Inventory reserves are also provided to cover risks arising from slow‑moving items. We write down our inventory for estimated obsolescence or unmarketable inventory equal to the difference between the cost of inventory and the estimated market value based on assumptions about future demand and market conditions. We may be required to record additional inventory write‑downs if actual market conditions are less favorable than those projected by our management.
Self‑Insured Liability
We are self‑insured for employee medical claims, subject to individual and aggregate stop‑loss policies. We estimate a liability for claims filed and incurred but not reported based upon recent claims experience and an analysis of the average period of time between the occurrence of a claim and the time it is reported to and paid by us. We perform an annual evaluation of this policy and have determined that for all prior years during which this policy has been in effect there have been cost advantages to this policy, as compared to obtaining commercially available employee medical insurance. However, actual results may differ materially from those estimated and could have a material impact on our consolidated financial statements.
Impairment of Long‑Lived Assets
We review the recoverability of long‑lived assets whenever events or changes in circumstances indicate that the carrying amount of such assets may not be recoverable. The estimated future cash flows are based upon, among other things, assumptions about expected future operating performance, and may differ from actual cash flows. If the sum of
54
the projected undiscounted cash flows (excluding interest) is less than the carrying value of the assets, the assets will be written down to the estimated fair value in the period in which the determination is made.
Goodwill
Goodwill represents the excess of the cost of an acquired entity over the fair value of the acquired net assets. Goodwill is tested for impairment annually during the fourth quarter of our fiscal year or when events or circumstances change in a manner that indicates goodwill might be impaired. Events or circumstances that could trigger an impairment review include, but are not limited to, a significant adverse change in legal factors or in the business climate, an adverse action or assessment by a regulator, unanticipated competition, a loss of key personnel, significant changes in the manner of our use of the acquired assets or the strategy for our overall business, significant negative industry or economic trends or significant underperformance relative to expected historical or projected future results of operations. At April 30, 2017 goodwill was not significant.
Intangible Assets – Acquired in Business Combinations
We perform valuations of assets acquired and liabilities assumed on each acquisition accounted for as a business combination and allocate the purchase price of each acquired business to our respective net tangible and intangible assets. Acquired intangible assets include: customer relationships and trade names. We use valuation techniques to value these intangibles assets, with the primary technique being a discounted cash flow analysis. A discounted cash flow analysis requires us to make various assumptions and estimates including projected revenue, gross margins, operating costs, growth rates, useful lives and discount rates. Intangible assets are amortized over their estimated useful lives using the straight-line method which approximates the pattern in which the economic benefits are consumed.
Long‑Term Incentive Awards
For our outstanding long-term incentive plans as of April 30, 2017, we grant long‑term incentive awards and we establish a target payout at the beginning of each performance period. The actual payout at the end of the performance period is calculated based upon our achievement of such targets. Payouts are made in cash and restricted stock units. Upon vesting of the restricted stock units, we have the discretion to settle the restricted stock units in cash or stock.
The cash component of the award is accounted for as a liability. The equity component is accounted for as a stock‑based liability as the restricted stock units may be settled in cash or stock. At each reporting period, we reassess the probability of achieving the performance targets. The estimation of whether the performance targets will be achieved requires judgment, and to the extent actual results or updated estimates differ from our current estimates, the cumulative effect on current and prior periods of those changes will be recorded in the period estimates are revised.
Income Taxes
We are required to estimate our income taxes, which includes estimating our current income taxes as well as measuring the temporary differences resulting from different treatment of items for tax and accounting purposes. We currently have significant deferred assets, which are subject to periodic recoverability assessments. Realizing our deferred tax assets principally depends on our achieving projected future taxable income. We may change our judgments regarding future profitability due to future market conditions and other factors, which may result in recording a valuation allowance against those deferred tax assets.
We have various foreign subsidiaries to conduct or support our business outside the United States. We do not provide for U.S. income taxes on undistributed earnings for our foreign subsidiaries as management expects the foreign earnings will be indefinitely reinvested in such foreign jurisdictions.
55
Fiscal Periods
Our fiscal year ends on April 30. Due to our fixed year end date of April 30, our first and fourth quarters each consist of approximately 13 weeks. The second and third quarters each consist of exactly 13 weeks. Our first three quarters end on a Saturday.
Results of Operations
The following table sets forth certain historical consolidated income statement data expressed in dollars (in thousands) and as a percentage of revenue for the periods indicated. Certain amounts may not sum due to rounding.
|
|
|
Fiscal Year Ended April 30, |
|
|||||||||||||||
|
|
|
2017 |
|
|
2016 |
|
|
2015 |
|
|||||||||
|
Revenue |
|
$ |
264,873 |
|
100 |
% |
|
$ |
264,098 |
|
100 |
% |
|
$ |
259,398 |
|
100 |
% |
|
Cost of sales |
|
|
162,763 |
|
61 |
% |
|
|
151,995 |
|
58 |
% |
|
|
155,130 |
|
60 |
% |
|
Gross margin |
|
|
102,110 |
|
39 |
% |
|
|
112,103 |
|
42 |
% |
|
|
104,268 |
|
40 |
% |
|
Selling, general and administrative |
|
|
56,537 |
|
21 |
% |
|
|
60,077 |
|
23 |
% |
|
|
55,763 |
|
21 |
% |
|
Research and development |
|
|
33,042 |
|
12 |
% |
|
|
42,291 |
|
16 |
% |
|
|
46,491 |
|
18 |
% |
|
Income from operations |
|
|
12,531 |
|
5 |
% |
|
|
9,735 |
|
4 |
% |
|
|
2,014 |
|
1 |
% |
|
Interest income, net |
|
|
1,618 |
|
1 |
% |
|
|
1,032 |
|
— |
% |
|
|
882 |
|
— |
% |
|
Other income (expense), net |
|
|
60 |
|
— |
% |
|
|
(2,699) |
|
(1) |
% |
|
|
(1,003) |
|
— |
% |
|
Income before income taxes |
|
|
14,209 |
|
5 |
% |
|
|
8,068 |
|
3 |
% |
|
|
1,893 |
|
1 |
% |
|
Income tax expense (benefit) |
|
|
1,752 |
|
1 |
% |
|
|
(898) |
|
— |
% |
|
|
(1,002) |
|
— |
% |
|
Net income |
|
|
12,457 |
|
5 |
% |
|
|
8,966 |
|
3 |
% |
|
|
2,895 |
|
1 |
% |
|
Net loss attributable to noncontrolling interest |
|
|
22 |
|
— |
% |
|
|
— |
|
— |
% |
|
|
— |
|
— |
% |
|
Net income attributable to AeroVironment |
|
$ |
12,479 |
|
5 |
% |
|
$ |
8,966 |
|
3 |
% |
|
$ |
2,895 |
|
1 |
% |
The following table sets forth our revenue, costs of sales and gross margin generated by each operating segment for the periods indicated:
|
|
|
Fiscal Year Ended April 30, |
|
|||||||
|
|
|
2017 |
|
2016 |
|
2015 |
|
|||
|
|
|
(In thousands) |
|
|||||||
|
Revenue: |
|
|
|
|
|
|
|
|
|
|
|
UAS |
|
$ |
228,940 |
|
$ |
233,738 |
|
$ |
220,950 |
|
|
EES |
|
|
35,933 |
|
|
30,360 |
|
|
38,448 |
|
|
Total |
|
$ |
264,873 |
|
$ |
264,098 |
|
$ |
259,398 |
|
|
Cost of sales: |
|
|
|
|
|
|
|
|
|
|
|
UAS |
|
$ |
135,937 |
|
$ |
132,209 |
|
$ |
128,233 |
|
|
EES |
|
|
26,826 |
|
|
19,786 |
|
|
26,897 |
|
|
Total |
|
$ |
162,763 |
|
$ |
151,995 |
|
$ |
155,130 |
|
|
Gross margin: |
|
|
|
|
|
|
|
|
|
|
|
UAS |
|
$ |
93,003 |
|
$ |
101,529 |
|
$ |
92,717 |
|
|
EES |
|
|
9,107 |
|
|
10,574 |
|
|
11,551 |
|
|
Total |
|
$ |
102,110 |
|
$ |
112,103 |
|
$ |
104,268 |
|
56
Fiscal Year Ended April 30, 2017 Compared to Fiscal Year Ended April 30, 2016
Revenue. Revenue for the fiscal year ended April 30, 2017 was $264.9 million, as compared to $264.1 million for the fiscal year ended April 30, 2016, representing an increase of $0.8 million. The increase in revenue was due to an increase product deliveries of $3.9 million, partially offset by a decrease in service revenue of $3.1 million. UAS revenue decreased $4.8 million, or 2%, to $228.9 million for the fiscal year ended April 30, 2017, primarily due to a decrease in customer‑funded R&D of $9.9 million and a decrease in product deliveries of $2.4 million, partially offset by an increase in service revenue of $7.5 million. The decrease in customer‑funded R&D was primarily associated with tactical missile system variant programs. The decrease in product deliveries was primarily due to a decrease in product deliveries of small UAS, partially offset by an increase in product deliveries of tactical missile systems. The increase in service revenue was primarily due to an increase in services associated with tactical missile systems and an increase in sustainment activities in support of small UAS for our international customers. In fiscal 2017, we continued to experience expansion in small UAS product deliveries and related services to international customers and in tactical missile system product deliveries and related services to customers within the U.S. Government. EES revenue increased $5.6 million, or 18%, to $35.9 million for the fiscal year ended April 30, 2017, primarily due to an increase in product deliveries of our power cycling and test systems and passenger electric vehicle charging systems.
Cost of Sales. Cost of sales for the fiscal year ended April 30, 2017 was $162.8 million, as compared to $152.0 million for the fiscal year ended April 30, 2016, representing an increase of $10.8 million, or 7%. As a percentage of revenue, cost of sales increased from 58% to 61%. The increase in cost of sales was a result of an increase in product cost of sales of $9.5 million and an increase in service costs of sales of $1.2 million, both of which were impacted by the reserve reversal of $3.6 million for the settlement of prior year government incurred cost audits recorded in the second quarter of fiscal 2016. UAS cost of sales increased $3.7 million to $135.9 million for the fiscal year ended April 30, 2017, primarily due to an increase in service revenue, the prior year reserve reversal of $3.2 million for the settlement of prior year government incurred cost audits and an increase in sustaining engineering activities in support of our existing products, partially offset by decreases in customer-funded R&D and decreases in product deliveries. As a percentage of revenue, cost of sales for UAS increased from 57% to 59%, primarily due to the prior year reserve reversal for the settlement of prior year government incurred cost audits and an increase in sustaining engineering activities in support of our existing products, combined with the decreased product deliveries. EES cost of sales increased $7.0 million, or 36%, to $26.8 million for the fiscal year ended April 30, 2017, primarily due to an increase in product deliveries, an increase in sustaining engineering activities in support of our existing products and the prior year reserve reversal for the settlement of prior year government incurred cost audits. As a percentage of revenue, cost of sales for EES increased from 65% to 75%, primarily due the increase in sustaining engineering activities in support of our existing products and the prior year reserve reversal for the settlement of prior year government incurred cost audits.
Gross Margin. Gross margin for the fiscal year ended April 30, 2017 was $102.1 million, as compared to $112.1 million for the fiscal year ended April 30, 2016, representing a decrease of $10.0 million, or 9%. As a percentage of revenue, gross margin decreased from 42% to 39%. The decrease in gross margin was a result of a decrease in product margin of $5.7 million and a decrease in service margin of $4.3 million, both of which were impacted by the reserve reversal of $3.6 million for the settlement of prior year government incurred cost audits recorded in the second quarter of fiscal 2016. UAS gross margin decreased $8.5 million, or 8%, to $93.0 million for the fiscal year ended April 30, 2017, primarily due to decreases in customer-funded R&D revenue and product deliveries, the prior year reserve reversal of $3.2 million for the settlement of prior year government incurred cost audits and an increase in sustaining engineering activities in support of our existing products, partially offset by increases in service revenue. As a percentage of revenue, gross margin for UAS decreased from 43% to 41%, primarily due to the prior year reserve reversal for the settlement of prior year government incurred cost audits and an increase in sustaining engineering activities in support of our existing products, combined with the decreased product deliveries. EES gross margin decreased $1.5 million, or 14%, to $9.1 million for the fiscal year ended April 30, 2017, primarily due to an increase in sustaining engineering activities in support of our existing products and the prior year reserve reversal for the settlement of prior year government incurred cost audits, partially offset by the increase in product deliveries. As a percentage of revenue, EES gross margin decreased from 35% to 25%, primarily due to the increase in sustaining engineering activities in support of our existing products and the prior year reserve reversal for the settlement of prior year government incurred cost audits.
57
Selling, General and Administrative. SG&A expense for the fiscal year ended April 30, 2017 was $56.5 million, or 21% of revenue, compared to SG&A expense of $60.1 million, or 23% of revenue, for the fiscal year ended April 30, 2016. The decrease in SG&A expense was primarily due to a decrease in bid and proposal costs and a decrease in professional services expenses, partially offset by an increase in sales commission expense as a result of our increased international small UAS revenues.
Research and Development. R&D expense for the fiscal year ended April 30, 2017 was $33.0 million, or 12% of revenue, compared to R&D expense of $42.3 million, or 16% of revenue, for the fiscal year ended April 30, 2016. R&D expense decreased primarily due to decreased development activities for certain strategic initiatives.
Interest Income, net. Interest income, net for the fiscal year ended April 30, 2017 was $1.6 million, compared to $1.0 million for the fiscal year ended April 30, 2016. The increase in interest income was primarily due to an increase in the average interest rates earned on our investments portfolio.
Other Income (Expense), net. Other income, net for the fiscal year ended April 30, 2017 was $0.1 million, as compared to other expense, net of $2.7 million for the fiscal year ended April 30, 2016. The increase in other income was primarily due to the recording of an other-than-temporary impairment loss on our CybAero equity securities during the first quarter of fiscal 2016. Other income, net for the fiscal year ended April 30, 2017 also included a gain of $0.6 million related to the acquisition of a controlling interest in our Turkish Joint Venture, Altoy.
Income Taxes. Our effective income tax rate (benefit) was 12.3% for the fiscal year ended April 30, 2017, as compared to (11.1)% for the fiscal year ended April 30, 2016. The increase in the effective tax rate was primarily a result of an increase in income before taxes and a decrease in tax credits as a result of federal legislation permanently reinstating the federal research and development tax credit retroactive to January 2015 during fiscal year 2016, partially offset by a reversal of a reserve of $1.0 million for uncertain tax positions due to the settlement of prior fiscal year audits recorded in the first quarter of fiscal 2017.
Fiscal Year Ended April 30, 2016 Compared to Fiscal Year Ended April 30, 2015
Revenue. Revenue for the fiscal year ended April 30, 2016 was $264.1 million, as compared to $259.4 million for the fiscal year ended April 30, 2015, representing an increase of $4.7 million, or 2%. The increase in revenue was due to an increase in service revenue of $20.3 million, partially offset by a decrease in product deliveries of $15.6 million. UAS revenue increased $12.8 million, or 6%, to $233.7 million for the fiscal year ended April 30, 2016, primarily due to an increase in customer‑funded R&D of $16.6 million and an increase in service revenue of $4.5 million, partially offset by a decrease in product deliveries of $8.3 million. The increase in customer‑funded R&D was primarily due to tactical missile system variant programs. The increase in service revenue was primarily due to an increase in sustainment activities in small UAS. The decrease in product deliveries was primarily due to a decrease in product deliveries of Wasp and Switchblade systems, partially offset by an increase in deliveries of Puma and Raven systems. EES revenue decreased $8.1 million, or 21%, to $30.4 million for the fiscal year ended April 30, 2016, primarily due to a decrease in product deliveries of our industrial fast charge systems and passenger electric vehicle charging systems as well as a decrease in service revenue.
Cost of Sales. Cost of sales for the fiscal year ended April 30, 2016 was $152.0 million, as compared to $155.1 million for the fiscal year ended April 30, 2015, representing a decrease of $3.1 million, or 2%. Cost of sales was impacted by a government contract accounting reserve reduction of $3.6 million recorded during the year ended April 30, 2016 for the settlement and resolution of prior year incurred cost audits. As a percentage of revenue, cost of sales decreased from 60% to 58%. The decrease in cost of sales was a result of a decrease in product cost of sales of $12.8 million, partially offset by an increase in service costs of sales of $9.7 million. UAS cost of sales increased $4.0 million to $132.2 million for the fiscal year ended April 30, 2016. As a percentage of revenue, cost of sales for UAS decreased from 58% to 57%, primarily due to a favorable product mix and the government contract reserve reduction. EES cost of sales decreased $7.1 million, or 26%, to $19.8 million for the fiscal year ended April 30, 2016 primarily due to a decrease in sales volume and, to a lesser extent, the government contract reserve reduction. As a percentage of
58
revenue, cost of sales for EES decreased from 70% to 65%, primarily due to a favorable product mix and the government contract reserve reduction.
Gross Margin. Gross margin for the fiscal year ended April 30, 2016 was $112.1 million, as compared to $104.3 million for the fiscal year ended April 30, 2015, representing an increase of $7.8 million, or 8%. The increase in gross margin was due to an increase in service margin of $10.5 million, partially offset by a decrease in product margin of $2.7 million, both of which were impacted by the government contract reserve reduction. The increase in service margin was primarily due to the increase in service revenue. The decrease in product margin was primarily due to the decrease in product deliveries, partially offset by a favorable product mix and the government contract reserve reduction. As a percentage of revenue, gross margin increased from 40% to 42%. UAS gross margin increased $8.8 million, or 10%, to $101.5 million for the fiscal year ended April 30, 2016, primarily due to the increase in services revenue as well as a favorable product mix and the government contract reserve reduction. As a percentage of revenue, gross margin for UAS increased from 42% to 43%. EES gross margin decreased $1.0 million, or 8%, to $10.6 million for the fiscal year ended April 30, 2016, primarily due to a decrease in sales volume, partially offset by the government contract reserve reduction. As a percentage of revenue, EES gross margin increased from 30% to 35%, primarily due to a favorable product mix and the government contract reserve reduction.
Selling, General and Administrative. SG&A expense for the fiscal year ended April 30, 2016 was $60.1 million, or 23% of revenue, compared to SG&A expense of $55.8 million, or 21% of revenue, for the fiscal year ended April 30, 2015. The increase in SG&A expense was primarily due to higher bid and proposal costs, an increase in sales commission expense as a result of our increased international revenues, and an increase in severance related charges as well as other increases which were not individually significant.
Research and Development. R&D expense for the fiscal year ended April 30, 2016 was $42.3 million, or 16% of revenue, compared to R&D expense of $46.5 million, or 18% of revenue, for the fiscal year ended April 30, 2015. R&D expense decreased primarily due to decreased development activities for certain strategic initiatives.
Interest Income, net. Interest income, net for the fiscal year ended April 30, 2016 was $1.0 million, compared to $0.9 million for the fiscal year ended April 30, 2015.
Other Expense, net. Other expense, net for the fiscal year ended April 30, 2016 was $2.7 million, as compared to other expense, net of $1.0 million for the fiscal year ended April 30, 2015. The increase is primarily due to the recording of an other-than-temporary impairment loss on our CybAero equity securities during the first quarter of fiscal 2016.
Income Taxes. Our effective income tax benefit rate was (11.1)% for the fiscal year ended April 30, 2016, as compared to an effective income tax benefit rate of (52.9)% for the fiscal year ended April 30, 2015. The variance in the effective income tax rates was primarily due to higher pre‑tax income and an increase in federal R&D tax credits primarily as a result of federal legislation reinstating the federal research and development tax credit.
Liquidity and Capital Resources
We currently have no material cash commitments, except for normal recurring trade payables, accrued expenses and ongoing research and development costs, all of which we anticipate funding through our existing working capital and funds provided by operating activities. The majority of our purchase obligations are pursuant to funded contractual arrangements with our customers. We believe that our existing cash, cash equivalents, cash provided by operating activities and other financing sources will be sufficient to meet our anticipated working capital, capital expenditure and debt service requirements, if any, during the next twelve months. There can be no assurance, however, that our business will continue to generate cash flow at current levels. If we are unable to generate sufficient cash flow from operations, then we may be required to sell assets, reduce capital expenditures or obtain additional financing. We anticipate that existing sources of liquidity and cash flows from operations will be sufficient to satisfy our cash needs for the foreseeable future.
59
Our primary liquidity needs are for financing working capital, investing in capital expenditures, supporting product development efforts, introducing new products and enhancing existing products, and marketing acceptance and adoption of our products and services. Our future capital requirements, to a certain extent, are also subject to general conditions in or affecting the defense and electric vehicle industries and are subject to general economic, political, financial, competitive, legislative and regulatory factors that are beyond our control. Moreover, to the extent that existing cash, cash equivalents, cash from operations, and cash from short‑term borrowing are insufficient to fund our future activities, we may need to raise additional funds through public or private equity or debt financing. In addition, we may also need to seek additional equity funding or debt financing if we become a party to any agreement or letter of intent for potential investments in, or acquisitions of, businesses, services or technologies.
Our working capital requirements vary by contract type. On cost‑plus‑fee programs, we typically bill our incurred costs and fees monthly as work progresses, and therefore working capital investment is minimal. On fixed‑price contracts, we typically are paid as we deliver products, and working capital is needed to fund labor and expenses incurred during the lead time from contract award until contract deliveries begin.
Cash Flows
The following table provides our cash flow data as of:
|
|
|
Fiscal Year Ended April 30, |
|
|||||||
|
|
|
2017 |
|
2016 |
|
2015 |
|
|||
|
|
|
|
|
|
|
|
|
|
|
|
|
|
|
(In thousands) |
|
|||||||
|
Net cash (used in) provided by operating activities |
|
$ |
(10,499) |
|
$ |
551 |
|
$ |
39,413 |
|
|
Net cash used in investing activities |
|
$ |
(37,354) |
|
$ |
(16,578) |
|
$ |
(23,820) |
|
|
Net cash provided by (used in) financing activities |
|
$ |
3,470 |
|
$ |
(3,096) |
|
$ |
848 |
|
Cash (Used in) Provided by Operating Activities. Net cash used in operating activities for the fiscal year ended April 30, 2017 increased by $11.0 million to $10.5 million, compared to net cash provided by operating activities of $0.6 million for the fiscal year ended April 30, 2016. This decrease in net cash provided by operating activities was primarily due to an increase in the use of cash as a result of changes in operating assets and liabilities of $13.5 million largely resulting from increases in inventory primarily due to year over year timing differences in purchases to support anticipated product deliveries, partially offset by an increase in net income of $3.5 million.
Net cash provided by operating activities for the fiscal year ended April 30, 2016 decreased by $38.8 million to $0.6 million, compared to net cash provided by operating activities of $39.4 million for the fiscal year ended April 30, 2015. This decrease in net cash provided by operating activities was primarily due to an increase in the use of cash as a result of changes in operating assets and liabilities of $40.9 million largely resulting from increases in accounts receivable due to the year over year timing of revenue, a decrease in the net loss on disposal of fixed assets of $3.7 million and a decrease in depreciation expense of $2.3 million, partially offset by an increase in net income of $6.1 million and a non-cash other than temporary impairment charge on the CybAero available-for-sale equity securities of $2.2 million.
Cash Used in Investing Activities. Net cash used in investing activities increased by $20.8 million to $37.4 million for the fiscal year ended April 30, 2017, compared to net cash used in investing activities of $16.6 million for the fiscal year ended April 30, 2016. The increase in net cash used in investing activities was primarily due to higher net purchases of held‑to‑maturity investments of $16.9 million and an increase in capital expenditures of $3.0 million. During the fiscal years ended April 30, 2017, 2016 and 2015, we used cash to purchase property and equipment totaling $9.9 million, $6.8 million and $5.3 million, respectively.
Net cash used in investing activities decreased by $7.2 million to $16.6 million for the fiscal year ended April 30, 2016, compared to net cash used in investing activities of $23.8 million for the fiscal year ended April 30, 2015. The decrease in net cash used in investing activities was primarily due to lower net purchases of held‑to‑maturity
60
investments of $17.6 million, partially offset by a decrease in sales of available‑for‑sale investments of $9.1 million and an increase in capital expenditures of $1.6 million. During the fiscal years ended April 30, 2016, 2015 and 2014, we used cash to purchase property and equipment totaling $6.8 million, $5.3 million and $7.1 million, respectively.
Cash Provided by (Used in) Financing Activities. Net cash provided by financing activities increased by $6.6 million to $3.5 million for the fiscal year ended April 30, 2017, compared to net cash used in financing activities of $3.1 million for the fiscal year ended April 30, 2016. The increase was primarily due to a decrease in the purchase and retirement of common stock of $3.8 million and an increase in cash provided from the exercise of employee stock options of $2.7 million.
Net cash used in financing activities increased by $3.9 million to $3.1 million for the fiscal year ended April 30, 2016, compared to net cash provided by financing activities of $0.8 million for the fiscal year ended April 30, 2015. The increase was primarily due to the purchase and retirement of common stock of $3.8 million during the fiscal year ended April 30, 2016.
Contractual Obligations
The following table describes our commitments to settle contractual obligations as of April 30, 2017:
|
|
|
Payments Due By Period |
|
|||||||||||||
|
|
|
|
|
|
Less Than |
|
|
|
|
|
|
|
More Than |
|
||
|
|
|
Total |
|
1 Year |
|
1 to 3 Years |
|
3 to 5 Years |
|
5 Years |
|
|||||
|
|
|
(In thousands) |
|
|||||||||||||
|
Operating lease obligations |
|
$ |
15,747 |
|
$ |
3,492 |
|
$ |
5,934 |
|
$ |
3,690 |
|
$ |
2,631 |
|
|
Capital lease obligations |
|
|
449 |
|
|
288 |
|
|
161 |
|
|
— |
|
|
— |
|
|
Purchase obligations(1) |
|
|
35,607 |
|
|
35,607 |
|
|
— |
|
|
— |
|
|
— |
|
|
Total |
|
$ |
51,803 |
|
$ |
39,387 |
|
$ |
6,095 |
|
$ |
3,690 |
|
$ |
2,631 |
|
|
(1) |
Consists of all cancelable and non‑cancelable purchase orders as of April 30, 2017. |
Not included in the table above are future rental payments associated with a lease amendment executed on June 13, 2017 to amend and extend its existing lease for one of our administrative properties. The amendment extends the term of the lease until June 30, 2022 and provides a tenant improvement allowance of up to $420,332. Beginning July 1, 2017, base monthly rent under the Second Amendment will be $65,200, which amount shall increase by 2.5%, compounded annually, commencing July 1, 2018. In addition, the amendment provides two 5-year options to extend the term of lease at the end of the then-current term.
Off‑Balance Sheet Arrangements
As of April 30, 2017, we had no off‑balance sheet arrangements as defined in Item 303(a)(4) of the SEC’s Regulation S‑K.
Inflation
Our operations have not been, and we do not expect them to be, materially affected by inflation. Historically, we have been successful in adjusting prices to our customers to reflect changes in our material and labor costs.
Recently Adopted Accounting Standards
In November 2015, the Financial Accounting Standards Board (“FASB”) issued Accounting Standard Update (“ASU”) No. 2015-17, Balance Sheet Classification of Deferred Taxes, which requires entities to present deferred tax assets and liabilities as noncurrent in a classified balance sheet. This guidance simplifies the current guidance, which
61
requires entities to separately present deferred tax assets and liabilities as current and non-current in a classified balance sheet. ASU 2015-17 is effective for fiscal years beginning after December 15, 2016, and interim periods within those years, with early adoption permitted. The ASU may be applied either prospectively to all deferred tax assets and liabilities or retrospectively to all periods presented. We adopted this pronouncement beginning May 1, 2016 and applied this pronouncement retrospectively. In connection with adopting the pronouncement beginning May 1, 2016, we reclassified $5,432,000 from current deferred income tax assets in the consolidated balance sheet as of April 30, 2016 to non-current deferred income tax liabilities.
In March 2016, the FASB issued ASU No. 2016-09, Compensation—Stock Compensation (Topic 718), Improvements to Employee Share-Based Payment Accounting. The new standard simplifies the accounting for employee share-based payment transactions, including the accounting for income taxes, forfeitures, and statutory withholding requirements, as well as the related classification in the statement of cash flows. The new standard is effective for annual reporting periods beginning after December 15, 2016, and interim periods within those years, with early adoption permitted. The standard requires an entity to recognize all excess tax benefits and tax deficiencies as income tax benefit or expense in the income statement as discrete items in the reporting period in which they occur, and such tax benefits and tax deficiencies are not included in the estimate of an entity’s annual effective tax rate, applied on a prospective basis. Further, the standard eliminates the requirement to defer the recognition of excess tax benefits until the benefit is realized through a reduction to taxes payable. All excess tax benefits previously unrecognized, along with any valuation allowance, are to be recognized on a modified retrospective basis as a cumulative adjustment to retained earnings as of the date of adoption. Under the ASU, an entity that applies the treasury stock method in calculating diluted earnings per share is required to exclude excess tax benefits and deficiencies from the calculation of assumed proceeds since such amounts are recognized in the income statement. Excess tax benefits are also classified as operating activities in the same manner as other cash flows related to income taxes on the statement of cash flows, as such excess tax benefits no longer represent financing activities since they are recognized in the income statement, and are to be applied prospectively or retrospectively to all periods presented. We adopted the pronouncement beginning May 1, 2016. In connection with adopting the pronouncement beginning May 1, 2016, we recorded a cumulative increase of $265,000 in retained earnings with a corresponding increase in deferred tax assets in the consolidated balance sheet as of April 30, 2016 related to the prior years' unrecognized excess tax benefits. Excess tax benefits related to exercised options and vested restricted stock awards during the fiscal year ended April 30, 2017 have been recognized in the current period’s income statement. We also excluded the excess tax benefits from the calculation of diluted earnings per share for the fiscal year ended April 30, 2017. We applied the cash flow presentation section of the guidance on a prospective basis, and the prior period statement of cash flows was not adjusted.
New Accounting Standards
In January 2017, the FASB issued ASU 2017-01, Business Combinations – Clarifying the definition of a business (Topic 805). This ASU clarifies the definition of a business with the objective of providing a more robust framework to evaluate whether transactions should be accounted for as acquisitions (or disposals) of assets or businesses. The guidance will be effective for fiscal years beginning after December 15, 2017, including interim periods within that fiscal year, with early adoption permitted. The amendments are to be applied prospectively to business combinations that occur after the effective date.
In August 2016, the FASB issued ASU 2016-15, Statement of Cash Flows - Classification of Certain Cash Receipts and Cash Payments (Topic 230). This ASU adds and clarifies guidance on the classification of certain cash receipts and payments in the statement of cash flows. The guidance is effective for fiscal years beginning after December 15, 2017 and interim periods therein, with early adoption permitted. We are evaluating the potential impact of this adoption on our consolidated financial statements.
In February 2016, the FASB issued ASU No. 2016-02, Leases (Topic 842). This ASU requires the lessee to recognize the assets and liabilities for the rights and obligations created by leases with terms of 12 months or more. The guidance is effective for fiscal years beginning after December 15, 2018 and interim periods therein, with early adoption permitted. We are evaluating the potential impact of this adoption on our consolidated financial statements. We currently do not hold a large number of leases classified as operating leases under the existing lease standard, with the only significant leases being our various property leases.
62
In July 2015, the FASB issued ASU No. 2015-11, Inventory (Topic 330): Simplifying the Measurement of Inventory. This ASU does not apply to inventory that is measured using last-in, first-out (LIFO) or the retail inventory method. The amendments apply to all other inventory, which includes inventory that is measured using first-in, first-out (FIFO) or average cost. This ASU eliminates from U.S. GAAP the requirement to measure inventory at the lower of cost or market. Market under the previous requirement could be replacement cost, net realizable value, or net realizable value less a normal profit margin. Entities within the scope of this update will now be required to measure inventory at the lower of cost and net realizable value. Net realizable value is the estimated selling price in the ordinary course of business, less reasonably predictable costs of completion, disposal, and transportation. Subsequent measurement is unchanged for inventory using LIFO or the retail inventory method. The amendments in this update are effective for fiscal years beginning after December 15, 2016, with early adoption permitted. Upon adoption during fiscal year 2018, we do not anticipate a material impact.
In May 2014, the FASB issued ASU No. 2014-09, Revenue from Contracts with Customers (Topic 606). The new standard was originally effective for reporting periods beginning after December 15, 2016 and early adoption was not permitted. In August 2015, the FASB issued ASU No. 2015-14, Revenue from Contracts with Customers (Topic 640)-Deferral of the Effective Date. This update approved a one year delay of the effective date to reporting periods beginning after December 15, 2017, while permitting companies to voluntarily adopt the new standard as of the original effective date. Since the issuance of ASU 2014-09, the FASB has issued several amendments to provide additional supplemental guidance on certain aspects of the original pronouncement. The core principle of ASU 2014-09 is to recognize revenue upon the transfer of goods or services to customers at an amount that reflects the consideration expected to be received. In adopting the guidance, companies are permitted to select between two transition methods: (1) a full retrospective transition method with the application of the new guidance to each prior reporting period presented, or (2) a retrospective transition method that recognizes the cumulative effect on prior periods at the date of adoption together with additional footnote disclosures. We are continuing to assess the potential impact of this guidance, including the impact on those areas currently subject to industry-specific guidance such as government contract accounting. As part of our assessment, we are reviewing representative samples of customer contracts to determine the impact on revenue recognition under the new guidance. At this time, we anticipate adopting the guidance under the retrospective transition method.
Item 7A. Quantitative and Qualitative Disclosures About Market Risk.
Interest Rate Risk
It is our policy not to enter into interest rate derivative financial instruments. We do not currently have any significant interest rate exposure.
Foreign Currency Exchange Rate Risk
Since a significant part of our sales and expenses are denominated in U.S. dollars, we have not experienced significant foreign exchange gains or losses to date. We occasionally engage in forward contracts in foreign currencies to limit our exposure on non‑U.S. dollar transactions.
63
Item 8. Financial Statements and Supplementary Data.
AeroVironment, Inc.
Audited Consolidated Financial Statements
Index to Consolidated Financial Statements and Supplementary Data
All other schedules are omitted because they are not applicable, not required or the information required is included in the Consolidated Financial Statements, including the notes thereto.
64
REPORT OF INDEPENDENT REGISTERED PUBLIC ACCOUNTING FIRM
The Board of Directors and Stockholders of AeroVironment, Inc. and Subsidiaries
We have audited the accompanying consolidated balance sheets of AeroVironment, Inc. and subsidiaries as of April 30, 2017 and 2016, and the related consolidated statements of income, comprehensive income, stockholders' equity, and cash flows for each of the three years in the period ended April 30, 2017. Our audits also included the financial statement schedule listed in the index at Item 15(a). These consolidated financial statements and schedule are the responsibility of the Company's management. Our responsibility is to express an opinion on these financial statements and schedule based on our audits.
We conducted our audits in accordance with the standards of the Public Company Accounting Oversight Board (United States). Those standards require that we plan and perform the audit to obtain reasonable assurance about whether the financial statements are free of material misstatement. An audit includes examining, on a test basis, evidence supporting the amounts and disclosures in the financial statements. An audit also includes assessing the accounting principles used and significant estimates made by management, as well as evaluating the overall financial statement presentation. We believe that our audits provide a reasonable basis for our opinion.
In our opinion, the financial statements referred to above present fairly, in all material respects, the consolidated financial position of AeroVironment, Inc. and subsidiaries at April 30, 2017 and 2016, and the consolidated results of their operations and their cash flows for each of the three years in the period ended April 30, 2017, in conformity with U.S. generally accepted accounting principles. Also, in our opinion, the related financial statement schedule, when considered in relation to the basic financial statements taken as a whole, presents fairly in all material respects the information set forth herein.
We also have audited, in accordance with the standards of the Public Company Accounting Oversight Board (United States), AeroVironment, Inc. and subsidiaries’ internal control over financial reporting as of April 30, 2017, based on criteria established in Internal Control-Integrated Framework issued by the Committee of Sponsoring Organizations of the Treadway Commission (2013 framework) and our report dated June 27, 2017 expressed an unqualified opinion thereon.
|
|
|
/s/ Ernst & Young LLP |
Los Angeles, California
June 27, 2017
65
AEROVIRONMENT, INC.
(In thousands except share data)
|
|
|
April 30, |
|
||||
|
|
|
2017 |
|
2016 |
|
||
|
|
|
|
|
|
|
|
|
|
Assets |
|
|
|
|
|
|
|
|
Current assets: |
|
|
|
|
|
|
|
|
Cash and cash equivalents |
|
$ |
79,904 |
|
$ |
124,287 |
|
|
Short-term investments |
|
|
119,971 |
|
|
103,404 |
|
|
Accounts receivable, net of allowance for doubtful accounts of $291 at April 30, 2017 and $262 at April 30, 2016 |
|
|
74,361 |
|
|
56,045 |
|
|
Unbilled receivables and retentions |
|
|
14,120 |
|
|
18,899 |
|
|
Inventories, net |
|
|
60,076 |
|
|
37,486 |
|
|
Prepaid expenses and other current assets |
|
|
5,653 |
|
|
4,150 |
|
|
Total current assets |
|
|
354,085 |
|
|
344,271 |
|
|
Long-term investments |
|
|
42,096 |
|
|
33,859 |
|
|
Property and equipment, net |
|
|
19,220 |
|
|
16,762 |
|
|
Deferred income taxes |
|
|
15,089 |
|
|
15,016 |
|
|
Other assets |
|
|
2,010 |
|
|
750 |
|
|
Total assets |
|
$ |
432,500 |
|
$ |
410,658 |
|
|
Liabilities and stockholders’ equity |
|
|
|
|
|
|
|
|
Current liabilities: |
|
|
|
|
|
|
|
|
Accounts payable |
|
$ |
20,283 |
|
$ |
17,712 |
|
|
Wages and related accruals |
|
|
12,966 |
|
|
13,973 |
|
|
Income taxes payable |
|
|
1,418 |
|
|
943 |
|
|
Customer advances |
|
|
3,317 |
|
|
2,544 |
|
|
Other current liabilities |
|
|
10,079 |
|
|
11,173 |
|
|
Total current liabilities |
|
|
48,063 |
|
|
46,345 |
|
|
Deferred rent |
|
|
1,719 |
|
|
1,714 |
|
|
Capital lease obligations - net of current portion |
|
|
161 |
|
|
449 |
|
|
Other non-current liabilities |
|
|
184 |
|
|
184 |
|
|
Deferred tax liability |
|
|
116 |
|
|
— |
|
|
Liability for uncertain tax positions |
|
|
64 |
|
|
441 |
|
|
Commitments and contingencies |
|
|
|
|
|
|
|
|
Stockholders’ equity: |
|
|
|
|
|
|
|
|
Preferred stock, $0.0001 par value: |
|
|
|
|
|
|
|
|
Authorized shares—10,000,000; none issued or outstanding at April 30, 2017 and April 30, 2016 |
|
|
— |
|
|
— |
|
|
Common stock, $0.0001 par value: |
|
|
|
|
|
|
|
|
Authorized shares—100,000,000 |
|
|
|
|
|
|
|
|
Issued and outstanding shares—23,630,419 shares at April 30, 2017 and 23,359,925 at April 30, 2016 |
|
|
2 |
|
|
2 |
|
|
Additional paid-in capital |
|
|
162,150 |
|
|
154,274 |
|
|
Accumulated other comprehensive loss |
|
|
(127) |
|
|
(201) |
|
|
Retained earnings |
|
|
219,929 |
|
|
207,450 |
|
|
Total AeroVironment stockholders' equity |
|
|
381,954 |
|
|
361,525 |
|
|
Noncontrolling interests |
|
|
239 |
|
|
— |
|
|
Total equity |
|
|
382,193 |
|
|
361,525 |
|
|
Total liabilities and stockholders’ equity |
|
$ |
432,500 |
|
$ |
410,658 |
|
See accompanying notes to consolidated financial statements.
66
AEROVIRONMENT, INC.
CONSOLIDATED STATEMENTS OF INCOME
(In thousands except share and per share data)
|
|
|
Year Ended April 30, |
|
|||||||
|
|
|
2017 |
|
2016 |
|
2015 |
|
|||
|
|
|
|
|
|
|
|
|
|
|
|
|
Revenue: |
|
|
|
|
|
|
|
|
|
|
|
Product sales |
|
$ |
193,338 |
|
$ |
189,476 |
|
$ |
205,027 |
|
|
Contract services |
|
|
71,535 |
|
|
74,622 |
|
|
54,371 |
|
|
|
|
|
264,873 |
|
|
264,098 |
|
|
259,398 |
|
|
Cost of sales: |
|
|
|
|
|
|
|
|
|
|
|
Product sales |
|
|
115,513 |
|
|
105,987 |
|
|
118,834 |
|
|
Contract services |
|
|
47,250 |
|
|
46,008 |
|
|
36,296 |
|
|
|
|
|
162,763 |
|
|
151,995 |
|
|
155,130 |
|
|
Gross margin: |
|
|
|
|
|
|
|
|
|
|
|
Product sales |
|
|
77,825 |
|
|
83,489 |
|
|
86,193 |
|
|
Contract services |
|
|
24,285 |
|
|
28,614 |
|
|
18,075 |
|
|
|
|
|
102,110 |
|
|
112,103 |
|
|
104,268 |
|
|
Selling, general and administrative |
|
|
56,537 |
|
|
60,077 |
|
|
55,763 |
|
|
Research and development |
|
|
33,042 |
|
|
42,291 |
|
|
46,491 |
|
|
Income from operations |
|
|
12,531 |
|
|
9,735 |
|
|
2,014 |
|
|
Other income (expense): |
|
|
|
|
|
|
|
|
|
|
|
Interest income, net |
|
|
1,618 |
|
|
1,032 |
|
|
882 |
|
|
Other income (expense), net |
|
|
60 |
|
|
(2,699) |
|
|
(1,003) |
|
|
Income before income taxes |
|
|
14,209 |
|
|
8,068 |
|
|
1,893 |
|
|
Provision (benefit) for income taxes |
|
|
1,752 |
|
|
(898) |
|
|
(1,002) |
|
|
Net income |
|
|
12,457 |
|
|
8,966 |
|
|
2,895 |
|
|
Net loss attributable to noncontrolling interest |
|
|
22 |
|
|
— |
|
|
— |
|
|
Net income attributable to AeroVironment |
|
$ |
12,479 |
|
$ |
8,966 |
|
$ |
2,895 |
|
|
Earnings per share attributable to AeroVironment: |
|
|
|
|
|
|
|
|
|
|
|
Basic |
|
$ |
0.54 |
|
$ |
0.39 |
|
$ |
0.13 |
|
|
Diluted |
|
$ |
0.54 |
|
$ |
0.39 |
|
$ |
0.13 |
|
|
Weighted average shares outstanding: |
|
|
|
|
|
|
|
|
|
|
|
Basic |
|
|
23,059,045 |
|
|
22,936,413 |
|
|
22,868,733 |
|
|
Diluted |
|
|
23,307,738 |
|
|
23,153,493 |
|
|
23,145,997 |
|
See accompanying notes to consolidated financial statements.
67
AEROVIRONMENT, INC.
CONSOLIDATED STATEMENTS OF COMPREHENSIVE INCOME
(In thousands)
|
|
|
Year Ended April 30, |
|
|||||||
|
|
|
2017 |
|
2016 |
|
2015 |
|
|||
|
|
|
|
|
|
|
|
|
|
|
|
|
Net income |
|
$ |
12,457 |
|
$ |
8,966 |
|
$ |
2,895 |
|
|
Other comprehensive (loss) income: |
|
|
|
|
|
|
|
|
|
|
|
Unrealized gain (loss) on investments, net of deferred tax expense (benefit) of $43, $18 and $(730) for the fiscal years ended April 30, 2017, 2016 and 2015 respectively |
|
|
74 |
|
|
27 |
|
|
(1,095) |
|
|
Total comprehensive income |
|
|
12,531 |
|
|
8,993 |
|
|
1,800 |
|
|
Net loss attributable to noncontrolling interest |
|
|
22 |
|
|
— |
|
|
— |
|
|
Comprehensive income attributable to AeroVironment |
|
$ |
12,553 |
|
$ |
8,993 |
|
$ |
1,800 |
|
See accompanying notes to consolidated financial statements.
68
AEROVIRONMENT, INC.
CONSOLIDATED STATEMENTS OF STOCKHOLDERS’ EQUITY
(In thousands except share data)
|
|
|
|
|
|
|
|
|
|
|
|
|
|
Accumulated |
|
|
|
|
|
|
|
|
|
|
|
|
|
|
|
|
|
|
|
Additional |
|
|
|
|
Other |
|
Total |
|
Non- |
|
|
|
|
||||
|
|
|
Common Stock |
|
Paid-In |
|
Retained |
|
Comprehensive |
|
AeroVironment |
|
Controlling |
|
|
|
|
||||||||
|
|
|
Shares |
|
Amount |
|
Capital |
|
Earnings |
|
Loss |
|
Equity |
|
Interest |
|
Total |
|
|||||||
|
Balance at April 30, 2014 |
|
23,176,576 |
|
|
2 |
|
|
143,648 |
|
|
199,080 |
|
|
(263) |
|
|
342,467 |
|
|
— |
|
|
342,467 |
|
|
Net income |
|
— |
|
|
— |
|
|
— |
|
|
2,895 |
|
|
— |
|
|
2,895 |
|
|
— |
|
|
2,895 |
|
|
Unrealized loss on investments |
|
— |
|
|
— |
|
|
— |
|
|
— |
|
|
(1,095) |
|
|
(1,095) |
|
|
— |
|
|
(1,095) |
|
|
Stock options exercised |
|
35,018 |
|
|
— |
|
|
722 |
|
|
— |
|
|
— |
|
|
722 |
|
|
— |
|
|
722 |
|
|
Restricted stock awards |
|
160,180 |
|
|
— |
|
|
— |
|
|
— |
|
|
— |
|
|
— |
|
|
— |
|
|
— |
|
|
Restricted stock awards forfeited |
|
(56,004) |
|
|
— |
|
|
— |
|
|
— |
|
|
— |
|
|
— |
|
|
— |
|
|
— |
|
|
Tax withholding payment related to net share settlement of equity awards |
|
(1,130) |
|
|
— |
|
|
(36) |
|
|
— |
|
|
— |
|
|
(36) |
|
|
— |
|
|
(36) |
|
|
Tax benefit from stock-based compensation |
|
— |
|
|
— |
|
|
191 |
|
|
— |
|
|
— |
|
|
191 |
|
|
— |
|
|
191 |
|
|
Stock-based compensation |
|
— |
|
|
— |
|
|
3,768 |
|
|
— |
|
|
— |
|
|
3,768 |
|
|
— |
|
|
3,768 |
|
|
Balance at April 30, 2015 |
|
23,314,640 |
|
|
2 |
|
|
148,293 |
|
|
201,975 |
|
|
(1,358) |
|
|
348,912 |
|
|
— |
|
|
348,912 |
|
|
Net income |
|
— |
|
|
— |
|
|
— |
|
|
8,966 |
|
|
— |
|
|
8,966 |
|
|
— |
|
|
8,966 |
|
|
Unrealized gain on investments |
|
— |
|
|
— |
|
|
— |
|
|
— |
|
|
27 |
|
|
27 |
|
|
— |
|
|
27 |
|
|
Reclassifications out of accumulated other comprehensive loss |
|
— |
|
|
— |
|
|
— |
|
|
— |
|
|
1,130 |
|
|
1,130 |
|
|
— |
|
|
1,130 |
|
|
Stock options exercised |
|
84,881 |
|
|
— |
|
|
1,122 |
|
|
— |
|
|
— |
|
|
1,122 |
|
|
— |
|
|
1,122 |
|
|
Restricted stock awards |
|
191,548 |
|
|
— |
|
|
— |
|
|
— |
|
|
— |
|
|
— |
|
|
— |
|
|
— |
|
|
Restricted stock awards forfeited |
|
(46,753) |
|
|
— |
|
|
— |
|
|
— |
|
|
— |
|
|
— |
|
|
— |
|
|
— |
|
|
Tax withholding payment related to net share settlement of equity awards |
|
(1,130) |
|
|
— |
|
|
(29) |
|
|
— |
|
|
— |
|
|
(29) |
|
|
— |
|
|
(29) |
|
|
Reclassification from share-based liability compensation to equity |
|
— |
|
|
— |
|
|
228 |
|
|
— |
|
|
— |
|
|
228 |
|
|
— |
|
|
228 |
|
|
Tax benefit from stock-based compensation |
|
— |
|
|
— |
|
|
98 |
|
|
— |
|
|
— |
|
|
98 |
|
|
— |
|
|
98 |
|
|
Purchases of common stock for retirement |
|
(183,261) |
|
|
— |
|
|
— |
|
|
(3,756) |
|
|
— |
|
|
(3,756) |
|
|
— |
|
|
(3,756) |
|
|
Stock-based compensation |
|
— |
|
|
— |
|
|
4,562 |
|
|
— |
|
|
— |
|
|
4,562 |
|
|
— |
|
|
4,562 |
|
|
Balance at April 30, 2016 |
|
23,359,925 |
|
|
2 |
|
|
154,274 |
|
|
207,185 |
|
|
(201) |
|
|
361,260 |
|
|
— |
|
|
361,260 |
|
|
Adoption of ASU 2016-09 |
|
— |
|
|
— |
|
|
— |
|
|
265 |
|
|
— |
|
|
265 |
|
|
— |
|
|
265 |
|
|
Net income (loss) |
|
— |
|
|
— |
|
|
— |
|
|
12,479 |
|
|
— |
|
|
12,479 |
|
|
(22) |
|
|
12,457 |
|
|
Unrealized gain on investments |
|
— |
|
|
— |
|
|
— |
|
|
— |
|
|
74 |
|
|
74 |
|
|
— |
|
|
74 |
|
|
Stock options exercised |
|
204,130 |
|
|
— |
|
|
3,865 |
|
|
— |
|
|
— |
|
|
3,865 |
|
|
— |
|
|
3,865 |
|
|
Restricted stock awards |
|
126,557 |
|
|
— |
|
|
— |
|
|
— |
|
|
— |
|
|
— |
|
|
— |
|
|
— |
|
|
Restricted stock awards forfeited |
|
(60,017) |
|
|
— |
|
|
— |
|
|
— |
|
|
— |
|
|
— |
|
|
— |
|
|
— |
|
|
Tax withholding payment related to net share settlement of equity awards |
|
(176) |
|
|
— |
|
|
(5) |
|
|
— |
|
|
— |
|
|
(5) |
|
|
— |
|
|
(5) |
|
|
Reclassification from share-based liability compensation to equity |
|
— |
|
|
— |
|
|
307 |
|
|
— |
|
|
— |
|
|
307 |
|
|
— |
|
|
307 |
|
|
Business acquisition |
|
— |
|
|
— |
|
|
— |
|
|
— |
|
|
— |
|
|
— |
|
|
261 |
|
|
261 |
|
|
Stock based compensation |
|
— |
|
|
— |
|
|
3,709 |
|
|
— |
|
|
— |
|
|
3,709 |
|
|
— |
|
|
3,709 |
|
|
Balance at April 30, 2017 |
|
23,630,419 |
|
$ |
2 |
|
$ |
162,150 |
|
$ |
219,929 |
|
$ |
(127) |
|
$ |
381,954 |
|
$ |
239 |
|
$ |
382,193 |
|
See accompanying notes to consolidated financial statements.
69
AEROVIRONMENT, INC.
CONSOLIDATED STATEMENTS OF CASH FLOWS
(In thousands)
|
|
|
Year Ended April 30, |
|
|||||||
|
|
|
2017 |
|
2016 |
|
2015 |
|
|||
|
|
|
|
|
|
|
|
|
|
||
|
Operating activities |
|
|
|
|
|
|
|
|
||
|
Net income |
|
$ |
12,457 |
|
$ |
8,966 |
|
$ |
2,895 |
|
|
Adjustments to reconcile net income to cash used in operating activities: |
|
|
|
|
|
|
|
|
|
|
|
Depreciation and amortization |
|
|
7,054 |
|
|
6,074 |
|
|
8,366 |
|
|
Loss from equity method investments |
|
|
119 |
|
|
138 |
|
|
240 |
|
|
Impairment of available-for-sale securities |
|
|
— |
|
|
2,186 |
|
|
— |
|
|
Impairment of long-lived assets |
|
|
46 |
|
|
— |
|
|
438 |
|
|
Provision for doubtful accounts |
|
|
56 |
|
|
(178) |
|
|
(106) |
|
|
Losses on foreign currency transactions |
|
|
284 |
|
|
63 |
|
|
580 |
|
|
Loss on sale of equity securities |
|
|
— |
|
|
219 |
|
|
209 |
|
|
Deferred income taxes |
|
|
(52) |
|
|
(2,912) |
|
|
(3,382) |
|
|
Gain on business acquisition |
|
|
(584) |
|
|
— |
|
|
— |
|
|
Change in fair value of conversion feature of convertible bonds |
|
|
— |
|
|
— |
|
|
(73) |
|
|
Stock-based compensation |
|
|
3,709 |
|
|
4,562 |
|
|
3,768 |
|
|
Tax benefit from exercise of stock options |
|
|
— |
|
|
161 |
|
|
52 |
|
|
Excess tax benefit from stock-based compensation |
|
|
— |
|
|
(39) |
|
|
(162) |
|
|
Loss (gain) on disposition of property and equipment |
|
|
37 |
|
|
(22) |
|
|
3,661 |
|
|
Amortization of held-to-maturity investments |
|
|
2,382 |
|
|
3,875 |
|
|
4,532 |
|
|
Changes in operating assets and liabilities: |
|
|
|
|
|
|
|
|
|
|
|
Accounts receivable |
|
|
(18,627) |
|
|
(22,260) |
|
|
(1,762) |
|
|
Unbilled receivables and retentions |
|
|
4,779 |
|
|
(1,543) |
|
|
(6,427) |
|
|
Inventories |
|
|
(22,590) |
|
|
1,928 |
|
|
11,285 |
|
|
Income tax receivable |
|
|
— |
|
|
— |
|
|
6,584 |
|
|
Prepaid expenses and other assets |
|
|
(1,466) |
|
|
517 |
|
|
(339) |
|
|
Accounts payable |
|
|
2,843 |
|
|
(2,705) |
|
|
5,337 |
|
|
Other liabilities |
|
|
(946) |
|
|
1,521 |
|
|
3,717 |
|
|
Net cash (used in) provided by operating activities |
|
|
(10,499) |
|
|
551 |
|
|
39,413 |
|
|
Investing activities |
|
|
|
|
|
|
|
|
|
|
|
Acquisition of property and equipment |
|
|
(9,862) |
|
|
(6,829) |
|
|
(5,279) |
|
|
Equity method investment |
|
|
— |
|
|
(295) |
|
|
(395) |
|
|
Business acquisition, net of cash acquired |
|
|
(430) |
|
|
— |
|
|
— |
|
|
Redemptions of held-to-maturity investments |
|
|
121,522 |
|
|
84,433 |
|
|
69,387 |
|
|
Purchases of held-to-maturity investments |
|
|
(148,991) |
|
|
(94,954) |
|
|
(97,464) |
|
|
Acquisition of intangible assets |
|
|
— |
|
|
— |
|
|
(150) |
|
|
Proceeds from the sale of property and equipment |
|
|
7 |
|
|
80 |
|
|
— |
|
|
Sales and redemptions of available-for-sale investments |
|
|
400 |
|
|
987 |
|
|
10,081 |
|
|
Net cash used in investing activities |
|
|
(37,354) |
|
|
(16,578) |
|
|
(23,820) |
|
|
Financing activities |
|
|
|
|
|
|
|
|
|
|
|
Purchase and retirement of common stock |
|
|
— |
|
|
(3,756) |
|
|
— |
|
|
Principal payments of capital lease obligations |
|
|
(390) |
|
|
(472) |
|
|
— |
|
|
Excess tax benefit from stock-based compensation |
|
|
— |
|
|
39 |
|
|
162 |
|
|
Tax withholding payment related to net settlement of equity awards |
|
|
(5) |
|
|
(29) |
|
|
(36) |
|
|
Exercise of stock options |
|
|
3,865 |
|
|
1,122 |
|
|
722 |
|
|
Net cash provided by (used in) financing activities |
|
|
3,470 |
|
|
(3,096) |
|
|
848 |
|
|
Net (decrease) increase in cash and cash equivalents |
|
|
(44,383) |
|
|
(19,123) |
|
|
16,441 |
|
|
Cash and cash equivalents at beginning of period |
|
|
124,287 |
|
|
143,410 |
|
|
126,969 |
|
|
Cash and cash equivalents at end of period |
|
$ |
79,904 |
|
$ |
124,287 |
|
$ |
143,410 |
|
|
Supplemental disclosures of cash flow information |
|
|
|
|
|
|
|
|
|
|
|
Cash paid during the period for: |
|
|
|
|
|
|
|
|
|
|
|
Income taxes |
|
$ |
1,804 |
|
$ |
1,576 |
|
$ |
700 |
|
|
Non-cash activities |
|
|
|
|
|
|
|
|
|
|
|
Unrealized gain (loss) on investments, net of deferred tax expense (benefit) of $43, $18 and $(730) for the fiscal years ended April 30, 2017, April 30, 2016 and April 30, 2015 respectively |
|
$ |
74 |
|
$ |
27 |
|
$ |
(1,095) |
|
|
Reclassification from share-based liability compensation to equity |
|
$ |
307 |
|
$ |
228 |
|
$ |
— |
|
|
Forfeiture of vested stock-based compensation |
|
$ |
— |
|
$ |
86 |
|
$ |
23 |
|
|
Acquisitions of property and equipment financed with capital lease obligations |
|
$ |
— |
|
$ |
932 |
|
$ |
— |
|
|
Accrued acquisition of intangible assets |
|
$ |
— |
|
$ |
— |
|
$ |
250 |
|
|
Acquisitions of property and equipment included in accounts payable |
|
$ |
729 |
|
$ |
1,174 |
|
$ |
— |
|
See accompanying notes to consolidated financial statements.
70
AEROVIRONMENT, INC.
NOTES TO THE CONSOLIDATED FINANCIAL STATEMENTS
1. Organization and Significant Accounting Policies
Organization
AeroVironment, Inc., a Delaware corporation, is engaged in the design, development, production, support and operation of unmanned aircraft systems (“UAS”) and efficient energy systems (“EES”) for various industries and governmental agencies.
Significant Accounting Policies
Principles of Consolidation
The accompanying consolidated financial statements include the accounts of AeroVironment, Inc. and its wholly‑owned subsidiaries: AV S.r.l. Italy, Skytower, LLC, AeroVironment GmbH, AeroVironment Massachusetts, LLC, AeroVironment Rhode Island, LLC, Skytower Inc., AILC, Inc., AeroVironment International PTE. LTD. and Regenerative Fuel Cell Systems, LLC, Charger Bicycles, LLC and AeroVironment, Inc. (Afghanistan) (collectively referred to herein as the “Company”). In addition, the accompanying consolidated financial statements include the accounts of the Company’s Turkish joint venture, Altoy Savunma Sanayi ve Havacilik Anonim Sirketi (“Altoy”), in which the Company increased its ownership to a controlling interest in on February 1, 2017. As a result of the increase in ownership, the consolidated financial statements include the balance sheet and results of operations of Altoy from February 1, 2017 forward. Prior to this date, the Company's investment in Altoy was accounted for under the equity method. Refer to Note 19 - Business Acquisitions for further details. All intercompany balances and transactions have been eliminated in consolidation.
In April 2016, the Company dissolved AV S.r.l. Italy, AILC, Inc. and AeroVironment Massachusetts, LLC the results of which were not material to the consolidated financial statements. In July 2016, the Company dissolved Charger Bicycles, LLC, the results of which were not material to the consolidated financial statements. In October 2016, the Company dissolved Skytower, LLC and Regenerative Fuel Cell Systems, LLC, the results of which were not material to the consolidated financial statements.
Investments in Companies Accounted for Using the Equity or Cost Method
Investments in other non‑consolidated entities are accounted for using the equity method or cost basis depending upon the level of ownership and/or the Company’s ability to exercise significant influence over the operating and financial policies of the investee. When the equity method is used, investments are recorded at original cost and adjusted periodically to recognize the Company’s proportionate share of the investees’ net income or losses after the date of investment. When net losses from an investment accounted for under the equity method exceed its carrying amount, the investment balance is reduced to zero and additional losses are not provided for as the Company is not obligated to provide additional capital. The Company resumes accounting for the investment under the equity method if the entity subsequently reports net income and the Company’s share of that net income exceeds the share of net losses not recognized during the period the equity method was suspended.
When an investment accounted for using the equity method issues its own shares, the subsequent reduction in the Company’s proportionate interest in the investee is reflected in equity as an adjustment to paid‑in‑capital. The Company evaluates its investments in companies accounted for by the equity or cost method for impairment when there is evidence or indicators that a decrease in value may be other than temporary.
Following the Company’s purchase of a controlling interest in Altoy on February 1, 2017, the Company did not hold any equity or cost method investments. Refer to Note 19 - Business Acquisitions for further details.
71
Segments
The Company’s products are sold and divided among two reportable segments to reflect the Company’s strategic goals. Operating segments are defined as components of an enterprise about which separate financial information is available that is evaluated regularly by the Chief Operating Decision Maker (“CODM”) in deciding how to allocate resources and in assessing performance. The Company’s CODM is the Chief Executive Officer, who reviews the revenue and gross margin results for each of these segments in order to make resource allocation decisions, including the focus of research and development (“R&D”), activities, and assessing performance. The Company’s reportable segments are business units that offer different products and services and are managed separately.
Use of Estimates
The preparation of consolidated financial statements in conformity with generally accepted accounting principles in the United States requires management to make estimates and assumptions. These estimates and assumptions affect the reported amounts of assets and liabilities and disclosure of contingent assets and liabilities at the date of the financial statements and the reported amounts of revenue and expenses during the reporting period. Significant estimates made by management include, but are not limited to, valuation of: inventory, available‑for‑sale securities, deferred tax assets and liabilities, useful lives of property, plant and equipment, medical and dental liabilities, warranty liabilities and estimates of anticipated contract costs and revenue utilized in the revenue recognition process. Actual results could differ from those estimates.
Reclassifications
Certain prior year amounts have been reclassified to conform to the current year presentation due to the adoption of ASU 2016-09 and ASU 2015-17.
Cash Equivalents
The Company considers all highly liquid investments with an original maturity of three months or less at the time of purchase to be cash equivalents. The Company’s cash equivalents are comprised of money market funds, certificates of deposit of major financial institutions, and U.S. Treasury bills.
Investments
The Company’s investments are accounted for as held‑to‑maturity and available‑for‑sale and reported at amortized cost and fair value, respectively.
Unrealized gains and losses are excluded from earnings and reported as a separate component of stockholders’ equity, net of deferred income taxes for available-for-sale investments. The convertible bond in which the Company had invested, which was classified as available-for-sale, contained an embedded conversion feature which was bifurcated from the bond. The change in the fair value of the embedded conversion feature was recorded in other income in the income statement.
Gains and losses realized on the disposition of investment securities are determined on the specific identification basis and credited or charged to income. Premium and discount on investments are amortized and accreted using the interest method and charged or credited to investment income.
Management determines the appropriate classification of securities at the time of purchase and re‑evaluates such designation as of each balance sheet date.
Investments are considered to be impaired when a decline in fair value is judged to be other‑than‑temporary. On a quarterly basis, the Company considers available quantitative and qualitative evidence in evaluating potential impairment of its investments. If the cost of an investment exceeds its fair value, the Company evaluates, among other factors, general market conditions, the duration and extent to which the fair value is less than cost, and its intent and
72
ability to hold the investment to maturity. The Company also considers potential adverse conditions related to the financial health of the issuer based on rating agency actions. Once a decline in fair value is determined to be other‑than‑temporary, an impairment charge is recorded in earnings and a new cost basis in the investment is established.
Fair Values of Financial Instruments
Fair values of cash and cash equivalents, accounts receivable, unbilled receivables, retentions and accounts payable approximate cost due to the short period of time to maturity.
Concentration of Credit Risk
Financial instruments that potentially subject the Company to concentration of credit risk consist primarily of cash, cash equivalents, municipal bonds, U.S. government securities, U.S. government-guaranteed agency securities, U.S. Government sponsored agency debt securities, highly rated commercial paper, highly rated corporate bonds, and accounts receivable. The Company currently invests the majority of its cash in municipal bonds, U.S. government securities, U.S. government-guaranteed agency securities, U.S. Government sponsored agency debt securities and highly rated corporate bonds. The Company’s revenue and accounts receivable are with a limited number of corporations and governmental entities. In the aggregate, 55%, 71% and 80% of the Company’s revenue came from agencies of the U.S. government for the years ended April 30, 2017, 2016 and 2015, respectively. These agencies accounted for 42% and 39% of the accounts receivable balances at April 30, 2017 and 2016, respectively. One such agency, the U.S. Army, accounted for 18%, 27% and 47% of the Company’s consolidated revenue for the years ended April 30, 2017, 2016 and 2015, respectively. The U.S. Army accounted for approximately 21%, 31% and 55% of UAS reportable segment sales for the years ended April 30, 2017, 2016 and 2015, respectively. The Company performs ongoing credit evaluations of its commercial customers and maintains an allowance for potential losses.
Accounts Receivable, Unbilled Receivables and Retentions
Accounts receivable represents primarily U.S. government and Foreign government, and to a lesser extent commercial receivables, net of allowances for doubtful accounts. Unbilled receivables represent costs in excess of billings on incomplete contracts and, where applicable, accrued profit related to government long‑term contracts on which revenue has been recognized, but for which the customer has not yet been billed.
Retentions represent amounts withheld by customers until contract completion. At April 30, 2017 and 2016, the retention balances were $1,537,000 and $1,453,000, respectively. The Company determines the allowance for doubtful accounts based on historical customer experience and other currently available evidence. When a specific account is deemed uncollectible, the account is written off against the allowance. The allowance for doubtful accounts reflects the Company’s best estimate of probable losses inherent in the accounts receivable balance; such losses have historically been within management’s expectations. An account is deemed past due based on contractual terms rather than on how recently payments have been received.
Inventories
Inventories are stated at the lower of cost (using the weighted average costing method) or market value. Inventory write‑offs and write‑down provisions are provided to cover risks arising from slow‑moving items or technological obsolescence and for market prices lower than cost. The Company periodically evaluates the quantities on hand relative to current and historical selling prices and historical and projected sales volume. Based on this evaluation, provisions are made to write inventory down to its market value.
73
Long‑Lived Assets
Property and equipment are carried at cost. Depreciation of property and equipment, including amortization of leasehold improvements, are provided using the straight‑line method over the following estimated useful lives:
|
Machinery and equipment |
|
2 - 7 |
years |
|
|
Computer equipment and software |
|
2 - 5 |
years |
|
|
Furniture and fixtures |
|
3 - 7 |
years |
|
|
Leasehold improvements |
|
Lesser of useful life or term of lease |
|
|
The Company finances the purchase of certain IT equipment and perpetual software licenses with capital lease arrangements. The assets and liabilities under capital leases are recorded at the lesser of the present value of aggregate future minimum lease payments, including estimated bargain purchase options, or the fair value of the asset under lease. Assets under capital leases are depreciated using the straight-line method over the lesser of the estimated useful life of the asset or the term of the lease.
Maintenance, repairs and minor renewals are charged directly to expense as incurred. Additions and betterments to property and equipment are capitalized at cost. When the Company disposes of assets, the applicable costs and accumulated depreciation and amortization thereon are removed from the accounts and any resulting gain or loss is included in selling, general and administrative (“SG&A”) expense in the period incurred.
The Company reviews the recoverability of its long‑lived assets whenever events or changes in circumstances indicate that the carrying amount of such assets may not be recoverable. The estimated future cash flows are based upon, among other things, assumptions about expected future operating performance, and may differ from actual cash flows. If the sum of the projected undiscounted cash flows (excluding interest) is less than the carrying value of the assets, the assets will be written down to the estimated fair value in the period in which the determination is made.
Intangibles Assets — Acquired in Business Combinations
The Company performs valuations of assets acquired and liabilities assumed on each acquisition accounted for as a business combination and allocates the purchase price of the acquired business to the respective net tangible and intangible assets. Acquired intangible assets include customer relationships and trade names. The Company determines the appropriate useful life by performing an analysis of expected cash flows based on historical experience of the acquired businesses. Intangible assets are amortized over their estimated useful lives using the straight-line method which approximates the pattern in which the economic benefits are consumed.
Goodwill
Goodwill represents the excess of the cost of an acquired entity over the fair value of the acquired net assets. Goodwill is tested for impairment annually during the fourth quarter of our fiscal year or when events or circumstances change in a manner that indicates goodwill might be impaired. Events or circumstances that could trigger an impairment review include, but are not limited to, a significant adverse change in legal factors or in the business or political climate, an adverse action or assessment by a regulator, unanticipated competition, a loss of key personnel, significant changes in the manner of our use of the acquired assets or the strategy for the Company’s overall business, significant negative industry or economic trends or significant underperformance relative to projected future results of operations. At April 30, 2017, goodwill was not significant and is attributable to the Company’s acquisition of a controlling interest in Altoy on February 1, 2017.
Product Warranty
The Company accrues an estimate of its exposure to warranty claims based upon both current and historical product sales data and warranty costs incurred. Product warranty reserves are recorded in other current liabilities.
74
Accrued Sales Commissions
As of April 30, 2017 and 2016, the Company accrued sales commissions in other current liabilities of $4,874,000 and $3,287,000, respectively.
Self‑Insurance Liability
The Company is self insured for employee medical claims, subject to individual and aggregate stop loss policies. The Company estimates a liability for claims filed and incurred but not reported based upon recent claims experience and an analysis of the average period of time between the occurrence of a claim and the time it is reported to and paid by the Company. As of April 30, 2017 and 2016, the Company estimated and recorded a self insurance liability in wages and related accruals of approximately $1,329,000 and $1,176,000, respectively.
Income Taxes
Deferred income tax assets and liabilities are computed annually for differences between the financial statement and income tax bases of assets and liabilities that will result in taxable or deductible amounts in the future. The provision for income taxes reflects the taxes to be paid for the period and the change during the period in the deferred income tax assets and liabilities. The Company records a valuation allowance to reduce the deferred tax assets to the amount of future tax benefit that is more likely than not to be realized. For uncertain tax positions, the Company determines whether it is “more likely than not” that a tax position will be sustained upon examination by the appropriate taxing authorities before any part of the benefit can be recorded in the financial statements. For those tax positions where it is “not more likely than not” that a tax benefit will be sustained, no tax benefit is recognized. Where applicable, associated interest and penalties are also recorded.
Customer Advances and Amounts in Excess of Cost Incurred
The Company receives advances, performance‑based payments and progress payments from customers that may exceed costs incurred on certain contracts, including contracts with agencies of the U.S. government. These advances are classified as advances from customers and will be offset against billings.
Revenue Recognition
The substantial majority of the Company’s revenue is generated pursuant to written contractual arrangements to design, develop, manufacture and/or modify complex products, and to provide related engineering, technical and other services according to the specifications of the buyers (customers). These contracts may be fixed‑price or cost‑reimbursable. The Company considers all contracts for treatment in accordance with authoritative guidance for contracts with multiple deliverables.
Revenue arrangements with multiple deliverables should be divided into separate units of accounting if the deliverables have value to the customer on a stand‑alone basis; there is objective and reliable evidence of the fair value of the undelivered item(s); and, if the arrangement includes a general right of return, delivery or performance of the undelivered item(s) is considered probable and substantially in the control of the vendor. The Company occasionally enters into arrangements that consist of installation and repair contracts associated with hardware sold by the Company. Such arrangements consist of separate contractual arrangements and are divided into separate units of accounting where the delivered item has value to the customer on a stand‑alone basis and there is objective and reasonable evidence of the fair value of the installation contract. Consideration is allocated among the separate units of accounting based on their relative fair values.
Product sales revenue is composed of revenue recognized on contracts for the delivery of production hardware and related activities. Contract services revenue is composed of revenue recognized on contracts for the provision of services, including repairs, training, engineering design, development and prototyping activities.
75
Revenue from cost‑plus‑fee contracts are recognized on the basis of costs incurred during the period plus the fee earned. Revenue from fixed‑price contracts are recognized on the percentage‑of‑completion method. Contract costs include all direct material and labor costs and those indirect costs related to contract performance. Unbilled receivables represent costs incurred and related profit on contracts not yet billed to customers, and are invoiced in subsequent periods.
Product sales revenue is recognized on the percentage‑of‑completion method or upon transfer of title to the customer, which is generally upon shipment. Shipping and handling costs incurred are included in cost of sales.
Revenue and profits on fixed‑price production contracts, where units are produced and delivered in a continuous or sequential process, are recorded as units are delivered based on their selling prices (the “units‑of‑delivery method”). Revenue and profits on other fixed‑price contracts with significant engineering as well as production requirements are recorded based on the ratio of total actual incurred costs to date to the total estimated costs for each contract (the “cost‑to‑cost method”). Accounting for revenue and profits on a fixed‑price contract requires the preparation of estimates of (1) the total contract revenue, (2) the total costs at completion, which is equal to the sum of the actual incurred costs to date on the contract and the estimated costs to complete the contract’s statement of work and (3) the measurement of progress towards completion. The estimated profit or loss at completion on a contract is equal to the difference between the total estimated contract revenue and the total estimated cost at completion. Under the units‑of‑delivery method, sales on a fixed‑price type contract are recorded as the units are delivered during the period based on their contractual selling prices. Under the cost‑to‑cost method, sales on a fixed‑price type contract are recorded at amounts equal to the ratio of actual cumulative costs incurred divided by total estimated costs at completion, multiplied by (i) the total estimated contract revenue, less (ii) the cumulative sales recognized in prior periods. The profit recorded on a contract in any period using either the units‑of‑delivery method or cost‑to‑cost method is equal to (i) the current estimated total profit margin multiplied by the cumulative sales recognized, less (ii) the amount of cumulative profit previously recorded for the contract. In the case of a contract for which the total estimated costs exceed the total estimated revenue, a loss arises, and a provision for the entire loss is recorded in the period that it becomes evident. The unrecoverable costs on a loss contract that are expected to be incurred in future periods are recorded in the program cost.
Significant management judgments and estimates must be made and used in connection with the recognition of revenue in any accounting period. Material differences in the amount of revenue in any given period may result if these judgments or estimates prove to be incorrect or if management’s estimates change on the basis of development of the business, market conditions or other factors. Management judgments and estimates have been applied consistently and have been reliable historically. The Company believes that there are two key factors which impact the reliability of management’s estimates. The first of those key factors is that the terms of the Company’s contracts are typically less than six months. The short‑term nature of such contracts reduces the risk that material changes in accounting estimates will occur on the basis of market conditions or other factors. The second key factor is that the Company has hundreds of contracts in any given accounting period, which reduces the risk that any one change in an accounting estimate on one or several contracts would have a material impact on the Company’s consolidated financial statements or its two reporting segments’ measures of profit. Changes in estimates are recognized using the cumulative catch‑up method of accounting. This method recognizes, in the current period, the cumulative effect of the changes on current and prior periods.
Stock‑Based Compensation
Stock‑based compensation is measured at the grant date based on the fair value of the award and is recognized as expense over the requisite service period, which is generally the vesting period of the respective award. No compensation cost is ultimately recognized for awards for which employees do not render the requisite service and are forfeited.
Long‑Term Incentive Awards
For long‑term incentive awards outstanding as of April 30, 2017, a target payout is established at the beginning of each performance period. The actual payout at the end of the performance period is calculated based upon the Company’s achievement of such targets. Payouts are made in cash and restricted stock units. Upon vesting of the
76
restricted stock units, the Company has the discretion, but not an obligation, to settle the restricted stock units in cash or stock.
The cash component of the award is accounted for as a liability. The equity component is accounted for as a stock‑based liability, as the restricted stock units may be settled in cash or stock. At each reporting period, the Company reassesses the probability of achieving the performance targets. The estimation of whether the performance targets will be achieved requires judgment, and, to the extent actual results or updated estimates differ from the Company’s current estimates, the cumulative effect on current and prior periods of those changes will be recorded in the period estimates are revised.
Research and Development
Internally funded research and development costs (“IRAD”), sponsored by the Company relate to both U.S. government products and services and those for commercial and foreign customers. IRAD costs for the Company are recoverable and allocable under government contracts in accordance with U.S. government procurement regulations.
Customer‑funded research and development costs are incurred pursuant to contracts (revenue arrangements) to perform research and development activities according to customer specifications. These costs are direct contract costs and are expensed to cost of sales when the corresponding revenue is recognized, which is generally as the research and development services are performed. Revenue from customer‑funded research and development was approximately $43,597,000, $53,546,000 and $36,998,000 for the years ended April 30, 2017, 2016 and 2015, respectively. The related cost of sales for customer‑funded research and development totaled approximately $29,790,000, $34,786,000 and $24,776,000 for the years ended April 30, 2017, 2016 and 2015, respectively.
Lease Accounting
The Company accounts for its leases and subsequent amendments as operating leases or capital leases for financial reporting purposes. Certain operating leases contain rent escalation clauses, which are recorded on a straight‑line basis over the initial term of the lease with the difference between the rent paid and the straight‑line rent recorded as a deferred rent liability. Lease incentives received from landlords are recorded as deferred rent liabilities and are amortized on a straight‑line basis over the lease term as a reduction to rent expense. Deferred rent liabilities were approximately $1,719,000 and $1,714,000 as of April 30, 2017 and 2016, respectively.
Advertising Costs
Advertising costs are expensed as incurred. Advertising expenses included in SG&A expenses were approximately $337,000, $486,000 and $416,000 for the years ended April 30, 2017, 2016 and 2015, respectively.
Foreign Currency Transactions
Foreign currency transaction gains and losses are charged or credited to earnings as incurred. For the fiscal years ended April 30, 2017, 2016 and 2015, foreign currency transaction gains and losses that are included in other income (expense) in the accompanying statements of operations were $(284,000), $(63,000), and $(580,000), respectively.
Earnings Per Share
Basic earnings per share are computed using the weighted‑average number of common shares outstanding and excludes any anti‑dilutive effects of options, restricted stock and restricted stock units. The dilutive effect of potential common shares outstanding is included in diluted earnings per share.
77
The reconciliation of diluted to basic shares is as follows:
|
|
|
Year Ended April 30, |
|
|||||||
|
|
|
2017 |
|
2016 |
|
2015 |
|
|||
|
Numerator for basic earnings per share: |
|
|
|
|
|
|
|
|
|
|
|
Net income attributable to AeroVironment |
|
$ |
12,479,000 |
|
$ |
8,966,000 |
|
$ |
2,895,000 |
|
|
Denominator for basic earnings per share: |
|
|
|
|
|
|
|
|
|
|
|
Weighted average common shares |
|
|
23,059,045 |
|
|
22,936,413 |
|
|
22,868,733 |
|
|
Dilutive effect of employee stock options, restricted stock and restricted stock units |
|
|
248,693 |
|
|
217,080 |
|
|
277,264 |
|
|
Denominator for diluted earnings per share |
|
|
23,307,738 |
|
|
23,153,493 |
|
|
23,145,997 |
|
During the years ended April 30, 2017, 2016 and 2015, certain options, shares of restricted stock and restricted stock units were not included in the computation of diluted earnings per share because their inclusion would have been anti‑dilutive. The number of options, restricted stock and restricted stock units which met this anti‑dilutive criterion was approximately 86,000, 22,000 and 43,000 for the years ended April 30, 2017, 2016 and 2015, respectively.
78
Recently Adopted Accounting Standards
In November 2015, the Financial Accounting Standards Board (“FASB”) issued Accounting Standard Update (“ASU”) No. 2015-17, Balance Sheet Classification of Deferred Taxes, which requires entities to present deferred tax assets and liabilities as noncurrent in a classified balance sheet. This guidance simplifies the current guidance, which requires entities to separately present deferred tax assets and liabilities as current and non-current in a classified balance sheet. ASU 2015-17 is effective for fiscal years beginning after December 15, 2016, and interim periods within those years, with early adoption permitted. The ASU may be applied either prospectively to all deferred tax assets and liabilities or retrospectively to all periods presented. The Company adopted this pronouncement beginning May 1, 2016 and applied this pronouncement retrospectively. In connection with adopting the pronouncement beginning May 1, 2016, the Company reclassified $5,432,000 from current deferred income tax assets in the consolidated balance sheet as of April 30, 2016 to non-current deferred income tax liabilities.
In March 2016, the FASB issued ASU No. 2016-09, Compensation—Stock Compensation (Topic 718), Improvements to Employee Share-Based Payment Accounting. The new standard simplifies the accounting for employee share-based payment transactions, including the accounting for income taxes, forfeitures, and statutory withholding requirements, as well as the related classification in the statement of cash flows. The new standard is effective for annual reporting periods beginning after December 15, 2016, and interim periods within those years, with early adoption permitted. The standard requires an entity to recognize all excess tax benefits and tax deficiencies as income tax benefit or expense in the income statement as discrete items in the reporting period in which they occur, and such tax benefits and tax deficiencies are not included in the estimate of an entity’s annual effective tax rate, applied on a prospective basis. Further, the standard eliminates the requirement to defer the recognition of excess tax benefits until the benefit is realized through a reduction to taxes payable. All excess tax benefits previously unrecognized, along with any valuation allowance, are to be recognized on a modified retrospective basis as a cumulative adjustment to retained earnings as of the date of adoption. Under the ASU, an entity that applies the treasury stock method in calculating diluted earnings per share is required to exclude excess tax benefits and deficiencies from the calculation of assumed proceeds since such amounts are recognized in the income statement. Excess tax benefits are also classified as operating activities in the same manner as other cash flows related to income taxes on the statement of cash flows, as such excess tax benefits no longer represent financing activities since they are recognized in the income statement, and are to be applied prospectively or retrospectively to all periods presented. The Company adopted the pronouncement beginning May 1, 2016. In connection with adopting the pronouncement beginning May 1, 2016, the Company recorded a cumulative increase of $265,000 in retained earnings with a corresponding increase in deferred tax assets in the consolidated balance sheet as of April 30, 2016 related to the prior years' unrecognized excess tax benefits. Excess tax benefits related to exercised options and vested restricted stock awards during the fiscal year ended April 30, 2017 have been recognized in the current period’s income statement. The Company also excluded the excess tax benefits from the calculation of diluted earnings per share for the fiscal year ended April 30, 2017. The Company applied the cash flow presentation section of the guidance on a prospective basis, and the prior period statement of cash flows was not adjusted.
Recently Issued Accounting Standards
In January 2017, the FASB issued ASU 2017-01, Business Combinations – Clarifying the definition of a business (Topic 805). This ASU clarifies the definition of a business with the objective of providing a more robust framework to evaluate whether transactions should be accounted for as acquisitions (or disposals) of assets or businesses. The guidance will be effective for fiscal years beginning after December 15, 2017, including interim periods within that fiscal year, with early adoption permitted. The amendments are to be applied prospectively to business combinations that occur after the effective date.
In August 2016, the FASB issued ASU 2016-15, Statement of Cash Flows - Classification of Certain Cash Receipts and Cash Payments (Topic 230). This ASU adds and clarifies guidance on the classification of certain cash receipts and payments in the statement of cash flows. The guidance is effective for fiscal years beginning after December 15, 2017 and interim periods therein, with early adoption permitted. The Company is evaluating the potential impact of this adoption on its consolidated financial statements.
79
In February 2016, the FASB issued ASU No. 2016-02, Leases (Topic 842). This ASU requires the lessee to recognize the assets and liabilities for the rights and obligations created by leases with terms of 12 months or more. The guidance is effective for fiscal years beginning after December 15, 2018 and interim periods therein, with early adoption permitted. The Company is evaluating the potential impact of this adoption on its consolidated financial statements. The Company currently does not hold a large number of leases classified as operating leases under the existing lease standard, with the only significant leases being the Company’s various property leases.
In July 2015, the FASB issued ASU No. 2015-11, Inventory (Topic 330): Simplifying the Measurement of Inventory. This ASU does not apply to inventory that is measured using last-in, first-out (LIFO) or the retail inventory method. The amendments apply to all other inventory, which includes inventory that is measured using first-in, first-out (FIFO) or average cost. This ASU eliminates from U.S. GAAP the requirement to measure inventory at the lower of cost or market. Market under the previous requirement could be replacement cost, net realizable value, or net realizable value less a normal profit margin. Entities within the scope of this update will now be required to measure inventory at the lower of cost and net realizable value. Net realizable value is the estimated selling price in the ordinary course of business, less reasonably predictable costs of completion, disposal, and transportation. Subsequent measurement is unchanged for inventory using LIFO or the retail inventory method. The amendments in this update are effective for fiscal years beginning after December 15, 2016, with early adoption permitted. The Company does not anticipate a material impact from adopting ASU 2015-11 during fiscal year 2018.
In May 2014, the FASB issued ASU No. 2014-09, Revenue from Contracts with Customers (Topic 606). The new standard was originally effective for reporting periods beginning after December 15, 2016 and early adoption was not permitted. In August 2015, the FASB issued ASU No. 2015-14, Revenue from Contracts with Customers (Topic 640)-Deferral of the Effective Date. This update approved a one year delay of the effective date to reporting periods beginning after December 15, 2017, while permitting companies to voluntarily adopt the new standard as of the original effective date. Since the issuance of ASU 2014-09, the FASB has issued several amendments to provide additional supplemental guidance on certain aspects of the original pronouncement. The core principle of ASU 2014-09 is to recognize revenue upon the transfer of goods or services to customers at an amount that reflects the consideration expected to be received. In adopting the guidance, companies are permitted to select between two transition methods: (1) a full retrospective transition method with the application of the new guidance to each prior reporting period presented, or (2) a retrospective transition method that recognizes the cumulative effect on prior periods at the date of adoption together with additional footnote disclosures. The Company is continuing to assess the potential impact of this guidance, including the impact on those areas currently subject to industry-specific guidance such as government contract accounting. As part of its assessment, the Company is reviewing representative samples of customer contracts to determine the impact on revenue recognition under the new guidance. At this time, the Company anticipates adopting the guidance under the retrospective transition method.
80
2. Investments
Investments consist of the following:
|
|
|
April 30, |
|
||||
|
|
|
2017 |
|
2016 |
|
||
|
|
|
(In thousands) |
|
||||
|
Short-term investments: |
|
|
|
|
|
|
|
|
Held-to-maturity securities: |
|
|
|
|
|
|
|
|
Municipal securities |
|
$ |
47,437 |
|
$ |
42,179 |
|
|
U.S. government securities |
|
|
14,515 |
|
|
21,184 |
|
|
Corporate bonds |
|
|
55,519 |
|
|
40,041 |
|
|
Certificates of deposit |
|
|
2,500 |
|
|
— |
|
|
Total held-to-maturity and short-term investments |
|
$ |
119,971 |
|
$ |
103,404 |
|
|
Long-term investments: |
|
|
|
|
|
|
|
|
Held-to-maturity securities: |
|
|
|
|
|
|
|
|
Municipal securities |
|
$ |
8,942 |
|
$ |
— |
|
|
U.S. government securities |
|
|
22,540 |
|
|
7,518 |
|
|
Corporate bonds |
|
|
8,117 |
|
|
23,561 |
|
|
Total held-to-maturity investments |
|
|
39,599 |
|
|
31,079 |
|
|
Available-for-sale securities: |
|
|
|
|
|
|
|
|
Auction rate securities |
|
|
2,497 |
|
|
2,780 |
|
|
Total available-for-sale investments |
|
|
2,497 |
|
|
2,780 |
|
|
Total long-term investments |
|
$ |
42,096 |
|
$ |
33,859 |
|
Held‑To‑Maturity Securities
As of April 30, 2017 and 2016, the balance of held‑to‑maturity securities consisted of state and local government municipal securities, U.S. government securities, corporate bonds and certificates of deposit. Interest earned from these investments is recorded in interest income.
The amortized cost, gross unrealized losses, and estimated fair value of the held‑to‑maturity investments as of April 30, are as follows (in thousands):
|
|
|
April 30, 2017 |
|
||||||||||
|
|
|
|
|
|
Gross |
|
Gross |
|
|
|
|
||
|
|
|
Amortized |
|
Unrealized |
|
Unrealized |
|
Fair |
|
||||
|
|
|
Cost |
|
Gains |
|
Losses |
|
Value |
|
||||
|
Municipal securities |
|
$ |
56,379 |
|
$ |
30 |
|
$ |
(21) |
|
$ |
56,388 |
|
|
U.S. government securities |
|
|
37,055 |
|
|
2 |
|
|
(41) |
|
|
37,016 |
|
|
Corporate bonds |
|
|
63,636 |
|
|
9 |
|
|
(85) |
|
|
63,560 |
|
|
Certificates of deposit |
|
|
2,500 |
|
|
1 |
|
|
— |
|
|
2,501 |
|
|
Total held-to-maturity investments |
|
$ |
159,570 |
|
$ |
42 |
|
$ |
(147) |
|
$ |
159,465 |
|
81
The amortized cost and fair value of the Company’s held‑to‑maturity securities by contractual maturity at April 30, 2017, are as follows:
|
|
|
Cost |
|
Fair Value |
|
||
|
Due within one year |
|
$ |
119,971 |
|
$ |
119,893 |
|
|
Due after one year through five years |
|
|
39,599 |
|
|
39,572 |
|
|
Total |
|
$ |
159,570 |
|
$ |
159,465 |
|
Available‑For‑Sale Securities
Auction Rate Securities
As of April 30, 2017 and 2016, the entire balance of available‑for‑sale auction rate securities consisted of two investment grade auction rate municipal bonds with maturities ranging from 2 to 17 years. These investments have characteristics similar to short‑term investments, because at pre‑determined intervals, generally ranging from 30 to 35 days, there is a new auction process at which the interest rates for these securities are reset to current interest rates. At the end of such period, the Company chooses to roll‑over its holdings or redeem the investments for cash. A market maker facilitates the redemption of the securities and the underlying issuers are not required to redeem the investment within 365 days. Interest earned from these investments is recorded in interest income.
During the fourth quarter of the fiscal year ended April 30, 2008, the Company began experiencing failed auctions on some of its auction rate securities. A failed auction occurs when a buyer for the securities cannot be obtained and the market maker does not buy the security for its own account. The Company continues to earn interest on the investments that failed to settle at auction, at the maximum contractual rate until the next auction occurs. In the event the Company needs to access funds invested in these auction rate securities, the Company may not be able to liquidate these securities at the fair value recorded on April 30, 2017 until a future auction of these securities is successful or a buyer is found outside of the auction process.
As a result of the failed auctions, the fair values of these securities are estimated utilizing a discounted cash flow analysis as of April 30, 2017 and 2016. The analysis considers, among other items, the collateralization underlying the security investments, the creditworthiness of the counterparty, the timing of expected future cash flows, and the expectation of the next time the security is expected to have a successful auction.
Based on the Company’s ability to access its cash and cash equivalents, expected operating cash flows, and other sources of cash, the Company does not anticipate the current lack of liquidity on these investments will affect its ability to operate the business in the ordinary course. The Company believes the current lack of liquidity of these investments is temporary and expects that the securities will be redeemed or refinanced at some point in the future. The Company will continue to monitor the value of its auction rate securities at each reporting period for a possible impairment if a further decline in fair value occurs. The auction rate securities have been in an unrealized loss position for more than 12 months. The Company has the ability and the intent to hold these investments until a recovery of fair value, which may be maturity and as of April 30, 2017, it did not consider these investments to be other‑than‑temporarily impaired.
82
The amortized cost, gross unrealized losses, and estimated fair value of the available‑for‑sale auction rate securities are as follows (in thousands):
|
|
|
April 30, |
|
||||
|
|
|
2017 |
|
2016 |
|
||
|
Auction rate securities |
|
|
|
|
|
|
|
|
Amortized cost |
|
$ |
2,700 |
|
$ |
3,100 |
|
|
Gross unrealized losses |
|
|
(203) |
|
|
(320) |
|
|
Fair value |
|
$ |
2,497 |
|
$ |
2,780 |
|
The amortized cost and fair value of the Company’s auction rate securities by contractual maturity at April 30, 2017 are as follows (in thousands):
|
|
|
Cost |
|
Fair Value |
|
||
|
Due after one through five years |
|
$ |
700 |
|
$ |
701 |
|
|
Due after 10 years |
|
|
2,000 |
|
|
1,796 |
|
|
Total |
|
$ |
2,700 |
|
$ |
2,497 |
|
Equity Securities
At April 30, 2015, the entire balance of available-for-sale equity securities consisted of 618,042 CybAero AB (“CybAero”) common shares. The shares were classified as available-for-sale. These shares were initially acquired on August 11, 2014, when the Company converted a convertible bond into CybAero common shares. The convertible bond was in the amount of 10 million SEK and was converted into 1,062,699 common shares of CybAero at the conversion price of 9.41 SEK per share. When the Company converted the bond on August 11, 2014, the fair value per share was 37.50 SEK which became the new cost basis going forward, with all subsequent changes in fair value being recorded to other comprehensive income.
At August 1, 2015, the Company reviewed these shares for impairment based on criteria that included the extent to which the investment’s carrying value exceeds its related market value, the duration of the market decline, uncertainty as to the recovery period due to sustained losses of the investee and the Company’s intent to hold its investment until recovery. In the three months ended August 1, 2015, the Company determined it was in its best interests to liquidate the remaining shares held. As a result, during the three months ended August 1, 2015, the Company recorded an other-than-temporary-impairment loss of $2,186,000 related to the Company’s investment in the CybAero shares which was recorded to other (expense), net in the consolidated statement of operations. As a result of recording the impairment charge, the investment’s fair value became its new cost basis.
In August 2015, the Company sold its remaining shares in CybAero in a private sale at the price of 12.00 SEK per share, resulting in proceeds of approximately $777,000. During the fiscal year ended April 30, 2016, the Company realized gains on the sale of CybAero shares of $207,000, based on the difference between the original conversion price of 9.41 SEK per share and the sales price at the time of sale, inclusive of the final sale of all shares. During the fiscal year ended April 30, 2015, the Company realized gains on the sale of CybAero shares of $4,784,000.
83
3. Fair Value Measurements
Fair value is the price that would be received to sell an asset or paid to transfer a liability (an exit price) in the principal or most advantageous market for the asset or liability in an orderly transaction between market participants on the measurement date. The fair value hierarchy contains three levels as follows:
|
· |
Level 1—Inputs to the valuation based upon quoted prices (unadjusted) for identical assets or liabilities in active markets that are accessible as of the measurement date. |
|
· |
Level 2—Inputs to the valuation include quoted prices in either markets that are not active, or in active markets for similar assets or liabilities, inputs other than quoted prices that are observable, and inputs that are derived principally from or corroborated by observable market data. |
|
· |
Level 3—Inputs to the valuation that are unobservable inputs for the asset or liability. |
The Company’s financial assets measured at fair value on a recurring basis at April 30, 2017, were as follows (in thousands):
|
|
|
Fair Value Measurement Using |
|
||||||||||
|
|
|
|
|
|
Significant |
|
|
|
|
|
|
|
|
|
|
|
Quoted prices in |
|
other |
|
Significant |
|
|
|
|
|||
|
|
|
active markets for |
|
observable |
|
unobservable |
|
|
|
|
|||
|
|
|
identical assets |
|
inputs |
|
inputs |
|
|
|
|
|||
|
Description |
|
(Level 1) |
|
(Level 2) |
|
(Level 3) |
|
Total |
|
||||
|
Auction rate securities |
|
$ |
— |
|
$ |
— |
|
$ |
2,497 |
|
$ |
2,497 |
|
|
Total |
|
$ |
— |
|
$ |
— |
|
$ |
2,497 |
|
$ |
2,497 |
|
The following table provides a reconciliation between the beginning and ending balances of items measured at fair value on a recurring basis in the table above that used significant unobservable inputs (Level 3) (in thousands):
|
|
|
Fair Value |
|
|
|
|
|
Measurements Using |
|
|
|
|
|
Significant |
|
|
|
|
|
Unobservable Inputs |
|
|
|
Description |
|
(Level 3) |
|
|
|
Balance at May 1, 2016 |
|
$ |
2,780 |
|
|
Transfers to Level 3 |
|
|
— |
|
|
Total gains (realized or unrealized) |
|
|
|
|
|
Included in earnings |
|
|
— |
|
|
Included in other comprehensive income |
|
|
117 |
|
|
Purchases, issuances and settlements, net |
|
|
(400) |
|
|
Balance at April 30, 2017 |
|
$ |
2,497 |
|
|
The amount of total gains or (losses) for the period included in earnings attributable to the change in unrealized gains or losses relating to assets still held at April 30, 2017 |
|
$ |
— |
|
The auction rate securities are valued using a discounted cash flow model. The analysis considers, among other items, the collateralization underlying the security investments, the creditworthiness of the counterparty, the timing of expected future cash flows, and the estimated date upon which the security is expected to have a successful auction. As of April 30, 2017, the inputs used in the Company’s discounted cash flow analysis included current coupon rates of 1.6%, estimated redemption periods of 2 to 17 years and discount rates of 2.4% to 12.7%. The discount rates were based
84
on market rates for municipal bond securities, as adjusted for a risk premium to reflect the lack of liquidity of these investments.
4. Inventories, net
Inventories consist of the following:
|
|
|
April 30, |
|
||||
|
|
|
2017 |
|
2016 |
|
||
|
|
|
(In thousands) |
|
||||
|
Raw materials |
|
$ |
18,365 |
|
$ |
11,609 |
|
|
Work in process |
|
|
16,168 |
|
|
4,259 |
|
|
Finished goods |
|
|
30,793 |
|
|
26,073 |
|
|
Inventories, gross |
|
|
65,326 |
|
|
41,941 |
|
|
Reserve for inventory excess and obsolescence |
|
|
(5,250) |
|
|
(4,455) |
|
|
Inventories, net |
|
$ |
60,076 |
|
$ |
37,486 |
|
Inventory held at third parties as of April 30, 2017 and 2016 was $4,039,000 and $5,329,000, respectively.
5. Intangibles
Intangibles are included in other assets on the balance sheet. The components of intangibles are as follows:
|
|
|
April 30, |
|
||||
|
|
|
2017 |
|
2016 |
|
||
|
|
|
(In thousands) |
|
||||
|
Licenses |
|
$ |
818 |
|
$ |
818 |
|
|
Customer relationships |
|
|
1,600 |
|
|
- |
|
|
Trademarks and tradenames |
|
|
60 |
|
|
- |
|
|
Other |
|
|
3 |
|
|
- |
|
|
Less accumulated amortization |
|
|
(658) |
|
|
(518) |
|
|
Intangibles, net |
|
$ |
1,823 |
|
$ |
300 |
|
The weighted average amortization period at April 30, 2017 and 2016 was six years and four years, respectively. Amortization expense for the years ended April 30, 2017, 2016 and 2015 was $139,000, $80,000 and $249,000, respectively.
The customer relationships, trademarks and tradenames, and other intangible assets were recognized in conjunction with the Company’s acquisition of a controlling interest in its Altoy joint venture on February 1, 2017. Refer to Note 19 - Business Combinations for further details.
During the fiscal year ended April 30, 2015, the Company recorded an impairment charge of $438,000 recorded in SG&A expenses related to an exclusive distribution agreement as the Company determined that it would not be selling any products through the exclusive distribution agreement.
85
Estimated amortization expense for the next five years is as follows:
|
|
|
Year ending |
|
|
|
|
|
April 30, |
|
|
|
|
|
(In thousands) |
|
|
|
2018 |
|
$ |
318 |
|
|
2019 |
|
|
317 |
|
|
2020 |
|
|
298 |
|
|
2021 |
|
|
237 |
|
|
2022 |
|
|
237 |
|
|
|
|
$ |
1,407 |
|
6. Goodwill
The following table presents the changes in the Company's goodwill balance (in thousands):
|
Balance at April 30, 2016 |
|
$ |
— |
|
Goodwill arising from acquisitions |
|
|
122 |
|
Balance at April 30, 2017 |
|
$ |
122 |
The increase of goodwill is attributable to the acquisition of a controlling interest in Altoy as detailed in Note 19 - Business Acquisitions.
7. Property and Equipment, net
Property and equipment consist of the following:
|
|
|
April 30, |
|
||||
|
|
|
2017 |
|
2016 |
|
||
|
|
|
(In thousands) |
|
||||
|
Leasehold improvements |
|
$ |
9,809 |
|
$ |
8,939 |
|
|
Machinery and equipment |
|
|
53,077 |
|
|
48,034 |
|
|
Furniture and fixtures |
|
|
1,962 |
|
|
1,730 |
|
|
Computer equipment and software |
|
|
32,485 |
|
|
30,171 |
|
|
Construction in process |
|
|
4,608 |
|
|
3,885 |
|
|
Property and equipment, gross |
|
|
101,941 |
|
|
92,759 |
|
|
Less accumulated depreciation and amortization |
|
|
(82,721) |
|
|
(75,997) |
|
|
Property and equipment, net |
|
$ |
19,220 |
|
$ |
16,762 |
|
Depreciation expense for the years ended April 30, 2017, 2016 and 2015 was $6,913,000, $5,993,000 and $8,116,000, respectively. At April 30, 2017 and 2016, property and equipment includes computer equipment and software under capital leases with a cost basis of $1,836,000 and $1,836,000 and accumulated depreciation of $1,433,000 and $1,058,000, respectively. Depreciation of computer equipment and software under capital leases was $375,000 and $455,000 for the fiscal years ended April 30, 2017 and 2016 respectively.
86
8. Investments in Companies Accounted for Using the Equity Method
In March of 2014, the Company purchased 49% of the outstanding common stock of Altoy, a Turkish corporation founded in February 2014. During the years ended April 30, 2017, 2016 and 2015, the Company recorded 49% of the net loss of Altoy, or $119,000, $138,000 and $240,000, respectively, in “Other (expense) income” in the consolidated statement of income. At April 30, 2016 and 2015, the carrying value of the investment in Altoy was $386,000 and $230,000, respectively, and was recorded in “Other assets, long‑term.”
On February 1, 2017, the Company acquired an additional 36% interest in Altoy, increasing the Company’s total ownership interest to 85%, for total cash consideration of $625,000. As a result of the Company obtaining a controlling interest in Altoy, Altoy has been consolidated into the consolidated financial statements of the Company as of the date of the acquisition. Refer to Note 19 - Business Acquisitions.
9. Warranty Reserves
Warranty reserve activity is summarized as follows:
|
|
|
April 30, |
|
||||
|
|
|
2017 |
|
2016 |
|
||
|
|
|
(In thousands) |
|
||||
|
Beginning balance |
|
$ |
4,134 |
|
$ |
2,653 |
|
|
Warranty expense |
|
|
1,428 |
|
|
4,516 |
|
|
Changes in estimates related to pre-existing warranties |
|
|
1,651 |
|
|
(424) |
|
|
Warranty costs settled |
|
|
(3,982) |
|
|
(2,611) |
|
|
Ending balance |
|
$ |
3,231 |
|
$ |
4,134 |
|
During the fiscal year ended April 30, 2017, the Company revised its estimates based on the results of additional engineering studies and recorded incremental warranty reserve charges totaling $1,651,000, related to the estimated costs to repair a component of certain small UAS that were delivered in prior periods. At April 30, 2017, the total remaining warranty reserve related to the estimated costs to repair the impacted UAS was $441,000. As of April 30, 2017 a total of $1,762,000 of costs related to this warranty have been incurred. The impact to net income attributable to AeroVironment and diluted earnings per share of the change in estimate was approximately $(1,034,000) and $(0.04), respectively.
10. Employee Savings Plan
The Company has an employee 401(k) savings plan covering all eligible employees. The Company expensed approximately $3,016,000, $3,028,000 and $2,818,000 in contributions to the plan for the years ended April 30, 2017, 2016 and 2015, respectively.
11. Severance Charges
During the fiscal year ended April 30, 2017, the Company recorded severance costs totaling $2,190,000. Of this total, approximately $850,000 was due to two officers who left the Company during the fiscal year ended April 30, 2017. The remaining severance costs were due to certain strategic headcount reductions consisting entirely of severance payments. Of the total, approximately $900,000 was recorded to cost of sales and $1,290,000 was recorded to SG&A. Of the total recorded to cost of sales, approximately $550,000 related to UAS and approximately $350,000 to EES. The Company does not report SG&A costs by segment as the CODM only reviews the revenue and gross margin results for each of these segments when making resource allocation decisions. Of the total, approximately $295,000 was in accrued wages and related accruals at April 30, 2017.
87
During the fiscal year ended April 30, 2016, the Company made certain strategic headcount reductions with a total cost of approximately $933,000, consisting entirely of severance payments. The Company recorded this charge during its fourth fiscal quarter ended April 30, 2016. Of the total, approximately $362,000 was recorded to cost of sales and $571,000 was recorded to SG&A. Of the total recorded to cost of sales, approximately $300,000 related to UAS and approximately $62,000 to EES. The Company does not report SG&A costs by segment as the CODM only reviews the revenue and gross margin results for each of these segments when making resource allocation decisions. Of the total, approximately $834,000 was in accrued wages and related accruals at April 30, 2016. All amounts were paid out prior to April 30, 2017.
12. Stock‑Based Compensation
For the years ended April 30, 2017, 2016 and 2015, the Company recorded stock‑based compensation expense of approximately $3,709,000, $4,562,000 and $3,768,000, respectively.
On January 14, 2007, the stockholders of the Company approved the 2006 Equity Incentive Plan, or 2006 Plan, effective January 21, 2007, for officers, directors, key employees and consultants. On September 29, 2011, the stockholders of the Company approved an amendment and restatement of the 2006 Plan, or Restated 2006 Plan. Under the Restated 2006 Plan, incentive stock options, nonqualified stock options, restricted stock awards, stock appreciation right awards, performance share awards, performance stock unit awards, dividend equivalents awards, stock payment awards, deferred stock awards, restricted stock unit awards, other stock‑based awards, performance bonus awards or performance‑based awards may be granted at the discretion of the compensation committee, which consists of outside directors. A maximum of 4,884,157 shares of stock may be issued pursuant to awards under the Restated 2006 Plan. The maximum number of shares of common stock with respect to one or more awards that may be granted to any one participant during any twelve month period is 2,000,000. A maximum of $5,000,000 may be paid in cash to any one participant as a performance‑based award during any twelve month period. The exercise price for any incentive stock option shall not be less than 100% of the fair market value on the date of grant. Vesting of awards is established at the time of grant.
The Company had an equity incentive plan, or 2002 Plan, for officers, directors and key employees. Under the 2002 Plan, incentive stock options or nonqualified stock options were granted, as determined by the administrator at the time of grant. Stock purchase rights were also granted under the 2002 Plan. Options under the 2002 Plan were granted at their fair market value (as determined by the board of directors). The options became exercisable at various times over a five-year period from the grant date. The 2002 Plan was terminated on the effective date of the 2006 Plan. Awards outstanding under the 2002 Plan remain outstanding and exercisable; no additional awards may be made under the 2002 Plan.
The Company had a 1992 nonqualified stock option plan, or 1992 Plan, for certain officers and key employees. Options under the 1992 Plan were granted at their fair market value (as determined by the board of directors) at the date of grant and became exercisable at various times over a five-year period from the grant date. The 1992 Plan expired in August 2002.
The fair value of stock options granted was estimated at the grant date using the Black‑Scholes option pricing model with the following weighted average assumptions for the years ended April 30, 2017, 2016 and 2015:
|
|
|
Year Ended April 30, |
|
|||||||
|
|
|
2017 |
|
2016 |
|
2015 |
|
|||
|
Expected term (in years) |
|
|
— |
|
|
6.00 |
|
|
6.00 |
|
|
Expected volatility |
|
|
— |
% |
|
36.14 |
% |
|
44.65 |
% |
|
Risk-free interest rate |
|
|
— |
% |
|
1.88 |
% |
|
1.92 |
% |
|
Expected dividend |
|
|
— |
|
|
— |
|
|
— |
|
|
Weighted average fair value at grant date |
|
$ |
— |
|
$ |
10.18 |
|
$ |
14.05 |
|
88
No options were granted during the fiscal year ended April 30, 2017.
The expected term of stock options represents the weighted average period the Company expects the stock options to remain outstanding, based on the Company’s historical exercise and post‑vesting cancellation experience and the remaining contractual life of its outstanding options.
The expected volatility is based on historical volatility for the Company’s stock.
The risk free interest rate is based on the implied yield on a U.S. Treasury zero‑coupon bond with a remaining term that approximates the expected term of the option.
The expected dividend yield of zero reflects that the Company has not paid any cash dividends since inception and does not anticipate paying cash dividends in the foreseeable future.
Information related to the stock option plans at April 30, 2017, 2016 and 2015, and for the years then ended is as follows:
|
|
|
Restated 2006 Plan |
|
2002 Plan |
|
1992 Plan |
|
|||||||||
|
|
|
|
|
Weighted |
|
|
|
Weighted |
|
|
|
Weighted |
|
|||
|
|
|
|
|
Average |
|
|
|
Average |
|
|
|
Average |
|
|||
|
|
|
|
|
Exercise |
|
|
|
Exercise |
|
|
|
Exercise |
|
|||
|
|
|
Shares |
|
Price |
|
Shares |
|
Price |
|
Shares |
|
Price |
|
|||
|
Outstanding at April 30, 2014 |
|
713,110 |
|
|
23.20 |
|
48,511 |
|
|
7.18 |
|
105,079 |
|
|
0.52 |
|
|
Options granted |
|
85,599 |
|
|
31.27 |
|
— |
|
|
— |
|
— |
|
|
— |
|
|
Options exercised |
|
(30,000) |
|
|
23.81 |
|
(3,518) |
|
|
2.13 |
|
(1,500) |
|
|
0.59 |
|
|
Options canceled |
|
(111,592) |
|
|
24.75 |
|
— |
|
|
— |
|
— |
|
|
— |
|
|
Outstanding at April 30, 2015 |
|
657,117 |
|
|
23.96 |
|
44,993 |
|
|
7.57 |
|
103,579 |
|
|
0.59 |
|
|
Options granted |
|
128,000 |
|
|
26.83 |
|
— |
|
|
— |
|
— |
|
|
— |
|
|
Options exercised |
|
(43,000) |
|
|
21.81 |
|
(31,161) |
|
|
5.70 |
|
(10,720) |
|
|
0.59 |
|
|
Options canceled |
|
(58,318) |
|
|
25.98 |
|
(8) |
|
|
2.13 |
|
— |
|
|
— |
|
|
Outstanding at April 30, 2016 |
|
683,799 |
|
|
24.46 |
|
13,824 |
|
|
11.79 |
|
92,859 |
|
|
0.59 |
|
|
Options granted |
|
— |
|
|
— |
|
— |
|
|
— |
|
— |
|
|
— |
|
|
Options exercised |
|
(167,310) |
|
|
22.32 |
|
(9,601) |
|
|
11.79 |
|
(27,219) |
|
|
0.59 |
|
|
Options canceled |
|
(64,865) |
|
|
26.76 |
|
(4,223) |
|
|
11.79 |
|
— |
|
|
— |
|
|
Outstanding at April 30, 2017 |
|
451,624 |
|
|
24.92 |
|
— |
|
|
— |
|
65,640 |
|
|
0.59 |
|
|
Options exercisable at April 30, 2017 |
|
311,506 |
|
$ |
24.52 |
|
— |
|
$ |
— |
|
65,640 |
|
$ |
0.59 |
|
The total intrinsic value of all options exercised during the years ended April 30, 2017, 2016 and 2015 was approximately $1,801,000, $1,218,000, and $455,000, respectively. The intrinsic value of all options outstanding at April 30, 2017 and 2016 was $3,656,000 and $6,060,000, respectively. The intrinsic value of all exercisable options at April 30, 2017 and 2016 was $3,208,000 and $5,047,000, respectively.
89
A summary of the status of the Company’s non‑vested stock options as of April 30, 2016 and the year then ended is as follows:
|
|
|
|
|
Weighted |
|
|
|
|
|
|
|
Average |
|
|
|
|
|
|
|
Grant Date |
|
|
|
Non-vested Options |
|
Options |
|
Fair Value |
|
|
|
Non-vested at April 30, 2016 |
|
292,513 |
|
$ |
10.53 |
|
|
Granted |
|
— |
|
|
— |
|
|
Expired |
|
— |
|
|
— |
|
|
Canceled |
|
(60,619) |
|
|
10.71 |
|
|
Vested |
|
(91,776) |
|
|
10.07 |
|
|
Non-vested at April 30, 2017 |
|
140,118 |
|
$ |
10.76 |
|
As of April 30, 2017, there was approximately $8,248,000 of total unrecognized compensation cost related to non‑vested share‑based compensation awards granted under the equity plans. That cost is expected to be recognized over an approximately three‑year period or a weighted average period of approximately 2.4 years.
The weighted average fair value of options issued for the years ended April 30, 2016 and 2015 was $10.18 and $14.05, respectively. No options were granted during the fiscal year ended April 30, 2017. The total fair value of shares vesting during the years ended April 30, 2017, 2016 and 2015 was $3,332,000, $2,965,000 and $2,389,000, respectively.
Proceeds from all option exercises under all stock option plans for the years ended April 30, 2017, 2016 and 2015 were approximately $3,865,000, $1,122,000 and $722,000, respectively. The tax benefit realized from stock‑based compensation during the years ended April 30, 2017, 2016 and 2015 was approximately $0, $98,000, and $191,000, respectively.
The following tabulation summarizes certain information concerning outstanding and exercisable options at April 30, 2017:
|
|
|
|
|
|
Options Outstanding |
|
|
|
|
|
|
|||||
|
|
|
|
|
|
|
|
Weighted |
|
|
|
|
|
|
|
|
|
|
|
|
|
|
|
|
|
Average |
|
|
|
|
Options Exercisable |
|
|||
|
|
|
|
|
|
|
|
Remaining |
|
Weighted |
|
|
|
Weighted |
|
||
|
|
|
|
|
|
As of |
|
Contractual |
|
Average |
|
As of |
|
Average |
|
||
|
|
|
|
|
|
April 30, |
|
Life In |
|
Exercise |
|
April 30, |
|
Exercise |
|
||
|
Range of Exercise Prices |
|
2017 |
|
Years |
|
Price |
|
2017 |
|
Price |
|
|||||
|
$ |
0.59 |
- |
18.32 |
|
115,640 |
|
4.25 |
|
$ |
8.15 |
|
108,040 |
|
$ |
7.45 |
|
|
|
18.33 |
- |
22.90 |
|
98,000 |
|
4.56 |
|
|
19.87 |
|
74,000 |
|
|
19.97 |
|
|
|
22.91 |
- |
26.99 |
|
134,600 |
|
5.66 |
|
|
25.77 |
|
68,600 |
|
|
24.91 |
|
|
|
27.00 |
- |
29.26 |
|
100,000 |
|
5.70 |
|
|
28.00 |
|
80,000 |
|
|
28.18 |
|
|
|
29.27 |
- |
32.19 |
|
69,024 |
|
5.54 |
|
|
30.94 |
|
46,506 |
|
|
30.78 |
|
|
$ |
0.59 |
- |
32.19 |
|
517,264 |
|
5.13 |
|
$ |
21.83 |
|
377,146 |
|
$ |
20.36 |
|
The remaining weighted average contractual life of exercisable options at April 30, 2017 was 4.33 years.
90
Information related to the Company’s restricted stock awards at April 30, 2017 and for the year then ended is as follows:
|
|
|
Restated 2006 Plan |
|
|||
|
|
|
|
|
Weighted |
|
|
|
|
|
|
|
Average |
|
|
|
|
|
|
|
Grant Date |
|
|
|
|
|
Shares |
|
Fair Value |
|
|
|
Unvested stock at April 30, 2016 |
|
427,064 |
|
$ |
25.99 |
|
|
Stock granted |
|
126,557 |
|
|
25.33 |
|
|
Stock vested |
|
(134,270) |
|
|
24.82 |
|
|
Stock canceled |
|
(56,093) |
|
|
25.29 |
|
|
Unvested stock at April 30, 2017 |
|
363,258 |
|
$ |
26.30 |
|
13. Long‑Term Incentive Awards
On May 30, 2017, the Company granted an award under the Restated 2006 Plan to key employees. Each award generally consists of: (i) 50% of the target in time based restricted stock awards which vest in equal tranches in July 2017, July 2018 and July 2019, and (ii) 50% of the target in performance based restricted stock units. For the performance based awards, the performance period is the three‑year period ending April 30, 2019. A target payout was established at the award date. Each recipient was issued time based restricted stock awards on the award date generally equal to 50% of the award date target. The actual payout for the performance awards at the end of the performance period will be calculated based upon the Company’s achievement of established revenue and operating income targets for the performance period. Payouts of the performance awards will be made in shares of restricted stock units.
During the year ended April 30, 2016, the Company granted a three-year performance award under the Restated 2006 Plan to key employees. The performance period for each three-year award is the three‑year period ending April 30, 2018. A target payout was established at the award date. The actual payout at the end of the performance period will be calculated based upon the Company’s achievement of revenue and gross margin for the performance period. Payouts will be made in cash and restricted stock units. Upon vesting of the restricted stock units, the Company has the discretion to settle the restricted stock units in cash or stock.
During the year ended April 30, 2015, the Company granted a performance award under the Restated 2006 Plan to key employees. The performance period for the award is the three-years ended April 30, 2017. A target payout was established at the award date. The actual payout at the end of the performance period will be calculated based upon the Company’s achievement of revenue and gross margin for the fiscal year ended April 30, 2017. Payouts will be made in cash and restricted stock units. Upon vesting of the restricted stock units, the Company has the discretion to settle the restricted stock units in cash or stock. The revenue and operating targets under the plan were not achieved, and therefore, no amounts will be paid out on the 2015 long-term incentive awards.
The cash component of the award is accounted for as a liability. The equity component is accounted for as a stock‑based liability, as the restricted stock units may be settled in cash or stock solely at the discretion of the Company. At each reporting period, the Company reassesses the probability of achieving the performance targets. The estimation of whether the performance targets will be achieved requires judgment, and, to the extent actual results or updated estimates differ from the Company’s current estimates, the cumulative effect on current and prior periods of those changes will be recorded in the period estimates are revised.
During the years ended April 30, 2017, 2016 and 2015, the Company did not record any compensation expense for the long‑term incentive awards. At April 30, 2017 and 2016, the Company had an accrued liability of $0 for outstanding awards. At April 30, 2017, the maximum compensation expense that may be recorded for outstanding awards is $2,690,000.
91
14. Income Taxes
The components of income before income taxes are as follows (in thousands):
|
|
|
Year Ended April 30, |
|
|||||||
|
|
|
2017 |
|
2016 |
|
2015 |
|
|||
|
Domestic |
|
$ |
14,415 |
|
$ |
8,125 |
|
$ |
2,138 |
|
|
Foreign |
|
|
(206) |
|
|
(57) |
|
|
(245) |
|
|
Total |
|
$ |
14,209 |
|
$ |
8,068 |
|
$ |
1,893 |
|
The Company expects any foreign earnings to be reinvested in such foreign jurisdictions and, therefore, no deferred tax liabilities for U.S. income taxes on undistributed earnings are recorded. The foreign subsidiaries do not have any undistributed earnings.
A reconciliation of income tax expense computed using the U.S. federal statutory rates to actual income tax (benefit) expense is as follows:
|
|
|
Year Ended April 30, |
|
||||||
|
|
|
2017 |
|
|
2016 |
|
|
2015 |
|
|
U.S. federal statutory income tax rate |
|
34.0 |
% |
|
35.0 |
% |
|
35.0 |
% |
|
State and local income taxes, net of federal benefit |
|
(3.0) |
|
|
(15.3) |
|
|
(84.4) |
|
|
R&D and other tax credits |
|
(19.5) |
|
|
(49.9) |
|
|
(172.3) |
|
|
Valuation allowance |
|
6.4 |
|
|
17.1 |
|
|
96.7 |
|
|
Foreign rate differential |
|
0.2 |
|
|
— |
|
|
— |
|
|
Uncertain tax position adjustment |
|
— |
|
|
— |
|
|
(1.9) |
|
|
Return to provision adjustments |
|
(0.4) |
|
|
6.1 |
|
|
78.3 |
|
|
Permanent items |
|
(4.0) |
|
|
(2.6) |
|
|
(5.2) |
|
|
Other |
|
(1.4) |
|
|
(1.5) |
|
|
0.9 |
|
|
Effective income tax rate |
|
12.3 |
% |
|
(11.1) |
% |
|
(52.9) |
% |
The components of the (benefit) provision for income taxes are as follows (in thousands):
|
|
|
Year Ended April 30, |
|
|||||||
|
|
|
2017 |
|
2016 |
|
2015 |
|
|||
|
Current: |
|
|
|
|
|
|
|
|
|
|
|
Federal |
|
$ |
1,766 |
|
$ |
1,804 |
|
$ |
573 |
|
|
State |
|
|
129 |
|
|
154 |
|
|
(1,292) |
|
|
Foreign |
|
|
— |
|
|
— |
|
|
— |
|
|
|
|
|
1,895 |
|
|
1,958 |
|
|
(719) |
|
|
Deferred: |
|
|
|
|
|
|
|
|
|
|
|
Federal |
|
|
(451) |
|
|
(2,859) |
|
|
(1,972) |
|
|
State |
|
|
343 |
|
|
3 |
|
|
1,689 |
|
|
Foreign |
|
|
(35) |
|
|
|
|
|
|
|
|
|
|
|
(143) |
|
|
(2,856) |
|
|
(283) |
|
|
Total income tax (benefit) expense |
|
$ |
1,752 |
|
$ |
(898) |
|
$ |
(1,002) |
|
92
Significant components of the Company’s deferred income tax assets and liabilities are as follows (in thousands):
|
|
|
April 30, |
|
||||
|
|
|
2017 |
|
2016 |
|
||
|
Deferred income tax assets: |
|
|
|
|
|
|
|
|
Accrued expenses |
|
$ |
7,074 |
|
$ |
8,238 |
|
|
Allowances, reserves, and other |
|
|
1,801 |
|
|
1,330 |
|
|
Unrealized loss on securities |
|
|
74 |
|
|
119 |
|
|
Net operating loss and credit carry-forwards |
|
|
11,854 |
|
|
9,554 |
|
|
Intangibles basis |
|
|
43 |
|
|
416 |
|
|
Total deferred income tax assets |
|
|
20,846 |
|
|
19,657 |
|
|
Deferred income tax liabilities: |
|
|
|
|
|
|
|
|
Other |
|
|
(29) |
|
|
— |
|
|
Fixed asset basis |
|
|
(428) |
|
|
(395) |
|
|
Total deferred income tax liabilities |
|
|
(457) |
|
|
(395) |
|
|
Valuation allowance |
|
|
(5,416) |
|
|
(4,511) |
|
|
Net deferred tax assets |
|
$ |
14,973 |
|
$ |
14,751 |
|
At April 30, 2017 and 2016 the Company recorded a valuation allowance of $5,416,000 and $4,511,000, respectively, against state R&D credits as the Company is currently generating more tax credits than it will utilize in future years and against foreign net operating losses that are not more likely than not to be utilized. The valuation allowance increased by $905,000 and $1,383,000 for April 30, 2017 and April 30, 2016, respectively.
At April 30, 2017 the Company had state credit carryforwards of $18,173,000 that do not expire and federal tax credit carryforwards of $7,003,000 that expire in 2035.
At April 30, 2017, the Company had multiple state net operating loss carryforwards and had foreign losses of approximately $57,000 and $1,144,000, respectively. The state net operating loss carryforwards begin to expire in 2023. $1,017,000 of the foreign loss carryforwards begin to expire in 2019 with the remainder having an indefinite carryforward.
At April 30, 2017 and 2016, the Company had approximately $9,856,000 and $9,905,000, respectively, of unrecognized tax benefits all of which would impact the Company’s effective tax rate if recognized. The Company estimates that none of its unrecognized tax benefits will decrease in the next twelve months due to statute of limitation expiration.
The following table summarizes the activity related to the Company’s gross unrecognized tax benefits for the years ended April 30, 2017 and 2016 (in thousands):
|
|
|
April 30, |
|
||||
|
|
|
2017 |
|
2016 |
|
||
|
Balance as of May 1 |
|
$ |
9,905 |
|
$ |
8,190 |
|
|
Increases related to prior year tax positions |
|
|
3 |
|
|
581 |
|
|
Decreases related to prior year tax positions |
|
|
(26) |
|
|
— |
|
|
Increases related to current year tax positions |
|
|
901 |
|
|
1,144 |
|
|
Decreases related to lapsing of statute of limitations |
|
|
(927) |
|
|
(10) |
|
|
Balance as of April 30, |
|
$ |
9,856 |
|
$ |
9,905 |
|
93
The Company records interest and penalties on uncertain tax positions to income tax expense. As of April 30, 2017 and 2016, the Company had accrued approximately $16,000 and $55,000, respectively, of interest and penalties related to uncertain tax positions. The Company is currently under audit by various state jurisdictions but does not anticipate any material adjustments from these examinations. The tax years 2014 to 2017 remain open to examination by the IRS for federal income taxes. The tax years 2010 to 2017 remain open for major state taxing jurisdictions.
During the fiscal year ended April 30, 2017, the Company recorded a reversal of a $968,000 reserve, including the related interest, for uncertain tax positions due to the settlement of prior fiscal year audits.
15. Accumulated Other Comprehensive Loss
The components of accumulated other comprehensive loss are as follows (in thousands):
|
|
|
|
|
Total Accumulated |
|
||
|
|
|
|
|
|
Other |
|
|
|
|
|
Available-for-Sale |
|
Comprehensive |
|
||
|
|
|
Securities |
|
Loss |
|
||
|
Total accumulated other comprehensive loss balance as of April 30, 2016 |
|
$ |
(201) |
|
$ |
(201) |
|
|
Unrealized gains, net of $43 of taxes |
|
|
74 |
|
|
74 |
|
|
Total accumulated other comprehensive loss balance as of April 30, 2017 |
|
|
(127) |
|
|
(127) |
|
16. Changes in Accounting Estimates
During the years ended April 30, 2017, 2016 and 2015, the Company revised its estimates at completion of various fixed-price contracts which resulted in cumulative catch up adjustments during the year in which the change in estimate occurred. The change in estimate was a result of the Company changing the total costs required to complete the contracts due to having more accurate cost information as work progressed in subsequent periods on the various contracts. The changes in estimates resulted in cumulative catch-up adjustments to income from continuing operations for the years ended April 30, 2017, 2016 and 2015 that were not material.
Refer also to Note 9 – Warranty Reserves for further details of change in warranty estimates during the fiscal year ended April 30, 2017.
17. Related Party Transactions
Pursuant to a consulting agreement, the Company paid a board member approximately $80,000, $96,000 and $96,000 for fiscal years ended April 30, 2017, 2016 and 2015, respectively, for consulting services independent of his board service.
94
18. Commitments and Contingencies
Commitments
The Company’s operations are conducted in leased facilities. The Company finances the purchase of certain IT equipment and perpetual software licenses under capital lease arrangements. Following is a summary of non‑cancelable operating and capital lease commitments:
|
|
|
April 30, 2017 |
|||
|
|
|
(In thousands) |
|||
|
|
|
|
|
|
|
|
|
|
|
Operating leases |
|
Capital leases |
|
2018 |
|
$ |
3,492 |
$ |
304 |
|
2019 |
|
|
3,046 |
|
168 |
|
2020 |
|
|
2,888 |
|
— |
|
2021 |
|
|
2,042 |
|
— |
|
2022 |
|
|
1,648 |
|
— |
|
Thereafter |
|
|
2,631 |
|
— |
|
|
|
$ |
15,747 |
|
472 |
|
Less: amounts representing interest |
|
|
|
|
(23) |
|
Present value of capital lease obligations |
|
|
|
|
449 |
|
Less: Current portion |
|
|
|
|
(288) |
|
Long-term portion of capital lease obligations |
|
|
|
$ |
161 |
Rental expense under operating leases was approximately $4,612,000, $4,820,000 and $4,350,000 for the years ended April 30, 2017, 2016 and 2015, respectively.
Not included in the table above are future rental payments associated with a lease amendment executed by the Company on June 13, 2017 to amend and extend its existing lease for one of its administrative properties. The amendment extends the term of the lease until June 30, 2022 and provides a tenant improvement allowance of up to $420,332. Beginning July 1, 2017, base monthly rent under the Second Amendment will be $65,200, which amount shall increase by 2.5%, compounded annually, commencing July 1, 2018. In addition, the Company has two 5-year options to extend the term of lease at the end of the then-current term.
Contingencies
The Company is subject to legal proceedings and claims which arise out of the ordinary course of its business. Although adverse decisions or settlements may occur, the Company, in consultation with legal counsel, believes that the final disposition of such matters will not have a material adverse effect on the consolidated financial position, results of operations or cash flows of the Company.
At April 30, 2017 and 2016, the Company had outstanding letters of credit totaling $2,070,000 and $1,080,000, respectively.
Contract Cost Audits
Payments to the Company on government cost reimbursable contracts are based on provisional, or estimated indirect rates, which are subject to an annual audit by the Defense Contract Audit Agency, or DCAA. The cost audits result in the negotiation and determination of the final indirect cost rates that the Company may use for the period(s) audited. The final rates, if different from the provisional rates, may create an additional receivable or liability for the Company.
For example, during the course of its audits, the DCAA may question the Company’s incurred costs, and if the DCAA believes the Company has accounted for such costs in a manner inconsistent with the requirements under Federal Acquisition Regulations (“FAR”), the DCAA auditor may recommend to the Company’s administrative contracting officer to disallow such costs. Historically, the Company has not experienced material disallowed costs as a result of
95
government audits. However, the Company can provide no assurance that the DCAA or other government audits will not result in material disallowances for incurred costs in the future.
The Company’s revenue recognition policy calls for revenue recognized on all cost reimbursable government contracts to be recorded at actual rates unless collectability is not reasonably assured.
The Defense Contract Management Agency (“DCMA”) disallowed a portion of the Company’s executive compensation and/or other costs included in the Company’s fiscal 2006, 2007 and 2008 incurred cost claims and sought interest for all three years and penalties for fiscal 2006, based on the disallowed costs. The Company appealed these cost disallowances to the Armed Services Board of Contract Appeals. For fiscal 2006, as a result of partial settlements and a decision of the Armed Services Board of Contract Appeals in March 2016, the government’s remaining claims were dismissed with prejudice. All of the government’s claims related to the Company’s 2007 and 2008 incurred cost claims were settled as of October 2015 by payment to the government of $50,000 and the government’s claims related to the Company’s 2009 and 2010 incurred cost claims were settled as of October 2015 and April 2016, respectfully, without the payment of any consideration. During the fiscal year ended April 30, 2017, the Company settled rates for its incurred cost claims for fiscal years 2011 through 2014 without payment of any consideration.
As a result of the settlement agreements and the Armed Services Board of Contract Appeals ruling, the Company reversed reserves of $3,607,000 related to those fiscal years as a credit to cost of sales, allocated as $3,203,000 to the UAS segment and $404,000 to the EES segment during the fiscal year ended April 30, 2016. At April 30, 2017 and 2016, the Company did not have any remaining reserves for incurred cost claim audits.
19. Business Acquisitions
On February 1, 2017, the Company completed the acquisition of 36% of the common shares of Altoy for cash consideration of $625,000, which increased its interest from 49% to 85% and provided the Company with control over Altoy. As a result, Altoy became a consolidated subsidiary of the Company on the date of the acquisition. Altoy aims to market and distribute small UAS in Turkey. The Company previously accounted for its 49% interest in Altoy as an equity method investment. As a result of the acquisition, the Company is expected to expand the sales of its small UAS and related services in Turkey.
The following table summarizes the consideration transferred to acquire Altoy and the amounts of identified assets acquired and liabilities assumed at the acquisition date, as well as the fair value of the noncontrolling interest in Altoy at the acquisition date (in thousands):
|
|
|
|
|
|
|
Customer relationships |
|
$ |
1,600 |
|
|
Goodwill |
|
|
122 |
|
|
Trademark and trade names |
|
|
60 |
|
|
Deferred tax liability |
|
|
(332) |
|
|
Other assets and liabilities assumed |
|
|
286 |
|
|
Total net identified assets acquired |
|
$ |
1,736 |
|
|
|
|
|
|
|
|
Fair value of consideration transferred: |
|
|
|
|
|
Cash |
|
$ |
625 |
|
|
Fair value of the Company's investment in Altoy prior to the acquisition |
|
|
851 |
|
|
Fair value of the noncontrolling interest in Altoy |
|
|
260 |
|
|
Total |
|
$ |
1,736 |
|
96
As a result of the Company obtaining control over Altoy, the Company’s previously held 49% interest was remeasured to fair value, resulting in a gain of $584,000 which has been recognized in “other income (loss), net” on the consolidated statement of income.
The fair value of the noncontrolling interest of $260,000 and the fair value of the previously held equity interest of $851,000 in Aloy, immediately prior to the acquisition, were estimated by applying an income approach. These fair value measurements of the noncontrolling interest and the previously held equity interest are based on significant inputs not observable in the market, and thus represent Level 3 measurements.
The goodwill is attributable to the workforce of Altoy and expected future customers in the Turkey market. Goodwill is not tax deductible for tax purposes. All of the goodwill was assigned to the Company’s UAS segment.
Supplemental Pro Forma Information (unaudited)
Altoy contributed revenues of $0 and a net loss of $122,000 to the Company for the period from February 1, 2017 to April 30, 2017. The following unaudited pro forma summary presents consolidated information of the Company as if the business combination had occurred on May 1, 2015 (in thousands):
|
|
|
Fiscal year ended April 30, |
|
||||
|
|
|
2017 |
|
2016 |
|
||
|
Revenue |
|
$ |
265,220 |
|
$ |
264,301 |
|
|
Net income |
|
$ |
11,654 |
|
$ |
9,168 |
|
|
Net income attributable to AeroVironment |
|
$ |
11,734 |
|
$ |
9,239 |
|
The Company did not have any material, nonrecurring pro forma adjustments directly attributable to the business combination included in the reported pro forma revenue and earnings.
These pro forma amounts have been calculated after applying the Company’s accounting policies and adjusting the results of Altoy to reflect the additional amortization that would have been charged assuming the fair value adjustments to intangible assets had been applied from May 1, 2015, with the consequential tax effects.
The Company incurred approximately $74,000 of acquisition-related costs. These expenses are included in selling, general and administrative expense on the Company’s consolidated income statement for the fiscal year ended April 30, 2017 and are reflected in pro forma net income for the fiscal year ended April 30, 2016, in the table above.
The unaudited pro forma supplemental information is based on estimates and assumptions which we believe are reasonable and are not necessarily indicative of the results that have been realized had the acquisitions been consolidated in the tables above as of May 1, 2015.
20. Segment Data
The Company’s product segments are as follows:
|
· |
Unmanned Aircraft Systems—The UAS segment focuses primarily on the design, development, production, support and operation of innovative UAS and tactical missile systems that provide situational awareness, multi‑band communications, force protection and other mission effects to increase the security and effectiveness of the operations of the Company’s customers. |
|
· |
Efficient Energy Systems—The EES segment focuses primarily on the design, development, production, marketing, support and operation of innovative efficient electric energy systems that address the growing demand for electric transportation solutions. |
97
The accounting policies of the segments are the same as those described in Note 1, “Organization and Significant Accounting Policies.” The operating segments do not make sales to each other. Depreciation and amortization related to the manufacturing of goods is included in gross margin for the segments. The Company does not discretely allocate assets to its operating segments, nor does the CODM evaluate operating segments using discrete asset information. Consequently, the Company operates its financial systems as a single segment for accounting and control purposes, maintains a single indirect rate structure across all segments, has no inter‑segment sales or corporate elimination transactions, and maintains only limited financial statement information by segment.
The segment results are as follows (in thousands):
|
|
|
Year Ended April 30, |
|
|||||||
|
|
|
|
|
|
|
|
|
|
|
|
|
|
|
2017 |
|
2016 |
|
2015 |
|
|||
|
Revenue: |
|
|
|
|
|
|
|
|
|
|
|
UAS |
|
$ |
228,940 |
|
$ |
233,738 |
|
$ |
220,950 |
|
|
EES |
|
|
35,933 |
|
|
30,360 |
|
|
38,448 |
|
|
Total |
|
|
264,873 |
|
|
264,098 |
|
|
259,398 |
|
|
Cost of sales: |
|
|
|
|
|
|
|
|
|
|
|
UAS |
|
|
135,937 |
|
|
132,209 |
|
|
128,233 |
|
|
EES |
|
|
26,826 |
|
|
19,786 |
|
|
26,897 |
|
|
Total |
|
|
162,763 |
|
|
151,995 |
|
|
155,130 |
|
|
Gross margin: |
|
|
|
|
|
|
|
|
|
|
|
UAS |
|
|
93,003 |
|
|
101,529 |
|
|
92,717 |
|
|
EES |
|
|
9,107 |
|
|
10,574 |
|
|
11,551 |
|
|
Total |
|
|
102,110 |
|
|
112,103 |
|
|
104,268 |
|
|
Selling, general and administrative |
|
|
56,537 |
|
|
60,077 |
|
|
55,763 |
|
|
Research and development |
|
|
33,042 |
|
|
42,291 |
|
|
46,491 |
|
|
Income from operations |
|
|
12,531 |
|
|
9,735 |
|
|
2,014 |
|
|
Other income (expense): |
|
|
|
|
|
|
|
|
|
|
|
Interest income, net |
|
|
1,618 |
|
|
1,032 |
|
|
882 |
|
|
Other income (expense), net |
|
|
60 |
|
|
(2,699) |
|
|
(1,003) |
|
|
Income before income taxes |
|
$ |
14,209 |
|
$ |
8,068 |
|
$ |
1,893 |
|
Geographic Information
Sales to non‑U.S. customers accounted for 36%, 28% and 9% of revenue for each of the fiscal years ended April 30, 2017, 2016 and 2015, respectively.
21. Quarterly Results of Operations (Unaudited)
The following tables present selected unaudited consolidated financial data for each of the eight quarters in the two‑year period ended April 30, 2017. In the Company’s opinion, this unaudited information has been prepared on the same basis as the audited information and includes all adjustments (consisting of only normal recurring adjustments) necessary for a fair statement of the financial information for the period presented. The Company’s fiscal year ends on
98
April 30. Due to the fixed year end date of April 30, the first and fourth quarters each consist of approximately 13 weeks. The second and third quarters each consist of exactly 13 weeks. The first three quarters end on a Saturday.
|
|
|
Three Months Ended |
|
||||||||||
|
|
|
July 30, 2016 |
|
October 29, 2016 |
|
January 28, 2017 |
|
April 30, 2017 |
|
||||
|
|
|
(In thousands except per share data) |
|
||||||||||
|
Year ended April 30, 2017 |
|
|
|
|
|
|
|
|
|
|
|
|
|
|
Revenue |
|
$ |
36,218 |
|
$ |
50,116 |
|
$ |
53,163 |
|
$ |
125,376 |
|
|
Gross margin |
|
$ |
6,683 |
|
$ |
17,417 |
|
$ |
19,351 |
|
$ |
58,659 |
|
|
Net (loss) income attributable to AeroVironment |
|
$ |
(11,642) |
(1) |
$ |
(4,172) |
|
$ |
(2,183) |
|
$ |
30,476 |
(2) |
|
Net (loss) income per share attributable to AeroVironment—basic(6) |
|
$ |
(0.51) |
|
$ |
(0.18) |
|
$ |
(0.09) |
|
$ |
1.32 |
|
|
Net (loss) income per share attributable to AeroVironment—diluted(6) |
|
$ |
(0.51) |
|
$ |
(0.18) |
|
$ |
(0.09) |
|
$ |
1.30 |
|
|
|
|
Three Months Ended |
|
||||||||||
|
|
|
August 2, |
|
November 1, |
|
January 31, |
|
April 30, |
|
||||
|
|
|
2015 |
|
2015 |
|
2016 |
|
2016 |
|
||||
|
|
|
(In thousands except per share data) |
|
||||||||||
|
Year ended April 30, 2016 |
|
|
|
|
|
|
|
|
|
|
|
|
|
|
Revenue |
|
$ |
47,050 |
|
$ |
64,731 |
|
$ |
67,560 |
|
$ |
84,757 |
|
|
Gross margin |
|
$ |
16,023 |
|
$ |
31,533 |
(4) |
$ |
26,625 |
|
$ |
37,922 |
|
|
Net (loss) income |
|
$ |
(6,981) |
(3) |
$ |
4,419 |
|
$ |
6,164 |
(5) |
$ |
5,364 |
|
|
Net (loss) income per share—basic(6) |
|
$ |
(0.30) |
|
$ |
0.19 |
|
$ |
0.27 |
|
$ |
0.23 |
|
|
Net (loss) income per share—diluted(6) |
|
$ |
(0.30) |
|
$ |
0.19 |
|
$ |
0.27 |
|
$ |
0.23 |
|
|
(1) |
Includes the reversal of a $968,000 reserve, including the related interest, for uncertain tax positions due to the settlement of prior fiscal year tax audits. |
|
(2) |
Includes a gain of $0.6 million related to the acquisition of a controlling interest in our Turkish Joint Venture, Altoy, which was recorded to other income (expense), net in the consolidated statement of operations. |
|
(3) |
Includes an other-than-temporary-impairment loss of $2.2 million related to the Company’s investment in the CybAero shares which was recorded to other expense, net in the consolidated statement of operations. |
|
(4) |
Includes reversal of $3.5 million remaining reserve as a result of the settlement by the parties or the dismissal by the Armed Services Board of Contract Appeals of the government’s claims related to the Company’s incurred cost submittals for fiscal years 2006 through 2009 which was recorded as a credit to cost of sales. |
|
(5) |
Includes the impact of $0.9 million of out-of-period expenses related to sales and use tax and capital leases. |
|
(6) |
Earnings per share is computed independently for each of the quarters presented. The sum of the quarterly earnings per share may not equal the total earnings per share computed for the year due to rounding. |
99
SCHEDULE II—VALUATION AND QUALIFYING ACCOUNTS
|
|
|
|
|
|
Additions |
|
|
|
|
|
|
|
||||
|
|
|
Balance at |
|
Charged to |
|
Charged to |
|
|
|
|
Balance at |
|
||||
|
|
|
Beginning |
|
Costs and |
|
Other |
|
|
|
|
End of |
|
||||
|
Description |
|
of Period |
|
Expenses |
|
Accounts |
|
Deductions |
|
Period |
|
|||||
|
|
|
(In thousands) |
|
|||||||||||||
|
Allowance for doubtful accounts for the year ended April 30: |
|
|
|
|
|
|
|
|
|
|
|
|
|
|
|
|
|
2015 |
|
$ |
791 |
|
$ |
106 |
|
$ |
— |
|
$ |
(291) |
|
$ |
606 |
|
|
2016 |
|
$ |
606 |
|
$ |
178 |
|
$ |
— |
|
$ |
(522) |
|
$ |
262 |
|
|
2017 |
|
$ |
262 |
|
$ |
56 |
|
$ |
— |
|
$ |
(27) |
|
$ |
291 |
|
|
Warranty reserve for the year ended April 30: |
|
|
|
|
|
|
|
|
|
|
|
|
|
|
|
|
|
2015 |
|
$ |
1,280 |
|
$ |
2,919 |
|
$ |
— |
|
$ |
(1,546) |
|
$ |
2,653 |
|
|
2016 |
|
$ |
2,653 |
|
$ |
4,516 |
|
$ |
(424) |
|
$ |
(2,611) |
|
$ |
4,134 |
|
|
2017 |
|
$ |
4,134 |
|
$ |
3,079 |
|
$ |
— |
|
$ |
(3,982) |
|
$ |
3,231 |
|
|
Reserve for inventory excess and obsolescence for the year ended April 30: |
|
|
|
|
|
|
|
|
|
|
|
|
|
|
|
|
|
2015 |
|
$ |
3,234 |
|
$ |
2,035 |
|
$ |
— |
|
$ |
(681) |
|
$ |
4,588 |
|
|
2016 |
|
$ |
4,588 |
|
$ |
2,767 |
|
$ |
— |
|
$ |
(2,900) |
|
$ |
4,455 |
|
|
2017 |
|
$ |
4,455 |
|
$ |
2,040 |
|
$ |
— |
|
$ |
(1,245) |
|
$ |
5,250 |
|
|
Reserve for self-insured medical claims for the year ended April 30: |
|
|
|
|
|
|
|
|
|
|
|
|
|
|
|
|
|
2015 |
|
$ |
1,281 |
|
$ |
8,953 |
|
$ |
— |
|
$ |
(8,941) |
|
$ |
1,293 |
|
|
2016 |
|
$ |
1,293 |
|
$ |
9,213 |
|
$ |
— |
|
$ |
(9,330) |
|
$ |
1,176 |
|
|
2017 |
|
$ |
1,176 |
|
$ |
8,251 |
|
$ |
— |
|
$ |
(8,098) |
|
$ |
1,329 |
|
100
Item 9. Changes in and Disagreements with Accountants on Accounting and Financial Disclosure.
Not applicable.
Item 9A. Controls and Procedures.
Evaluation of Disclosure Controls and Procedures
We maintain disclosure controls and procedures that are designed to ensure that information required to be disclosed in our Exchange Act reports is recorded, processed, summarized and reported within the time periods specified in the SEC’s rules and forms, and that such information is accumulated and communicated to our management, including our Chief Executive Officer and Chief Financial Officer, as appropriate, to allow for timely decisions regarding required disclosure. In designing and evaluating the disclosure controls and procedures, management recognizes that any controls and procedures, no matter how well designed and operated, can only provide reasonable assurance of achieving the desired control objectives, and management is required to apply its judgment in evaluating the cost‑benefit relationship of possible controls and procedures. As required by Rule 13a‑15(b) under the Exchange Act, we have carried out an evaluation, under the supervision and with the participation of our management, including our Chief Executive Officer and our Chief Financial Officer, of the effectiveness of the design and operation of our disclosure controls and procedures. Based on the foregoing, our Chief Executive Officer and Chief Financial Officer concluded that, as of the end of the period covered by this report, our disclosure controls and procedures were effective and were operating at a reasonable level.
Management’s Report on Internal Control Over Financial Reporting
Our management is responsible for establishing and maintaining adequate internal control over financial reporting. Internal control over financial reporting is defined in Rules 13a‑15(f) and 15d‑15(f) promulgated under the Exchange Act as a process designed by, or under the supervision of, our principal executive and principal financial officers and effected by our board of directors, management and other personnel, to provide reasonable assurance regarding the reliability of financial reporting and the preparation of financial statements for external purposes in accordance with generally accepted accounting principles and includes those policies and procedures that:
|
· |
Pertain to the maintenance of records that in reasonable detail accurately and fairly reflect the transactions and dispositions of the assets of the Company; |
|
· |
Provide reasonable assurance that transactions are recorded as necessary to permit preparation of financial statements in accordance with generally accepted accounting principles, and that receipts and expenditures of the Company are being made only in accordance with authorizations of management and directors of the Company; and |
|
· |
Provide reasonable assurance regarding prevention or timely detection of unauthorized acquisition, use or disposition of the Company’s assets that could have a material effect on the financial statements. |
Because of its inherent limitations, internal control over financial reporting may not prevent or detect misstatements. Also, projections of any evaluation of effectiveness to future periods are subject to the risk that controls may become inadequate because of changes in conditions, or that the degree of compliance with the policies or procedures may deteriorate.
Under the supervision and with the participation of management, including our principal executive and financial officers, we assessed our internal control over financial reporting as of April 30, 2017, based on criteria for effective internal control over financial reporting established in Internal Control—Integrated Framework, issued by the Committee of Sponsoring Organizations of the Treadway Commission (2013 framework) (COSO). Based on this assessment, management concluded that the Company maintained effective internal control over financial reporting as of April 30, 2017 based on the specified criteria.
101
The effectiveness of our internal control over financial reporting as of April 30, 2017 has been audited by Ernst & Young LLP, an independent registered public accounting firm, as stated in their report which is included herein.
Changes in Internal Control over Financial Reporting
There were no changes in our internal control over financial reporting or in other factors identified in connection with the evaluation required by paragraph (d) of Exchange Act Rules 13a‑15 or 15d‑15 that occurred during the quarter ended April 30, 2017 that have materially affected, or are reasonably likely to materially affect, our internal control over financial reporting.
On June 26, 2017, we entered into an Amended and Restated Severance Protection Agreement (the “Severance Agreement”) with Teresa Covington, who was appointed our Senior Vice President and Chief Financial Officer effective March 1, 2017. The material terms of the Severance Agreement are as follows:
(a)The Severance Agreement expires on December 31, 2018, provided, however, that if a change in control (as that term is defined in the Severance Agreement) occurs during the term of the agreement, the term will be extended to the date that is 18 months after the date of the occurrence of such change in control.
(b)Upon termination of her employment by us without cause or by her for good reason (as those terms are defined in the Severance Agreement) within 18 months following a change in control, Ms. Covington is entitled to receive (i) her prorated bonus target for the year in which the termination occurs, (ii) a lump sum cash payment equal to 1.0x the sum of her base salary at the rate in effect on the termination date (or, if higher, the highest base salary rate in effect at any time during the 180-day period prior to a change in control), her annual target bonus for the year in which the termination occurs and 100% of her target payout under all outstanding long-term incentive plan awards, (iii) acceleration of vesting and exercisability of equity awards, (iv) the continuation of certain employee welfare plan benefits for her and her dependents and beneficiaries for a period of 12 months and (v) outplacement services for a period of 12 months, or if earlier, until the first acceptance by her of an offer of employment.
(c)If her employment is terminated by us without cause or by her for good reason, and a change in control occurs prior to the earlier of the date which is three (3) months following the termination date or February 14th of the calendar year following the year in which the termination date occurs, Ms. Covington is entitled to receive the benefits described in (b) above.
(d)Ms. Covington will receive the following severance benefits if her employment is terminated by us for any reason other than cause in a context that does not involve a change in control, or upon any termination by reason of her death or disability: (i) her prorated bonus target for the year in which the termination occurs, (ii) a lump sum payment in an amount equal to her base salary at the rate in effect on the termination date, and (iii) the continuation of certain employee welfare plan benefits for her and her dependents and beneficiaries for a period of 12 months.
To receive the severance benefits described above, Ms. Covington must execute a full release of any and all claims against us and comply with certain obligations specified in the agreement for 12 months following the termination date, including non-solicitation and non-disparagement obligations and continued compliance with the obligations under her patent and confidentiality agreement with us. Any waiver of any breach of such obligations must be approved by us.
The descriptions of the Indemnification Agreements, Consulting Agreement and Task Order Severance Agreement set forth in this Item 9B are is not complete and are is qualified in their its entirety by reference to the full text of the form of Indemnification Agreement and the full text of the Consulting Severance Agreement and the Task Order which are is filed as Exhibits 10.1, 10.31 and 10.32 36 to this Annual Report on Form 10-K and are is incorporated herein by reference.
102
REPORT OF INDEPENDENT REGISTERED PUBLIC ACCOUNTING FIRM
The Board of Directors and Stockholders of AeroVironment, Inc. and Subsidiaries
We have audited AeroVironment, Inc. and subsidiaries’ internal control over financial reporting as of April 30, 2017, based on criteria established in Internal Control—Integrated Framework issued by the Committee of Sponsoring Organizations of the Treadway Commission (2013 framework) (the COSO criteria). AeroVironment, Inc. and subsidiaries’ management is responsible for maintaining effective internal control over financial reporting, and for its assessment of the effectiveness of internal control over financial reporting included in the accompanying Management’s Report on Internal Control Over Financial Reporting. Our responsibility is to express an opinion on the company’s internal control over financial reporting based on our audit.
We conducted our audit in accordance with the standards of the Public Company Accounting Oversight Board (United States). Those standards require that we plan and perform the audit to obtain reasonable assurance about whether effective internal control over financial reporting was maintained in all material respects. Our audit included obtaining an understanding of internal control over financial reporting, assessing the risk that a material weakness exists, testing and evaluating the design and operating effectiveness of internal control based on the assessed risk, and performing such other procedures as we considered necessary in the circumstances. We believe that our audit provides a reasonable basis for our opinion.
A company’s internal control over financial reporting is a process designed to provide reasonable assurance regarding the reliability of financial reporting and the preparation of financial statements for external purposes in accordance with generally accepted accounting principles. A company’s internal control over financial reporting includes those policies and procedures that (1) pertain to the maintenance of records that, in reasonable detail, accurately and fairly reflect the transactions and dispositions of the assets of the company; (2) provide reasonable assurance that transactions are recorded as necessary to permit preparation of financial statements in accordance with generally accepted accounting principles, and that receipts and expenditures of the company are being made only in accordance with authorizations of management and directors of the company; and (3) provide reasonable assurance regarding prevention or timely detection of unauthorized acquisition, use or disposition of the company’s assets that could have a material effect on the financial statements.
Because of its inherent limitations, internal control over financial reporting may not prevent or detect misstatements. Also, projections of any evaluation of effectiveness to future periods are subject to the risk that controls may become inadequate because of changes in conditions, or that the degree of compliance with the policies or procedures may deteriorate.
In our opinion, AeroVironment, Inc. and subsidiaries maintained, in all material respects, effective internal control over financial reporting as of April 30, 2017, based on the COSO criteria.
We also have audited, in accordance with the standards of the Public Company Accounting Oversight Board (United States), the consolidated balance sheets of AeroVironment, Inc. and subsidiaries as of April 30, 2017 and 2016, and the related consolidated statements of income, comprehensive income, stockholders’ equity and cash flows for each of the three years in the period ended April 30, 2017 of AeroVironment, Inc. and subsidiaries and our report dated June 27, 2017 expressed an unqualified opinion thereon.
|
|
/s/ Ernst & Young LLP |
|
Los Angeles, California |
|
|
June 27, 2017 |
|
103
Item 10. Directors, Executive Officers, and Corporate Governance.
Certain information required by Item 401 and Item 405 of Regulation S‑K will be included in the definitive proxy statement for our 2017 Annual Meeting of Stockholders, which will be filed no later than 120 days after April 30, 2017, and that information is incorporated by reference herein.
Codes of Ethics
We have adopted a Code of Business Conduct and Ethics, or Code of Conduct. The Code of Conduct is posted on our website, http://investor.avinc.com. We intend to disclose on our website any amendments to, or waivers of, the Code of Conduct covering our Chief Executive Officer, Chief Financial Officer and/or Controller promptly following the date of such amendments or waivers. A copy of the Code of Conduct may be obtained upon request, without charge, by contacting our Secretary at (626) 357‑9983 or by writing to us at AeroVironment, Inc., Attn: Secretary, 800 Royal Oaks Drive, Suite 210, Monrovia, CA 91016. The information contained on or connected to our website is not incorporated by reference into this Annual Report and should not be considered part of this or any reported filed with the SEC.
No family relationships exist among any of our executive officers or directors.
There have been no material changes to the procedures by which security holders may recommend nominees to our board of directors.
The information required by Item 407(d)(4) and (5) of Regulation S‑K will be included in the definitive proxy statement for our 2017 Annual Meeting of Stockholders, and that information is incorporated by reference herein.
Item 11. Executive Compensation.
The information required by Item 402 and Item 407(e)(4) and (5) of Regulation S‑K will be included in the definitive proxy statement for our 2017 Annual Meeting of Stockholders, and that information is incorporated by reference herein.
Item 12. Security Ownership of Certain Beneficial Owners and Management and Related Stockholder Matters.
The information required by Item 201(d) and Item 403 of Regulation S‑K will be included in the definitive proxy statement for our 2017 Annual Meeting of Stockholders, and that information is incorporated by reference herein.
Item 13. Certain Relationships and Related Transactions, and Director Independence.
The information required by Item 404 and Item 407(a) of Regulation S‑K will be included in the definitive proxy statement for our 2017 Annual Meeting of Stockholders, and that information is incorporated by reference herein.
Item 14. Principal Accounting Fees and Services.
The information required by Item 14 of Form 10-K will be included in the definitive proxy statement for our 2017 Annual Meeting of Stockholders, and that information is incorporated by reference herein.
104
Item 15. Exhibits, Financial Statement Schedules.
|
(a) |
The following are filed as part of this Annual Report: |
1. Financial Statements
The following consolidated financial statements are included in Item 8:
|
· |
Report of Independent Registered Public Accounting Firm |
|
· |
Consolidated Balance Sheets at April 30, 2017 and 2016 |
|
· |
Consolidated Statements of Income for the Years Ended April 30, 2017, 2016 and 2015 |
|
· |
Consolidated Statements of Comprehensive Income for the Years Ended April 30, 2017, 2016 and 2015 |
|
· |
Consolidated Statements of Stockholders’ Equity for the Years Ended April 30, 2017, 2016 and 2015 |
|
· |
Consolidated Statements of Cash Flows for the Years Ended April 30, 2017, 2016 and 2015 |
|
· |
Notes to Consolidated Financial Statements |
2. Financial Statement Schedules
The following Schedule is included in Item 8:
|
· |
Schedule II—Valuation and Qualifying Accounts |
All other schedules have been omitted since the required information is not present, or not present in amounts sufficient to require submission of the schedule, or because the information required is included in the consolidated financial statements or the Notes thereto.
3. Exhibits
See Item 15(b) of this report below.
|
(b) |
Exhibits |
|
Exhibit |
|
Exhibit |
|
3.1(1) |
|
Amended and Restated Certificate of Incorporation of AeroVironment, Inc. |
|
3.3 (2) |
|
Third Amended and Restated Bylaws of AeroVironment, Inc. |
|
4.1(3) |
|
Form of AeroVironment, Inc.’s Common Stock Certificate |
|
10.1#(4) |
|
Form of Director and Executive Officer Indemnification Agreement |
|
10.2#(3) |
|
AeroVironment, Inc. Nonqualified Stock Option Plan |
|
10.3#(3) |
|
Form of Nonqualified Stock Option Agreement pursuant to the AeroVironment, Inc. Nonqualified Stock Option Plan |
|
10.4#(3) |
|
AeroVironment, Inc. Directors’ Nonqualified Stock Option Plan |
|
10.5#(3) |
|
Form of Directors’ Nonqualified Stock Option Agreement pursuant to the AeroVironment, Inc. Directors’ Nonqualified Stock Option Plan |
|
10.6#(3) |
|
AeroVironment, Inc. 2002 Equity Incentive Plan |
|
10.7#(3) |
|
Form of AeroVironment, Inc. 2002 Equity Incentive Plan Stock Option Agreement |
105
|
Exhibit |
|
Exhibit |
|
10.8#(3) |
|
AeroVironment, Inc. 2006 Equity Incentive Plan |
|
10.9#(5) |
|
AeroVironment, Inc. 2006 Equity Incentive Plan, as amended and restated effective September 29, 2012 |
|
10.10# |
|
AeroVironment, Inc. 2006 Equity Incentive Plan, as amended and restated effective September 30, 2016 |
|
10.11#(3) |
|
Form of Stock Option Agreement pursuant to the AeroVironment, Inc. 2006 Equity Incentive Plan |
|
10.12#(3) |
|
Form of Performance Based Bonus Award pursuant to the AeroVironment, Inc. 2006 Equity Incentive Plan |
|
10.13#(6) |
|
Form of Long‑Term Compensation Award Grant Notice and Long‑Term Compensation Award Agreement pursuant to the AeroVironment, Inc. 2006 Equity Incentive Plan |
|
10.14#(2) |
|
Form of Restricted Stock Award Grant Notice and Restricted Stock Award Agreement pursuant to the AeroVironment, Inc. 2006 Equity Incentive Plan |
|
10.15# |
|
Form of Performance Restricted Stock Unit Award Grant Notice and Performance Restricted Stock Unit Award Agreement pursuant to the AeroVironment, Inc. 2006 Equity Incentive Plan |
|
10.16(7) |
|
Standard Industrial/Commercial Single‑Tenant Lease, dated February 12, 2007, between AeroVironment, Inc. and OMP Industrial Moreland, LLC, for the property located at 85 Moreland Road, Simi Valley, California, including the addendum thereto |
|
10.17 |
|
First Amendment to Lease Agreement dated October 10, 2011 and Second Amendment to Lease Agreement dated June 2, 2017 by and between AeroVironment, Inc. and Simi Valley-NCR, LLC for the property located at 85 Moreland Road, Simi Valley, California |
|
10.18(8) |
|
Standard Industrial/Commercial Single‑Tenant Lease, dated March 3, 2008, between AeroVironment, Inc. and Hillside Associates III, LLC, for the property located at 900 Enchanted Way, Simi Valley, California, including the addendum thereto |
|
10.19(8) |
|
Standard Industrial/Commercial Single‑Tenant Lease, dated April 21, 2008, between AeroVironment, Inc. and Hillside Associates II, LLC, for the property located at 994 Flower Glen Street, Simi Valley, California, including the addendum thereto |
|
10.20(9) |
|
First Amendment to Lease Agreement (900 Enchanted Way, Simi Valley, CA 93065) dated as of December 1, 2013, by and between the Company and Hillside III LLC, and related agreements |
|
10.21(9) |
|
First Amendment to Lease Agreement (994 Flower Glen Street, Simi Valley, CA 93065) dated as of December 1, 2013, by and between the Company and Hillside II LLC, and related agreements |
|
10.22(9) |
|
Lease Agreement (996 Flower Glen Street, Simi Valley, CA 93065) dated as of December 1, 2013, by and between the Company and Hillside II LLC, and related agreements |
|
10.23(10) |
|
Standard Multi-Tenant Office Lease — Gross, dated September 24, 2015, between AeroVironment, Inc. and Monrovia Technology Campus LLC for property at 800 Royal Oaks Dr. Monrovia, California, including addendums thereto |
|
10.24#(3) |
|
Retiree Medical Plan |
|
10.25†(11) |
|
Award Contract, dated March 1, 2011, between AeroVironment, Inc. and United States Army Contracting Command |
|
10.26†(12) |
|
Contract modification P00015 dated September 5, 2013 under the base contract with the US Army Contracting Command—Redstone Arsenal (Missile) dated August 30, 2012 |
|
10.27†(13) |
|
Contract modification P00074 dated September 27, 2016 under the base contract with the US Army Contracting Command — Redstone Arsenal (Missile) dated August 30, 2012 |
|
10.28(14) |
|
Consulting Agreement, dated February 5, 2015, between Jikun Kim and AeroVironment, Inc. |
|
10.29#(15) |
|
Offer Letter, dated June 15, 2015 from AeroVironment, Inc. to Raymond D. Cook |
|
10.30#(16) |
|
Form of Severance Protection Agreement dated as of December 10, 2015, by and between AeroVironment, Inc. and each non-CEO executive officer |
106
|
Exhibit |
|
Exhibit |
|
10.31(16) |
|
Form of Director Letter Agreement by and between AeroVironment, Inc. and each non-employee director |
|
10.32#(17) |
|
Separation Agreement by and between AeroVironment, Inc. and Cathleen Cline dated as of April 28, 2016 |
|
10.33(17) |
|
Consulting Agreement by and between AeroVironment, Inc. and Cathleen Cline dated as of April 28, 2016 |
|
10.34(18) |
|
Severance Agreement and General Release by and between AeroVironment, Inc. and Raymond Cook dated as of December 19, 2016 |
|
10.35(3) |
|
Severance Protection Agreement dated as of May 2, 2016, by and between AeroVironment, Inc. and Wahid Nawabi |
|
10.36# |
|
Amended and Restated Severance Protection Agreement dated as of June 26, 2017, by and between AeroVironment, Inc. and Teresa Covington |
|
10.37(3) |
|
Consulting Agreement by and between AeroVironment, Inc. and Charles R. Holland executed as of March 7, 2016 |
|
10.38(3) |
|
Task Order #FY16-001 to Consulting Agreement by and between AeroVironment, Inc. and Charles R. Holland executed as of March 7, 2016 |
|
10.39 |
|
Amendment No. 1 dated November 28, 2016 and Amendment No. 2 dated June 7, 2017 to Standard Consulting Agreement and corresponding Task Orders by and between AeroVironment, Inc. and Charles R. Holland |
|
21.1 |
|
Subsidiaries of AeroVironment, Inc. |
|
23.1 |
|
Consent of Ernst & Young LLP, independent registered public accounting firm |
|
24.1 |
|
Power of Attorney (incorporated by reference to the signature page of this Annual Report) |
|
31.1 |
|
Certification Pursuant to Rule 13a‑14(a) or Rule 15d‑14(a) of the Securities Exchange Act of 1934 |
|
31.2 |
|
Certification Pursuant to Rule 13a‑14(a) or Rule 15d‑14(a) of the Securities Exchange Act of 1934 |
|
32.1 |
|
Certification Pursuant to 18 U.S.C. Section 1350, as adopted pursuant to Section 906 of the Sarbanes‑Oxley Act of 2002 |
|
101.INS |
|
XBRL Instance Document |
|
101.SCH |
|
XBRL Taxonomy Extension Schema Document |
|
101.CAL |
|
XBRL Taxonomy Calculation Linkbase Document |
|
101.DEF |
|
XBRL Taxonomy Extension Definition Linkbase Document |
|
101.LAB |
|
XBRL Taxonomy Label Linkbase Document |
|
101.PRE |
|
XBRL Taxonomy Presentation Linkbase Document |
|
(1) |
Incorporated by reference herein to the exhibits to the Company’s Quarterly Report on Form 10‑Q filed March 9, 2007 (File No. 001‑33261). |
|
(2) |
Incorporated by reference herein to the exhibits to the Company’s Annual Report on Form 10-K filed July 1, 2015 (File No. 001-33261). |
|
(3) |
Incorporated by reference herein to the exhibits to the Company’s Registration Statement on Form S‑1 (File No. 333‑137658). |
|
(4) |
Incorporated by reference herein to the exhibits to the Company’s Annual Report on Form 10 K filed on June 29, 2016 (File No. 001 33261). |
|
(5) |
Incorporated by reference to the exhibits to the Company’s Form 8‑K filed on October 5, 2011 (File No. 001‑33261). |
107
|
(6) |
Incorporated by reference herein to the exhibits to the Company’s Current Report on Form 8‑K filed July 28, 2010 (File No. 001‑33261). |
|
(7) |
Incorporated by reference herein to the exhibits on the Company’s Annual Report on Form 10‑K filed June 29, 2007 (File No. 001‑33261). |
|
(8) |
Incorporated by reference herein to the exhibits to the Company’s Annual Report on Form 10‑K filed June 26, 2008 (File No. 001‑33261). |
|
(9) |
Incorporated by reference herein to the exhibits to the Company's Quarterly Report on Form 10-Q filed December 9, 2015 (File No. 001-33261). |
|
(10) |
Incorporated by reference herein to the exhibits to the Company’s Quarterly Report on Form 10‑Q filed March 5, 2014 (File No. 001‑33261). |
|
(11) |
Incorporated by reference herein to the exhibits to the Company’s Annual Report on Form 10‑K filed on June 21, 2011 (File No. 001‑33261). |
|
(12) |
Incorporated by reference herein to the exhibits to the Company’s Quarterly Report on Form 10‑Q filed November 27, 2013 (File No. 001‑33261). |
|
(13) |
Incorporated by reference herein to the exhibits to the Company’s Quarterly Report on Form 10 Q filed December 7, 2016 (File No. 001 33261). |
|
(14) |
Incorporated by reference herein to the exhibits to the Company’s Current Report on Form 8‑K filed February 5, 2015 (File No. 001‑33261). |
|
(15) |
Incorporated by reference herein to the exhibits to the Company's Current Report on Form 8-K filed July 7, 2015 (File No. 001-33261). |
|
(16) |
Incorporated by reference herein to the exhibits to the Company's Quarterly Report on Form 10-Q filed March 9, 2016 (File No. 001-33261). |
|
(17) |
Incorporated by reference herein to the exhibits to the Company's Current Report on Form 8-K filed May 4, 2016 (File No. 001-33261). |
|
(18) |
Incorporated by reference herein to the exhibits to the Company’s Current Report on Form 8-K filed December 20, 2016 (File No. 001-33261). |
†Confidential treatment has been granted for portions of this exhibit.
#Indicates management contract or compensatory plan.
(c)Not applicable.
108
SIGNATURES
Pursuant to the requirements of Section 13 or 15(d) of the Securities Exchange Act of 1934, the Registrant has duly caused this report to be signed on its behalf by the undersigned, thereunto duly authorized.
|
|
AEROVIRONMENT, INC. |
|
|
|
|
|
|
Date: June 27, 2017 |
|
/s/ Wahid Nawabi |
|
|
By: |
Wahid Nawabi |
|
|
Its: |
Chief Executive Officer and President |
|
|
|
(Principal Executive Officer) |
POWER OF ATTORNEY
KNOW ALL PERSONS BY THESE PRESENTS, that each of the persons whose signature appears below hereby constitutes and appoints Wahid Nawabi and Teresa Covington, each of them acting individually, as his attorney‑in‑fact, each with full power of substitution, for him in any and all capacities, to sign any and all amendments to this Annual Report on Form 10‑K, and to file the same, with all exhibits thereto and other documents in connection therewith, with the Securities and Exchange Commission, granting unto said attorneys‑ in‑fact, and each of them, full power and authority to do and perform each and every act and thing requisite and necessary to be done in and about the premises as fully to all intents and purposes as he might or could do in person, hereby ratifying and confirming our signatures as they may be signed by our said attorney‑in‑fact and any and all amendments to this Annual Report on Form 10‑K.
Pursuant to the requirements of the Securities Exchange Act of 1934, this report has been signed below by the following persons on behalf of the Registrant and in the capacities and on the dates indicated.
|
Name |
Title |
Date |
||
|
|
|
|
|
|
|
/s/ Wahid Nawabi |
|
President, Chief |
|
June 27, 2017 |
|
Wahid Nawabi |
|
Executive Officer and Director |
|
|
|
|
|
(Principal Executive Officer) |
|
|
|
|
|
|
|
|
|
/s/ Teresa P. Covington |
|
Senior Vice President and |
|
June 27, 2017 |
|
Teresa P. Covington |
|
Chief Financial Officer (Principal |
|
|
|
|
|
Financial and Accounting Officer) |
|
|
|
|
|
|
|
|
|
/s/ Timothy E. Conver |
|
Chairman |
|
June 27, 2017 |
|
Timothy E. Conver |
|
|
|
|
|
|
|
|
|
|
|
/s/ Edward R. Muller |
|
Director |
|
June 27, 2017 |
|
Edward R. Muller |
|
|
|
|
|
|
|
|
|
|
|
/s/ Arnold L. Fishman |
|
Director |
|
June 27, 2017 |
|
Arnold L. Fishman |
|
|
|
|
|
|
|
|
|
|
|
/s/ Stephen F. Page |
|
Director |
|
June 27, 2017 |
|
Stephen F. Page |
|
|
|
|
|
|
|
|
|
|
|
/s/ Charles R. Holland |
|
Director |
|
June 27, 2017 |
|
Charles R. Holland |
|
|
|
|
|
|
|
|
|
|
|
/s/ Catharine Merigold |
|
Director |
|
June 27, 2017 |
|
Catharine Merigold |
|
|
|
|
|
|
|
|
|
|
|
/s/ Charles Thomas Burbage |
|
Director |
|
June 27, 2017 |
|
Charles Thomas Burbage |
|
|
|
|
109