UNITED STATES
SECURITIES AND EXCHANGE COMMISSION
Washington, D.C. 20549
FORM 8-K
CURRENT REPORT
Pursuant to Section 13 or 15(d) of the Securities Exchange Act of 1934
Date of Report (Date of earliest event reported): June 22, 2017
Santander Holdings USA, Inc.
(Exact name of registrant as specified in its charter)
Virginia | 1-16581 | 23-2453088 | ||||
(State or other Jurisdiction of Incorporation) | (Commission File Number) | (IRS Employer Identification No.) | ||||
75 State Street, Boston, Massachusetts | 02109 | |||||
(Address of Principal Executive Offices) | (Zip Code) | |||||
Registrant's telephone number, including area code: (617) 346-7200
N/A |
(Former name or former address if changed since last report.) |
Check the appropriate box below if the Form 8-K filing is intended to simultaneously satisfy the filing obligation of the registrant under any of the following provisions:
o Written communications pursuant to Rule 425 under the Securities Act (17 CFR 230.425)
o Soliciting material pursuant to Rule 14a-12 under the Exchange Act (17 CFR 240.14a-12)
o Pre-commencement communications pursuant to Rule 14d-2(b) under the Exchange Act (17 CFR 240.14d-2(b))
o Pre-commencement communications pursuant to Rule 13e-4(c) under the Exchange Act (17 CFR 240.13e-4(c))
Item 8.01 Other Events
Introduction
Santander Holdings USA, Inc. (the “Company” or "SHUSA") is a bank holding company ("BHC") in the U.S. with $137.4 billion in assets as of December 31, 2016. Headquartered in Boston, Massachusetts, the Company is the parent company of Santander Bank, National Association (“Santander Bank”), and owns a majority interest (approximately 59%) of Santander Consumer USA Holdings Inc. ("SC"), a specialized consumer finance company focused on vehicle financing and third-party servicing. Through these entities, the Company offers a full range of consumer and commercial banking products and services. SHUSA is a wholly-owned subsidiary of Banco Santander, S.A. (“Santander”). The Company has developed stress testing processes that capture its unique mix of businesses, risks and geographic footprint.
Dodd-Frank Act Stress Test Requirements
The Board of Governors of the Federal Reserve System (the “Federal Reserve”) requires BHCs with total consolidated assets of $50 billion or more to publish a summary of the annual Dodd-Frank Act Stress Test (“DFAST”) results based on the supervisory severely adverse scenario. The results are to reflect a standard set of capital actions over the nine-quarter forecast horizon (“DFAST Capital Actions”).
Forecast Approach
The Federal Reserve provides macroeconomic scenarios which BHCs are required to employ in their annual stress testing processes. A complete description of the most stressful scenario, the supervisory severely adverse scenario, and the corresponding macroeconomic variables, can be found on the Federal Reserve’s website.
The Company considers and evaluates all material risks facing the Company in its capital adequacy and stress testing processes including, but not limited to, the following:
• | Credit risk is the risk of loss arising from a borrower’s or counterparty’s failure to perform on an obligation. Credit risk at the Company is driven by real estate-related lending, large corporate exposures, individual consumer lending and automobile finance exposures. Credit risk is incorporated into our stress results primarily through credit-sensitive macroeconomic models. |
• | Operational risk is the risk of loss resulting from inadequate or failed internal processes, people, or systems, or external events. This risk is incorporated into our stress test results through macroeconomic models, increases in legal reserves and through specific adverse events considered in our forecast. |
• | Market risk is the risk to the Company’s financial condition from changes in interest rates or changes in the market value of assets and traded financial instruments, both on-balance sheet and off-balance sheet. Market risk impacts stress results through impairment of consumer assets as well as changes in net interest income and changes in the value of the investment portfolio. |
• | Liquidity risk is the risk arising from an inability to meet obligations as they come due in the normal course of business without causing undue hardship or incurring unacceptable loss. Liquidity risk is incorporated in the stress forecast through limited funding availability, increased cost of funds and credit rating downgrades. |
• | Business risk is the risk of decline in new loan volume originations and thereby the associated income-generating capacity of assets. The stress scenarios are characterized by recessionary environments with reduced economic activity, which results in less demand for loans by consumers and businesses. |
The Company employs various quantitative and qualitative methodologies in its stress tests for balance sheet, income statement, and capital projections. Where practical, the Company utilizes modeling techniques in developing its stress test estimates, including regression-based modeling, transition analytics, business analytics, and other objective, quantitative forecasting methodologies. When models are not used, non-model forecast tools are leveraged to prepare estimates. Forecasting methodologies, management overlays and final stress test results undergo multiple rounds of review and challenge. The Capital Plan is ultimately approved by the Company’s Board of Directors. Additional methodologies employed in developing the stress testing include:
• | Pre-provision Net Revenue (“PPNR”): PPNR forecasting methodology consists of multiple models, calculations and driver-based expert judgment analytical approaches used in conjunction to forecast individual line items for various components of the balance sheet and income statement. Forecasts for term loans and deposit balances as well as forecasts for yields and pricing generally leverage contractual terms for the existing portfolio, while new loans and deposits are forecasted using statistical regression models and expert judgment approaches. Non-interest income and expense items are forecasted primarily using driver-based analytical approaches utilizing modeled and expert judgment components. Net interest income is calculated based on contractual and projected interest rates applied to forecasted loan and deposit balances. |
• | Credit Loss Estimation: For the purposes of capital planning and loss forecasting, the Company has developed loss forecasting models driven by macroeconomic variables across the commercial, retail and automobile portfolios. Credit loss estimations drive changes in reserve levels and ultimately provisions. The forecast for provisions incorporates loss projections and target reserve coverage rates. |
• | Operational Loss Estimation: The Company utilizes statistical approaches to explicitly link operational losses to macroeconomic factors, based on both internal and external loss data and scenario analysis, to identify and evaluate the potential impacts from low-frequency, high-severity loss events linked to the Company’s risk profile. |
• | Capital and Risk-Weighted Assets: The methodologies described above translate identified risks into potential revenue and loss projections, which are aggregated into consolidated net income (loss) estimates over the nine-quarter planning horizon. These estimates then feed the Company’s regulatory capital estimation process. Regulatory capital and risk-weighted asset calculations are based on existing regulatory guidance, including Basel III transition provisions. The resulting regulatory capital ratios are continuously compared to management’s capital target levels, a process which is a key factor in the firm’s capital adequacy framework. |
Summary of Results
The results presented below contain forward-looking projections that represent estimates based on the supervisory severely adverse scenario, a hypothetical set of conditions provided by the Federal Reserve that involve an economic outcome that is more adverse than expected. These estimates are not forecasts of expected losses, revenues, net income or capital ratios.
Under the supervisory severely adverse scenario, the most significant drivers of the Company’s regulatory capital ratios and those of Santander Bank are reductions in capital, driven by higher credit losses and lower PPNR, and declines in total assets and risk-weighted assets. For both the Company and Santander Bank, in the supervisory severely adverse scenario, capital depletion has a more significant impact on capital ratios than the reduction in assets, resulting in a decline across all capital ratios.
The supervisory severely adverse scenario also leads to the following results:
• | Increases in credit losses and provisions that are associated with the more significant portfolios, such as retail mortgage, commercial and industrial, and commercial real estate at Santander Bank and automotive at SC; |
• | Stress impacts on PPNR that are driven by various factors including lower net interest income and fees caused by lower asset balances, net interest margin compression, and higher operational risk losses. Stress impact also includes higher depreciation and impairment expenses on operating lease assets. |
• | The decline in assets at the Company and Santander Bank are largely due to lower loan balances, while Santander Bank also forecasts reductions in automobile leases as well as cash and securities. |
The chart below shows the impact of these changes to SHUSA’s common equity tier 1 (“CET1”) ratio over the nine-quarter forecast horizon. The CET1 ratio decreases approximately 320 basis points from December 31, 2016 to March 31, 2019. The primary driver for this decrease is the $8.9 billion provision expense versus PPNR of $3.1 billion. Risk-weighted assets also decrease by $15 billion during the forecast, which offsets some of the decline in the CET1 ratio.
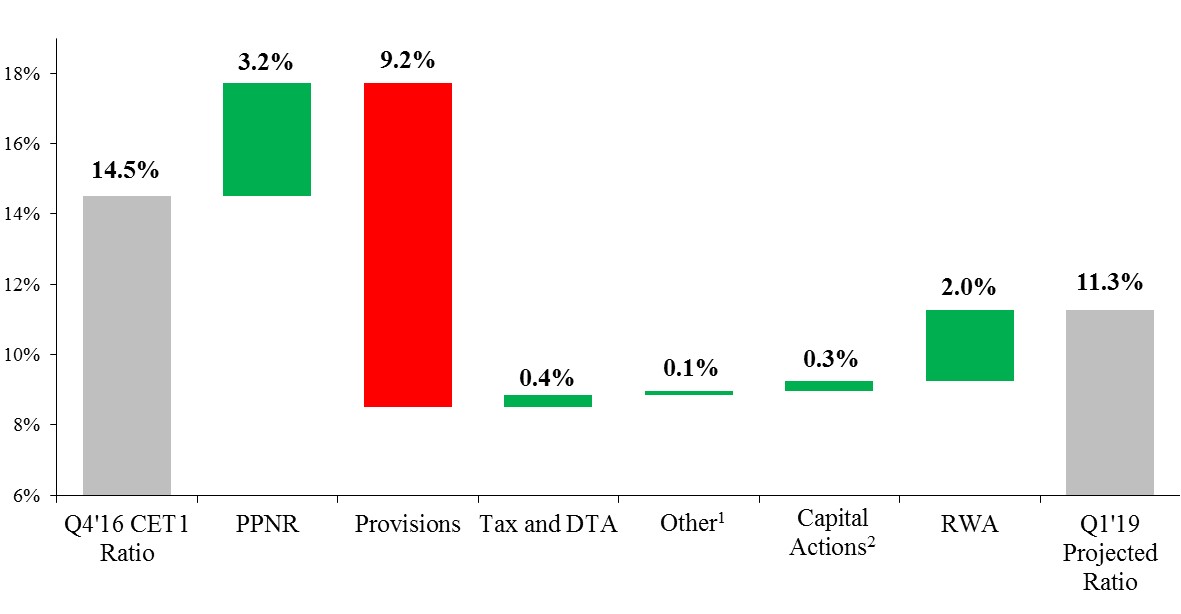
(1) Other includes the impact of intangible assets, as well as income allocated to minority interests
(2) Capital Actions include contributions associated with planned transactions in compliance with Regulation YY.
SHUSA
The estimates below reflect capital ratios for SHUSA under the “DFAST Capital Actions” described previously.
Table 1: SHUSA Actual and Projected Capital Ratios through Q1 2019
Actual Q4 2016 | Severely Adverse | ||||||||
Ending | Minimum | ||||||||
Common equity tier 1 capital (%) | 14.5 | % | 11.3 | % | 11.3 | % | |||
Tier 1 risk-based capital ratio (%) | 16.1 | % | 12.7 | % | 12.7 | % | |||
Total risk-based capital ratio (%) | 18.0 | % | 14.5 | % | 14.5 | % | |||
Tier 1 leverage ratio (%) | 12.5 | % | 10.4 | % | 10.4 | % | |||
Table 2: SHUSA Actual and Projected Risk-Weighted Assets through Q1 2019
Actual Q4 2016 | Q1 2019 | |||||||
Risk-weighted assets ($bn)1 | $ | 104.3 | $ | 89.3 | ||||
(1) Risk-weighted assets are calculated under the transition rules for the Basel III standardized approach.
Table 3: SHUSA Projected Losses, Revenues, and Net Income through Q1 2019
Severely Adverse | |||||||
$bn | % of average assets1 | ||||||
Pre-provision net revenue2 | $ | 3.1 | 2.5 | % | |||
Other revenue | — | ||||||
Less | |||||||
Provisions | 8.9 | ||||||
Realized gains (losses) on securities available-for-sale ("AFS") / held to maturity ("HTM") | — | ||||||
Total trading and counterparty losses | — | ||||||
Total other losses | 0.0 | ||||||
Equals | |||||||
Net income (loss) before taxes, extraordinary items and minority interest 3 | $ | (5.8 | ) | (4.6 | )% | ||
(1) Average assets is the nine-quarter average of total assets.
(2) PPNR includes losses from operational risk events, mortgage repurchase expenses, and other real estate owned costs.
(3) Total may not sum due to rounding of line items.
Table 4: SHUSA Projected Loan Losses by Loan Type Q1 2017 through Q1 2019
Severely Adverse | |||||||
$bn | Portfolio Loss Rates (%)1 | ||||||
Loan losses 2 | $ | 9.3 | 11.6 | % | |||
First lien mortgages | 0.2 | 3.5 | % | ||||
Junior liens and home equity lines of credit ("HELOCs") | 0.2 | 2.5 | % | ||||
Commercial and industrial3 | 0.8 | 4.9 | % | ||||
Commercial real estate | 0.9 | 5.2 | % | ||||
Credit cards | 0.1 | 21.7 | % | ||||
Other consumer4 | 7.1 | 26.0 | % | ||||
Other loans | 0.1 | 1.0 | % | ||||
(1) Average loan balances used to calculate portfolio loss rates exclude loans held-for-sale and loans held-for-investment under the fair value option, and are calculated over nine quarters.
(2) Total may not sum due to rounding of line items.
(3) Commercial and industrial loans include small- and medium-enterprise loans.
(4) Other consumer loans include student loans and automobile loans.
Santander Bank
The estimates below reflect capital ratios for Santander Bank under the DFAST Capital Actions described previously.
Table 5: Santander Bank Actual and Projected Capital Ratios through Q1 2019
Actual Q4 2016 | Severely Adverse | ||||||||
Ending | Minimum | ||||||||
Common equity tier 1 capital (%) | 16.2 | % | 13.4 | % | 13.4 | % | |||
Tier 1 risk-based capital ratio (%) | 16.2 | % | 13.4 | % | 13.4 | % | |||
Total risk-based capital ratio (%) | 17.4 | % | 14.3 | % | 14.3 | % | |||
Tier 1 leverage ratio (%) | 12.3 | % | 11.3 | % | 11.3 | % | |||
Table 6: Santander Bank Actual and Projected Risk-Weighted Assets through Q1 2019
Actual Q4 2016 | Q1 2019 | |||||||
Risk-weighted assets ($bn)1 | $ | 61.9 | $ | 55.1 | ||||
(1) Risk-weighted assets are calculated under the transition rules for the Basel III standardized approach.
SIGNATURE
Pursuant to the requirements of the Securities Exchange Act of 1934, the registrant has duly caused this report to be signed on its behalf by the undersigned hereunto duly authorized.
Dated: June 22, 2017 | SANTANDER HOLDINGS USA, INC. By:/s/ Madhukar Dayal Name: Madhukar Dayal Title: Chief Financial Officer and Senior Executive Vice President |