Attached files
| file | filename |
|---|---|
| 8-K - 8-K - AGILYSYS INC | form8-kinvestorpresentatio.htm |

Investor Presentation
June 2017

TECHNOLOGY | INNOVATION | SOLUTIONS
Forward-looking Statements & Non-GAAP
Financial Information
Forward-Looking Language
This presentation contains "forward-looking statements" within the meaning of the safe harbor provisions of the U.S. Private
Securities Litigation Reform Act of 1995. Forward-looking statements can be identified by words such as: "anticipate," "intend,"
"plan," "goal," "seek," "believe," "project," "estimate," "expect," "strategy," "future," "likely," "may," "should," "will" and similar
references to future periods. Examples of forward-looking statements include, among others, statements regarding operating
results, such as revenue growth and profitability, market demand, cost efficiencies, and strategy for growth, product
development, customer service and market position. Forward-looking statements are neither historical facts nor assurances of
future performance. Instead, they are based only on our current beliefs, expectations and assumptions regarding the future of
our business, future plans and strategies, projections, anticipated events and trends, the economy and other future conditions.
Because forward-looking statements relate to the future, they are subject to inherent uncertainties, risks and changes in
circumstances that are difficult to predict and many of which are outside of our control. Our actual results and financial
condition may differ materially from those indicated in the forward-looking statements. Therefore, you should not rely on any of
these forward-looking statements. Important factors that could cause our actual results and financial condition to differ
materially from those indicated in the forward-looking statements include, among others, our ability to achieve operational
efficiencies and meet customer demand for products and services and the risks described in the Company's filings with the SEC,
including the risk factors set forth in Item 1A of the our Annual Report for the fiscal year ended March 31, 2017, which may be
accessed at www.sec.gov or www.agilysys.com. Any forward-looking statement made in this presentation is based only on
information currently available to us and speaks only as of the date on which it is made. We undertake no obligation to publicly
update any forward-looking statement that may be made from time to time, whether written or oral, whether as a result of new
information, future developments or otherwise.
Use of Non-GAAP Financial Information
To supplement the unaudited condensed consolidated financial statements presented in accordance with U.S. GAAP in this
presentation, we use adjusted earnings from operation, a non-GAAP financial measure as defined by the SEC rules. We believe
that such information can enhance understanding of the company's ongoing operations. See the tables on slide 19 for
reconciliations to the comparable GAAP measures.
2

WHO WE ARE AND WHAT WE DO
3

TECHNOLOGY | INNOVATION | SOLUTIONS
We Provide Leading Hospitality Solutions
Lodging Solutions
~250k rooms at 3/31/17,
+4% since 3/31/16
F&B Solutions
~40k end points at 3/31/17,
+12% since 3/31/16
POINT-OF-SALE 57%
of Revenue
23%
of Revenue
DOCUMENT
MANAGEMENT
10%
of Revenue
INVENTORY &
PROCUREMENT
3%
of Revenue
6%
of Revenue
1%
of Revenue
WORKFORCE
MANAGEMENT
rGUEST PRODUCTS:
PAY, SEAT & ANALYZE
PROPERTY
MANAGEMENT
Note: Revenue contribution figures represent percentage
for the twelve months ended March 31, 2017
4

TECHNOLOGY | INNOVATION | SOLUTIONS
Gaming
Hotels, Resorts and Cruise
Food Service
Restaurants, Universities, Stadia and Healthcare
We Serve Leading Hospitality Brands
5
Note: Revenue contribution figures represent percentage of revenue for the twelve months ended March 31, 2017
51%
21%
17%
11%
Revenue Mix by Market
Gaming Hotels/Resorts/Cruise Food Service RUSH

TECHNOLOGY | INNOVATION | SOLUTIONS
Our Solutions Support The Full Guest Experience
Dining Experience
Lodging Experience
HOTEL
Discover
Imagine
Book
Arrive
Depart
Reflect
and
Share
Enjoy
Pay
Consume
Inspire
Guest
Customers are shopping for memorable experiences
When expectations are met, a virtuous cycle begins, with experiences being shared again and again
6

TECHNOLOGY | INNOVATION | SOLUTIONS
Addressing the Guest Experience Lifecycle
Optimize Operations,
Reduce Costs
Personalized Service,
Increase Lifetime Value
Guest Recruitment,
Increase Sales
Wallet Share Growth,
Improve Profitability
7

TECHNOLOGY | INNOVATION | SOLUTIONS
Agilysys Products
rGuest Well-Established Partner
Food &
Beverage
Lodging
Cross-
Functional
8

TECHNOLOGY | INNOVATION | SOLUTIONS
Agilysys Competitive Position
Hardware Centric
• Significant
revenue
from
hardware
Software Centric
• Majority of
revenue
from
software
Point Solutions
• Represents all or majority of revenue
• Some related modules
Hospitality Suite
• POS & PMS
• Broad solution coverage
/
9
All trademarks and registered trademarks are the property of their respective owners.

TECHNOLOGY | INNOVATION | SOLUTIONS
What Makes Agilysys Different?
Market-leading hospitality knowledge
coupled with top technology talent
Competitive
Strengths
Scalability
Support deployments from single lane
café (POS) to 100K+ room enterprise
(PMS) on a single instance
Scalability &
Enterprise Structure
Scalability
Only industry we address; proven
service and satisfaction has led to
industry-leading average customer life
of over ten years
Hospitality Customer
Focused
Scalability
Successfully running mission critical
operations for high-profile accounts
with 99.9% uptime
Stability Scalability
Handle disconnected scenarios for
weeks at a time
Offline Capabilities
Scalability
Full-service platform that enables
enterprise integration and unfettered
data access
Integration & Access
10

TECHNOLOGY | INNOVATION | SOLUTIONS
Strategic & Tactical Initiatives
• Achieving added leverage from our significant competitive advantages and resources.
• Increasing investments in crucial growth areas without any significant impact on overall
spend in percentage of revenue terms. Expect to increase R&D resources by about 40% in
FY18, without any significant ramp-up in overall R&D spend as a percentage of revenue.
• Improve our overall financial performance including accelerating revenue growth and achieving
profitability.
• By operating more efficiently, expect to exit FY18 with positive adjusted earnings from
operations run rate and expect to generate cash starting in FY19.
• Focused on positioning company to achieve significantly higher revenue and profitability
growth beginning in FY19.
• Improving product and solutions delivery velocity.
• Customers want to do more business with Agilysys leading to internal focus on delivering the
products and solutions they require at a faster pace.
• Expanding ability to address potential in new geographical markets including Asia and Europe.
• Recently hired experienced executives to lead APAC and EMEA operations.
• Expansion in R&D capacity will help drive product availability to address more international
markets.
• India Development Center will support expansion of business in Asia.
11

TECHNOLOGY | INNOVATION | SOLUTIONS
Business Transformation & Customer Service
• Business Transformation
• Driving efficiency & cost savings
• High performance execution
• Innovation in all areas
• Focus on Great Customer Service
• The heart of everything we do
• Spending more face time with customers
• Listening to their business needs & solution concerns
• Sharing our product roadmaps & inviting input
• Duplicate our success in Gaming across other verticals
12

TECHNOLOGY | INNOVATION | SOLUTIONS
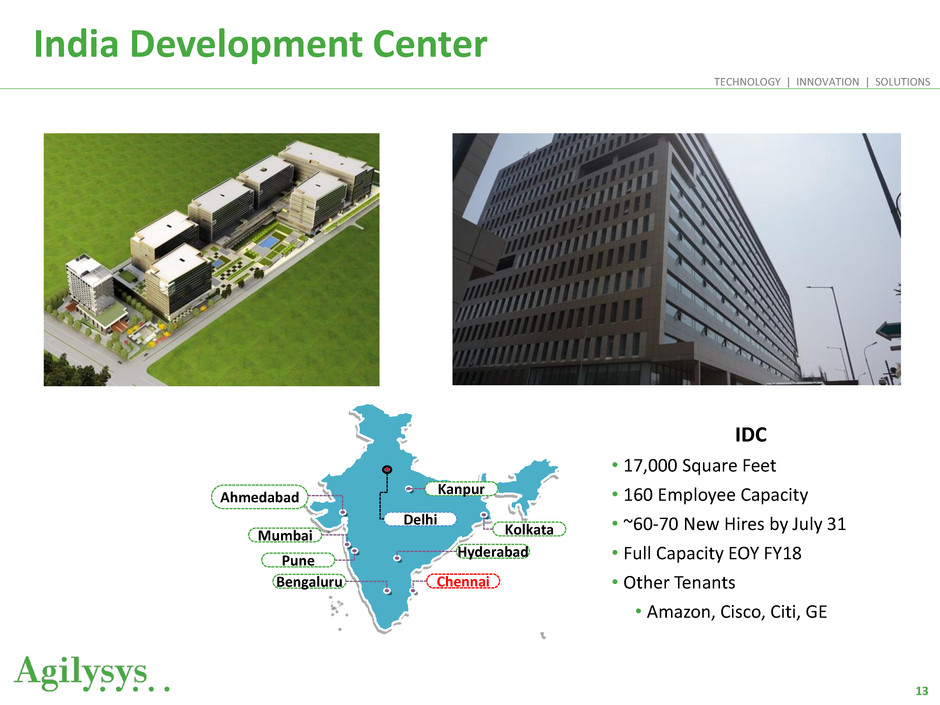
India Development Center
13
Delhi
Chennai
Kolkata Mumbai
Pune
Bengaluru
Hyderabad
Kanpur
Ahmedabad
IDC
• 17,000 Square Feet
• 160 Employee Capacity
• ~60-70 New Hires by July 31
• Full Capacity EOY FY18
• Other Tenants
• Amazon, Cisco, Citi, GE

FINANCIAL OVERVIEW
14

TECHNOLOGY | INNOVATION | SOLUTIONS
Evolving Business, Evolving P&L
Financial Metrics and Valuation
Share Price (6/16/17) $9.61
Diluted Shares Outstanding 22.6M
Diluted Market Capitalization $217M
Cash (as of 3/31/17) $49.3M
Debt (as of 3/31/17) $0.2M
Enterprise Value $168M
Revenue $127.7M
Gross Profit $63.8M
Adjusted EBITDA^ $4.5M
Adjusted Operating Loss^ ($11.6M)
Earnings per Share ($0.52)
EV/Revenue 1.3x
EV/Gross Profit 2.6x
Business Metrics (as of 3/31/17)
Direct POS End Points Managed
Y/Y Growth
~40k
12%
Direct Hotel Rooms Managed
Y/Y Growth
~250k
4%
Recurring Revenue
As % of Total Revenue
50%
Subscription Revenue
As % of Recurring Revenue
24%
Subscription Revenue Growth Y/Y 44%
rGuest as % of Total Revenue 6%
New Customer Count 124
^Non-GAAP measure, see reconciliation on slide 19.
15

TECHNOLOGY | INNOVATION | SOLUTIONS
Diversified Revenue Base
51%
21%
17%
11%
Gaming Hotels & Resorts Food Service RUSH
38%
30%
20%
12%
Support Products Professional Services Subscription
94%
6%
Iconic rGuest
Revenue by Market Vertical* Revenue by Type*
Revenue by Solution Type*
*For the fiscal year ended March 31, 2017
16

TECHNOLOGY | INNOVATION | SOLUTIONS
Strong Balance Sheet
Consolidated Balance Sheet (in thousands)
March 31, 2016 March 31, 2017
Cash, cash equivalents and marketable securities $60,608 $49,255
Other current assets 34,893 24,265
Long-term assets 89,656 93,785
Total assets $185,157 $167,305
Current liabilities $54,100 $46,337
Other liabilities 7,584 7,299
Total liabilities $61,684 $53,636
Shareholders’ equity 123,473 113,669
Total liabilities and shareholders’ equity $185,157 $167,305
17

TECHNOLOGY | INNOVATION | SOLUTIONS
Historical Financial Results
All numbers in thousands, except per share data
*FY14 results reflect the sale of RSG and UK entity as discontinued operations
^ Non-GAAP measure, see reconciliation on slide 19
$101,261 $103,514
$120,366
$127,678
$0
$20,000
$40,000
$60,000
$80,000
$100,000
$120,000
$140,000
FY14 FY15 FY16 FY17
Revenue *
($9,773)
($19,289)
($16,661)
($11,569)
($25,000)
($20,000)
($15,000)
($10,000)
($5,000)
$0
FY14 FY15 FY16 FY17
Adjusted Earnings from Operations^
$6,450
$1,174
$4,287 $4,478
$0
$1,000
$2,000
$3,000
$4,000
$5,000
$6,000
$7,000
FY14 FY15 FY16 FY17
Adjusted EBITDA^
($2,895)
($11,497)
($3,765)
($11,721)
($14,000)
($12,000)
($10,000)
($8,000)
($6,000)
($4,000)
($2,000)
$0
FY14 FY15 FY16 FY17
Loss from Continuing Operations *
18

TECHNOLOGY | INNOVATION | SOLUTIONS
Non-GAAP Reconciliation
19
2017 2016 2015 2014
Net loss (11,721)$ (3,765)$ (11,497)$ (2,895)$
Income tax expense (benefit) 236 6 (1,054) (2,491)
Loss before taxes (11,485) (3,759) (12,551) (5,386)
Depreciation of fixed assets 2,409 2,199 2,225 2,074
Amortization of intangibles 1,392 1,243 3,461 6,414
Amortization of developed technology 8,012 1,022 1,294 327
Interest (income) expense (147) (63) (62) 61
EBITDA (b) 181 642 (5,633) 3,490
Share-based compensation 2,427 3,405 3,141 2,119
Restructuring, severance and other charges 1,561 283 1,482 1,377
Asset write-offs and other fair value adjustments - 180 1,836 327
Other non-operating (income) expense 224 (491) 146 (863)
Legal settlements 85 268 203 -
Adjusted EBITDA (a) 4,478$ 4,287$ 1,174$ 6,450$
Capital expenditures (4,158) (5,900) (4,650) (4,023)
Capitalized software development costs (11,888) (15,048) (15,813) (12,200)
Adjusted Earnings from Operations (c) (11,568)$ (16,661)$ (19,288)$ (9,773)$
(a) Adjusted EBITDA, a non-GAAP financial measure, is defined as income before income taxes, interest expense (net of interest income),
depreciation and amortization (including amortization of developed technology), and excluding charges relating to i) legal settlements,
ii) restructuring, severance, and other charges, iii) asset write-offs and other fair value adjustments, iv) share-based compensation, and
v) other non-operating (income) expense
(b) EBITDA is defined as net income before income taxes, interest expense, depreciation and amortization
(c) Adjusted Earnings from Operations, a non-GAAP financial measure, is defined as Adjusted EBITDA,
less capital expenditures and capitalized software development costs
AGILYSYS, INC.
RECONCILIATION OF NET LOSS TO ADJUSTED EARNINGS FROM OPERATIONS
(UNAUDITED)
(In thousands)
Twelve Months Ended
March 31

TECHNOLOGY | INNOVATION | SOLUTIONS
Spend and Spend as % of Revenue
$10,000
$15,000
$20,000
$25,000
$30,000
FY14 FY15 FY16 FY17
Spend for PD, S&M, and G&A
(GAAP)
Product Development
Sales and Marketing
General and Administrative
10%
15%
20%
25%
30%
FY14 FY15 FY16 FY17
Spend as a % of Revenue for PD,
S&M, and G&A (GAAP)
Product Development
Sales and Marketing
General and Administrative
20

TECHNOLOGY | INNOVATION | SOLUTIONS
Cash Flow
FY17 FY16 FY15 FY14
Operating activities
(Loss) income from continuing operations (11,721)$ (3,765)$ (11,497)$ (2,895)$
Non cash adjustments, restructuring, legal settlements 14,110$ 7,741$ 10,117$ 10,024$
Changes in assets & liabilities 1,044$ 3,242$ (806)$ (5,745)$
Net cash provided by (used in) operating activities 3,433$ 7,218$ (2,186)$ 1,384$
Investing activities
Property & equipment (4,158)$ (5,900)$ (4,650)$ (4,023)$
Capitalized developed software (11,888)$ (15,048)$ (15,813)$ (12,200)$
Investments 2,181$ (65)$ 1,771$ (87)$
(Acquistions) & Divestitures -$ -$ (2,941)$ 34,034$
Net cash provided by (used in) investing activities (13,865)$ (21,013)$ (21,632)$ 17,724$
Net cash provide by (used in) financing activities (847)$ (577)$ (401)$ (883)$
Effect of exchange rate (74)$ (87)$ (280)$ (44)$
Increase (decrease) in cash & cash equivalents-cont ops (11,353)$ (14,459)$ (24,499)$ 18,181$
Increase (decrease) in cash & cash equivalents-disc ops -$ -$ -$ (1,546)$
Cash & cash equivalents - beginning of period 60,608$ 75,067$ 99,566$ 82,931$
Cash & cash equivalents - end of period 49,255$ 60,608$ 75,067$ 99,566$
21

TECHNOLOGY | INNOVATION | SOLUTIONS
Great Market Opportunity
Type Terminal
s
Rooms Terminals Rooms Terminal
s
Rooms Terminals Rooms Terminal
s
Rooms
aming $10 $10 $20 $20 $40 $30 $5 $5 $90 $100
HRC $200 $500 $300 $600 $200 $400 $20 $50 $700 $1,500
FSM High End $10 $20 $20 $5 $50
Food Services $700 $400 $1,000 $300 $2,400
Total ARR Market
Opportunity
$920 $510 $740 $620 $1,260 $430 $330 $55 $3,240 $1,600
Total Geography
APAC EMEA North America South America Total
$1,430 $1,360 $1,690 $385 $4,840
($ in millions)
Agilysys Revenue ~ $130M
Product roadmap significantly expands total addressable market
Industry growth expected at 5-7% annually (commissioned IHL and STR study)
22

TECHNOLOGY | INNOVATION | SOLUTIONS
$128
$148
$168
$188
$208
$228
$248
$268
$288
FY17 FY18 FY19 FY20 FY21
Mill
io
n
s
Revenue Possibilities
20% CAGR 15% CAGR 10% CAGR
Estimated 10%-20% Four-Year Revenue Growth CAGR
Adjusted Earnings from
Operations 10%-15% of
Revenue in FY2020 is
Possible
23

TECHNOLOGY | INNOVATION | SOLUTIONS
Fiscal 2018 Outlook
• Revenue of approximately $136 - $140 million compared to fiscal 2017 revenue of
$127.7 million
• Expect bookings will continue to favor subscription-type contracts
• Gross margin is expected to be in the low-50% range
• Reflects the impact of higher cost of goods sold related to the previously
announced general availability of early versions of rGuest Stay and Buy in FY17
• Expect to generate positive Adjusted Earnings from Operations (non-GAAP measure) in
the fourth quarter of fiscal 2018
• This would represent the first quarter with positive Adjusted Earnings from
Operation since prior to FY14, the year the Company became a pure play hospitality
company.
24

TECHNOLOGY | INNOVATION | SOLUTIONS
Thank You
25
