Attached files
| file | filename |
|---|---|
| EX-32.2 - EXHIBIT 32.2 - HARTE HANKS INC | exhibit32210k-2016.htm |
| EX-32.1 - EXHIBIT 32.1 - HARTE HANKS INC | exhibit32110k-2016.htm |
| EX-31.2 - EXHIBIT 31.2 - HARTE HANKS INC | exhibit31210k-2016.htm |
| EX-31.1 - EXHIBIT 31.1 - HARTE HANKS INC | exhibit31110k-2016.htm |
| EX-23.2 - EXHIBIT 23.2 - HARTE HANKS INC | exhibit23210k-2016.htm |
| EX-23.1 - EXHIBIT 23.1 - HARTE HANKS INC | exhibit23110k-2016.htm |
| EX-21 - EXHIBIT 21 - HARTE HANKS INC | exhibit2110k-2016.htm |
| EX-10.3 - EXHIBIT 10.3 - HARTE HANKS INC | exhibit10310k-2016.htm |
| EX-10.2 - EXHIBIT 10.2 - HARTE HANKS INC | exhibit10210k-2016.htm |
| EX-10.1 - EXHIBIT 10.1 - HARTE HANKS INC | exhibit10110k-2016.htm |
UNITED STATES |
SECURITIES AND EXCHANGE COMMISSION |
Washington, D.C. 20549 |
FORM 10-K |
(Mark One) | ||
ý | ANNUAL REPORT PURSUANT TO SECTION 13 OR 15(d) OF THE SECURITIES EXCHANGE ACT OF 1934 | |
For the fiscal year ended December 31, 2016 | ||
o | TRANSITION REPORT PURSUANT TO SECTION 13 OR 15(d) OF THE SECURITIES EXCHANGE ACT OF 1934 | |
For the transition period from to | ||
Commission file number 001-7120
HARTE HANKS, INC.
(Exact name of registrant as specified in its charter)
Delaware | 74-1677284 | |
(State or other jurisdiction of incorporation or organization) | (I.R.S. Employer Identification No.) | |
9601 McAllister Freeway, Suite 610, San Antonio, Texas 78216 |
(Address of principal executive offices) (Zip Code) |
Registrant’s telephone number, including area code — 210-829-9000 |
Securities registered pursuant to Section 12(b) of the Act:
Title of each class | Name of each exchange on which registered | |||
Common Stock | New York Stock Exchange | |||
Securities registered pursuant to Section 12(g) of the Act: None
Indicate by check mark if the registrant is a well-known seasoned issuer, as defined in Rule 405 of the Securities Act. Yes o No ý
Indicate by check mark if the registrant is not required to file reports pursuant to Section 13 or Section 15(d) of the Act. Yes o No ý
Indicate by check mark whether the registrant (1) has filed all reports required to be filed by Section 13 or 15(d) of the Securities Exchange Act of 1934 during the preceding 12 months (or for such shorter period that the registrant was required to file such reports), and (2) has been subject to such filing requirements for the past 90 days. Yes o No ý
Indicate by check mark whether the registrant has submitted electronically and posted on its corporate website, if any, every Interactive Data File required to be submitted and posted pursuant to Rule 405 of Regulation S-T (§ 232.405 of this chapter) during the preceding 12 months (or for such shorter period that the registrant was required to submit and post such files). Yes ý No o
Indicate by check mark if disclosure of delinquent filers pursuant to Item 405 of Regulation S-K (§ 229.405 of this chapter) is not contained herein, and will not be contained, to the best of registrant’s knowledge, in definitive proxy or information statements incorporated by reference in Part III of this Form 10-K or any amendment to this Form 10-K. ý
Indicate by check mark whether the registrant is a large accelerated filer, an accelerated filer, a non-accelerated filer, or a smaller reporting company. See definitions of “large accelerated filer,” “accelerated filer,” “smaller reporting company,” and "emerging growth company" in Rule 12b-2 of the Exchange Act.
Large accelerated filer | o | Accelerated filer | ý |
Non-accelerated filer | o (Do not check if a smaller reporting company) | Smaller reporting company | o |
Emerging growth company | o | ||
if an emerging growth company, indicate by check mark if the registrant has elected not to use the extended transition period for complying with any new or revised financial accounting standards provided pursuant to Section 13(a) of the Exchange Act. o
Indicate by check mark if the registrant is a shell company (as defined in Rule 12b-2 of the Act). Yes o No ý
The aggregate market value of the voting and non-voting common equity held by non-affiliates computed by reference to the closing price ($1.59) as of the last business day of the registrant’s most recently completed second fiscal quarter (June 30, 2016), was approximately $76,374,241.
The number of shares outstanding of each of the registrant’s classes of common stock as of January 31, 2017 was 61,645,099 shares of common stock, all of one class.
Documents incorporated by reference:
None.
Harte Hanks, Inc. and Subsidiaries
Table of Contents
Form 10-K Report
December 31, 2016
Page | ||
2
PART I
ITEM 1. BUSINESS
INTRODUCTION
Harte Hanks, Inc. ("Harte Hanks," "we, "our," or "us") partners with clients to deliver relevant, connected, and quality customer interactions. Our approach starts with discovery and learning, which leads to customer journey mapping, creative and content development, analytics, and data management, and continues with execution and support in a variety of digital and traditional channels. We produce engaging and memorable customer interactions to drive business results for our clients, develop better customer relationships, experiences, and defining interaction-led marketing.
Virtually all organizations rely on marketing to generate revenues and publicity. Many businesses have a chief-level executive responsible for marketing who is charged with combining data, technology, channels, and resources to demonstrate a return on marketing investment. This has led many businesses to use direct and targeted marketing, which offer accountability and measurability of marketing programs, allowing customer insight to be leveraged to create and accelerate value. Harte Hanks is a leader in highly targeted, multichannel marketing.
We are the successor to a newspaper business started by Houston Harte and Bernard Hanks in Texas in the early 1920s. We were incorporated in Delaware on October 1, 1970. In 1972, Harte Hanks went public and was listed on the New York Stock Exchange ("NYSE"). We became private in a leveraged buyout in 1984, and in 1993 we again went public and listed our common stock on the NYSE.
We provide public access to all reports filed with the Securities and Exchange Commission ("SEC") under the Securities Exchange Act of 1934, as amended (the "1934 Act"). These documents may be accessed free of charge on our website at www.HarteHanks.com. There is not any information from this website incorporated by reference herein. These documents are provided as soon as practical after they are filed with the SEC and may also be found at the SEC’s website at www.sec.gov. Additionally, we have adopted and posted on our website a code of ethics that applies to our principal executive officer, principal financial officer and principal accounting officer. Our website also includes our corporate governance guidelines and the charters for each of our audit, compensation, and nominating and corporate governance committees. We will provide a printed copy of any of the aforementioned documents to any requesting stockholder.
OUR BUSINESS
We offer a wide variety of integrated, multi-channel, data-driven solutions for top brands around the globe. We help our clients gain insight into their customers’ behaviors from their data and use that insight to create innovative multi-channel marketing programs to deliver a return on marketing investment. We believe our clients’ success is determined not only by how good their tools are, but how well we help them use the tools to gain insight and analyze their consumers. This results in a strong and enduring relationship between our clients and their customers which is key to being leaders in Customer Interaction. We offer a full complement of capabilities and resources to provide a broad range of marketing services, in media from direct mail to email, including:
• | Agency & Digital Services. Our agency services are full-service, customer engagement agencies specializing in direct and digital communications for both consumer and business-to-business markets. With strategy, creative, and implementation services, we help marketers within targeted industries understand, identify, and engage prospects and customers in their channel of choice. Our digital solutions integrate online services within the marketing mix and include: search engine management, display, digital analytics, website development and design, digital strategy, social media, email, e-commerce, and interactive relationship management and a host of other services that support our core businesses. |
• | Database Marketing Solutions and Business-to-Business Lead Generation. We have successfully delivered marketing database solutions across various industries. Our solutions are built around centralized marketing databases with three core offerings: insight and analytics; customer data integration; and marketing communications tools. Our solutions enable organizations to build and manage customer communication strategies that drive new customer acquisition and retention and maximize the value of existing customer relationships. Through insight, we help clients identify models of their most profitable customer relationships and then apply these models to increase the value of existing customers while also winning profitable new customers. Through customer data integration, data from multiple sources comes together to provide a single customer view of client prospects and customers. Then we help clients apply their data and insights to the entire customer life cycle, to help clients sustain and grow their business, gain deeper customer insights, and continuously refine their customer resource management strategies and tactics. |
3
• | Direct Mail. As a full-service direct marketing provider and one of the largest mailing partners of the U.S. Postal Service ("USPS"), our operational mandate is to ensure creativity and quality, provide an understanding of the options available in technologies and segmentation strategies and capitalize on economies of scale with our variety of execution options. Our services include: digital printing, print on demand, advanced mail optimization, logistics and transportation optimization, tracking (including our proprietary prEtrak solution), commingling, shrink wrapping, and specialized mailings. We also maintain fulfillment centers where we provide custom kitting services, print on demand, product recalls, and freight optimization allowing our customers to distribute literature and other marketing materials. |
• | Contact Centers. We operate teleservice workstations around the globe providing advanced contact center solutions such as: speech, voice and video chat, integrated voice response, analytics, social cloud monitoring, and web self-service. We provide both inbound and outbound contact center services and support many languages with our strategically placed global locations for both consumer and business-to-business markets. |
Many of our client relationships start with an offering from the list above on an individual solution basis or a combination of our offerings from across our portfolio of businesses.
In 2016, 2015, and 2014, Harte Hanks had revenues from continuing operations of $404.4 million, $444.2 million, and $499.4 million, respectively.
Recent Developments
On April 17, 2017, we entered into a credit agreement with Texas Capital Bank, N.A. as Lender. The agreement consists of a two-year $20 million credit facility guaranteed by HHS Guaranty, LLC, and entity formed by certain members of the Shelton family, descendants of one of the company's founders. See Note C, Long-Term Debt, in the Notes to Consolidated Financial Statements for further discussion.
On April 18, 2017, we announced our intention to sell our wholly-owned subsidiary 3Q Digital, Inc. ("3Q Digital"). We believe this initiative will further focus the company on its core business and will give us the opportunity to invest in strategies that will strengthen that core. If a sale of the 3Q Digital business is completed, we intend to leverage a partnership model to continue providing comprehensive solutions to our customers.
On May 1, 2017, we entered into an agreement with 3Q Digital (the "3Q Agreement") which deferred our obligation to pay the contingent consideration to the former owners until April 1, 2019 or the sale of the 3Q Digital business, whichever is earlier.
Customers
Our services are marketed to specific industries or markets with services and software products tailored to each industry or market. We believe that we are generally able to provide services to new industries and markets by modifying our existing services and applications. We currently provide services primarily to the retail, technology, financial services, automotive and consumer brands, and pharmaceutical/healthcare vertical markets, in addition to a range of select markets. Our largest client (measured in revenue) comprised 8% of total revenues in 2016. Our largest 25 clients in terms of revenue comprised 60% of total revenues in 2016.
Sales and Marketing
Our enterprise sales force sells a variety of solutions and services to address client’s targeted marketing needs. We maintain solution-specific sales forces and sales groups to sell our individual products and solutions. Our direct sales forces, with industry-specific knowledge and experience, emphasize the cross-selling of a full range of direct marketing services and are supported by employees in each sector assigned to specific clients with industry specific expertise. We rely on our enterprise and solution sellers to primarily sell our products and services to new clients and task our employees supporting existing clients to expand our client relationship through additional solutions and products.
4
Facilities
Our services are provided at the following facilities, all of which are leased:
Domestic Offices | |
Austin, Texas | Maitland, Florida |
Baltimore, Maryland | New York, New York |
Burlington, Massachusetts | Oakland, California |
Burlington, Vermont | San Antonio, Texas |
Chicago, Illinois | San Diego, California |
Deerfield Beach, Florida | San Francisco, California |
Denver, Colorado | San Mateo, California |
East Bridgewater, Massachusetts | Shawnee, Kansas |
Fullerton, California | Trevose, Pennsylvania |
Grand Prairie, Texas | Texarkana, Texas |
Jacksonville, Florida | Wilkes-Barre, Pennsylvania |
Langhorne, Pennsylvania | |
International Offices | |
Bristol, United Kingdom | Manila, Philippines |
Hasselt, Belgium | Uxbridge, United Kingdom |
Competition
Our business faces significant competition in all of its offerings and within each of its vertical markets. Direct marketing is a dynamic business, subject to rapid technological change, high turnover of client personnel who make buying decisions, client consolidations, changing client needs and preferences, continual development of competing products and services, and an evolving competitive landscape. Our competition comes from numerous local, national, and international direct marketing and advertising companies, and client internal resources, against whom we compete for individual projects, entire client relationships, and marketing expenditures. Competitive factors in our industry include the quality and scope of services, technical and strategic expertise, the perceived value of the services provided, reputation, and brand recognition. We also compete against internet (social, mobile, web-based, and email), print, broadcast, and other forms of advertising for marketing and advertising dollars in general. Failure to continually improve our current processes, advance and upgrade our technology applications, and to develop new products and services in a timely and cost-effective manner, could result in the loss of our clients or prospective clients to current or future competitors. In addition, failure to gain market acceptance of new products and services could adversely affect our growth. Although we believe that our capabilities and breadth of services, combined with our U.S. and international production capability, industry focus, and ability to offer a broad range of integrated services, enable us to compete effectively, our business results may be adversely impacted by competition. Please refer to Item 1A, “Risk Factors”, for additional information regarding risks related to competition.
Seasonality
Our revenues tend to be higher in the fourth quarter than in other quarters during a given year. This increased revenue is a result of overall increased marketing activity prior to and during the holiday season, primarily related to our retail vertical.
Discontinued Operations
Previously, Harte Hanks also provided data quality solutions through Trillium Software, Inc. (“Trillium US”). On December 23, 2016, (i) Harte Hanks completed the sale of Trillium US to Syncsort Incorporated (“US Buyer”), (ii) Harte-Hanks UK Limited (“UK Seller”) completed the sale of Harte-Hanks Trillium UK Limited (“Trillium UK”) to Syncsort Limited (“UK Buyer”), and (iii) Harte-Hanks GmbH (“German Seller” and together with Harte Hanks and UK Seller, the “Sellers”) completed the sale of Harte-Hanks Trillium Software Germany GmbH (“Trillium Germany” and together with Trillium US and Trillium UK, “Trillium”) to Syncsort GmbH (“German Buyer” and together with US Buyer and UK Buyer, the “Syncsort Buyers”), in each case pursuant to a Stock Purchase Agreement (the “Purchase Agreement”) entered into on November 29, 2016 by and among the Sellers, the Syncsort Buyers, Trillium, and Harte Hanks, in its capacity as representative of the Sellers (such transaction, the “Trillium Sale”). The aggregate consideration received by the Sellers in respect of Trillium from the Syncsort Buyers was approximately $112.0 million in cash, less estimated purchase price adjustments, pursuant to the terms of the Purchase Agreement. A portion of the cash consideration has been deposited into escrow to support post-closing purchase price adjustments and the Sellers’ indemnification obligations.
5
The decision to sell Trillium largely derived from the desire to prioritize investment in support of our other services that more directly serve chief marketing officers by optimizing our clients' customer journey across an omni-channel delivery platform. Because the Trillium business required continuing investment and development, and because the competitive and other market dynamics of software businesses were so distinct from our other services, we thought a sale of the business would be best for both the rest of our business as well as Trillium itself. The proceeds from the sale were used to repay in full, and allow the termination of, our 2016 Secured Credit Facility with Wells Fargo Bank, N.A. See Liquidity and Capital Resources in the Management's Discussion and Analysis for further discussion.
This transaction resulted in an after-tax loss of $39.9 million. Because Trillium represented a distinct business unit with operations and cash flows that can clearly be distinguished, both operationally and for financial purposes, from the rest of Harte Hanks, the results of operations, financial position, and cash flows for Trillium are reported separately as discontinued operations for all periods presented. Results of the remaining Harte Hanks business are reported as continuing operations.
GOVERNMENT REGULATION
As a company conducting varied business activities for clients across diverse industries around the world, we are subject to a variety of domestic and international legal and regulatory requirements that impact our business, including, for example, regulations governing consumer protection, and unfair business practices, contracts, e-commerce, intellectual property, labor, and employment (especially wage and hour laws), securities, tax, and other laws that are generally applicable to commercial activities.
We are also subject to, or affected by, numerous local, national, and international laws, regulations, and industry standards that regulate direct marketing activities, including those that address privacy, data security, and unsolicited marketing communications. Examples of some of these laws and regulations that may be applied to, or affect, our business or the businesses of our clients include the following:
• | Federal and state laws governing the use of the internet and regulating telemarketing, including the U.S. Controlling the Assault of Non-Solicited Pornography and Marketing Act of 2003 ("CAN-SPAM"), which regulates commercial email and requires that commercial emails give recipients an opt-out method. Canada’s Anti-Spam Legislation ("CASL") applies in a comparable manner for our activities in Canada. Telemarketing activities are regulated by, among other requirements, the Federal Trade Commission’s Telemarketing Sales Rule ("TSR"), the Federal Communications Commission’s Telephone Consumer Protection Act ("TCPA"), and various state do-not-call laws. |
• | Federal and state laws governing the collection and use of personal data online and via mobile devices, including but not limited to the Federal Trade Commission Act and the Children's Online Privacy Protection Act, which seek to address consumer privacy and protection. |
• | The U.S. Department of Commerce’s proposed Privacy Shield Framework, the Federal Trade Commission’s Protecting Consumer Privacy in an Era of Rapid Change policy, and the European Commission’s European General Data Protection Regulation ("GDPR"), each of which seeks to address consumer privacy, data protection, and technological advancements in relation to the collection or use of personal information. |
• | A significant number of states in the U.S. have passed versions of data security or breach notification laws, which include required standards for data security and generally require timely notifications to affected persons in the event of data security breaches or other unauthorized access to certain types of protected personal data. With the increased attention security breaches have received, federal legislation may also be adopted and impose additional obligations. |
• | The Fair Credit Reporting Act ("FCRA"), which governs, among other things, the sharing of consumer report information, access to credit scores, and requirements for users of consumer report information. |
• | The Financial Services Modernization Act of 1999, or Gramm-Leach-Bliley Act ("GLB"), which, among other things, regulates the use for marketing purposes of non-public personal financial information of consumers that is held by financial institutions. Although Harte Hanks is not considered a financial institution, many of our clients are subject to the GLB. The GLB also includes rules relating to the physical, administrative, and technological protection of non-public personal financial information. |
• | The Health Insurance Portability and Accountability Act of 1996 ("HIPAA"), which regulates the use of protected health information for marketing purposes and requires reasonable safeguards designed to prevent intentional or unintentional use or disclosure of protected health information. |
• | The Fair and Accurate Credit Transactions Act of 2003 ("FACT Act"), which amended the FCRA and requires, among other things, consumer credit report notice requirements for creditors that use consumer credit report information in connection with risk-based credit pricing actions and also prohibits a business that receives consumer information from |
6
an affiliate from using that information for marketing purposes unless the consumer is first provided a notice and an opportunity to direct the business not to use the information for such marketing purposes, subject to certain exceptions.
• | The European Union ("EU") data protection laws, including the comprehensive EU Directive on Data Protection (1995) ("EU Directive"), and the GDPR (which will replace the EU Directive once implemented), which imposes a number of obligations with respect to use of personal data, and includes a prohibition on the transfer of personal information from the EU to other countries that do not provide consumers with an “adequate” level of privacy or security. The EU standard for adequacy is generally stricter and more comprehensive than that of the U.S. and most other countries. |
There are additional consumer protection, privacy, and data security regulations in locations where we or our clients do business. These laws regulate the collection, use, disclosure, and retention of personal data and may require consent from consumers and grant consumers other rights, such as the ability to access their personal data and to correct information in the possession of data controllers. We and many of our clients also belong to trade associations that impose guidelines that regulate direct marketing activities, such as the Direct Marketing Association’s Commitment to Consumer Choice.
As a result of increasing public awareness and interest in individual privacy rights, data protection, information security, and environmental and other concerns regarding marketing communications, federal, state, and foreign governmental and industry organizations continue to consider new legislative and regulatory proposals that would impose additional restrictions on direct marketing services and products. Examples include data encryption standards, data breach notification requirements, consumer choice and consent restrictions, and increased penalties against offending parties, among others. In 2012 and 2013, several members of the U.S. Congress (in coordination with the Federal Trade Commission and consumer advocacy groups) initiated several inquiries regarding data brokerage, one of which was directed to us (among others). We anticipate that further inquiries and legislative proposals will be made which may affect the services we offer our clients.
In addition, our business may be affected by the impact of these restrictions on our clients and their marketing activities. These additional regulations could increase compliance requirements and restrict or prevent the collection, management, aggregation, transfer, use, or dissemination of information or data that is currently legally available. Additional regulations may also restrict or prevent current practices regarding unsolicited marketing communications. For example, many states have considered implementing "do-not-mail" legislation that could impact our business and the businesses of our clients and customers. In addition, continued public interest in individual privacy rights and data security may result in the adoption of further voluntary industry guidelines that could impact our direct marketing activities and business practices.
We cannot predict the scope of any new legislation, regulations, or industry guidelines or how courts may interpret existing and new laws. Additionally, enforcement priorities by governmental authorities may change and also impact our business either directly or through requiring our customers to alter their practices. Compliance with regulations is costly and time-consuming for us and our clients, and we may encounter difficulties, delays, or significant expenses in connection with our compliance. We may also be exposed to significant penalties, liabilities, reputational harm, and loss of business in the event that we fail to comply with applicable regulations. There could be a material adverse impact on our business due to the enactment or enforcement of legislation or industry regulations, the issuance of judicial or governmental interpretations, enforcement priorities of governmental agencies, or a change in customs arising from public concern over consumer privacy and data security issues.
INTELLECTUAL PROPERTY RIGHTS
Our intellectual property assets include trademarks and service marks that identify our company and our services, know-how, software, and other technology that we develop for our internal use and for license to clients and data and intellectual property licensed from third parties, such as commercial software and data providers. We generally seek to protect our intellectual property through a combination of license agreements and trademark, service mark, copyright, patent and trade secret laws, and domain name registrations and enforcement procedures. We also enter into confidentiality agreements with many of our employees, vendors, and clients and seek to limit access to and distribution of intellectual property and other proprietary information. We pursue the protection of our trademarks and other intellectual property in the U.S. and internationally. Although we from time to time evaluate inventions for patentability, we do not own any patents, and patents are not core to our intellectual property strategy (other than as may be incidental to commercially available technology or software we license).
EMPLOYEES
As of December 31, 2016, Harte Hanks employed 5,588 full-time employees and 64 part-time employees, of which approximately 2,669 are based outside of the U.S., primarily in the Philippines. A portion of our workforce is provided to us through staffing companies. None of our workforce is represented by labor unions. We consider our relations with our employees to be good.
7
ITEM 1A. RISK FACTORS
Cautionary Note Regarding Forward-Looking Statements
This report, including the Management’s Discussion and Analysis of Financial Condition and Results of Operations ("MD&A"), contains “forward-looking statements” within the meaning of the federal securities laws. All such statements are qualified by this cautionary note, which is provided pursuant to the safe harbor provisions of Section 27A of the Securities Act of 1933 (the "1933 Act") and Section 21E of the 1934 Act. Forward-looking statements may also be included in our other public filings, press releases, our website, and oral and written presentations by management. Statements other than historical facts are forward-looking and may be identified by words such as “may,” “will,” “expects,” “believes,” “anticipates,” “plans,” “estimates,” “seeks,” “could,” “intends,” or words of similar meaning. Examples include statements regarding (1) our strategies and initiatives, (2) adjustments to our cost structure and other actions designed to respond to market conditions and improve our performance, and the anticipated effectiveness and expenses associated with these actions, (3) our financial outlook for revenues, earnings per share, operating income, expense related to equity-based compensation, capital resources and other financial items, (4) expectations for our businesses and for the industries in which we operate, including the impact of economic conditions of the markets we serve on the marketing expenditures and activities of our clients and prospects, (5) competitive factors, (6) acquisition and development plans, (7) our stock repurchase program, (8) expectations regarding legal proceedings and other contingent liabilities, and (9) other statements regarding future events, conditions, or outcomes.
These forward-looking statements are based on current information, expectations, and estimates and involve risks, uncertainties, assumptions, and other factors that are difficult to predict and that could cause actual results to vary materially from what is expressed in or indicated by the forward-looking statements. In that event, our business, financial condition, results of operations, or liquidity could be materially adversely affected, and investors in our securities could lose part or all of their investments. Some of these risks, uncertainties, assumptions, and other factors can be found in our filings with the SEC, including the factors discussed below in this Item 1A, “Risk Factors”, and any updates thereto in our Forms 10-Q. The forward-looking statements included in this report and those included in our other public filings, press releases, our website, and oral and written presentations by management are made only as of the respective dates thereof, and we undertake no obligation to update publicly any forward-looking statement in this report or in other documents, our website, or oral statements for any reason, even if new information becomes available or other events occur in the future, except as required by law.
In addition to the information set forth elsewhere in this report, including in the MD&A section, the factors described below should be considered carefully in making any investment decisions with respect to our securities. Additional risks and uncertainties that are not presently anticipated or that we may currently believe are immaterial could also impair our business operations and financial performance.
We may need to obtain additional funding to continue as a going concern; if we are unable to meet our needs for additional funding in the future, we will be required to limit, scale back, or cease operations.
Our consolidated financial statements for the year ended December 31, 2016 have been prepared assuming we will continue to operate as a going concern. Because we continue to experience net operating losses, our ability to continue as a going concern is subject to our ability to successfully raise sufficient additional capital as needed, through future financings or other strategic arrangements. Additional funds may not be available when needed, or if available, we may not be able to obtain such funds on terms acceptable to us. If adequate funds are unavailable when needed, we may not be able to continue as a going concern. We may be required to scale down or sell certain businesses, or cease operations. Information on our going concern and management's plan to continue to support its operations and meet its obligations is included in Note A, Significant Accounting Policies, of the Notes to Consolidated Financial Statements included in Part IV, "Financial Statement Schedules" of this Form 10-K.
If our new leaders are unsuccessful, or if we continue to lose key management and are unable to attract and retain the talent required for our business, our operating results could suffer.
Over the past three years we have replaced many of our leaders, including our Chief Executive Officer and Chief Financial Officer, and we have significantly reorganized our operational structures. If our new leaders fail in their new roles and responsibilities (and more generally if we are unable to attract new leaders with the necessary skills to manage our business) our business and its operating results may suffer. Further, our prospects depend in large part upon our ability to attract, train, and retain experienced technical, client services, sales, consulting, marketing, administrative, and management personnel. While the demand for personnel is dependent on employment levels, competitive factors, and general economic conditions, our recent business performance may diminish our attractiveness as an employer. The loss or prolonged absence of the services of these individuals could have a material adverse effect on our business, financial position, or operating results.
8
Most of our client engagements are cancelable on short notice.
The marketing services we offer, and in particular for direct mail and contact center services, are generally terminable upon short notice by our clients, even if the term of the agreement (and the expected duration of services) is several or many years. Many of our customer agreements do not have minimum volume or revenue requirements, so clients may (and do) vary their actual orders from us over time based on their own business needs, their satisfaction with the quality and pricing of our services, and a variety of other competitive factors. In addition, the timing of particular jobs or types of jobs at particular times of year (such as mail programs supporting the holiday shopping season, or contact center programs supporting a specific event) may cause significant fluctuations in the operating results of our operations in any given quarter. We depend to some extent on sales to certain industries, such as the consumer retail industries, technology, and financial services. To the extent these industries experience downturns, the results of our operations may be adversely affected.
A large portion of our revenue is generated from a limited number of clients, with concentration in the consumer retail industry. The loss of significant work from one or more of our clients could adversely affect our business.
Our ten largest clients collectively represented 42.9% of our revenues for 2016. Furthermore, traditional consumer retail (which is experiencing significant economic changes) represented 26.9% of our 2016 revenues. While we typically have multiple projects with our largest customers which would not all terminate at the same time, the loss of one or more of the projects or contracts with one of our largest clients could adversely affect our business, results of operations, and financial condition if the lost revenues were not replaced with profitable revenues from that client or other clients.
We face significant competition for individual projects, entire client relationships and advertising dollars in general.
Our business faces significant competition in all of its offerings and within each of its vertical markets. We offer our marketing services in a dynamic business environment characterized by rapid technological change, high turnover of client personnel who make buying decisions, client consolidations, changing client needs and preferences, continual development of competing products and services, and an evolving competitive landscape. This competition comes from numerous local, national, and international direct marketing and advertising companies, and client internal resources, against whom we compete for individual projects, entire client relationships, and marketing expenditures by clients and prospective clients. We also compete against internet (social, mobile, web-based, and email), print, broadcast, and other forms of advertising for marketing and advertising dollars in general. In addition, our ability to attract new clients and to retain existing clients may, in some cases, be limited by clients’ policies on or perceptions of conflicts of interest which may prevent us from performing similar services for competitors. Some of our clients have also sought to reduce the number of marketing vendors or use third-party procurement organizations, all of which increases pricing pressure, and may disadvantage us relative to our competitors. Our failure to improve our current processes or to develop new products and services could result in the loss of our clients to current or future competitors. In addition, failure to gain market acceptance of new products and services could adversely affect our growth.
Current and future competitors may have significantly greater financial and other resources than we do, and they may sell competing services at lower prices or at lower profit margins, resulting in pressures on our prices and margins.
The sizes of our competitors vary widely across market and service segments. Therefore, some of our competitors may have significantly greater financial, technical, marketing, or other resources than we do in any one or more of our market segments, or overall. As a result, our competitors may be in a position to respond more quickly than we can to new or emerging technologies, methodologies, and changes in customer requirements, or may devote greater resources than we can to the development, promotion, sale, and support of products and services. Moreover, new competitors or alliances among our competitors may emerge and potentially reduce our market share, revenue, or margins. Some of our competitors also may choose to sell products or services competitive to ours at lower prices by accepting lower margins and profitability, or may be able to sell products or services competitive to ours at lower prices given proprietary ownership of data, technical superiority, a broader or deeper product or experience set, or economies of scale. Price reductions or pricing pressure by our competitors could negatively impact our margins and results of operations, and could also harm our ability to obtain new customers on favorable terms. Competitive pricing pressures tend to increase in difficult or uncertain economic environments, due to reduced marketing expenditures of many of our clients and prospects, and the resulting impact on the competitive business environment for marketing service providers such as our company.
9
We must maintain technological competitiveness, continually improve our processes and develop and introduce new services in a timely and cost-effective manner.
We believe that our success depends on, among other things, maintaining technological competitiveness in our products, processing functionality, and software systems and services. Technology changes rapidly as makers of computer hardware, network systems, programming tools, computer and data architectures, operating systems, database technology, and mobile devices continually improve their offerings. Advances in information technology may result in changing client preferences for products and product delivery channels in our industry. The increasingly sophisticated requirements of our clients require us to continually improve our processes and provide new products and services in a timely and cost-effective manner (whether through development, license, or acquisition). Our direct mail operations are increasingly pressured by larger-scale competitors who are adopting technologies allowing them to more effectively customize mailed marketing materials. We may be unable to successfully identify, develop, and bring new and enhanced services and products to market in a timely and cost-effective manner, such services and products may not be commercially successful, and services, products, and technologies developed by others may render our services and products noncompetitive or obsolete.
Our success depends on our ability to consistently and effectively deliver our services to our clients.
Our success depends on our ability to effectively and consistently staff and execute client engagements within the agreed upon time frame and budget. Depending on the needs of our clients, our engagements may require customization, integration, and coordination of a number of complex product and service offerings and execution across many of our facilities. Moreover, in some of our engagements, we rely on subcontractors and other third parties to provide some of the services to our clients, and we cannot guarantee that these third parties will effectively deliver their services or that we will have adequate recourse against these third parties in the event they fail to effectively deliver their services. Other contingencies and events outside of our control may also impact our ability to provide our products and services. Our failure to effectively and timely staff, coordinate, and execute our client engagements may adversely impact existing client relationships, the amount or timing of payments from our clients, our reputation in the marketplace and ability to secure additional business and our resulting financial performance. In addition, our contractual arrangements with our clients and other customers may not provide us with sufficient protections against claims for lost profits or other claims for damages.
If our facilities are damaged, or if we are unable to access and use our facilities, our business and results of operations will be adversely affected.
Our operations rely on the ability of our employees to work at specially-equipped facilities to perform services for our clients. Although we have some excess capacity and redundancy, we do not have sufficient excess capacity or redundancy (in equipment, facilities, or personnel) to maintain service and operational levels for extended periods if we are unable to use one of our major facilities. Should we lose access to a facility for any reason, our service levels are likely to decline or be suspended, clients would go without service or secure replacement services from a competitor. As consequence of such an event, we would suffer a reduction in revenues and harm to (and loss of) client relationships.
Significant system disruptions, loss of data center capacity or interruption of telecommunication links could adversely affect our business and results of operations.
Our business is heavily dependent upon data centers and telecommunications infrastructures, which are essential to both our call center services and our database services (which require that we efficiently and effectively create, access, manipulate, and maintain large and complex databases). In addition to the third-party data centers we use, we also operate several data centers to support both our own and our clients' needs in this regard, as well as those of some of our clients. Our ability to protect our operations against damage or interruption from fire, flood, tornadoes, power loss, telecommunications or equipment failure, or other disasters and events beyond our control is critical to our continued success. Likewise, as we increase our use of third-party data centers, it is critical that the vendors providing that service adequately protect their data centers from the same risks. Our services are very dependent on links to telecommunication providers. We believe we have taken reasonable precautions to protect our data centers and telecommunication links from events that could interrupt our operations. Any damage to the data centers we use or any failure of our telecommunications links could materially adversely affect our ability to continue services to our clients, which could result in loss of revenues, profitability and client confidence, and may adversely impact our ability to attract new clients and force us to expend significant company resources to repair the damage.
10
If we do not prevent security breaches and other interruptions to our infrastructure, we may be exposed to lawsuits, lose customers, suffer harm to our reputation, and incur additional costs.
The services we offer involve the transmission of large amounts of sensitive and proprietary information over public communications networks, as well as the processing and storage of confidential customer information. Unauthorized access, remnant data exposure, computer viruses, denial of service attacks, accidents, employee error or malfeasance, “social engineering” and “phishing” attacks, intentional misconduct by computer “hackers” and other disruptions can occur, and infrastructure gaps, hardware and software vulnerabilities, inadequate or missing security controls, and exposed or unprotected customer data can exist that (i) interfere with the delivery of services to our customers, (ii) impede our customers' ability to do business, or (iii) compromise the security of systems and data, which exposes information to unauthorized third parties. We are a target of cyber-attacks of varying degrees on a regular basis. Although we maintain insurance which may respond to cover some types of damages incurred by damage to, breaches of, or problems with, our information and telecommunications systems, such insurance is limited and expensive, and may not respond or be sufficient to offset the costs of such damages, and therefore such damages may materially harm our business.
We have recently experienced, and may experience in the future, reduced demand for our products and services due to the financial condition and marketing budgets of our clients and other factors that may impact the industry verticals that we serve.
Marketing budgets are largely discretionary in nature, and as a consequence are easier to reduce in the short-term than other expenses. Our customers have in the past, and may in the future, responded to their own financial constraints (whether caused by weak economic conditions, weak industry performance or client-specific issues) by reducing their marketing spending. Customers may also be slow to restore their marketing budgets to prior levels during a recovery, and may respond similarly to adverse economic conditions in the future. Our revenues are dependent on national, regional, and international economies and business conditions. A lasting economic recession or anemic recovery in the markets in which we operate could have material adverse effects on our business, financial position, or operating results. Similarly, industry or company-specific factors may negatively impact our clients and prospective clients, and in turn result in reduced demand for our products and services, client insolvencies, collection difficulties or bankruptcy preference actions related to payments received from our clients. We may also experience reduced demand as a result of consolidation of clients and prospective clients in the industry verticals that we serve.
We must effectively manage our costs to be successful. If we do not achieve our cost management objectives, our financial results could be adversely affected.
Our business plan and expectations for the future require that we effectively manage our cost structure, including our operating expenses and capital expenditures across our operations. To the extent that we do not accurately anticipate and effectively manage our costs as our business evolves, our financial results may be adversely affected.
Privacy, information security and other regulatory requirements may prevent or impair our ability to offer our products and services.
We are subject to and affected by numerous laws, regulations, and industry standards that regulate direct marketing activities, including those that address privacy, data protection, information security, and marketing communications. Please refer to the section above entitled “Government Regulation” for additional information regarding some of these regulations.
As a result of increasing public awareness and interest in privacy rights, data protection and access, information security, environmental protection, and other concerns, national and local governments and industry organizations regularly consider and adopt new laws, rules, regulations, and guidelines that restrict or regulate marketing communications, services, and products. Examples include data encryption standards, data breach notification requirements, registration/licensing requirements (often with fees), consumer choice, notice, and consent restrictions and penalties for infractions, among others. We anticipate that additional restrictions and regulations will continue to be proposed and adopted in the future.
Our business may also be affected by the impact of these restrictions and regulations on our clients and their marketing activities. In addition, as we acquire new capabilities and deploy new technologies to execute our strategy, we may be exposed to additional types or layers of regulation. Current and future restrictions and regulations could increase compliance requirements and costs, and restrict or prevent the collection, management, aggregation, transfer, use or dissemination of information, or change the requirements therefore so as to require other changes to our business or that of our clients. Additional restrictions and regulations may limit or prohibit current practices regarding marketing communications and information quality solutions. For example, many states and countries have considered implementing "do not contact" legislation that could impact our business and the businesses of our clients and customers. In addition, continued public interest in privacy rights, data protection and
11
access, and information security may result in the adoption of further industry guidelines that could impact our direct marketing activities and business practices.
We cannot predict the scope of any new laws, rules, regulations, or industry guidelines or how courts or agencies may interpret current ones. Additionally, enforcement priorities by governmental authorities will change over time, which may impact our business. Understanding the laws, rules, regulations, and guidelines applicable to specific client multichannel engagements and across many jurisdictions poses a significant challenge, as such laws, rules, regulations, and guidelines are often inconsistent or conflicting, and are sometimes at odds with client objectives. Our failure to properly comply with these regulatory requirements and client needs may materially and adversely affect our business. General compliance with privacy, data protection, and information security obligations is costly and time-consuming, and we may encounter difficulties, delays, or significant expenses in connection with our compliance, or because of our clients’ need to comply. We may be exposed to significant penalties, liabilities, reputational harm, and loss of business in the event that we fail to comply. We could suffer a material adverse impact on our business due to the enactment or enforcement of legislation or industry regulations affecting us and/or our clients, the issuance of judicial or governmental interpretations, changed enforcement priorities of governmental agencies, or a change in behavior arising from public concern over privacy, data protection, and information security issues.
Consumer perceptions regarding the privacy and security of their data may prevent or impair our ability to offer our products and services.
Various local, national, and international regulations, as well as industry standards, give consumers varying degrees of control as to how certain data regarding them is collected, used, and shared for marketing purposes. If, due to privacy, security, or other concerns, consumers exercise their ability to prevent or limit such data collection, use, or sharing, it may impair our ability to provide marketing to those consumers and limit our clients’ demand for our services. Additionally, privacy and security concerns may limit consumers’ willingness to voluntarily provide data to our customers or marketing companies. Some of our services depend on voluntarily provided data and therefore may be impaired without such data.
Our reputation and business results may be adversely impacted if we, or subcontractors upon whom we rely, do not effectively protect sensitive personal information of our clients and our clients’ customers.
Current privacy and data security laws and industry standards impact the manner in which we capture, handle, analyze, and disseminate customer and prospect data as part of our client engagements. In many instances, our client contracts also mandate privacy and security practices. If we fail to effectively protect and control sensitive personal information (such as personal health information, social security numbers, or credit card numbers) of our clients and their customers or prospects in accordance with these requirements, we may incur significant expense, suffer reputational harm, and loss of business, and, in certain cases, be subjected to regulatory or governmental sanctions or litigation. These risks may be increased due to our reliance on subcontractors and other third parties in providing a portion of our overall services in certain engagements. We cannot guarantee that these third parties will effectively protect and handle sensitive personal information or other confidential information, or that we will have adequate recourse against these third parties in that event.
We could fail to adequately protect our intellectual property rights and may face claims for intellectual property infringement.
Our ability to compete effectively depends in part on the protection of our technology, products, services, and brands through intellectual property right protections, including copyrights, database rights, trade secrets, trademarks and domain name registrations, and enforcement procedures. The extent to which such rights can be protected and enforced varies by jurisdiction, and capabilities we procure through acquisitions may have less protection than would be desirable for the use or scale we intend or need. Litigation involving patents and other intellectual property rights has become far more common and expensive in recent years, and we face the risk of additional litigation relating to our use or future use of intellectual property rights of third parties.
Despite our efforts to protect our intellectual property, unauthorized parties may attempt to copy or otherwise obtain and use our proprietary information and technology. Monitoring unauthorized use of our intellectual property is difficult, and unauthorized use of our intellectual property may occur. We cannot be certain that trademark registrations will be issued, nor can we be certain that any issued trademark registrations will give us adequate protection from competing products. For example, others may develop competing technologies or databases on their own. Moreover, there is no assurance that our confidentiality agreements with our employees or third parties will be sufficient to protect our intellectual property and proprietary information.
12
Third-party infringement claims and any related litigation against us could subject us to liability for damages, significantly increase our costs, restrict us from using and providing our technologies, products or services or operating our business generally, or require changes to be made to our technologies, products, and services. We may also be subject to such infringement claims against us by third parties and may incur substantial costs and devote significant management resources in responding to such claims, as we have in the recent past. We have been, and continue to be, obligated under some agreements to indemnify our clients as a result of claims that we infringe on the proprietary rights of third parties. These costs and distractions could cause our business to suffer. In addition, if any party asserts an infringement claim, we may need to obtain licenses to the disputed intellectual property. We cannot assure you, however, that we will be able to obtain these licenses on commercially reasonable terms or that we will be able to obtain any licenses at all. The failure to obtain necessary licenses or other rights may have an adverse effect on our ability to provide our products and services.
Breaches of security, or the perception that e-commerce is not secure, could severely harm our business and reputation.
Business-to-business and business-to-consumer electronic commerce requires the secure transmission of confidential information over public networks. Some of our products and services are accessed through or are otherwise dependent on the internet. Security breaches in connection with the delivery of our products and services, or well-publicized security breaches that may affect us or our industry (such as database intrusion) could be severely detrimental to our business, operating results, and financial condition. We cannot be certain that advances in criminal capabilities, cryptography, or other fields will not compromise or breach the technology protecting the information systems that deliver our products, services, and proprietary database information.
Data suppliers could withdraw data that we rely on for our products and services.
We purchase or license much of the data we use for ourselves and for our clients. There could be a material adverse impact on our business if owners of the data we use were to curtail access to the data or materially restrict the authorized uses of their data. Data providers could withdraw their data if there is a competitive reason to do so, if there is pressure from the consumer community or if additional regulations are adopted restricting the use of the data. We also rely upon data from other external sources to maintain our proprietary and non-proprietary databases, including data received from customers and various government and public record sources. If a substantial number of data providers or other key data sources were to withdraw or restrict their data, if we were to lose access to data due to government regulation, or if the collection of data becomes uneconomical, our ability to provide products and services to our clients could be materially and adversely affected, which could result in decreased revenues, net income, and earnings per share.
We rely on business partners as an essential element of our go-to-market strategy.
We have determined that for some services, and most technology, we are best served by partnering with other companies, such as our recently announced relationship with a global information technology, consulting and outsourcing company. We believe this approach reduces the investment needed to access these services and technologies for our clients, and provides greater flexibility in how we structure solutions for clients and adapt to market changes. However, because we do not own or control the service or technology partners, we are subject to the potential failure of those partners financially or commercially. We may not be able to anticipate any such problems, and failure or weakness of one or more of our key business partners could have a material affect on our ability to deliver services to our clients, and in turn harm our financial performance. Furthermore, our business partners may have different or conflicting interests, and although we seek to negotiate appropriate commercial terms, we may be unable to secure or enforce those terms in order to protect our client and employee relationships. Should our partners undermine our client or employee relations, our financial performance will be harmed.
We must successfully identify and evaluate acquisition targets and integrate acquisitions.
We frequently evaluate acquisition opportunities to expand our product and service offerings. Acquisition activities, even if not consummated, require substantial amounts of management time, and can distract from normal operations. In addition, we have in the past and may in the future be unable to achieve the profitability goals, synergies, and other objectives initially sought in acquisitions, and any acquired assets, data, or businesses may not be successfully integrated into our operations. Acquisitions may result in the impairment of relationships with employees and customers. Moreover, although we review and analyze assets or companies we acquire, such reviews are subject to uncertainties and may not reveal all potential risks, and we may incur unanticipated liabilities and expenses as a result of our acquisition activities. The failure to identify appropriate candidates, to negotiate favorable terms, or to successfully integrate future acquisitions into existing operations could result in not achieving planned revenue growth and could negatively impact our net income and earnings per share.
13
We may be unable to make dispositions of assets on favorable terms, or at all.
In 2016 we sold our Trillium business resulting in a pre-tax loss of $44.5 million. In 2015 we sold our B2B research business resulting in a pre-tax loss of $9.5 million. In the future, we may determine to divest certain assets or businesses consistent with our corporate strategy. The price we obtain for such assets or businesses will be driven by performance of those businesses and the current market demand for such assets, and we may not be able to realize a profit upon sale. If we are unable to make dispositions in a timely manner or at profitable price, our business, net income, and earnings per share could be materially and adversely affected.
We are vulnerable to increases in postal rates and disruptions in postal services.
Our services depend on the USPS and other commercial delivery services to deliver products. Standard postage rates have increased in recent years (most recently in January 2017) and may continue to do so at frequent and unpredictable intervals. Postage rates influence the demand for our services even though the cost of mailings is typically borne by our clients (and is not directly reflected in our revenues or expenses) because clients tend to reduce other elements of marketing spending to offset increased postage costs. Accordingly, future postal increases or disruptions in the operations of the USPS may have an adverse impact on us.
In addition, the USPS has had significant financial and operational challenges recently. In reaction, the USPS has proposed many changes in its services, such as delivery frequency and facility access. These changes, together with others that may be adopted, individually or in combination with other market factors, could materially and negatively affect our costs and ability to meet our clients’ expectations.
We are vulnerable to increases in paper prices.
Prices of print materials are subject to fluctuations. Increased paper costs could cause our customers to reduce spending on other marketing programs, or to shift to formats, sizes, or media which may be less profitable for us, in each case potentially materially affecting our revenues and profits.
Our financial results could be negatively impacted by impairments of goodwill.
In the third quarter of 2015, as a result of a sustained decline in our market capitalization below our book value of equity and recent operating performance, we performed an interim impairment test of our Customer Interaction and Trillium goodwill reporting units. As a result, we recorded a non-cash impairment charge of $209.9 million in our Customer Interaction segment.
Our annual impairment test in 2016 indicated a $38.7 million impairment of goodwill that is recorded in the Consolidated Statements of Comprehensive Income (Loss) at December 31, 2016. As of December 31, 2016, the net book value of our goodwill and other intangibles represented approximately $37.8 million out of our total assets of $213.4 million. We test goodwill and other intangible assets with indefinite useful lives for impairment as of November 30 of each year and on an interim basis should factors or indicators become apparent that would require an interim test. A downward revision in the fair value of our reporting unit or any of the other intangible assets could result in additional impairments and non-cash charges. Any such impairment charges could have a significant negative effect on our reported net income.
Our indebtedness may adversely impact our ability to react to changes in our business or changes in general economic conditions.
On April 17, 2017, we entered into a credit agreement with Texas Capital Bank, N.A. as Lender. The agreement consists of a two-year $20 million credit facility guaranteed by HHS Guaranty, LLC, an entity formed by certain members of the Shelton family, descendants of one of the company's founders. See Note C, Long-Term Debt, in the Notes to Consolidated Financial Statements for further discussion.
During 2016, we failed to comply with certain covenants under our 2016 Secured Credit Facility with Wells Fargo Bank, N.A. (the "2016 Secured Credit Facility"). The lenders waived our noncompliance subject to certain conditions. The proceeds of the sale of Trillium were used to pay off the remaining obligation related to the 2016 Secured Credit Facility. We may incur additional indebtedness in the future and the terms of future arrangements may be less favorable to the company than our previous or current facilities. Any failure to obtain new financing arrangements on favorable terms could have a material and adverse effect on our liquidity position.
14
The amount of our indebtedness and the terms under which we borrow money under any future credit facilities or other agreements could have significant consequences for our business. Borrowings may include covenants requiring that we maintain certain financial measures and ratios. Covenant and ratio requirements may limit the manner in which we can conduct our business, and we may be unable to engage in favorable business activities or finance future operations and capital needs. A failure to comply with these restrictions or to maintain the financial measures and ratios contained in the debt agreements could lead to an event of default that could result in an acceleration of indebtedness. In addition, the amount and terms of any future indebtedness could:
• | limit our flexibility in planning for, or reacting to, changes in our business and the industries in which we operate, including limiting our ability to invest in our strategic initiatives, and consequently, place us at a competitive disadvantage; |
• | reduce the availability of our cash flows that would otherwise be available to fund working capital, capital expenditures, acquisitions, and other general corporate purposes; and |
• | result in higher interest expense in the event of increases in interest rates, as discussed below under the Risk Factor “Interest rate increases could affect our results of operations, cash flows, and financial position.” |
We are unlikely to declare cash dividends or repurchase our shares.
Although our Board of Directors (the "Board") has in the past authorized the payment of quarterly cash dividends on our common stock, we announced in 2016 that we did not plan to declare any further dividends. In addition, although our board has authorized stock purchase programs (and we repurchased shares as recently as 2015), we are unlikely to make any repurchases in the near term. Decisions to pay dividends on our common stock or to repurchase our common stock will be based upon periodic determinations by our board that such dividends or repurchases are both in compliance with all applicable laws and agreements and in the best interest of our stockholders after considering our financial condition and results of operations, the price of our common stock, credit conditions, and such other factors as are deemed relevant by our Board. The failure to pay a cash dividend or repurchase stock could adversely affect the market price of our common stock.
Interest rate increases could affect our results of operations, cash flows and financial position.
Interest rate fluctuations in Europe and the U.S. can affect the amount of interest we pay related to our debt and the amount we earn on cash equivalents. Our primary interest rate exposure during 2016 was to interest rate fluctuations in Europe, specifically Eurodollar rates, due to their impact on interest related to our prior credit facilities. On December 31, 2016, we did not have any debt outstanding under the prior credit facilities. On April 17, 2017 we entered into the Texas Capital Credit Facility, which consists of a two-year $20 million revolving credit facility. Our results of operations, cash flows, and financial position could be materially or adversely affected by significant increases in interest rates. We also have exposure to interest rate fluctuations in the U.S., specifically money market, commercial paper, and overnight time deposit rates, as these affect our earnings on excess cash. Even with the offsetting increase in earnings on excess cash in the event of an interest rate increase, we cannot be assured that future interest rate increases will not have a material adverse impact on our business, financial position, or operating results.
We are subject to risks associated with operations outside the U.S.
Harte Hanks conducts business outside of the U.S. During 2016, approximately 19.7% of our revenues were derived from operations outside the U.S., primarily Europe and Asia. We may expand our international operations in the future as part of our growth strategy. Accordingly, our future operating results could be negatively affected by a variety of factors, some of which are beyond our control, including:
• | social, economic, and political instability; |
• | changes in local, national, and international legal requirements or policies resulting in burdensome government controls, tariffs, restrictions, embargoes, or export license requirements; |
• | higher rates of inflation; |
• | the potential for nationalization of enterprises; |
• | less favorable labor laws that may increase employment costs and decrease workforce flexibility; |
• | potentially adverse tax treatment; |
• | less favorable foreign intellectual property laws that would make it more difficult to protect our intellectual property from misappropriation; |
15
• | more onerous or differing data privacy and security requirements or other marketing regulations; |
• | longer payment cycles; and |
• | the differing costs and difficulties of managing international operations. |
In addition, exchange rate fluctuations may have an impact on our future costs or on future cash flows from foreign investments. We have not entered into any foreign currency forward exchange contracts or other derivative instruments to hedge the effects of adverse fluctuations in foreign currency exchange rates. The various risks that are inherent in doing business in the U.S. are also generally applicable to doing business anywhere else, and may be exacerbated by the difficulty of doing business in numerous sovereign jurisdictions due to differences in culture, laws, and regulations.
We have identified material weaknesses in our internal control over financial reporting that could, if not remediated, result in material misstatements in our financial statements. In addition, current and potential stockholders could lose confidence in our financial reporting, which could cause our stock price to decline.
A material weakness is a deficiency, or a combination of deficiencies, in internal control over financial reporting such that there is a reasonable possibility that a material misstatement of the company’s annual or interim consolidated financial statements will not be prevented or detected on a timely basis. We have identified control deficiencies in our financial reporting process that constitute material weaknesses and for which remediation is still in process as of December 31, 2016.
As discussed in Part II, Item 9A, we identified material weaknesses in the following areas (i) the effectiveness of the control environment, risk assessment, information and communication, monitoring, and design and implementation of control activities, (ii) the effectiveness of internal controls over revenue recognition, (iii) the effectiveness of the accounting for the contingent consideration, (iv) the effectiveness of evaluation of goodwill for impairment, (v) the effectiveness of controls around evaluation of deferred tax assets, and (vi) the effectiveness of controls over the financial closing and reporting process. As a result of these material weaknesses management has determined that our disclosure controls and procedures and internal control over financial reporting were not effective as of December 31, 2016.
In light of the material weaknesses identified, we performed additional analysis and procedures to ensure that our consolidated financial statements were prepared in accordance with GAAP and accurately reflected our financial position and results of operations as of and for the year ended December 31, 2016. Prior to our December 31, 2016 fiscal year end, we began taking a number of actions in order to remediate the material weaknesses described above, including developing a plan to redesign processes and controls. We are assessing tools and potential enhancements to document, support, and review controls to better address both the accuracy and precision of management's review. Our remediation efforts will continue into the fiscal year ending December 31, 2017. We expect to incur additional costs remediating these material weaknesses.
Although we believe we are taking appropriate actions to remediate the control deficiencies identified and to strengthen our internal control over financial reporting, we may need to take additional measures to fully mitigate the material weaknesses discussed above. Measures to improve our internal controls may not be sufficient to ensure that our internal controls are effective or that the identified material weaknesses will not result in a material misstatement of our annual or interim consolidated financial statements. In addition, other material weaknesses or deficiencies may be identified in the future. If we are unable to correct material weaknesses in internal controls in a timely manner, our ability to record, process, summarize, and report financial information accurately and within the time periods specified in the rules and forms of the SEC will be adversely affected. This failure could negatively affect the market price and trading liquidity of our common stock, cause investors to lose confidence in our reported financial information, subject us to civil and criminal investigations and penalties, and adversely impact our business and financial condition.
Our management, including our Chief Executive Officer and Chief Financial Officer, does not expect that our internal control over financial reporting will prevent all errors and all fraud. A control system, no matter how well designed and operated, can provide only reasonable, not absolute, assurance that the control system's objectives will be met. Further, the design of a control system must reflect the fact that there are resource constraints, and the benefits of controls must be considered relative to their costs. Controls can be circumvented by the individual acts of some persons, by collusion of two or more people, or by management override of the controls. Over time, controls may become inadequate because changes in conditions or deterioration in the degree of compliance with policies or procedures may occur. Implementation of new technology related to the control system may result in misstatements due to errors that are not detected and corrected during testing. Because of the inherent limitations in a cost-effective control system, misstatements due to error or fraud may occur and may not be detected.
16
Fluctuation in our revenue and operating results and other factors may impact the volatility of our stock price.
The price at which our common stock has traded in recent years has fluctuated greatly and has declined significantly. Our common stock price may continue to be volatile due to a number of factors including the following (some of which are beyond our control):
• | the overall strength of the economies of the markets we serve and general market volatility; |
• | variations in our operating results from period to period and variations between our actual operating results and the expectations of securities analysts, investors, and the financial community; |
• | unanticipated developments with client engagements or client demand, such as variations in the size, budget, or progress toward the completion of engagements, variability in the market demand for our services, client consolidations, and the unanticipated termination of several major client engagements; |
• | announcements of developments affecting our businesses; |
• | competition and the operating results of our competitors; and |
• | other factors discussed elsewhere in this Item 1A, “Risk Factors.” |
As a result of these and other factors, investors in our common stock may not be able to resell their shares at or above their original purchase price.
Our financial performance and failure to timely file periodic reports with the SEC has harmed our commercial reputation and relationship with customers, vendors and other commercial parties, and may impair our ability to attract, retain and motivate employees.
Our declining financial performance and failure to timely file periodic reports with the SEC has caused customers and vendors to increase scrutiny on payment and performance terms in our agreements, which may impose additional costs (or result in reduced profitability) in our operations. Clients, vendors and partners (and prospective clients, vendors and partner) may also decline to do business with us due to their concerns regarding our financial condition. Additionally, due to our liquidity constraints, we may be unable to aggressively price our services to win work in competitive bid situations. These impediments to working with clients, vendors and partners may reduce both our overall revenues and profitability, and consequently the value of our common stock.
Likewise, our declining financial performance and failure to timely file periodic reports with the SEC has negatively affected employee morale and compensation. Due to financial constraints, we may have difficulty providing compensation that is sufficient to attract, retain and motivate employees, especially skilled professionals for whom sizeable bonus payouts are a key element of market-driven cash compensation. Furthermore, the decline in the price of our common stock has eroded the value of our equity-based incentive programs. If we are unable to attract, retain and motivate employees despite our financial performance and within the resource constraints, it will impair our ability to effectively serve our clients, which in turn is likely to reduce both our overall revenues and profitability, and consequently the value of our common stock.
Our failure to timely file any periodic reports with the SEC may prevent us from complying with the NYSE rules and
may make it more difficult for us to access the public markets to raise debt or equity capital.
Despite extensive efforts, we were unable to file our Annual Report on Form 10-K for the year ended December 31,2016 within the time frame required by the SEC (including the extension permitted by Rule 12b-25 under the Exchange Act). We also have not filed our Quarterly Report on Form 10-Q for the quarter ended March 31, 2017 within the time allowed by the SEC, and may be unable to file future Quarterly Reports on Form 10-Q within the time prescribed by the SEC. As a result, we are not in full compliance with the NYSE Listed Company Manual, Section 802.01E. We are required to comply with the NYSE Listed Company Manual as a condition for our common stock to continue to be listed on the NYSE. If we are unable to comply with such conditions, then our shares of common stock are subject to delisting from the NYSE. A delisting of our common stock from the NYSE could have a significant negative effect on the value and liquidity of our securities, may preclude us from using exemptions from certain state and federal securities regulations, and could adversely affect our ability to raise capital on terms acceptable to us or at all.
In addition, because we were unable to timely file our Annual Report, we will not be eligible to use a registration statement on Form S-3 to conduct public offerings of our securities until we have timely made our periodic filings with the SEC for a full year. Our inability to use Form S-3 during this time period may have a negative impact on our ability to access the public capital markets in a timely fashion because we would be required to file a long-form registration statement on Form S-1 and have it reviewed and declared effective by the SEC. This may limit our ability to access the public markets to raise debt or equity
17
capital. Our limited ability to access the public markets could prevent us from pursuing transactions or implementing business strategies that we believe would be beneficial to our business.
If the Company cannot meet the New York Stock Exchange continued listing requirements, the NYSE may delist our common stock.
The Company’s common stock is currently listed on the NYSE. In the future, if the company is unable to meet the continued listing requirements of the NYSE-which require, among other things, that the average closing price of the common stock remain at or above $1.00 over 30 consecutive trading days-the common stock could be delisted if the company is unable to regain compliance. A delisting of our common stock could negatively impact the company by, among other things, reducing the liquidity and market price of the common stock and reducing the number of investors willing to hold or acquire the common stock.
Our certificate of incorporation and bylaws contain anti-takeover protections that may discourage or prevent strategic transactions, including a takeover of our company, even if such a transaction would be beneficial to our stockholders
Provisions contained in our certificate of incorporation and bylaws, in conjunction with provisions of the Delaware General Corporation Law, could delay or prevent a third party from entering into a strategic transaction with us, even if such a transaction would benefit our stockholders. For example, our certificate of incorporation and bylaws provide for a staggered board of directors, do not allow written consents by stockholders, and have strict advance notice and disclosure requirements for nominees and stockholder proposals.
ITEM 1B. UNRESOLVED STAFF COMMENTS
None.
ITEM 2. PROPERTIES
Our business is conducted in facilities worldwide containing aggregate space of approximately 1.7 million square feet. All facilities are held under leases, which expire at dates through 2025.
ITEM 3. LEGAL PROCEEDINGS
Information regarding legal proceedings is set forth in Note I, Commitments and Contingencies, of the “Notes to Consolidated Financial Statements” and is incorporated herein by reference.
ITEM 4. MINE SAFETY DISCLOSURES
Not applicable.
18
PART II
ITEM 5. MARKET FOR REGISTRANT’S COMMON EQUITY, RELATED STOCKHOLDER MATTERS AND ISSUER PURCHASES OF EQUITY SECURITIES
Common Stock
Our common stock is listed on the NYSE (symbol: HHS). The reported high and low quarterly sales price ranges for 2016 and 2015 were as follows:
2016 | 2015 | |||||||||||||||
High | Low | High | Low | |||||||||||||
First Quarter | $ | 3.72 | $ | 2.53 | $ | 8.10 | $ | 7.27 | ||||||||
Second Quarter | 2.74 | 0.85 | 7.79 | 5.96 | ||||||||||||
Third Quarter | 1.93 | 1.42 | 6.00 | 3.40 | ||||||||||||
Fourth Quarter | 1.83 | 1.28 | 4.31 | 3.23 | ||||||||||||
We paid a dividend of 8.5 cents per share in the first quarter of 2016 and a quarterly dividend of 8.5 cents per share in each quarter of 2015. We currently intend to retain any future earnings and do not expect to pay dividends on our common stock. Any future dividend declaration can be made only upon, and subject to, approval of our board of directors, based on its business judgment.
As of May 31, 2017, there are approximately 1,900 holders of record.
Issuer Purchases of Equity Securities
The following table contains information about our purchases of equity securities during the fourth quarter of 2016:
Period | Total Number of Shares Purchased (1) | Average Price Paid per Share | Total Number of Shares Purchased as Part of a Publicly Announced Plan (2) | Maximum Dollar Amount that May Yet Be Spent Under the Plan | ||||||||||
October 1 - 31, 2016 | 2,504 | $ | 1.45 | — | $ | 11,437,538 | ||||||||
November 1 - 30, 2016 | — | $ | — | — | $ | 11,437,538 | ||||||||
December 1 - 31, 2016 | 758 | $ | 1.52 | — | $ | 11,437,538 | ||||||||
Total | 3,262 | $ | 1.47 | — | ||||||||||
(1) Total number of shares purchased includes shares, if any, (i) purchased as part of our publicly announced stock repurchase program, and (ii) pursuant to our 2013 Omnibus Incentive Plan and applicable inducement award agreements with certain executives, withheld to pay withholding taxes upon the vesting of shares.
(2) During the fourth quarter of 2016, we did not purchase any shares of our common stock through our stock repurchase program that was publicly announced in August 2014. Under this program, from which shares can be purchased in the open market, our board of directors has authorized us to spend up to $20.0 million to repurchase shares of our outstanding common stock. As of December 31, 2016, we have repurchased 1,506,679 shares and spent $8.6 million under this authorization. Through December 31, 2016, we had repurchased a total of 67,887,989 shares at an average price of $18.13 per share under this program and previously announced programs.
Comparison of Stockholder Returns
The following graph compares the cumulative total return of our common stock during the period December 31, 2011 to December 31, 2016 with the Standard & Poor’s 500 Stock Index ("S&P 500 Index") and with our peer group.
Our current peer group includes: Acxiom Corporation, Cenveo, Inc., Convergys Corp., Conversant, Inc. (through acquisition by Alliance Data Systems Corp. in December 2014), Dex Media, Inc. (through delisting in July 2016), Digital River, Inc. (through acquisition by Siris Capital Group LLC in February 2015), Dun & Bradstreet Corporation, Forrester Research, Inc., Gartner, Inc., Informatica Corp. (through acquisition by Permira Advisers LLC in August 2015), MDC Partners, Inc., Meredith Corp., Reach Local, Inc. (through acquisition by Gannett Company, Inc. in August 2016), Sykes Enterprises, Inc., and TeleTech Holdings, Inc.
19
The S&P Index includes 500 U.S. companies in the industrial, transportation, utilities, and financial sectors and is weighted by market capitalization. The peer groups are also weighted by market capitalization.
The graph depicts the results of investing $100 in our common stock, the S&P 500 Index and the peer groups at closing prices on December 31, 2011 and assumes the reinvestment of dividends.
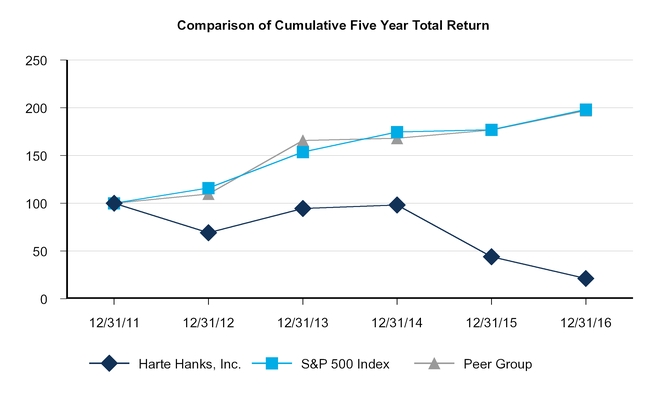
ANNUAL RETURN PERCENTAGE Years Ending | |||||||||||||
Company Name / Index | Dec 2012 | Dec 2013 | Dec 2014 | Dec 2015 | Dec 2016 | ||||||||
Harte Hanks, Inc. | (30.94 | ) | 36.62 | 3.88 | (55.17 | ) | (52.11 | ) | |||||
S&P 500 Index | 16.00 | 32.39 | 13.69 | 1.38 | 11.96 | ||||||||
Peer Group | 9.55 | 51.30 | 1.36 | 5.12 | 11.58 | ||||||||
20
ITEM 6. SELECTED FINANCIAL DATA
The following table sets forth our summary historical financial information for the periods ended and as of the dates indicated. You should read the following historical financial information along with “Management’s Discussion and Analysis of Financial Condition and Results of Operations” contained in this Form 10-K. The fiscal year financial information included in the table below for the years ended December 31, 2016, 2015, and 2014 is derived from audited financial statements contained in this Form 10-K. Information for the years ended December 31, 2013 and 2012 was derived from previously filed audited financial statements not contained in this Form 10-K. All financial information presented below excludes amounts related to our discontinued Trillium operations.
In thousands, except per share amounts | 2016 | 2015 | 2014 | 2013 | 2012 | |||||||||||||||
Statement of Comprehensive Income Data | ||||||||||||||||||||
Revenues | $ | 404,412 | $ | 444,166 | $ | 499,444 | $ | 503,760 | $ | 528,042 | ||||||||||
Operating income (loss) from continuing operations | (55,780 | ) | (203,269 | ) | 25,285 | 24,772 | 47,035 | |||||||||||||
Income (loss) from continuing operations | $ | (89,778 | ) | $ | (181,066 | ) | $ | 13,754 | $ | 11,637 | $ | 25,904 | ||||||||
Earnings (loss) from continuing operations per common share—diluted | $ | (1.46 | ) | $ | (2.94 | ) | $ | 0.22 | $ | 0.19 | $ | 0.41 | ||||||||
Weighted-average common and common equivalent shares outstanding—diluted | 61,487 | 61,643 | 62,658 | 62,812 | 63,148 | |||||||||||||||
Cash dividends per share | $ | 0.09 | $ | 0.34 | $ | 0.34 | $ | 0.26 | $ | 0.43 | ||||||||||
Balance sheet data (at end of period) (1) | ||||||||||||||||||||
Total assets | 213,437 | 414,413 | 643,613 | 684,613 | 706,212 | |||||||||||||||
Total debt | — | 77,105 | 82,123 | 97,079 | 109,572 | |||||||||||||||
Total stockholders’ equity | 2,656 | 140,316 | 326,676 | 349,054 | 328,164 | |||||||||||||||
(1 | ) | Includes reclassification of debt issuance costs as a reduction of the debt balance related to ASU 2015-03, Interest-Imputation of Interest (Subtopic 835-30): Simplifying the Presentation of Debt Issuance Costs. Prior to the adoption of this ASU, unamortized debt issuance costs were included in other assets. Please refer to Note A, Significant Accounting Policies, and Note C, Long-Term Debt, of the Notes to Consolidated Financial Statements. | |
21
ITEM 7. MANAGEMENT’S DISCUSSION AND ANALYSIS OF FINANCIAL CONDITION AND RESULTS OF OPERATIONS
Cautionary Note About Forward-Looking Statements
This report, including this Management’s Discussion and Analysis of Financial Condition and Results of Operations ("MD&A"), contains “forward-looking statements” within the meaning of the federal securities laws. All such statements are qualified by the cautionary note included under Item 1A above, which is provided pursuant to the safe harbor provisions of Section 27A of the 1933 Act and Section 21E of the 1934 Act. Actual results may vary materially from what is expressed in or indicated by the forward-looking statements.
Overview
The following MD&A section is intended to help the reader understand the results of operations and financial condition of Harte Hanks, Inc. ("Harte Hanks"). This section is provided as a supplement to, and should be read in conjunction with, our consolidated financial statements and the accompanying notes to the consolidated financial statements.
Harte Hanks partners with clients to deliver relevant, connected, and quality customer interactions. Our approach starts with discovery and learning, which leads to customer journey mapping, creative and content development, analytics, and data management, and ends with execution and support in a variety of digital and traditional channels. We do something powerful: we produce engaging and memorable customer interactions to drive business results for our clients, which is why Harte Hanks is famous for developing better customer relationships and experiences and defining interaction-led marketing.
Our services offer a wide variety of integrated, multi-channel, data-driven solutions for top brands around the globe. We help our clients gain insight into their customers’ behaviors from their data and use that insight to create innovative multi-channel marketing programs to deliver a return on marketing investment. We believe our clients’ success is determined not only by how good their tools are, but how well we help them use the tools to gain insight and analyze their consumers. This results in a strong and enduring relationship between our clients and their customers. We offer a full complement of capabilities and resources to provide a broad range of marketing services, in media from direct mail to email, including:
• | agency and digital services; |
• | database marketing solutions and business-to-business lead generation; |
• | direct mail; and |
• | contact centers. |
Previously, Harte Hanks also provided data quality solutions through Trillium Software, Inc. and its subsidiaries (collectively "Trillium"). On December 23, 2016, we sold the equity interests of our Trillium operations for gross proceeds of $112.0 million. This transaction resulted in an after-tax loss of $39.9 million. Because Trillium represented a distinct business unit with operations and cash flows that can clearly be distinguished, both operationally and for financial purposes, from the rest of Harte Hanks, the results of the Trillium operations are reported as discontinued operations for all periods presented. Results of the remaining Harte Hanks business are reported as continuing operations.
We are affected by the general, national, and international economic and business conditions in the markets where we and our customers operate. Marketing budgets are largely discretionary in nature, and as a consequence are easier for our clients to reduce in the short-term than other expenses. Our revenues are also affected by the economic fundamentals of each industry that we serve, various market factors, including the demand for services by our clients, and the financial condition of and budgets available to specific clients, among other factors. We remain committed to making the investments necessary to execute our multichannel strategy while also continuing to adjust our cost structure to reduce costs in the parts of the business that are not growing as fast. We believe these actions will improve our profitability in future periods.
Our principal operating expense items are labor, outsourced costs, and mail supply chain management.
We continued to face a challenging competitive environment in 2016. The sale of Trillium in 2016, the new credit facility we entered into in 2017, and our announced intention to sell 3Q Digital are all parts of our efforts to prioritize our investments and focus on our core business of optimizing our clients' customer journey across an omni-channel delivery platform. We expect these actions will enhance our liquidity and financial flexibility. For additional information see Liquidity and Capital Resources. We have taken actions to return the business to profitability and improve our cash, liquidity, and financial position. This includes workforce restructuring, making investments targeted at improving product offerings, and implementing expense reductions.
22
Results of Continuing Operations
As discussed in Note N, Discontinued Operations, of the Notes to Consolidated Financial Statements we sold the equity interests of our Trillium operations on December 23, 2016. Therefore, the operating results of Trillium, including the loss on the sale, is reported as discontinued operations in the Consolidated Financial Statements, and are excluded from Management’s Discussion and Analysis of Financial Condition and Results of Operations below.
Operating results from our continuing operations were as follows:
Year Ended December 31, | ||||||||||||||||||
In thousands, except per share amounts | 2016 | % Change | 2015 | % Change | 2014 | |||||||||||||
Revenues | $ | 404,412 | -9.0 | % | $ | 444,166 | -11.1 | % | $ | 499,444 | ||||||||
Operating expenses | 460,192 | -28.9 | % | 647,435 | 36.5 | % | 474,159 | |||||||||||
Operating income (loss) | $ | (55,780 | ) | 72.6 | % | $ | (203,269 | ) | -903.9 | % | $ | 25,285 | ||||||
Operating Margin | (13.8 | )% | N/M | 5.1 | % | |||||||||||||
Income (loss) from continuing operations | $ | (89,778 | ) | 50.4 | % | $ | (181,066 | ) | N/M | $ | 13,754 | |||||||
Diluted EPS from continuing operations | $ | (1.46 | ) | 50.3 | % | $ | (2.94 | ) | N/M | $ | 0.22 | |||||||
(N/M = Not Meaningful)
Year ended December 31, 2016 vs. Year ended December 31, 2015
Revenues
Revenues from continuing operations were $404.4 million in the year ended December 31, 2016, compared to $444.2 million in the year ended December 31, 2015. These results reflect the impact of decreased revenue from our healthcare and pharmaceutical and retail verticals of $16.1 million, or 36.4%, and $12.5 million, or 10.3%, respectively, as the result of lost clients and clients reducing their marketing spend (in particular, reducing mail volumes). Our select markets vertical decreased $4.1 million, or 9.8%, compared to the prior year, primarily from the reduction of call center work supporting streaming enrollment services for an entertainment client. The decline of $4.0 million, or 4.0%, in our technology vertical was primarily driven by the loss of an electronics company client. Our financial services vertical decreased $3.8 million, or 5.9%, compared to the year ended December 31, 2015, due to reduced mail volumes. These decreases are slightly offset by an increase in our automobile and consumer brands vertical of $0.8 million, or 1.1%, compared to the year ended December 31, 2015.
Our revenue performance will depend on, among other factors, general economic conditions in the markets we serve and how successful we are at maintaining and growing business with existing clients, acquiring new clients, and meeting client demands. We believe that, in the long-term, an increasing portion of overall marketing and advertising expenditures will be moved from other advertising media to the targeted media space, and that our business will benefit as a result. Targeted media advertising results can be more effectively tracked, enabling measurement of the return on marketing investment.
Operating Expenses
Operating expenses from continuing operations were $460.2 million in the year ended December 31, 2016, compared to $647.4 million in 2015. This $187.2 million year-over-year decrease is primarily a result of an impairment loss of $209.9 million recorded in 2015 versus an impairment loss of $38.7 million in 2016. In addition, we experienced a decrease in production and distribution costs of $24.8 million, or 17.5%, primarily driven by lower fuel and freight costs, as well as decreased outsourced costs resulting from lower mail volumes. The decrease was partially offset by increased labor costs of $8.6 million, or 3.6%, primarily due to increased severance costs and non-recurring database development labor expense.
Our largest cost components are labor, outsourced costs, and mail supply chain costs. Each of these costs is somewhat variable and tends to fluctuate with revenues and the demand for our services. Mail supply chain rates have increased over the last few years due to demand and supply issues within the transportation industry. Future changes in mail supply chain rates will continue to impact our total production costs and total operating expenses, and may have an impact on future demand for our supply chain management.
Postage costs of mailings are borne by our clients and are not directly reflected in our revenues or expenses.
23
Year ended December 31, 2015 vs. Year ended December 31, 2014
Revenues
Revenues from continuing operations were $444.2 million in the year ended December 31, 2015, compared to $499.4 million in the year ended December 31, 2014. These results reflect the impact of decreased revenue from all of our verticals. Revenue from our retail and select markets verticals decreased $15.3 million, or 11.2%, and $6.7 million, or 14.1%, respectively, as the result of clients reducing mail volumes and database losses. Our auto and consumer brands vertical decreased $14.5 million, or 17.0%, compared to the prior year, primarily from the loss of agency work with a luxury auto manufacturer. Revenue from our technology vertical declined $15.5 million, or 13.1%, primarily driven by the sale of our B2B research business. Our healthcare and pharmaceutical vertical decreased $2.0 million, or 4.3%, and our financial services vertical decreased $1.2 million, or 1.9%, compared to the year ended December 31, 2014.
Operating Expenses
Operating expenses from continuing operations were $647.4 million in the year ended December 31, 2015, compared to $474.2 million in 2014. This $173.3 million year over year increase is primarily a result of a goodwill impairment loss of $209.9 million in the third quarter of 2015. In addition, general and administrative expense increased $1.8 million, or 4.3%, compared to the prior year, due to an increase in sales and marketing expense related to employment of additional sales force personnel. The increase was partially offset by a decrease in labor costs of $14.6 million, or 5.8%, primarily due to reductions in headcount and severance costs recorded in 2014. In addition, production and distribution costs decreased $23.4 million, or 14.1%, primarily driven by decreased lease expense, lower fuel costs, and decreased outsourced costs resulting from lower volumes.
Other Expense
Year ended December 31, 2016 vs. Year ended December 31, 2015
Total other expense was $13.4 million in the year ended December 31, 2016, compared to $15.2 million in 2015. This $1.8 million decrease is primarily the result of a $9.5 million loss on sale of our B2B research business in 2015, partially offset by a $7.0 million adjustment to the fair value of the contingent consideration. Interest expense decreased $1.6 million, or 31.1%, in 2016 compared to 2015 primarily due to the reclassification of interest expense for the 2016 Secured Credit Facility to discontinued operations in accordance with ASC 205-20-45-6. These decreases were offset by foreign currency losses of $1.3 million in the year ended December 31, 2016.
Year ended December 31, 2015 vs. Year ended December 31, 2014
Total other expense was $15.2 million in the year ended December 31, 2015, compared to $3.9 million in 2014. This $11.3 million increase is primarily the result of a $9.5 million loss on sale of our B2B research business in 2015. Interest expense increased $2.2 million, or 78.8%, in 2015 compared to 2014 primarily due to the interest accretion for the contingent consideration liability related to the purchase of 3Q Digital. See Note M, Acquisition and Disposition. These increases were offset slightly by foreign currency gains of $0.5 million in the year ended December 31, 2015.
Income Taxes
Year ended December 31, 2016 vs. Year ended December 31, 2015
Our 2016 income tax expense of $20.6 million resulted in a negative effective income tax rate of 29.9%. Unfavorably impacting our expense is nondeductible goodwill associated with our impairment loss and the deferred tax valuation allowance, the impact of which were $6.3 million and $34.5 million, respectively. This compares to our 2015 income tax benefit of $37.4 million that resulted in an effective income tax rate of 17.1%. Benefiting our 2015 rate was having a greater proportion of our income in jurisdictions outside the United States having tax rates below 35%.
Year ended December 31, 2015 vs. Year ended December 31, 2014
Our 2015 income tax benefit of $37.4 million resulted in an effective income tax rate of 17.1%. Unfavorably impacting our benefit is nondeductible goodwill associated with our impairment loss, nondeductible basis on the sale of operations, and foreign tax credit limitations on the dividends paid from foreign subsidiaries, the impact of which was $36.7 million, $0.7 million, and $0.6 million, respectively. Lastly, the unfavorable impact of state income taxes was principally offset by our ability to use tax credits. This compares to our 2014 income tax expense of $7.6 million that resulted in an effective income tax rate of 35.7%.
24
Benefiting our 2014 rate was a valuation allowance reversal associated with a recovery of previously remitted foreign tax, and having a greater proportion of our income in jurisdictions outside the United States having tax rates below 35%.
Income/Earnings Per Share from Continuing Operations
Year ended December 31, 2016 vs. Year ended December 31, 2015
We recorded a loss from continuing operations of $89.8 million and diluted loss per share from continuing operations of $1.46. These results compare to a loss from continuing operations of $181.1 million and diluted loss per share from continuing operations of $2.94 in 2015. The decrease in loss from continuing operations is primarily the result of a $209.9 million impairment loss related to goodwill recorded in 2015.
Year ended December 31, 2015 vs. Year ended December 31, 2014
We recorded a loss from continuing operations of $181.1 million and diluted loss per share from continuing operations of $2.94. These results compare to income from continuing operations of $13.8 million and diluted earnings per share from continuing operations of $0.22 in 2014. The decrease in income from continuing operations is primarily the result of an impairment loss of $209.9 million related to goodwill recorded in 2015.
Liquidity and Capital Resources
Sources and Uses of Cash
Our cash and cash equivalent balances were $46.0 million, $16.6 million, and $53.3 million as of December 31, 2016, 2015, and 2014, respectively. Our principal sources of liquidity are cash on hand, cash provided by operating activities, and borrowings. Our cash is primarily used for general corporate purposes, working capital requirements, and capital expenditures.
Operating Activities
Net cash provided by operating activities was $14.6 million, $33.3 million, and $26.0 million for the years ending December 31, 2016, 2015, and 2014, respectively. The $18.7 million decrease of net cash provided by operating activities in 2016 was the result a decrease of $51.3 million in cash provided by discontinued operations. The $7.3 million increase of net cash provided by operating activities in 2015 is attributable to favorable changes within our working capital accounts.
Investing Activities
Net cash provided by investing activities was $99.7 million for the year ending December 31, 2016 compared to cash used in investing activities of $36.1 million and $11.2 million for the years ending December 31, 2015, and 2014, respectively. The primary source of the increase in 2016 is the result the sale of Trillium for gross proceeds of $112.0 million reflected in the cash provided by investing activities within discontinued operations. The increase is also the result of the favorable impact of lower acquisition expenditures, as we purchased Aleutian Consulting for $3.5 million in 2016 but spent $29.9 million to purchase 3Q Digital in 2015. The $25.0 million increase in cash used by investing activities in 2015 compared to 2014 is driven by the acquisition of 3Q Digital. This was offset slightly by cash provided by the disposition of our B2B research business of $5.0 million and a decrease in capital expenditures.
Financing Activities
Net cash used in financing activities was $85.3 million, $31.9 million, and $44.6 million for the years ending December 31, 2016, 2015, and 2014, respectively. The $53.4 million increase in cash outflows in 2016 compared to 2015 is driven by costs incurred in connection with the commencement of the 2016 Secured Credit Facility and the subsequent repayment of the 2016 Secured Credit Facility, 2013 Revolving Credit Facility, and 2011 Term Loan Facility. This is offset slightly by the favorable impact of the suspension of dividend payments in 2016. Net cash used in financing activities decreased $12.7 million in 2015 compared to 2014. This is due to borrowings made in 2015 and a decline in cash used to purchase treasury shares.
Credit Facilities
On August 16, 2011, we entered into a five-year $122.5 million term loan facility ("2011 Term Loan Facility") with Bank of America, N.A., as Administrative Agent. The 2011 Term Loan Facility was repaid on March 11, 2016 using the proceeds of the 2016 Secured Credit Facility.
25
On August 8, 2013, we entered into a three-year $80 million revolving credit facility, which included a $25 million letter of credit sub-facility and a $5 million swing line loan sub-facility ("2013 Revolving Credit Facility") with Bank of America, N.A. (as Administrative Agent, Swing Line Lender, and L/C Issuer) and the other lenders party thereto. The 2013 Revolving Credit Facility was repaid on March 11, 2016 using the proceeds of the 2016 Secured Credit Facility.
On March 10, 2016, we entered into a secured credit facility with Wells Fargo Bank, N.A. as Administrative Agent. This facility consisted of a maximum $65.0 million revolving credit facility, and a $45.0 million term loan (collectively, the "2016 Secured Credit Facility"). A portion of the proceeds from the 2016 Secured Credit Facility was used to pay off the remaining obligation related to the 2011 Term Loan Facility and the 2013 Revolving Credit Facility.
The lenders provided waivers of our noncompliance of the minimum fixed charge coverage ratio and leverage ratios under the 2016 Secured Credit Facility as of April 30, 2016, June 30, 2016, September 30, 2016, and October 31, 2016. Additional covenants in the 2016 Secured Credit Facility included, among other things, restrictions on the company and its subsidiaries from liquidating, dissolving, suspending, or ceasing subsidiaries or a substantial portion of the business. As such, repayment of the 2016 Secured Credit Facility was mandatory following the completion of the sale of Trillium. Outstanding loans were repaid in full using the proceeds of the sale and the 2016 Secured Credit Facility was likewise terminated.
On April 17, 2017, we entered into a credit agreement with Texas Capital Bank, N.A. as Lender (the "Texas Capital Credit Facility"). The Texas Capital Credit Facility consists of a two-year $20 million credit facility secured by substantially all of our assets and is guaranteed by HHS Guaranty, LLC, an entity formed by certain members of the Shelton family, descendants of one of the company's founders. The credit facility adds additional financial flexibility to the company and will be used for working capital and general corporate purposes. See Note C, Long-Term Debt, in the Notes to Consolidated Financial Statements for further discussion.
Contractual Obligations
Contractual obligations at December 31, 2016 are as follows:
In thousands | Total | 2017 | 2018 | 2019 | 2020 | 2021 | Thereafter | |||||||||||||||||||||
Debt | $ | — | $ | — | $ | — | $ | — | $ | — | $ | — | $ | — | ||||||||||||||
Interest on debt | — | — | — | — | — | — | — | |||||||||||||||||||||
Operating lease obligation | 30,076 | 10,812 | 7,482 | 4,991 | 2,842 | 1,597 | 2,352 | |||||||||||||||||||||
Capital lease obligations | 1,577 | 559 | 522 | 459 | 35 | 2 | — | |||||||||||||||||||||
Unfunded pension plan benefit payments | 17,405 | 1,686 | 1,676 | 1,664 | 1,692 | 1,720 | 8,967 | |||||||||||||||||||||
Total contractual cash obligations | $ | 49,058 | $ | 13,057 | $ | 9,680 | $ | 7,114 | $ | 4,569 | $ | 3,319 | $ | 11,319 | ||||||||||||||
At December 31, 2016, we had total letters of credit in the amount of $4.1 million. No amounts were drawn against these letters of credit at December 31, 2016. These letters of credit renew annually and exist to support insurance programs relating to workers’ compensation, automobile, and general liability as well as facility lease obligations. We had no other off-balance sheet arrangements at December 31, 2016.
Dividends
We paid a quarterly dividend of 8.5 cents per share in the first quarter of 2016. We currently intend to retain any future earnings and do not expect to pay dividends on our common stock. Any future dividend declaration can be made only upon, and subject to, approval of our board of directors, based on its business judgment.
Share Repurchase
During 2016, we did not repurchase any shares of our common stock under our current stock repurchase program that was publicly announced in August 2014. Under our current program we are authorized to spend up to $20.0 million to repurchase shares of our outstanding common stock. At December 31, 2016, we had authorization of $11.4 million under this program. From 1997 through December 31, 2016, we have repurchased 67.9 million shares for an aggregate of $1.2 billion.
26
Outlook
We consider such factors as total cash and cash equivalents, current assets, current liabilities, total debt, revenues, operating income, cash flows from operations, investing activities, and financing activities when assessing our liquidity. Our management of cash is designed to optimize returns on cash balances and to ensure that it is readily available to meet our operating, investing, and financing requirements as they arise.
Our recent operating and financial performance (most notably decreased cash flows from operations) have caused us to closely review our ability to continue as a going concern. We have had greater than five consecutive years of declining revenues from continuing operations, and we have not reduced costs at a pace that has allowed us to be profitable in the past two years. Among other things, these trends have caused us to reduce investments in our business, cease dividends and stock repurchases, and caused us to fall out of compliance with financial covenants in our credit facilities. These trends are also significant factors in the goodwill impairment charges we recorded in 2015 and 2016, as well as the valuation allowance we recorded for 2016 in regard to certain deferred tax assets. Changing these trends and returning to revenue growth is essential to our success.
In April of 2017, we entered into a new credit agreement with Texas Capital Bank, N.A. (the "Texas Capital Credit Facility"). Upon closing, the Texas Capital Credit Facility provided $20 million in borrowing capacity under a revolving credit line. The Texas Capital Credit Facility has far more favorable and flexible covenant requirements than the 2016 Secured Credit Facility, and was planned to be sufficient in size for our needs given the nature and performance of our operations. See Note P, Subsequent Events, for additional discussion.
We have also obtained the deferral of a significant contingent liability that otherwise would have been due in 2018. We are required (under the terms of the purchase agreement for the acquisition of 3Q Digital) to pay the former owners of 3Q Digital an additional sum contingent on achievement of certain revenue growth goals for that business. The maximum amount of future payments that could be required to be paid under the contingent consideration is $35 million. On May 1, 2017, the company entered into an Agreement (the "3Q Agreement") with 3Q Digital, which defers our obligation to pay the contingent consideration to the former owners until April 1, 2019 or the sale of the 3Q Digital business, whichever is earlier. See Note P, Subsequent Events, in the Notes to Consolidated Financial Statements for additional discussion.
We believe that, in conjunction with our current liquidity position and management's execution of the new credit facility and the 3Q Agreement, there are no conditions or events, considered in the aggregate, that raise substantial doubt about our ability to continue as a going concern for the 12 months following the issuance of the financial statements.
We have taken actions to return the business to profitability and improve our cash, liquidity, and financial position. As we have in the past when revenues declined, in 2016 we began implementing additional significant expense reduction actions, including workforce reductions. These workforce actions are expected to continue into 2017 and will result in further expense reductions in our support functions. We also initiated the closing of our Baltimore direct mail facility in response to the declining demand for printed marketing materials. Continuing work from this facility is being transitioned to other facilities, allowing for higher utilization rates. The favorable impact of the facility closure is expected to begin in the first half of 2017, when the closure is completed.
In addition to the actions discussed above, we are taking additional steps to improve our operational and financial performance. We continue to identify and act to secure additional cost reductions and operating efficiencies. We have also focused investments toward improving product offerings that we believe will improve revenue growth. Finally, to increase financial flexibility and allow us to focus on our core business, we have taken steps to sell our 3Q Digital business (as announced in April 2017). The liquidity from the potential sale of 3Q Digital will allow us the liquidity to invest in strategies to strengthen our core offerings
Critical Accounting Policies
Critical accounting policies are defined as those that, in our judgment, are most important to the portrayal of our company’s financial condition and results of operations and which require complex or subjective judgments or estimates. The areas that we believe involve the most significant management estimates and assumptions are detailed below. Actual results could differ materially from those estimates under different assumptions and conditions. Historically, actual results have not differed significantly from our estimates.
Our Significant Accounting policies are described in Note A, Significant Accounting Policies, in the Notes to Consolidated Financial Statement.
27
Revenue Recognition
Application of various accounting principles in U.S. GAAP related to measurement and recognition of revenue requires us to make significant judgments and estimates. Specifically, complex arrangements with non-standard terms and conditions may require significant contract interpretation to determine appropriate accounting.
We recognize revenue when evidence of an arrangement exists, the price is fixed or determinable, the collectability is reasonably assured, and the delivery of service has occurred. Certain client programs provide for adjustments to billings based upon whether we achieve certain performance criteria. In these circumstance, revenue is recognized when foregoing conditions are met. We record revenue net of any taxes collected from customers and subsequently remitted to governmental authorities. Any payments received in advance of the performance of services or delivery of the product are recorded as deferred revenue until such time as the services are performed or the product is delivered. Costs incurred for search engine marketing solutions and postage costs of mailings are billed to our clients and are not directly reflected in our revenue.
We are currently evaluating the impact of the new revenue recognition standard on our consolidated financial statements.
Goodwill and Other Intangible Assets
We test goodwill for impairment annually or more frequently if events or circumstances indicate that it is more likely than not that goodwill might be impaired. Such events could include changes in the business climate in which we operate, attrition of key personnel, the current volatility in the capital markets, the company’s market capitalization compared to our book value, our recent operating performance, and financial projections.
Our determination of estimated fair value is based on a combination of the discounted cash flow method under the income approach and the guideline public company method under the market approach. These methods contain uncertainties as they require management to make significant assumptions and judgments. Significant assumptions and judgments used in estimating fair value include:
• | an estimated discount rate such as the cost of equity or the weighted average cost of capital ("WACC"), |
• | management's assumptions of future performance and historical operating results, |
• | market and industry specific risk premiums, |
• | concentration of control owners, |
• | valuation multiples, and |
• | the economic outlook as of the valuation date. |
The projected cash flows declined in the fiscal 2016 analysis, which corresponds to the continued decline in the business in the current year. As a result of the declining performance, we determined that the carrying value exceeded the fair value by $38.7 million as of December 31, 2016. The remaining carrying value of goodwill was $34.5 million as of December 31, 2016.
The estimates used to calculate fair value are subject to variability from period to period based on operating results, market conditions, and other factors. Some assumptions and projections inevitably will not materialize and unanticipated events and circumstances may occur during the forecast period. These could include changes in economic conditions, changes in interest rates, terms or availability of financing, and revisions in tax or regulatory law. Changes in the estimates used could materially affect the determination of fair value and potential goodwill impairment.
The company continues to monitor potential triggering events that could result in impairment charges.
Income Taxes
We are subject to income taxes in the United States and numerous other jurisdictions. Significant judgment is required in determining our provision for income taxes and income tax assets and liabilities, including evaluating uncertainties in the application of accounting principles and complex tax laws.
We record a provision for income taxes for the anticipated tax consequences of the reported results of operations using the asset and liability method. Under this method, we recognize deferred tax assets and liabilities for the expected future tax consequences of temporary differences between the financial reporting and tax basis of assets and liabilities, as well as for operating loss and tax credit carryforwards. Deferred tax assets and liabilities are measured using the tax rates that are expected to apply to taxable income for the years in which those tax assets and liabilities are expected to be realized or settled. We record a valuation allowance to reduce our deferred tax assets to the net amount that we believe is more likely than not to be
28
realized. For additional information on the valuation allowance see Note D, Income Taxes, in the Notes to Consolidated Financial Statements.
We recognize tax benefits from uncertain tax positions only if we believe that it is more likely than not that the tax position will be sustained on examination by the taxing authorities based on the technical merits of the position. Although we believe that we have adequately reserved for our uncertain tax positions, we can provide no assurance that the final tax outcome of these matters will not be materially different. We make adjustments to these reserves when facts and circumstances change, such as the closing of a tax audit or the refinement of an estimate. To the extent that the final tax outcome of these matters is different than the amounts recorded, such differences will affect the provision for income taxes in the period in which such determination is made and could have a material impact on our financial condition and operating results. The provision for income taxes includes the effects of any reserves that we believe are appropriate, as well as the related net interest and penalties.
Accounting for Contingent Consideration
Our 2015 acquisition of 3Q Digital included a contingent consideration. The contingent consideration liability is recognized at an amount equal to the present value of the contingent payment's estimated fair value each reporting period.
The fair value of the contingent consideration is sensitive to increases or decreases in revenue projections used in the assumptions. Changes in revenue performance and management's assumptions result in adjustments to the fair value of the contingent consideration, which are reflected in the results of operations in the period it is identified. Revisions could materially affect our financial position or results of operations. These assumptions are considered Level 3, as they are unobservable.
Recent Accounting Pronouncements
See Note A, Significant Accounting Policies, of the Notes to Consolidated Financial Statements for a discussion of certain accounting standards that we have recently adopted and certain accounting standards that we have not yet been required to adopt and may be applicable to our future financial condition and results of operations.
ITEM 7A. QUANTITATIVE AND QUALITATIVE DISCLOSURES ABOUT MARKET RISK
Market risk includes the risk of loss arising from adverse changes in market rates and prices. We face market risks related to interest rate variations and to foreign exchange rate variations. From time to time, we may utilize derivative financial instruments to manage our exposure to such risks.
We are exposed to market risk for changes in interest rates related to our credit facilities. Our earnings are affected by changes in short-term interest rates as a result of our credit facilities, which bear interest at the a base rate plus the applicable margin. Our 2016 Secured Credit Facility was terminated upon closing of the Trillium sale transaction and all debt was repaid. At December 31, 2016, the company did not have any outstanding debt.
Assuming the actual level of borrowings throughout 2016, and assuming a one percentage point change in the average interest rates, we estimate that our net income for 2016 would have changed by approximately $0.5 million. Under our newly established Texas Capital Credit Facility, we estimate that a one percentage point change in the average interest rate would have the same impact on our net income. Due to our overall debt level and cash balance at December 31, 2016, anticipated cash flows from operations, and the various financial alternatives available to us, we do not believe that we currently have significant exposure to market risks associated with an adverse change in interest rates. At this time, we have not entered into any interest rate swap or other derivative instruments to hedge the effects of adverse fluctuations in interest rates.
Our earnings are also affected by fluctuations in foreign currency exchange rates as a result of our operations in foreign countries. Our primary exchange rate exposure is to the Euro, British Pound Sterling, and Philippine Peso. We monitor these risks throughout the normal course of business. The majority of the transactions of our U.S. and foreign operations are denominated in the respective local currencies. Changes in exchange rates related to these types of transactions are reflected in the applicable line items making up operating income in our Consolidated Statements of Comprehensive Income (Loss). Due to the current level of operations conducted in foreign currencies, we do not believe that the impact of fluctuations in foreign currency exchange rates on these types of transactions is significant to our overall annual earnings. A smaller portion of our transactions are denominated in currencies other than the respective local currencies. For example, intercompany transactions that are expected to be settled in the near-term are denominated in U.S. Dollars. Since the accounting records of our foreign operations are kept in the respective local currency, any transactions denominated in other currencies are accounted for in the respective local currency at the time of the transaction. Any foreign currency gain or loss from these transactions, whether realized or unrealized, results in an adjustment to income, which is recorded in “Other, net” in our Consolidated Statements of Comprehensive Income (Loss). Transactions such as these amounted to $1.0 million in pre-tax currency losses in 2016 and
29
$0.4 million in pre-tax currency transaction gains in 2015. At this time we are not party to any foreign currency forward exchange contracts or other derivative instruments to hedge the effects of adverse fluctuations in foreign currency exchange rates.
We do not enter into derivative instruments for any purpose other than cash flow hedging. We do not speculate using derivative instruments.
ITEM 8. FINANCIAL STATEMENTS AND SUPPLEMENTARY DATA
The Financial Statements required to be presented under Item 8 are presented in the Consolidated Financial Statements and the notes thereto beginning at page 74 of this Form 10-K (Financial Statements).
ITEM 9. CHANGES IN AND DISAGREEMENTS WITH ACCOUNTANTS ON ACCOUNTING AND FINANCIAL DISCLOSURE
None.
ITEM 9A. CONTROLS AND PROCEDURES
Evaluation of Disclosure Controls and Procedures
As of December 31, 2016, the Company's management carried out an evaluation of the effectiveness of the design and operation of our disclosure controls and procedures (as defined in Rule 13a-15(e) under the Securities Exchange Act of 1934) under the supervision and with the participation of our Chief Executive Officer, Chief Financial Officer, and Corporate Controller. Disclosure controls and procedures are controls and procedures designed to ensure that information required to be disclosed in our reports filed or submitted under the Securities Exchange Act of 1934 is recorded, processed, summarized, and reported within the time periods specified in the SEC’s rules and forms. Disclosure controls and procedures include controls and procedures designed to ensure that information required to be disclosed in such reports is accumulated and communicated to management, including our Chief Executive Officer, Chief Financial Officer, and Corporate Controller as appropriate to allow timely decisions regarding required disclosure.
Based upon that evaluation, the Chief Executive Officer, Chief Financial Officer, and Corporate Controller concluded that due to the material weaknesses in our internal controls over financial reporting that are described below, our disclosure controls and procedures were not effective as of December 31, 2016. Notwithstanding the material weaknesses described below, each of our Chief Executive Officer, Chief Financial Officer, and Corporate Controller concluded that the consolidated financial statements included in this report present fairly, in all material respects, our financial position, results of operations, and cash flows as of the dates and for the periods presented, in conformity with accounting principles generally accepted in the United States of America (“GAAP”).
Management’s Report on Internal Control Over Financial Reporting
We are responsible for the preparation and integrity of the consolidated financial statements appearing in our Annual Report on Form 10-K. The consolidated financial statements were prepared in conformity with GAAP and include amounts based on management’s estimates and judgments. All other information in this report has been presented on a basis consistent with information included in the consolidated financial statements.
We are responsible for establishing and maintaining adequate internal control over financial reporting. Internal control over financial reporting (as defined in Rules 13a-15(f) and 15d-15(f) under the Securities Exchange Act) is a process designed by, or under the supervision of our Chief Executive Officer and Chief Financial Officer and effected by the company’s board of directors, management, and other personnel to provide reasonable assurance regarding the reliability of financial reporting and the preparation of financial statements for external purposes in accordance with GAAP.
We conducted an evaluation, under the supervision and with the participation of management including, the Chief Executive Officer, Chief Financial Officer, and Corporate Controller, on the effectiveness of internal control over financial reporting as of December 31, 2016, using the criteria set forth by the Committee of Sponsoring Organization of the Treadway Commission ("COSO") in Internal Control - Integrated Framework (2013). This evaluation included review of the documentation of controls, evaluation of the design effectiveness of controls, testing of the operating effectiveness of controls and a conclusion on this evaluation. Based on this assessment, management concluded that internal control over financial reporting was not effective because material weaknesses existed at December 31, 2016 as described below.
30
A material weakness, as defined in Rule 12b-2 under the Exchange Act, is a deficiency, or combination of deficiencies, in internal control over financial reporting such that there is a reasonable possibility that a material misstatement of the company's annual or interim financial statements will not be prevented or detected on a timely basis. We identified material weaknesses in each of the following areas.
Control Environment, Risk Assessment, Control Activities, Information and Communication, and Monitoring
We did not maintain effective internal control over financial reporting related to the following components: control environment, risk assessment, information and communication, monitoring, and control activities. In particular, controls related to the following were not designed to operate effectively:
Control Environment
• | We did not properly staff (in amount and with appropriate levels of experience and training) for the company’s accounting and reporting requirements. |
• | We did not sufficiently establish directives, guidance, and controls to enable management and other personnel to understand and carry out their internal control responsibilities. |
Risk Assessment
• | We did not design and maintain internal controls that were effective in identifying, assessing and addressing risks that significantly impact our financial statements or the effectiveness of the internal controls over financial reporting. Specifically, we did not modify our controls to sufficiently address changes in risks of material misstatement as a result of changes in our operations, organizational structure and operating environment. |
Information and Communication
• | We did not design and maintain effective controls to obtain, generate and communicate relevant and accurate information to support the function of internal control over financial reporting. Specifically, we did not identify all relevant information systems in support of our accounting and financial reporting processes. |
• | We did not use an adequate level of precision in our review of information used in controls. |
Monitoring
• | We did not design and maintain effective monitoring of compliance with established accounting policies, procedures and controls. This weakness included our failure to design and operate effective procedures and controls whose purpose is to evaluate and monitor the effectiveness of our individual control activities. |
These deficiencies are pervasive in nature and create a reasonable possibility that a material misstatement of the annual or interim financial statements would not have been prevented or detected on a timely basis. Further, the above material weaknesses contributed to the following material weaknesses at the control-activity level:
Revenue Recognition
Management did not design and maintain effective controls over the completeness and accuracy of data used to recognize revenue, the precision of management’s review of controls over revenue, and the identification of relevant systems used to process revenue transactions.
Contingent Consideration
Management did not design and maintain effective controls over the review and reconciliation of the calculation of the contingent consideration liability (including the input data used), a component of the acquisition of 3Q Digital, Inc., to provide reasonable assurance that such controls will prevent or detect a material error in the financial statements.
Goodwill Impairment
Management did not design and maintain effective controls around the evaluation of goodwill for impairment, including the review of assumptions used in the analysis, at an appropriate level of precision to provide reasonable assurance that such controls will prevent or detect a material error in the financial statements.
31
Recoverability of Deferred Tax Assets
Management did not design and maintain effective controls around the evaluation of the recoverability of deferred tax assets on a regular basis to provide reasonable assurance that such controls will prevent or detect a material error in the financial statements.
Financial Closing and Reporting
Management did not design and maintain effective controls over the financial closing and reporting process with sufficient precision to mitigate a potential material misstatement.
Deloitte & Touche LLP, our independent registered public accounting firm, has issued an audit report on the effectiveness of the company’s internal control over financial reporting as of December 31, 2016. This audit report appears below.
Remediation Plan for Material Weaknesses in Internal Control over Financial Reporting
Subsequent to our December 31, 2016 fiscal year end, we began developing a plan to redesign processes and controls to address all of the material weaknesses, as part of this we have begun taking steps in the areas of revenue recognition, the calculation of contingent consideration, goodwill impairment and deferred income taxes. We are assessing tools and potential enhancements to document, support, and review controls to better address both the accuracy and precision of management’s review. We are also evaluating our financial team, organizational structure, and certain changes to roles and responsibilities we can make to enhance controls and compliance. We expect to make further changes to our internal controls to enhance or further develop the remediation plan we have adopted. As we implement these plans, management may determine that additional steps may be necessary to remediate the material weaknesses.
While we intend to resolve all of the material control deficiencies discussed above, we cannot provide any assurance that these remediation efforts will be successful, will be completed quickly, or that our internal control over financial reporting will be effective as a result of these efforts by any particular date.
Changes in Internal Control over Financial Reporting
Other than the identification of the material weaknesses discussed above, there have been no changes in our internal controls over financial reporting during the quarter ended December 31, 2016 that have materially affected, or are reasonably likely to materially affect, our internal controls over financial reporting. As noted above, we have begun taking steps to implement changes to our internal control over financial reporting to address the material weaknesses described above.
32
REPORT OF INDEPENDENT REGISTERED PUBLIC ACCOUNTING FIRM
To the Board of Directors and Stockholders of
Harte Hanks, Inc.
San Antonio, Texas
We have audited Harte Hanks, Inc. and subsidiaries (the “Company’s”) internal control over financial reporting as of December 31, 2016, based on criteria established in Internal Control - Integrated Framework (2013) issued by the Committee of Sponsoring Organizations of the Treadway Commission. The Company's management is responsible for maintaining effective internal control over financial reporting and for its assessment of the effectiveness of internal control over financial reporting, included in the accompanying Management’s Report on Internal Control over Financial Reporting. Our responsibility is to express an opinion on the Company's internal control over financial reporting based on our audit.
We conducted our audit in accordance with the standards of the Public Company Accounting Oversight Board (United States). Those standards require that we plan and perform the audit to obtain reasonable assurance about whether effective internal control over financial reporting was maintained in all material respects. Our audit included obtaining an understanding of internal control over financial reporting, assessing the risk that a material weakness exists, testing and evaluating the design and operating effectiveness of internal control based on that risk, and performing such other procedures as we considered necessary in the circumstances. We believe that our audit provides a reasonable basis for our opinion.
A company's internal control over financial reporting is a process designed by, or under the supervision of, the company's principal executive and principal financial officers, or persons performing similar functions, and effected by the company's board of directors, management, and other personnel to provide reasonable assurance regarding the reliability of financial reporting and the preparation of financial statements for external purposes in accordance with generally accepted accounting principles. A company's internal control over financial reporting includes those policies and procedures that (1) pertain to the maintenance of records that, in reasonable detail, accurately and fairly reflect the transactions and dispositions of the assets of the company; (2) provide reasonable assurance that transactions are recorded as necessary to permit preparation of financial statements in accordance with generally accepted accounting principles, and that receipts and expenditures of the company are being made only in accordance with authorizations of management and directors of the company; and (3) provide reasonable assurance regarding prevention or timely detection of unauthorized acquisition, use, or disposition of the company's assets that could have a material effect on the financial statements.
Because of the inherent limitations of internal control over financial reporting, including the possibility of collusion or improper management override of controls, material misstatements due to error or fraud may not be prevented or detected on a timely basis. Also, projections of any evaluation of the effectiveness of the internal control over financial reporting to future periods are subject to the risk that the controls may become inadequate because of changes in conditions, or that the degree of compliance with the policies or procedures may deteriorate.
A material weakness is a deficiency, or a combination of deficiencies, in internal control over financial reporting, such that there is a reasonable possibility that a material misstatement of the company’s annual or interim financial statements will not be prevented or detected on a timely basis. The following material weaknesses have been identified and included in management's assessment:
• | Ineffective control environment, risk assessment, information and communication, and monitoring components of internal control |
• | Ineffective design of controls over the completeness and accuracy of information used to recognize revenue |
• | Insufficient level of precision with regards to management’s review controls over revenue |
• | Ineffective controls to ensure the identification of relevant information systems, including the relevant information technology general controls, used to process revenue transactions |
• | Ineffective controls over the accounting for contingent consideration |
• | Ineffective controls over the evaluation of goodwill for impairment |
• | Ineffective controls over the valuation of deferred tax assets |
• | Ineffective controls over the financial closing and reporting process |
These material weaknesses were considered in determining the nature, timing, and extent of audit tests applied in our audit of the consolidated financial statements as of and for the year ended December 31, 2016, of the Company and this report does not affect our report on such financial statements.
In our opinion, because of the effect of the material weaknesses identified above on the achievement of the objectives of the control criteria, the Company has not maintained effective internal control over financial reporting as of December 31, 2016,
33
based on the criteria established in Internal Control - Integrated Framework (2013) issued by the Committee of Sponsoring Organizations of the Treadway Commission.
We have also audited, in accordance with the standards of the Public Company Accounting Oversight Board (United States), the consolidated financial statements as of and for the year ended December 31, 2016 of the Company and our report dated June 16, 2017 expressed an unqualified opinion on those financial statements.
/s/ DELOITTE & TOUCHE LLP
San Antonio, TX
June 16, 2017
ITEM 9B. OTHER INFORMATION
None.
34
PART III
ITEM 10. DIRECTORS, EXECUTIVE OFFICERS AND CORPORATE GOVERNANCE
Section 16(a) Beneficial Ownership Reporting Compliance
Section 16(a) of the Securities Exchange Act of 1934, as amended (the “Exchange Act”), and related rules of the SEC require our directors and officers, and persons who own more than 10% of a registered class of our equity securities, to file initial reports of ownership and reports of changes in ownership with the SEC. These persons are required by SEC regulations to furnish us with copies of all Section 16(a) reports that they file. As with many public companies, we provide assistance to our directors and executive officers in making their Section 16(a) filings pursuant to powers of attorney granted by our insiders. To our knowledge, based solely on our review of the copies of Section 16(a) reports received by us with respect to 2016, including those reports that we have filed on behalf of our directors and executive officers pursuant to powers of attorney, or written representations from certain reporting persons, we believe that all filing requirements applicable to our directors, officers and persons who own more than 10% of a registered class of our equity securities have been satisfied on a timely basis; however, we did report on a SEC Form 5 filed August 23, 2016 a 2015 gift transaction of 400 shares of common stock by Mr. Houston H. Harte (who owns beneficially more than 10% of our common stock), which transaction had not previously been reported to us.
Directors and Executive Officers
The following table sets forth certain information about our current directors and executive officers as of May 15, 2017:
Name | Age | Position | |||
Stephen E. Carley | 64 | Director (Class II) | |||
David L. Copeland | 61 | Director (Class I) | |||
William F. Farley | 73 | Director (Class II) | |||
Christopher M. Harte | 69 | Director (Class I); Chairman of the Board | |||
Scott C. Key | 58 | Director (Class I) | |||
Judy C. Odom | 64 | Director (Class III) | |||
Karen A. Puckett | 56 | Director (Class III); President & CEO | |||
Carlos M. Alvarado | 43 | Vice President, Finance & Controller | |||
Frank M. Grillo | 51 | Executive Vice President, Sales & Chief Marketing Officer | |||
Andrew P Harrison | 45 | Executive Vice President, Contact Centers & CHRO | |||
Shirish R. Lal | 50 | Executive Vice President, COO & CTO | |||
Robert L. R. Munden | 48 | Executive Vice President, CFO, General Counsel & Secretary | |||
Class III directors serve through our 2017 annual meeting. The term of Class I directors expires at the 2018 annual meeting of stockholders, and the term of Class II directors expires at the 2019 annual meeting of stockholders.
Stephen E. Carley joined Harte Hanks as a director on March 17, 2013. Mr. Carley recently retired as Chief Executive Officer and director of Red Robin Gourmet Burgers, Inc., a casual dining restaurant chain. Prior to joining Red Robin, Mr. Carley served from April 2001 to August 2010 as the Chief Executive Officer of El Pollo Loco, Inc., a privately held restaurant company. Prior to his service at El Pollo Loco, Mr. Carley served in various management positions with several companies, including, PhotoPoint Corp., Universal City Hollywood, PepsiCo, Inc., and the Taco Bell Group.
We believe that Mr. Carley brings to the board of directors, among his other skills and qualifications, extensive retail and consumer-focused industry experience and valuable executive leadership, which he has gained as a chief executive officer of a corporation with significant, large-scale operations. In addition, he has extensive knowledge and understanding of marketing from a retail perspective, which should prove valuable for our company given the number of our retail-based clients.
David L. Copeland has served as a director of Harte Hanks since 1996. He has been employed by SIPCO, Inc., the management and investment company for the Andrew B. Shelton family, since 1980, and currently serves as its President. Since 1998, he has served as a director of First Financial Bankshares, Inc., a financial holding company. Currently, he serves on the executive and nominating committees and is also the audit committee chairman of First Financial Bankshares.
35
We believe that Mr. Copeland’s qualifications for our board include his experience serving on various committees for a publicly traded financial holding company. We also believe he offers us extensive knowledge of financial instruments, financial and economic trends and accounting expertise from serving as president of SIPCO, Inc. and on the audit committee of First Financial Bankshares. Mr. Copeland, a certified public accountant and a chartered financial analyst, would qualify as a financial expert for our audit committee.
William F. Farley has served as a director of Harte Hanks since 2003. Currently, he is a Principal with Livingston Capital, a private investment business he started in 2002. Since 2005, he has served on the board of trustees for Blue Cross Blue Shield of Minnesota and is a member of its technology committee business development committee and the chair of its investment committee. He served as Chairman and Chief Executive Officer of Science, Inc., a medical device company, from 2000 to 2002. He also served as Chairman and Chief Executive Officer of Kinnard Investments, a financial services holding company, from 1997 to 2000. From 1990 to 1996, he served as Vice Chairman of U.S. Bancorp, a financial services holding company.
We believe that Mr. Farley’s qualifications for our board include his extensive leadership experience at various financial institutions serving in roles as chairman and chief executive officer. We believe he provides important perspectives on financial markets, complex securities and financial and economic trends, as well as a broad prospective on corporate governance and risk management issues facing businesses today. Mr. Farley qualifies as a financial expert on our audit committee.
Christopher M. Harte has served as a director of Harte Hanks since 1993. Serving as our Chairman since July 1, 2013, he is also a private investor. He was Chairman and publisher of the Minneapolis Star Tribune from March 2007 through September 2009. The Minneapolis Star Tribune entered bankruptcy in January 2009 and emerged from bankruptcy in September 2009. He had previously been President and publisher of Knight-Ridder newspapers in State College, Pennsylvania and Akron, Ohio, and later President of a newspaper in Portland, Maine. He was a director of Geokinetics, Inc. (from 1997 to 2013) and Crown Resources Corporation (from 2002 until its merger with Kinross Gold Corporation in 2006).
We believe that Mr. Harte’s qualifications for our board include his extensive experience in managing, investing in and serving on the board of directors of a number of communications and other public and private companies. He offers the perspective of a seasoned board member, having served on our board of directors through several major transitions, both when the company was private as well as after its most recent public offering.
Scott C. Key joined the Harte Hanks board on March 17, 2013. Through June 2015, Mr. Key served as President and Chief Executive Officer of IHS, Inc. Mr. Key also served on IHS’ board of directors. Mr. Key joined IHS in 2003, and served in a variety of roles of progressively greater responsibility, most recently as IHS’ Chief Operating Officer (in 2011), Senior Vice President, Global Products and Services (in 2010) and President and Chief Operating Officer of IHS Global Insight (September 2008 - December 2009). From 2007-2008, he served as President and Chief Operating Officer of IHS Jane's and chairman of IHS Fairplay, and led an integrated sales team on a global basis. From 2003-2007, he served as IHS Senior Vice President of Corporate Strategy and Marketing, and led Energy Strategy, Products, Marketing and Software Development.
We believe Mr. Key’s extensive experience in global data- and analytics-intensive businesses brings a keen perspective as our company continues to develop more and different data-driven marketing offerings for our clients. In addition, his recent service as Chief Executive Officer of a fast growing company will provide a valuable perspective on our board as we deploy our new strategy.
Judy C. Odom has served as a director of Harte Hanks since 2003. Since November 2002, Ms. Odom has served on the board of directors of Leggett & Platt, Incorporated, a diversified manufacturing company, where she also serves as chair of the audit committee and as a member of its compensation and nominating and governance committees. In March 2014, Ms. Odom joined the board of directors of Sabre Corporation, a leading technology solutions provider to the global travel and tourism industry; she also serves as the chair of Sabre’s Audit Committee. From 1985 until 2002, she held numerous positions, most recently chief executive officer and chairman of the board, at Software Spectrum, Inc., a global business to business software services company, which she co-founded in 1983. Prior to founding Software Spectrum, she was a partner with the international accounting firm, Grant Thornton.
We believe that Ms. Odom’s qualifications to serve on our board include her board service with several companies allowing her to offer a broad leadership perspective on strategic and operating issues facing companies today. Her experience co-founding Software Spectrum, growing it to a large public company before selling it to another public company and serving as board chair provides the insight and perspective of a successful entrepreneur and long-serving chief executive officer with international operating experience. As a partner in an international accounting firm she supervised audits of many companies in various industries.
36
Karen A. Puckett has served as a director of Harte Hanks since 2009, and was appointed our President & Chief Executive Officer (CEO) in September 2015. Ms. Puckett served in several executive positions with CenturyLink, Inc. and its predecessor companies for over 15 years until her departure in June 2015, most recently as its President of Global Markets and Chief Operating Officer. CenturyLink is the third largest telecom communications company in the U.S. and a leader in network services as well as a global leader in cloud infrastructure and hosted IT solutions for enterprise customers. CenturyLink provides data voice and managed services in local, national and select international markets. Ms. Puckett also serves as a director (and member of the finance and personnel committees) of Entergy Corporation, an integrated energy company engaged primarily in electric power production and retail distribution operations.
We believe that Ms. Puckett’s qualifications for our board include her essential perspective as our current President & CEO, and her extensive prior leadership and operating experience at CenturyLink. We believe her involvement in the transformation and expansion of CenturyLink will provide the board with key insights on all aspects of challenging and rapidly-changing business situations.
Carlos M. Alvarado has served as the Vice President, Finance and Controller since June 2013. Prior to joining Harte Hanks, he was Director of Accounting for Visionworks of America, Inc., a subsidiary of Highmark’s vision holding company, HVHC Inc. Prior to joining HVHC, Mr. Alvarado spent six years in public accounting with Ernst & Young and Arthur Andersen, and two years at a retail grocery company.
Frank M. Grillo was appointed our Chief Marketing Officer in October of 2015, and now serves as our Executive Vice President, Sales & CMO. Mr. Grillo previously worked for CenturyLink, Inc. as a vice president of business marketing (beginning April 2012). Prior to CenturyLink, Mr. Grillo served in a variety of executive sales, operations and marketing roles for Cypress Communications (from September 2005 to January 2012) and Trinsic Communications (from March 2003 to August 2005).
Andrew P. Harrison is our Executive Vice President and Chief Human Resources Officer. Mr. Harrison also leads our contact center services. Mr. Harrison has worked in a variety of human resources and operational management and leadership roles for Harte Hanks for over 20 years.
Shirish R. Lal became our Executive Vice President, Chief Operating Officer & Chief Technology officer on March 14, 2016. Mr. Lal joined the company after working 11 years at CenturyLink, Inc. in a variety of positions of increasing responsibility within the marketing function, most recently serving as CenturyLink’s Chief Marketing Officer.
Robert L. R. Munden joined the company in April 2010 as our Senior Vice President, General Counsel and Secretary. Mr. Munden began serving as our Chief Financial Officer (CFO), in addition to his other roles, beginning in January 2017. From April 2005 through March 2010, Mr. Munden served as Vice President and Corporate Counsel of Safeguard Scientifics, Inc. From June 2002 through April 2005, he served as Corporate Counsel, North America for Taylor Nelson Sofres, a market research company (now a division of WPP PLC). Prior to that, Mr. Munden served as General Counsel to an online marketing and database services firm, as an associate with a corporate law firm and as an armor and cavalry officer in the U.S. Army.
CORPORATE GOVERNANCE
We believe that strong corporate governance helps to ensure that our company is managed for the long-term benefit of our stockholders. During the past year, we continued to review our corporate governance policies and practices, the applicable federal securities laws regarding corporate governance, and the corporate governance standards of the NYSE, the stock exchange on which our common stock is listed. This review is part of our continuing effort to enhance our corporate governance and to communicate our governance policies to stockholders and other interested parties.
You can access and print, free of charge, the charters of our Audit Committee, Compensation Committee and Nominating and Corporate Governance Committee (“Governance Committee”), as well as our Corporate Governance Principles, Business Conduct Policy, Code of Ethics and certain other policies and procedures on our website at www.hartehanks.com under the “Corporate Governance” subsection of our “Investors” section. Additionally, stockholders can request copies of any of these documents free of charge by writing to the following address:
Harte Hanks, Inc. (Attention: Secretary)
9601 McAllister Freeway, Suite 610
San Antonio, Texas 78216
From time to time, these governance documents may be revised in response to changing regulatory requirements, our evaluation of evolving best practices and industry norms and input from our stockholders and other interested parties. We encourage you to check our website periodically for the most recent versions.
37
Board of Directors and Board Committees
Our business is managed under the direction of our Board. The Board elects the Chief Executive Officer ("CEO") and other corporate officers, acts as an advisor to and resource for management, and monitors management’s performance. The Board, with the assistance of the Compensation Committee, also assists in planning for the succession of the CEO and certain other key positions. In addition, the Board oversees the conduct of our business and strategic plans to evaluate whether the business is being properly managed, and reviews and approves our financial objectives and major corporate plans and actions. Through the Audit Committee, the Board reviews and approves significant changes in the appropriate auditing and accounting principles and practices, and provides oversight of internal and external audit processes, financial reporting and internal controls
The Board meets on a regularly scheduled basis to review significant developments affecting our company, to act on matters requiring approval by the Board and to otherwise fulfill its responsibilities. It also holds special meetings when an important matter requires action or review by the Board between regularly scheduled meetings. The Board met 16 times and acted by unanimous written consent five times during 2016. In addition, in 2016 each director participated in at least 75% of the meetings of the Board committee(s) of which he or she was a member.
The Board has separately designated standing Audit, Compensation and Governance Committees, each composed solely of directors who the Board has determined are independent. The following table provides Board and committee membership and meeting information for each of the Board’s standing committees:
Committee | ||||||||||||
Audit | Compensation | Governance | ||||||||||
Director | 2016 | 2017 | 2016 | 2017 | 2016 | 2017 | ||||||
Stephen E. Carley | Member | Member | Member | Member | ||||||||
David L. Copeland | Member* | Chair | ||||||||||
William F. Farley | Chair* | Chair* | Member | Member | ||||||||
Christopher M. Harte | Member | Member | Member | |||||||||
Scott C. Key | Member | Member | Chair | |||||||||
Judy C. Odom | Member | Member | Chair | Chair | ||||||||
Number of 2016 meetings | 11 | 5 | 3 | |||||||||
Number of 2016 written consents | 1 | 2 | 0 | |||||||||
* The Board has determined that such director is an audit committee financial expert.
In accordance with our Corporate Governance Principles the Governance Committee and Board considered the membership of the committees and the tenure of members’ service on them. In light of the many changes made to the committee composition (including the rotation of each committee chair) over the past three years, the Board made no changes to the composition of committees in 2016. In April 2017, the Board changed its committee composition as reflected in the table above when Mr. Copeland was determined to no longer qualify as independent; see Independence of Directors below.
A brief description of the principal functions of each of the Board’s three standing committees follows. The Board retains the right to exercise the powers of any committee to the extent consistent with applicable rules and regulations, and may do so from time to time. For additional information, please refer to the committee charters that are available on our website at www.hartehanks.com under the “Corporate Governance” subsection of our “Investors” section.
• | Audit Committee - The primary function of the Audit Committee is to assist the Board in fulfilling its oversight of (1) the integrity of our financial statements, including the financial reporting process and systems of internal controls regarding finance, accounting, and legal compliance, (2) the qualifications and independence of our independent auditors, (3) the performance of our internal audit function and independent auditors, and (4) our compliance with legal and regulatory requirements. |
• | Compensation Committee - The primary functions of the Compensation Committee are to (1) review and approve corporate goals and objectives relevant to CEO compensation, evaluate the CEO’s performance in light of those goals and objectives, and together with the other independent directors (as directed by the Board), determine and approve the CEO’s compensation level based on this evaluation, (2) review and recommend to the Board (as directed by the Board) non-CEO officer compensation, incentive-compensation plans and equity-based plans, and (3) review and discuss with management the company’s “Compensation Discussion and Analysis” and produce a committee report |
38
on executive compensation as required by the SEC to be included in our annual proxy statement or annual report on Form 10-K filed with the SEC.
• | Governance Committee - The primary functions of the Governance Committee are to (1) develop, recommend to the Board, implement and maintain our company’s corporate governance principles and policies, (2) identify, screen and recruit, consistent with criteria approved by the Board, qualified individuals to become Board members, (3) recommend that the Board select the director nominees for the next annual meeting of stockholders, (4) assist the Board in determining the appropriate size, function, operation and composition of the Board and its committees, and (5) oversee the evaluation of the Board and management. |
Director Nomination Process
The Governance Committee is responsible for managing the process for the nomination of new directors. The Governance Committee may identify potential candidates for first-time nomination as a director using a variety of sources—recommendations from current Board members, our management, stockholders or contacts in communities served by Harte Hanks, or by conducting a formal search using an outside search firm selected and engaged by the Governance Committee.
Following the identification of a potential director nominee, the Governance Committee commences an inquiry to obtain sufficient information on the background of a potential new director nominee. Included in this inquiry is an initial review of the candidate with respect to whether the individual would be considered independent under NYSE and SEC rules and whether the individual would meet any additional requirements imposed by law or regulation on the members of the Audit and Compensation Committees of the Board. The Governance Committee evaluates candidates for director nominees in the context of the current composition of the Board, taking into account all factors it considers appropriate, including the characteristics of independence, diversity, age, skills, background and experience, financial acumen, availability of service to Harte Hanks, tenure of incumbent directors on the Board and the Board’s anticipated needs. Candidates should also have the skills and fortitude to assess and challenge the way things are done and recommend alternative solutions to problems; the independence necessary to make an unbiased evaluation of management performance and effectively carry out responsibilities of oversight; an awareness of both the business and social environment in which today’s corporation operates; and a sense of urgency and spirit of cooperation that will enable them to interact with other Board members in directing the future and profitable growth of the company. The Governance Committee has determined that it is desirable for the Board to have a variety of differences in viewpoints, professional experiences, educational background, skills, race, gender, and age, and considers issues of diversity and background in determining the appropriate composition of the Board and identifying director nominees. However, the company does not have a formal policy concerning diversity considerations, nor any formal means of assessing the efficacy of its diversity consideration.
The Governance Committee will consider potential nominees recommended by our stockholders taking into account the same considerations as are taken into account for other potential nominees. Stockholders may recommend candidates by writing to the Governance Committee in care of our Secretary at Harte Hanks, Inc., 9601 McAllister Freeway, Suite 610, San Antonio, Texas 78216. Our by-laws provide additional procedures and requirements for stockholders wishing to nominate a director for election as part of the official business to be conducted at an annual stockholders meeting.
Assuming a satisfactory conclusion to the Governance Committee’s review and evaluation process, the Governance Committee presents the candidate’s name to the Board for nomination for election as a director and, if applicable, inclusion in our proxy statement.
Board Leadership Structure
Board leadership structures should vary for companies depending on their circumstances. Although as part of our Lead Director Policy (see below) we regularly evaluate whether to combine or separate the roles of CEO and Chairman, having separated these roles with the retirement of our previous Chairman, the Board determined that maintaining this structure remained the best one for the company. The Board believes that this leadership structure will allow our CEO the time and resources to focus on leading the company in our corporate strategy and through the changes to our business that are and will be required to address our declining financial performance. Our board and stockholders likewise benefit from the continuity provided by an independent Chairman who is very familiar with the company from his long service on our board. Mr. Harte, our Chairman, leads the Board and its activities, and is responsible for the effective operation of the Board and its responsiveness to stockholders.
39
The board still maintains a Lead Director Policy, which provides that:
• | the Board shall conduct an annual evaluation of whether to combine (or continue combining, as the case may be) the roles of Chairman of the Board and CEO, with a view to ensuring significant independent oversight of management; |
• | when the Chairman of the Board is also the CEO, the independent members of the Board shall elect one of the independent Directors to serve as Lead Director, such director to serve in such role for a one-year term; |
• | at each regular meeting of the Board, the independent directors shall meet in executive session; and |
• | the Lead Director shall have the following powers and duties (1) presiding over all meetings of the Board at which the Chairman of Board is not present, (2) presiding over executive sessions of independent and/or non-management directors, (3) calling meetings of the independent directors, and (4) serving as a liaison between the Chairman of the Board and the independent directors if so requested. |
We had no changes to our Board composition in 2016. The independent members of the Board meet in executive session outside the presence of our sole management director at every regular meeting of the Board, and as-needed at special meetings. We believe having a substantial majority of independent, experienced directors comprising our Board benefits the company and its stockholders by providing strong oversight and advice on the issues facing the company.
Our Board conducts an annual evaluation in order to determine whether it and its committees are functioning effectively. As part of this annual self-evaluation, the Board evaluates whether the current leadership structure continues to be optimal for Harte Hanks and its stockholders. In addition, in 2016 the Board utilized third-parties to conduct a director skills assessment and peer evaluation. Our corporate governance guidelines provide the flexibility for our Board to modify or continue our leadership structure in the future, as it deems appropriate, in light of the results of evaluations or business needs.
Executive Sessions
Our Corporate Governance Principles provide that the non-management members of the Board will hold regular executive sessions in connection with regular Board meetings to consider issues that they may determine from time to time without the presence of any member of management. If the Chairman of the Board is not a member of management, the Chairman will chair each such session and report any material issues to the full Board. If the Chairman is a member of management, the Lead Director serves as the chairman of the executive sessions. If the non-management directors include directors who are not “independent” under applicable NYSE and SEC rules, then the independent directors will hold an executive session at least once a year. The Chairman of the Board, if an independent director, will chair each such session and report any material issues to the full Board. If the Chairman is not an independent director, the Lead Director serves as the chairman of such sessions.
Risk Oversight
Our Board is responsible for overseeing the risk management process. The Board focuses on our general risk management strategy and the most significant risks we face, and ensures that appropriate risk mitigation strategies are implemented by management. The Board is also apprised of particular risk management matters in connection with its general oversight and approval of corporate matters.
In performing the risk management process, the Board reviews with management (1) our policies with respect to risk assessment and management of risks that may be material to us, (2) our system of disclosure controls and system of internal controls over financial reporting, and (3) our compliance with legal and regulatory requirements. The Board also reviews major legislative and regulatory developments that could materially impact our contingent liabilities and risks. Our other Board committees also consider and address risk as they perform their respective committee responsibilities. For example, our Compensation Committee evaluates the risks associated with our compensation plans and policies, and our Audit Committee monitors risks relating to our financial controls and reporting. All committees report to the full Board as appropriate, including when a matter rises to the level of a material or enterprise level risk. The leadership structure of our Board described above in the “Board Leadership Structure” section also ensures that management is properly overseen by independent directors.
Management is responsible for day-to-day risk management. Our finance, treasury, general counsel and internal audit functions serve as the primary monitoring and testing groups for company-wide policies and procedures, and manage the day-to-day oversight of the risk management strategy for our ongoing business. This oversight includes identifying, evaluating and addressing potential risks that may exist at the enterprise, strategic, financial and operational levels, as well as compliance and reporting.
40
We believe the division of risk management responsibilities described above is an effective approach for addressing the risks facing the company and that our Board leadership structure supports this approach.
Audit Committee Financial Experts and Financial Literacy
The Board has determined that William F. Farley, Christopher M. Harte and Scott C. Key, the current members of the Audit Committee, are each financially literate as interpreted by the Board in its business judgment based on applicable NYSE rules, and that Mr. Farley further qualifies as an audit committee financial expert, as such term is defined in applicable SEC rules.
Compensation Committee Interlocks and Insider Participation
None of the members of the Compensation Committee of our Board is or has been an officer or employee of the company. All members of the Compensation Committee participate in decisions related to compensation of our executive officers. No interlocking relationship exists between our Board and the board of directors or compensation committee of any other company.
Communications with Non-Management Directors and Other Board Communications
The Board provides a process to enhance the ability of stockholders and other interested parties to communicate directly with the non-management directors as a group, the entire Board, Board committees or individual directors, including the Chairman and chair of any Board committee.
Stockholders and other interested parties may communicate by writing to: Board of Directors - Stockholder Communication, Harte Hanks, Inc., 9601 McAllister Freeway, Mail Box 8, San Antonio, Texas 78216. Our independent directors have instructed the Chair of the Governance Committee to collect and distribute all such communications to the intended recipient(s), assuming she reasonably determines in good faith that such communications do not relate to an improper or irrelevant topic.
Concerns about accounting or auditing matters may be forwarded on a confidential or anonymous basis to the Audit Committee by writing to: Audit Committee, Harte Hanks, Inc., 9601 McAllister Freeway, Mail Box 8, San Antonio, Texas 78216, in an envelope labeled “To be opened by the Audit Committee only. Submitted pursuant to Audit Committee’s whistleblower policy.” These complaints will be reviewed and addressed under the direction of the Audit Committee.
Items unrelated to the duties and responsibilities of the Board, such as mass mailings, business solicitations, advertisements and other commercial communications, surveys and questionnaires, and resumes or other job inquiries, will not be forwarded.
Director Attendance at Annual Meetings
Although we do not have a formal policy regarding director attendance at the annual meeting of stockholders, all directors are encouraged to attend. All directors other than Ms. Odom attended the 2016 annual meeting of stockholders.
Policies on Business Conduct and Ethics
We have established a corporate compliance program as part of our commitment to responsible business practices in all of the communities in which we operate. The Board has adopted a Business Conduct Policy that applies to all of our directors, officers and employees, which promotes the fair, ethical, honest and lawful conduct in our business relationships with employees, customers, suppliers, competitors, government representatives, and all other business associates. In addition, we have adopted a Code of Ethics applicable to our CEO and all of our senior financial officers. The Business Conduct Policy and Code of Ethics form the foundation of a compliance program that includes policies and procedures covering a variety of specific areas of professional conduct, including compliance with laws, conflicts of interest, confidentiality, public corporate disclosures, insider trading, trade practices, protection and proper use of company assets, intellectual property, financial accounting, employment practices, health, safety and environment, and political contributions and payments. The Business Conduct Policy forbids employees and directors from engaging in hedging activities with respect to our securities.
Both our Business Conduct Policy and our Code of Ethics are available on our website at www.hartehanks.com, under the “Corporate Governance” subsection of our “Investors” section. In accordance with NYSE and SEC rules, we intend to disclose any future amendments to our Code of Ethics, or waivers from our Code of Ethics for our CEO, Chief Financial Officer (“CFO”) and Controller, by posting such information on our website (www.hartehanks.com) within the time period required by applicable SEC and NYSE rules.
41
Indemnification of Officers and Directors
Our certificate of incorporation and bylaws require us to indemnify our officers and directors to the fullest extent permitted by the Delaware General Corporation Law. These documents also contain provisions that provide for the indemnification of our directors for third party actions and actions by or in the right of Harte Hanks that mirror Section 145 of the Delaware General Corporation Law.
Our certificate of incorporation also states that Harte Hanks has the power to purchase and maintain insurance, at its expense, to protect itself and any such director, officer, employee or agent of Harte Hanks or another corporation, partnership, joint venture, trust or other enterprise against such expense, liability or loss, whether or not we would have the power to indemnify such person against such expense, liability or loss under the Delaware General Corporation Law. We also have and intend to maintain director and officer liability insurance, if available on reasonable terms.
Insofar as indemnification for liabilities arising under the Securities Act of 1933, as amended (the “Securities Act”), may be permitted to directors, officers or persons controlling us under the foregoing provisions, we have been informed that in the opinion of the SEC such indemnification is against public policy as expressed in the Securities Act and is therefore unenforceable.
Management Certifications
In accordance with the Sarbanes-Oxley Act of 2002 and SEC rules thereunder, our CEO and CFO have signed certifications under Sarbanes-Oxley Section 302, which are filed as exhibits to this Form 10-K. In addition, our CEO most recently submitted an annual certification to the NYSE under Section 303A.12(a) of the NYSE listing standards on June 13, 2016.
ITEM 11. EXECUTIVE COMPENSATION
Compensation Discussion and Analysis
This Compensation Discussion and Analysis (“CD&A”) provides a discussion of the compensation philosophy and objectives that underlie our executive compensation program and how we evaluated and set our executives’ compensation for 2016. This CD&A provides qualitative information concerning how 2016 compensation was awarded to and earned by our executives, identifies the most significant factors relevant to our 2016 executive compensation decisions and gives context to the data presented in the tables included below in this Form 10-K. “Committee” within this CD&A means the Compensation Committee of the Board. Our “executive officers” are our senior executives who are listed above under the heading “Directors and Executive Officers.” Our “named executive officers” listed in the Summary Compensation Table and other compensation tables that follow are listed below, and are drawn from executive officers who served in 2016:
• | Karen Puckett - President and Chief Executive Officer; |
• | Shirish R. Lal - Executive Vice President, COO & CTO; |
• | Doug Shepard - Executive Vice President and CFO (resigned December 31, 2016); |
• | Robert Munden - Executive Vice President, General Counsel & Secretary, and CFO from January 1, 2017; and |
• | Andrew Harrison - Executive Vice President, Contact Centers & Chief Human Resources Officer. |
Executive Summary
We seek to design and implement executive compensation programs that align our executives’ interests and motivations with those of our stockholders, while avoiding the encouragement of inappropriate risk-taking. In 2016, our total direct compensation program for our named executive officers consisted of base salary, annual cash incentives (based on pre-established financial goals), long-term equity incentives (stock options, time-vesting restricted stock and performance units) and limited perquisites.
As further detailed below, 2016 brought important changes for Harte Hanks as we secured new leadership for some key roles to deploy an evolving strategy and focus in the face of declining financial performance. Our most significant changes were:
• | New Operations and Technology Leadership: Shirish R. Lal joined the company as its Chief Operating and Chief Technology officer, replacing incumbents in those positions to drive growth and reorganization to align our operations with client needs and market expectations, and improve quality of execution. |
• | Trillium Software Sale: We sold our Trillium Software business in December, having terminated (without replacement) its CEO in April. |
42
• | CFO Transition: Mr. Shepard resigned from the company effective December 31, 2016, and Mr. Munden assumed the duties of CFO. |
• | Smaller Leadership Team: Through reorganized and consolidated roles, and in response to divestitures and other changes in our business, by the end of 2016 we reduced our senior leadership team by approximately half. |
• | Equity Program: In light of poor share performance and limitations to the shares available for issuance under the company’s equity incentive plan, the company reduced the value of grants to mitigate dilution and used new cash-settled awards of phantom stock. |
The company began 2016 with the objective of creating modest revenue growth while maintaining reasonable profitability as it sought to adapt its operational structure to a strategy that was refined and refocused by its new leadership team. Despite making progress on improving client satisfaction and operational performance, financial performance suffered as continued client turnover and volume declines presented significant obstacles to stability and growth. The company sold its Trillium Software business (which allowed the company’s debt facility to be repaid), but most meaningful indicators of corporate performance from continuing operations declined, including revenue (down 9%). Reflecting the impact of declining revenue and the loss on the sale of Trillium Software, operating loss from continuing operations (a loss of $55.8 million) and loss per share (a loss of $1.46) likewise suffered. As a result of performance and the requirements of our credit facility, we also discontinued stockholder dividends after payment of our first quarter dividend. Our stock price declined accordingly, decreasing 54%, and with the effect of dividends paid, total stockholder return was (52)% for the year.
Based on the economic environment, the company’s recent performance, anticipated changes to the company and its leadership, and the Committee’s compensation philosophy and objectives, the Committee took the following annual compensation actions for the named executive officers for 2016:
• | Established target compensation for new officers which was largely consistent with market benchmarks. |
• | Established goals for our short term annual incentive plan (the “2016 AIP”) with a view to motivating our executives toward objectives fundamental to improving stockholder value. |
• | Due to company performance, made no payments under the 2016 AIP. |
• | Granted long-term equity awards with a lower value (compared to prior years), comprised of restricted stock awards, performance units and phantom stock to align participants with the company’s achievement of long-term stockholder value creation. |
• | Due to the decline in the company’s share price and the limited number of shares available for issuance under our 2013 Omnibus Incentive Plan (the “2013 Plan”), we added cash-settling awards, which also had the effect of decreasing the dilution of awards granted. |
• | Eliminated executive car allowances (offset by corresponding salary increases). |
• | Held base salaries constant (other than the car allowance adjustment) in light of poor performance. |
• | Adopted an optional benefit allowing senior executive officers to be reimbursed for an annual comprehensive health examination. |
The Committee engaged Meridian Compensation Partners, LLC (“Meridian”) as its independent compensation advisor to assist with benchmarking of executive officer compensation on an as-needed basis during the year (including development of a new peer group), but Meridian was not engaged to perform a comprehensive survey or analysis; for incumbent officers, the Committee relied on Meridian’s report from prior years. Meridian has been engaged by the Committee to perform a comprehensive analysis of the company’s executive compensation program for 2017.
The remainder of this CD&A provides further detail on the compensation philosophy, process, and decisions for 2016. Certain information regarding our other periods’ compensation determinations and policies is also included to the extent we believe it provides helpful context for our discussion of 2016 executive compensation.
Executive Compensation Philosophy and Objectives
Our executive compensation program is designed to achieve a number of key objectives and thereby support our overall efforts to create long-term value for our stockholders:
• | Attract and Retain Top Talent - Attract and retain high-performing individuals who will significantly contribute to our long-term success and the creation of long-term stockholder value by providing competitive compensation compared to peer companies, competitors or companies in the same market for executive talent. |
43
• | Pay for Performance - Motivate our executives to work in the best interests of our stockholders by closely tying compensation to company and individual performance on both a short-term and long-term basis. |
• | Place Significant Portion of Pay At Risk - Align executive compensation with stockholder interests by placing a significant portion of total direct compensation at risk, such that the executive will not realize value unless company performance goals are achieved (for example, annual bonuses and performance units with vesting dependent upon company performance) or our stock price appreciates (for example, stock options or phantom stock). |
• | Require Significant Ongoing Executive Stock Ownership - Align executive and stockholder interests by including a significant equity component in our total compensation awards and by requiring executives to accumulate and maintain a sizable equity position through our stock ownership guidelines. |
As an integral part of our compensation philosophy and objectives, we seek to design an executive compensation program that does not encourage inappropriate risks that would threaten the long-term value of our company.We believe our compensation philosophy has assisted in achieving our goals. The Committee reviews our compensation philosophy on a periodic basis to judge whether the goals and objectives are being met, and what, if any, changes may be needed to the philosophy. The Committee considered our compensation philosophy and objectives in establishing the elements and amounts of 2016 compensation for each of our named executive officers. Although a variety of modifications and alternatives were considered, our 2016 compensation philosophy was consistent for all of our executive officer positions, and was consistent with the philosophy for our 2015 compensation program.
Elements of 2016 Executive Compensation Program
The following table highlights the elements of our 2016 executive compensation program and the primary purpose of each element, which were consistent with our 2015 executive compensation program elements. The elements are also generally consistent for all of our executive officer positions. Each element is discussed in further detail below.
Element | Objectives and Basis | Form | ||
Base Salary | Provide base compensation that is competitive for each role to reward and motivate individual performance | Cash | ||
Annual Incentive Plan | Annual incentive or “bonus” to drive company performance consistent with immediate or short-term objectives | Cash | ||
Bonus Restricted Stock Elections | Encourage greater stock ownership by executive officers by allowing each to elect to receive up to 30% of their bonus in the form of restricted stock vesting on the first anniversary of the grant, with executive officers receiving 125% of the value of the forgone cash bonus in shares of restricted stock | Restricted stock | ||
Long-Term Incentive Awards | Long-term incentive to drive company performance and align executives’ interests with stockholders’ interests, and to retain executives through long-term vesting and potential wealth accumulation | Restricted stock, performance awards, and cash-settled phantom stock | ||
Perquisites | Enhance the competitiveness of our executive compensation program through limited additional benefits | Health examination and death benefits | ||
Severance Agreements | Attract and retain key talent by providing certain compensation in the event of a change in control | Cash severance, equity vesting and COBRA reimbursement | ||
Qualified Deferred Compensation | Provide tax-deferred means to save for retirement | Same benefit made generally available to our employees to participate in our 401(k) plan with a company match | ||
Non-Qualified Deferred Compensation | Provide tax-deferred means to save for retirement | Participation in our non-qualified deferred compensation program | ||
Other | Offer other competitive benefits, such as medical, dental, and other health and welfare benefits | Same benefit made generally available to our employees | ||
Compensation Committee
The Committee currently consists of Messrs. Key (Chair), Carley and Harte and Ms. Odom. The Board has determined that each member of the Committee meets the independence requirements of the rules of the NYSE. Each person serving on the Committee qualified as an “outside director” in accordance with Section 162(m) of the Internal Revenue Code (the “Code”), and a “non-employee director” as defined in Rule 16b-3 under the Exchange Act with regard to compensation and benefit plans subject to SEC Rule 16b-3. Each member of the Committee either currently serves, or has served, as a director or senior
44
executive of a large corporation, and has had significant experience with compensation matters relating to senior executives of these organizations.
The Committee’s purpose is to assist the Board in fulfilling its oversight responsibilities for compensation of executive officers and administration of the company’s equity incentive plans, with the goals of (1) supporting the company's business objectives, (2) attracting, motivating and retaining high quality leadership, and (3) linking compensation with business objectives and performance. In accordance with its charter and NYSE rules, the Committee’s responsibilities include the following:
• | reviewing and approving corporate goals and objectives relevant to CEO compensation, evaluating the CEO’s performance in light of those goals and objectives, and together with the other independent directors (as directed by the Board), determining and approving the CEO’s compensation level based on this evaluation; |
• | making recommendations to the Board with respect to non-CEO officer compensation, and incentive-compensation and equity-based plans that are subject to board approval; |
• | assisting the Board by (i) evaluating potential candidates for officer positions, (ii) recommending terms for the hiring, promotion and severance of officers, and (iii) overseeing the development of officer succession plans; |
• | participating with management in reviewing the annual goals and objectives with respect to compensation for the company’s officers and, to the extent the Committee deems necessary or appropriate, other key employees of the company or its subsidiaries (collectively, “Principal Executives”); |
• | periodically (but no less frequently than annually) evaluating the performance of the Principal Executives in light of established goals and objectives and, based upon this evaluation and any compensation recommendations for the Principal Executives made by the CEO, approving or (in the case of officers, and as directed by the Board) making recommendations to the Board with respect to the compensation for the Principal Executives; and |
• | periodically (but no less frequently than annually) evaluating the competitiveness of the company’s executive compensation program in reference to its peers and broader trends, including consideration of base salaries, annual incentives, long-term incentives and equity-based compensation, considering (among other things) the company’s performance and relative stockholder return, the value of similar incentive awards to similarly situated executives at comparable companies, and the awards given to such person in prior years. |
The Committee may appoint subcommittees for any purpose that it deems appropriate and may delegate to subcommittees such power and authority as it deems appropriate. However, no subcommittee may consist of fewer than two members, and no subcommittee may be delegated any power or authority required by any law, regulation or listing standard to be exercised by the Committee as a whole. No subcommittees were formed or met in 2016. The Committee has delegated to our CEO a limited authority to grant stock options and restricted stock to non-officers, and monitors grant activity through regular reports. The Committee also delegated to the CEO the limited authority to allocate non-officer annual equity awards amongst employees. You may view the Committee’s full charter in the “Investors” section of our website at www.hartehanks.com under the “Corporate Governance.”
The Committee meets in executive session at most of its meetings (as it deems appropriate) to review and consider executive compensation matters without the presence of our executive officers. These executive sessions may also include other non-employee directors and outside experts retained by the Committee. The Committee met in executive session with other non-employee directors at four of its five 2016 meetings.
Other Participants in the Executive Compensation Process
In addition to the Committee and other non-Committee members of the Board who also may be in attendance at the Committee’s meetings, our management and, when engaged by the Committee from time to time, outside compensation consultants also participate in and contribute to our executive compensation process. Ultimately, the Committee exercises its independent business judgment with respect to recommendations and opinions of these other participants and the Committee (or our independent directors as a group) makes final determinations about our executive officer compensation.
Management and Chairman of the Board
Mr. Harte, our Chairman, participated in the Committee’s executive compensation processes throughout 2016 and assisted the Committee and regularly attended Committee meetings. Mr. Harte provided his perspective to the Committee regarding executive compensation matters generally and the performance of the company and its executive officers based on his long experience with the company.
45
Ms. Puckett, our CEO, likewise participated in the Committee’s executive compensation processes and attended all Committee meetings; however, she did not attend sessions when elements of her compensation were being considered. The company’s Chief Human Resources Officer (Mr. Harrison) attended most meetings (as appropriate), and the General Counsel (Mr. Munden) also attended each meeting. Our former CFO (Mr. Shepard) attended selected meetings. Officers were excluded from executive sessions.
Working with Messrs. Harrison and Munden, Ms. Puckett presented recommendations to the Committee on the full range of annual executive compensation decisions made in March (other than with respect to herself), including (1) the company’s 2016 Annual Incentive Plan (the “2016 AIP”) structure and participants, (2) long-term incentive compensation strategy, (3) competitive positioning of our executive compensation program, and (4) total direct compensation for each executive officer, including base salary adjustments, 2016 AIP targets, equity grants and perquisites. The Committee made final decisions about each officer’s 2016 compensation without the applicable executive officer being present, taking into account Ms. Puckett’s recommendations and views.
Compensation Consultants
The Committee believes that engaging a consultant for comprehensive reviews on a periodic basis is more appropriate than having regular annual engagements. The Committee engaged Meridian to assist the Committee with its evaluations and determinations for our 2014 executive compensation program. In this review, Meridian performed a comprehensive evaluation of our compensation philosophy, policies and practices for executive officers and other executive positions, and reviewed a new annual incentive plan design to be applied company-wide (including officers). Having considered Meridian’s report and recommendations, the Committee implemented a variety of changes in 2014. The Committee did not think it was necessary to engage Meridian to conduct another full-scale assessment for 2016, and used Meridian’s 2014 review as the baseline for 2016 Compensation determinations for incumbent positions.
Nevertheless, the Committee did refer ad-hoc queries and issues to Meridian as they arose from time-to-time. For example, Meridian was engaged to help establish benchmark compensation for our executive hired in 2016—Mr. Lal—as well as queries on long term incentive plan considerations and award design. As previously mentioned, the Committee did engage Meridian to assist in the development of a new peer group, and to perform a comprehensive executive compensation analysis for its 2017 compensation determinations.
For the foregoing engagements, Meridian has been selected and retained by—and reported directly to—the Committee. Meridian has not been separately engaged by our management, but has provided to management corresponding evaluations of selected non-executive officer positions and compensation policy and practice matters. Harte Hanks has no relationship with Meridian (other than the relationship undertaken by the Committee), and the Committee re-evaluated and confirmed Meridian’s independence in accordance with its charter and NYSE requirements prior to engaging Meridian.
Principal Factors That Influenced 2016 Executive Compensation
When making its 2016 annual compensation decisions, the Committee considered the compensation philosophy and principles that underlie our executive compensation program, including the desire to link executive compensation to annual and long-term performance goals and to be able to attract and retain high performing individuals who will significantly contribute to our long-term success and the creation of long-term stockholder value. The Committee did not use formulas to rigidly set the compensation of our executives based solely on market data or on any one factor in isolation, or assign a specific weighting or ranking to the various factors it considered. Rather, the Committee’s ultimate decisions were influenced by a number of factors that were collectively taken into consideration in the Committee’s business judgment and that included a number of subjective determinations in addition to the specific formula-based performance criteria established in our annual incentive plan and long-term incentive performance awards. In establishing the individual elements and amounts of 2016 executive compensation, the principal factors taken into consideration by the Committee included the following:
• | anticipated reorganization and consolidation of leadership roles, potentially resulting in fewer leaders each with greater and/or broader responsibility; |
• | possible divestitures and other changes in our business; |
• | competitive market data to assess how our executive pay compared to other companies, considering the individual elements of our compensation program, the relative mix of those compensation elements and total direct compensation amounts, with then-current market data provided by Meridian; |
• | input from non-Committee members of the Board (including our CEO) with regard to base salary proposals, long-term incentive awards, individual executive officer performance and related matters; |
46
• | recent company performance compared to (i) our financial and operational expectations for our company as a whole, (ii) for our (former) Trillium and Customer Interactions segments individually and (iii) our peers and other market indicators; |
• | the need to attract and retain a pool of highly-qualified leadership candidates for positions necessitated by our evolving strategy and corresponding organizational changes; |
• | ongoing and anticipated efforts to transform our business operations in line with our strategy, that were expected to result in continued significant additional work commitments by our executive officers; |
• | a general assessment of individual executive officer performance and contributions in support of our strategies, individual officer responsibilities, tenure and experience in his or her position and the overall financial performance of the businesses or functional areas for which an officer is responsible; |
• | providing competitive compensation to reflect new or expanded roles for some of our executives; |
• | retention considerations in light of a recent history of relatively low bonus payouts to executive officers based on recent company performance and diminished equity compensation values because of declining stock price and earnings per share performance; |
• | individual officer compensation history, including the cumulative effect of equity awards granted in prior years and value realized from prior equity awards; |
• | internal pay equity (i.e., considering pay for similar jobs and jobs at different levels within the company and considering the relative importance of a particular position to us); and |
• | tax and regulatory considerations, including our policy to take reasonable and practical steps to maximize the tax deductibility of compensation payments to executives under §162(m) of the Code, the impact of expensing equity grants under ASC 718, and the impact of §409A relating to non-qualified deferred compensation. |
The Committee also had to review compensation matters outside the usual annual compensation review and setting process. In connection with Mr. Shepard’s resignation, the Committee considered the immediate need to retain certain officers to provide stability. Compensation determinations for Mr. Lal (who was hired prior to our usual annual determinations) were also affected by the numerous events cited above in our Executive Summary and:
• | perceived advantages, disadvantages, strengths and weaknesses of other candidates considered; |
• | the scope and importance of the role to the company’s success; |
• | the compensation received by his immediate predecessors in the company; |
• | timing considerations (such as when he would be available to start); and |
• | the compensation he received in his recent employment. |
Tally Sheets
To assist the Committee in making its 2016 annual executive compensation determinations, the Committee reviewed tally sheets for each executive officer, as it has done in prior years. Tally sheets are used as a reference to ensure that Committee members understand the total compensation provided to executives each year, over a multi-year period and in various change in control or other termination events. The Committee uses tally sheets to consider individual elements of our compensation program, the relative mix of those compensation elements and total annual and long-term compensation amounts provided to a particular executive. The tally sheets illustrate, for each executive officer:
• | cash compensation (base pay, bonus and (until discontinued) automobile allowance) for the current year under consideration and each of the past two years; |
• | values of long-term equity compensation awards granted (options, restricted stock, phantom stock and performance awards) for the current year under consideration and each of the past two years; |
• | salary continuation benefits (similar in effect to life insurance benefits); |
• | estimated pension benefits upon retirement; |
• | the value, and changes in value, of previous equity compensation awards; |
• | stock ownership guideline compliance; and |
• | estimated amounts the executive could realize upon a change in control or termination of employment. |
47
For comparison purposes, the tally sheets also incorporate applicable competitive market compensation data for base salary, annual incentive awards and long-term incentive awards.
Setting the Pay Mix-Cash Versus Equity; Fixed Versus Variable
We believe a mixture of both long-term and short-term compensation elements provides the proper balance and incentives. The Committee reviews each of these elements separately and then all of the elements combined to determine the amount and mix of compensation for our executives. As has been our practice, in 2016 all short-term incentives were payable in cash. Most of the 2016 long-term incentives were in the form of equity, but unlike prior years, some of these awards were linked to equity value but payable only in cash to reduce dilution. The following chart and table show the split of 2016 target compensation for our named executive officers between equity (including equity-linked) and cash:
2016 Target Cash v. Target Equity Compensation for Named Executive Officers
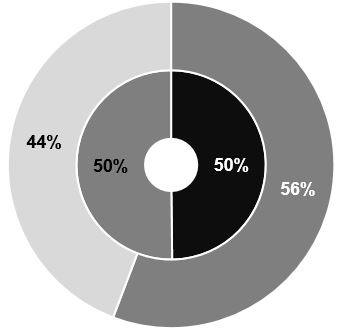 | By Individual | ||||||
Named Executive Officer | Cash | Equity | |||||
Karen Puckett | 1,491,800 | 1,502,509 | |||||
Shirish Lal | 720,475 | 488,758 | |||||
Doug Shepard | 784,890 | 523,685 | |||||
Robert Munden | 475,050 | 298,028 | |||||
Andrew Harrison | 452,551 | 298,028 | |||||
CEO | Equity | ||||||
CEO | Cash | ||||||
All NEOs | Equity | ||||||
All NEOs | Cash | ||||||
1) Target Cash is the sum of base salary at December 31, 2016 plus column (d) (target annual incentive) from the Grants of Plan Based Awards table below. No annual incentive award payments were made in respect of 2016. | |||||||
2) Target Equity is the sum of the amounts in column (l) (grant date fair value of stock and option awards) from the Grants of Plan Based Awards table below. | |||||||
The Committee believes that a substantial portion of the potential cash compensation should be subject to meeting financial performance criteria, and thus “at risk” or variable. In 2016, 43% of the potential cash compensation (assuming target annual incentive payout) for the named executive officers was “at risk” as the Committee adopted an approach that increased potential maximum payout while making minimum achievement more difficult relative to prior years. Over 57% of potential cash compensation was “at risk” assuming maximum annual incentive payout.
The Committee also reviewed the compensation risks associated with the pay mix of its executive officers, and in that context, considers risk as well as motivation when establishing performance criteria and compensation structures. For 2016, the Committee reviewed the company’s incentive compensation plans to determine whether the company’s compensation policies and practices foster risk taking above the level of risk associated with the company’s business model. In the course of its examination, the Committee evaluated, among other things:
• | whether any of our businesses, operations or functions has much more inherent risk, a significantly different compensation structure, or different profitability basis or results; |
• | whether the compensation mix is appropriately balanced between annual and long-term incentive awards; |
• | the relationship between annual and long-term performance measures and payouts, and whether measures are aligned (or complementary) to ensure that they encourage consistent behaviors and sustainable results without conflict; |
• | whether long-term performance measures and equity vehicles encourage excessively risky behavior; |
• | whether targets require performance at such a high level that executives would take improper risks to achieve them; |
• | the overlap of performance criteria and vesting periods to reduce incentives to maximize performance in any one period; |
• | whether the mix of equity incentives serve the best interests of stockholders by rewarding the right measures; |
48
• | the effect of dilution on stockholders and the company’s equity burn rate; and |
• | the report of Meridian regarding the risks of our compensation program. |
On the basis of this review, the Committee determined that the company’s incentive compensation plans are appropriately structured to not encourage executive officers to take unnecessary or excessive risks and do not create risks that are reasonably likely to have a material adverse effect on the company.
2016 Target Cash Compensation for Named Executive Officers: Fixed vs. Variable or "At Risk"
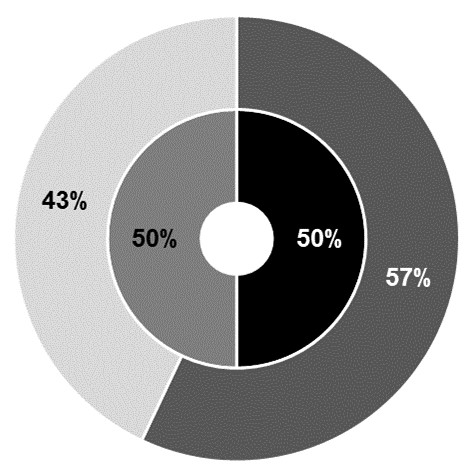 | By Individual | ||||||||
Named Executive Officer | Fixed | Variable | |||||||
Karen Puckett | $ | 745,900 | $ | 730,000 | |||||
Shirish Lal | 411,700 | 308,775 | |||||||
Doug Shepard | 461,700 | 323,190 | |||||||
Robert Munden | 316,700 | 158,350 | |||||||
Andrew Harrison | 301,700 | 150,850 | |||||||
CEO | Fixed | ||||||||
CEO | Variable | ||||||||
All NEOs | Fixed | ||||||||
All NEOs | Variable | ||||||||
(1) Fixed is base salary at December 31, 2016, plus amounts from column (l) in the Grants of Plan Based Awards Table for time-vesting equity awards; excludes retention and signing bonuses | |||||||||
(2) Target Variable is 2016 target annual incentive compensation for the named executive officers from column (d) in the Grants of Plan Based Awards Table, plus amounts from column (l) in the Grants of Plan Based Awards Table for performance awards; excludes retention and signing bonuses. | |||||||||
Market Benchmarking
As mentioned above, the Committee typically refers to executive compensation surveys and other benchmark data when it reviews and approves executive compensation. This market data is intended to reflect compensation levels and practices for executives holding comparable positions at comparable companies, which helps the Committee set compensation at levels designed to attract and retain high performing individuals. Market data typically consists of (1) publicly available data from a selected group of peer companies, and (2) more broad-based, aggregated survey data of a large number of companies of similar size or in similar industries.
In selecting the peer companies, the Committee considers a variety of criteria, including industry, revenues, market capitalization and assets. The Committee also believes that it is important to include a sufficient number of peer group companies to enhance the overall comparability of the peer company data for purposes of setting our executives’ compensation. Working with Meridian, the Committee conducted a comprehensive peer group review in 2014. The Committee selected from U.S.-listed companies based on those which have products or services which are competitive (or complementary) to our current and anticipated products and services, and represent a range of sizes (in terms of revenues, profits and employees) and history. Our 2016 peer group consisted of the following companies, with five former peers no longer being considered because they were no longer U.S.-listed.
2016 Compensation Peer Group
Acxiom Corporation | The Dun & Bradstreet Corporation | MDC Partners, Inc. |
Cenveo, Inc. | Forrester Research, Inc. | Meredith Corporation |
Convergys Corporation | Gartner, Inc. | Sykes Enterprises, Incorporated |
Teletech Holdings, Inc. | ||
After conducting a review with Meridian, the Committee has adopted a new peer group for 2017, reflecting recent and anticipated changes to our business and operational focus.
49
Acxiom Corporation | Hubspot, Inc. | NCI, Inc. |
Advisory Board Co. | Information Services Group | Neustar, Inc. |
CIBER, Inc. | Marin Software, Inc. | Rocket Fuel, Inc. |
Forrester Research, Inc. | MDC Partners, Inc. | Sykes Enterprises, Incorporated |
Hackett Group, Inc. | National Cinemedia, Inc. | Teletech Holdings, Inc. |
This new peer group will be supplemented, depending on the comparative purpose, with Dun and Bradstreet, Meredith Corp. and ICF International, Inc.
The Committee compares each executive’s total direct compensation (comprised of salary, total potential bonus opportunity and estimated long-term incentive compensation value), both separately and in the aggregate, to amounts paid for similar positions based on the benchmark data. In looking at overall compensation for our executive officers, in general, and in response to the Meridian reports and current market practices, the Committee considers its philosophy of targeting each element of compensation (as well as target total direct compensation) to fall at approximately the 50th percentile of market compensation over time, but tolerating individual variations due to factors such as individual performance, company performance, tenure,
promotion, market factors and internal pay equity.
As discussed above, however, benchmark data is merely a starting point; the Committee does not rigidly apply formulas to set the compensation of our executives based solely on market data or on any one factor in isolation. Rather, the Committee’s ultimate determinations are influenced by a number of factors that are collectively taken into consideration in the Committee’s business judgment, as further described above under “Principal Factors That Influenced 2016 Executive Compensation.” Accordingly, the Committee retains discretion to set compensation levels using a combination of elements that it believes are appropriate, and the Committee is not required to set compensation levels at specific benchmark data percentiles.
Based on the total target direct annual compensation approved in the Committee’s March 2016 meeting for our incumbent named executive officers compared to the peer and market data reviewed by the Committee, Ms. Puckett and Mr. Shepard were above the 50th percentile, while Messrs. Harrison and Munden were below the 50th percentile. Mr. Lal’s initial compensation package (assessed by the Committee when he was hired) was targeted to be at approximately the 50th percentile.
Additional Analysis of Executive Compensation Elements
The following discussion provides additional information and analysis regarding the specific elements of our 2016 executive compensation program. This discussion should be read in conjunction with the remainder of this CD&A (including the section above, “Principal Factors That Influenced 2016 Executive Compensation”) and the compensation tables that follow.
Base Salary
We set executive base salaries at levels we believe are appropriate based on each individual executive’s roles, responsibilities and experience in his or her position. We believe that a competitive base salary, providing a fixed level of income over a certain period, is a necessary and important element to include in the compensation packages for our executives. We review base salaries for executive officers on an annual basis, and at the time of hire, promotion or other change in responsibilities. When hiring a new executive, the Committee conducts a benchmark analysis to assess market rates for compensation. Base salary changes also impact target bonus amounts and potential cash severance amounts, which are based on a percentage of base salary.
When reviewing each executive’s base salary in March 2016, the Committee considered, in addition to the other factors:
• | the level of responsibility and complexity of the executive’s job; |
• | the relative importance of the executive’s role and responsibilities in Harte Hanks; |
• | whether, in the Committee’s business judgment and taking into account input from our CEO and other Board members, prior individual performance was particularly strong or weak; |
• | how the executive’s salary compares to the salaries of other company executives; |
• | how the executive’s salary compares to market salary information for the same or similar positions (making due consideration for how closely the benchmarked position matched the specific role of our executive); |
• | the combined potential total direct compensation value of an executive’s salary, annual bonus opportunity and long-term incentive awards; |
• | the economic environment; and |
50
• | recent company performance compared to (i) our financial and operational expectations for our company as a whole, (ii) performance of the functions or operations for which the executive is responsible and (iii) our peers and other market indicators. |
Based upon these factors, especially financial performance, the Committee determined that no salary increases were warranted for incumbent officers (other than an increase offsetting the elimination of the car allowance, as described below). For Mr. Lal (hired just before the annual compensation determinations), base salary was negotiated based on market benchmarks, timing considerations, prior salary history and the salary of other executive officers. The only change made to executive officer salaries subsequent to the annual compensation determinations was in connection with Mr. Shepard’s resignation (effective December 31, 2016): the Committee increased Mr. Munden’s base salary to $376,600 effective January 1, 2017, for so long as he serves as the company’s CFO.
Annual Incentive Compensation
We provide an annual incentive opportunity for executive officers to drive company and, where appropriate, business line performance on a year-over-year basis. This annual short-term cash incentive opportunity provides an incentive for our executives to manage our businesses to achieve targeted financial results. Our 2016 AIP for executives was administered under the company’s 2013 Omnibus Incentive Plan (the “2013 Plan”), which was approved by our stockholders in May 2013. For the 2016 AIP, bonus opportunity amounts were expressed as a percentage of year-end base salary, as follows:
2016 AIP Opportunity (as % of Base Salary)
Named Executive Officer | Threshold | Target | Maximum | |||
Karen Puckett | 25.00% | 100% | 200% | |||
Shirish Lal | 18.75% | 75% | 150% | |||
Doug Shepard | 17.50% | 70% | 140% | |||
Robert Munden | 12.50% | 50% | 100% | |||
Andrew Harrison | 12.50% | 50% | 100% | |||
Actual annual incentive compensation awards for our executive officers are determined based on achievement against the Committee’s previously established financial performance goals, as certified by the Committee, typically at its regular January meeting. From time to time, individual non-financial goals may also be established for one or more executive officers to better align an executive’s incentives with goals such as organizational effectiveness, strategic focus and personal development. For the 2016 AIP, none of our named executive officers had individual non-financial performance goals tied to a specified incentive payout. The financial performance goals are based on the strategic financial and operating performance objectives for our company and those of our business segments. In setting the financial performance targets, the Committee considers target company performance under our annual operating plan, the potential payouts based on achievement at different levels and whether the portion of incremental earnings paid as bonuses rather than returned to stockholders or reinvested in our business is appropriate. The Committee reserves the right to adjust the financial performance targets during the year, but did not do so in 2016.
The 2016 AIP for executives continued the uniform approach to the annual incentive plan first adopted in 2014, with a goal of emphasizing the integration of the business and cross-functional/operational responsibilities; the Committee viewed this as necessary to achieve the objectives of our strategic plan by providing a direct incentive to achieve optimal company-wide results. Additionally, the 2016 AIP had limitations that required that any payments made be affordable to the stockholders, i.e., that the incremental profit generated by achievement was not negated by payments under the incentive plan.
The determination of any amount ultimately payable to each executive under the 2016 AIP was based on the following performance levels relative to our Board-approved target revenue performance ($500.5 million) and operating income performance ($26.5 million), weighted 80% on revenue performance and 20% on operating income. In establishing the performance criteria and the incremental target performance levels for each performance criteria, the Committee anticipated that the executives would be likely to receive at least the threshold portion of their year-end cash bonuses, with higher levels of payout being progressively more difficult and less likely to occur. Achieving the maximum bonus award was anticipated, at the time of establishing the award, to be very difficult to achieve based on our company’s annual plan performance assumptions and outlook for the company.
51
Bonus Performance Levels
Revenue (80% weight) | Operating Income (20% weight) | |||||||
Performance (% of Target) | Payout Level (% of Target) | Performance (% of Target) | Payout Level (% of Target) | |||||
110 | 200 | 110 | 200 | Maximum | ||||
100 | 100 | 100 | 100 | Target | ||||
97 | 25 | 90 | 85 | Threshold | ||||
Based on the company’s actual revenue performance and operating income performance, the Committee determined that no payments were earned under the 2016 AIP, nor were any discretionary bonuses or stock awards made in respect of 2016 performance.
Bonus Restricted Stock Elections
As part of our executive compensation program, an executive officer may elect to receive up to 30% of his bonus in the form of restricted stock. An executive who so elects receives 125% of the value of the forgone cash portion of the bonus in shares of restricted stock. This program is considered by the Committee each year, and was approved again with respect to 2016 executive bonuses, which were potentially payable in early 2017. The Committee believes this program encourages the accumulation of executive stock ownership, and provides another avenue for our executive officers to reach compliance with our stock ownership guidelines. Because none of our named executive officers received an annual incentive plan payout for 2016, no grants were made under this program.
Long-Term Incentive Awards
We design our long-term incentive compensation program to drive company performance over a multi-year period, align the interests of executives with those of our stockholders and retain executives through long-term vesting and wealth accumulation. The Committee believes that a significant portion of executive compensation should be dependent on value created for our stockholders. The Committee reviews long-term incentive compensation strategy and vehicles as part of its annual executive compensation determinations. Under our 2013 Plan we may issue various equity securities to directors, officers, employees and consultants. The 2013 Plan forms the basis of our long-term incentive plan for executives.
Although the 2013 Plan provides for other vehicles, the primary long-term incentive vehicles used by the Committee historically have been:
• | stock options (time vesting), which in general align our executives’ interests with the interests of stockholders by having value only if our stock price increases over time; |
• | restricted stock (time vesting), which serves our retention goals by ensuring that the awards will have value if they vest because the ultimate value of restricted stock, unlike stock options, does not depend solely on our stock price increasing over time; and |
• | performance awards (performance vesting share-denominated awards), which require performance over a multi-year measurement period and thereby help align our executive compensation program with longer term company performance. |
The Committee has established standardized terms for stock options and restricted stock: stock options vest in four equal annual installments, and restricted stock (other than bonus restricted stock grants) vests in three equal installments. Stock options have an exercise price equal to the market value of our common stock on the date of grant, and have a term of ten years (assuming continued service). The Committee determined, in accordance with its discretion under the 2013 Plan, that equity awards granted before 2015 will vest in full upon a change of control (as defined in the 2013 Plan); however, in 2015 the Committee reconsidered this policy and no longer intends to grant awards which automatically accelerate upon a change in control. Stock option and restricted stock awards granted in or after 2014 also vest upon the death or permanent disability of the recipient.
Performance awards represent the right to receive one share of common stock or the cash equivalent (as provided in the award agreement) for each vested unit, with performance determined on a future date (currently set about three years after the grant date). The Committee chooses objective performance criteria intended to align executive’s interests with the company’s long-term interests. Based on the company’s performance for the three years ending 2016, none of the performance units issued in 2014 (with a 2016 operating income criterion set by the Committee) vested.
52
Our Board has adopted a policy of granting annual awards on a fixed date each year, April 15 (although this date has been delayed for 2017 due to the delay in the filing of our Annual Report on Form 10-K). We also grant interim awards from time to time in connection with mid-year hires, acquisitions, promotions or other reasons, based on a date selected by the Committee on or after the date of the Committee action at a meeting or by unanimous written consent. For employee hires, our practice has been to grant awards on the third business day of employment.
As a consequence of the company’s share price decline, for 2016 the Committee evaluated a variety of award types and combinations, trying to balance (i) the need for motivation that is best achieved with equity vehicles, (ii) stockholder dilution, (iii) share availability under the 2013 Plan, and (iv) decreasing cash liquidity. In March 2016, the Committee approved a combination of restricted stock, phantom stock (restricted stock units that settle in cash, vesting over four years), and two types of performance awards for our executive officers-one with a relative total shareholder return performance metric (settling in shares of common stock), the other with a target revenue performance metric (settling in cash). The Committee determined that with the company’s share price at historic lows, awards of stock options would be unduly dilutive if any meaningful values were granted. The Committee determined that a combination of awards-weighted toward awards with some performance aspect-would be the best way to align our executive compensation program with the needs of our company and our stockholders, and was in line with practices in the market. The award structure and size adopted by the Committee also addressed the norms for such grants identified in the Meridian report, as well as other market data for how companies facing historic low stock prices have structured awards.
When reviewing each executive’s proposed equity awards for 2016, the Committee considered the level of responsibility and complexity of the executive’s job, how the executive’s target equity award value compares to the target equity award values of other Harte Hanks executives and to market benchmarks for the same or similar positions developed by Meridian. Specific target grant size was a rounded grant date value calculated as a percentage of base salary, again based on benchmark data provided by Meridian. The Committee set two other parameters for 2016, (i) a dilution limit of one million shares (so that any target award value above that amount would be granted in the form of cash-settling award vehicles), and (ii) an allocation of 55% (or 60% in the case of the CEO) of target award value to performance-based awards. For purposes of sizing the awards, target grant values were divided by the share price on the award date ($2.69).
The only exception to the foregoing was Mr. Lal, who joined the company in March of 2016; his initial equity awards were in lieu of annual grants due because his hiring date was so close to our annual grant date. In connection with his hiring, and as a material inducement to his joining the company as its COO & CTO, Mr. Lal was granted stock option and restricted stock awards with values targeted based on benchmark data provided by Meridian. These awards were made as inducement grants outside the company’s 2013 Plan, but otherwise on similar terms. Based on grant-date stock prices and related values, Mr. Lal was granted 73,684 shares of restricted stock and options to purchase 120,371 shares of common stock, as further reflected in the Summary Compensation Table and Grants of Plan-Based Awards tables below. In accordance with the terms of his offer letter and to align performance goals, Mr. Lal’s performance units were issued under the 2013 Plan at the same time, and using the same metrics, as other executive officer performance awards. As a result of the Committee’s review, the following long term incentive grants were made on April 15, 2016:
Named Executive Officer | Restricted Stock (shares) (1) | Phantom Stock (units) (2) | Performance Awards (TSR) (units-maximum) (3) | Performance Awards (Revenue) (units-maximum) (4) | ||||||||
Karen Puckett | 185,000 | 112,397 | 185,000 | 261,096 | ||||||||
Shirish Lal | — | — | 48,000 | 41,219 | ||||||||
Doug Shepard | 75,000 | 42,100 | 75,000 | 68,122 | ||||||||
Robert Munden | 44,000 | 22,914 | 44,000 | 37,784 | ||||||||
Andrew Harrison | 44,000 | 22,914 | 44,000 | 37,784 | ||||||||
(1) | Restricted shares vesting in three equal annual installments. |
(2) | Restricted stock units vesting in four equal annual installments and settling in cash. |
(3) | Performance stock units vesting February 15, 2019 based on relative TSR measured against the S&P 600 Small Cap Index for the period ending December 31, 2018, and settling in stock. |
(4) | Performance stock units vesting February 15, 2019 based on the company’s reported 2018 revenue, and settling in cash. |
In 2016, performance awards represented over half of the target long-term incentive grant value and over one-third (by reportable expense) of long-term incentive grants made to executive officers. As mentioned above, the 2016 performance awards vest based on either the company’s relative TSR (measured against the S&P 600 Small Cap Index) or the company’s 2018 revenue, each at levels of 0%, 50%, 75% or 100% of the stated award amount. The Committee believes that using relative TSR would provide good alignment with stockholder interests, especially at a time when setting long-term performance objectives based on specific aspects of company financial performance could be difficult.
53
In establishing the performance levels, it was generally anticipated that at least some portion of the performance units will vest, with increasing degrees of difficulty in achieving the higher levels of vesting. Achieving the 75% vesting level was linked to expected performance (50th percentile for TSR, or $549.3 million for revenue), while maximum vesting level (75th percentile for TSR, or $573.5 million for revenue) would require the company to have significantly better performance.
Perquisites
Consistent with previous years, our 2016 executive compensation program included limited executive perquisites. The aggregate incremental cost of providing perquisites and other benefits to our named executive officers is included in the amount shown in the All Other Compensation column of the Summary Compensation table below and detailed in the subsequent All Other Compensation table. We believe the limited perquisites we provide to our executives are representative of comparable benefits offered by companies with whom we compete for executive talent, and therefore offering these benefits serves the objective of attracting and retaining top executive talent by enhancing the competitiveness of our compensation program.
In establishing the elements and amounts of each executive’s 2016 compensation, the Committee took into consideration, as one of the relevant factors, the value of these perquisites to our executives. Tally sheets are used as a reference to ensure that Committee members understand the total compensation provided to executives each year and over a multi-year period, including the amount of each executive’s salary continuation death benefit.
In March 2016, the Committee determined that the practice of paying an automobile allowance was no longer market appropriate, and so eliminated the automobile allowance but increased base salary for executives by the amount of the allowance. The Committee also added the health examination benefit. For 2016, our perquisites were:
• | Salary Continuation Benefits - We provide salary continuation benefits (which are similar in effect to life insurance benefits) to our executive officers. This benefit provides the estates of our executive officers ten annual payments (of $90,000 for our CEO and $70,000 for Executive Vice Presidents) in the event of their death while employed by the company. |
• | Annual Health Examination - reimbursement for an annual comprehensive health examination at the Cooper Clinic (or similar clinic) for our CEO, Executive Vice Presidents and Senior Vice Presidents (with a cost estimated to be $5,000). |
In addition, under Ms. Puckett’s employment agreement, we have agreed to reimburse:
• | up to 12 months of temporary housing expenses (not to exceed $3,000 per month) at a location proximate to one of the company’s significant business operations; |
• | at her election, either (i) the reasonable moving and closing costs for the purchase of her new primary residence and sale of her current primary residence or (ii) half of the amount of any loss she incurs on the sale of her current primary personal residence, not to exceed $250,000, but only if she establishes a primary personal residence within 30 miles of one of the company’s primary business locations (or any other location mutually agreeable to the Committee and Ms. Puckett) during the first 24 months of her employment with the company; and |
• | up to $10,000 in legal fees incurred by her for review and negotiation of her employment agreement. |
Ms. Puckett was reimbursed for her legal fees, but has not sought the other reimbursements described above.
Pension and Retirement
We have established an unfunded, non-qualified pension restoration plan (the “Restoration Pension Plan”), which we froze (as to new participants and benefit accrual based on continued service) on April 1, 2014. Executives holding office prior to the freeze date are the only designated participants in our Restoration Pension Plan. These pension benefits were designed to attract and retain key talent by providing our executives with a competitive retirement income program to supplement savings through our 401(k) plan.
The annual pension benefit under the Restoration Pension Plan is largely computed by multiplying the number of years of employment by a percentage of the participant’s final average earnings (earnings during the highest five consecutive years prior to April 1, 2014). All benefits payable under the Restoration Pension Plan are to be paid from our general assets, but we are not required to set aside any funds to discharge our obligations under the Restoration Pension Plan. There were no changes to the benefits provided to our named executive officers under our pension plans in 2016, although we amended the Restoration Pension Plan on October 11, 2016 to make discretionary the funding of a trust for the benefit of participants. Further details about our pension plans are shown in the “Pension Benefits” section below.
54
Severance Arrangements-Generally
In 2016 we had four types of severance arrangements with our executive officers, each addressing or intended to address different employment and/or termination circumstances:
• | our executive severance policy (the “Executive Severance Policy”); |
• | “change in control” severance agreement (the “CIC Agreements”); |
• | severance agreements with Messrs. Harrison, Munden and Shepard (the “Severance Agreements”); and |
• | an employment agreement with our CEO (the “CEO Agreement”). |
Severance Arrangements-Executive Severance Policy
In January 2015, we adopted an Executive Severance Policy applicable to corporate officers and certain other executive employees designated by the Committee. The Executive Severance Policy applies only for executives in circumstances when they do not have a specific agreement that determines their rights to severance, such as the CIC Agreements, Severance Agreements and CEO Agreement described below. The Executive Severance Policy provides executives whose employment is terminated without “cause,” (i) severance payments equal to such executive’s then-current base salary for the applicable severance period (two years for our CEO and one year for all others) and (ii) subject to certain conditions, up to a year of contributions toward health care coverage. In exchange, executives are required to deliver a full release to the company, and adhere to non-competition and non-solicitation covenants. The Executive Severance Policy does not provide any acceleration of vesting for equity awards in the event of an executive’s termination. The Executive Severance Policy can be amended upon six months’ notice by the Committee, and it terminates immediately prior to a change of control of the company. The foregoing is merely a summary of the Severance Policy, and is subject to the Executive Severance Policy itself as filed January 30, 2015 on a Form 8-K with the SEC.
Severance Arrangements-CIC Agreements
The CIC Agreements are designed to allow us to attract and retain key talent by providing defined compensation in the event of a change in control. The payout levels and other terms of the severance agreements are based on the Committee’s review of publicly available market data regarding severance agreements and prior iterations of these agreements. Our current form of CIC Agreement has been accepted by all of our officers (except for the CEO, who has similar terms in her employment agreement). The CIC Agreements provide that if, after a change in control, an executive (i) is terminated other than for “cause” (as defined in the agreement), death or disability or (ii) elects to terminate his employment for "good reason", then such executive is entitled to severance compensation and a cash payment sufficient to cover health insurance premiums for a period of 24 months. The amount of severance compensation is the sum of (A) the executive’s annual base salary in effect immediately prior to the change in control or termination date, whichever is larger, plus (B) the executive’s target-level bonus or incentive compensation, multiplied by 1.0 for vice presidents, 2.0 for senior vice presidents and executive vice presidents, and 3.0 for the CEO. The foregoing severance multiples were reduced by 0.5 for levels below CEO as a result of changes made in the form of CIC Agreement in 2015, but incumbent officers retained their earlier-awarded higher multiples (as reflected in the Potential Payments Upon Termination or Change in Control section below). With respect to equity awards, the CIC Agreements provide that so long as such awards are assumed or replaced with equivalent awards by the acquirer, there will be no acceleration of equity awards. The foregoing is merely a summary of the most important changes to the CIC Agreements, and is subject to the revised CIC Agreement itself as filed March 19, 2015 on a Form 8-K with the SEC.
Severance Arrangements-Severance Agreements
The Severance Agreements were designed to promote the retention of key executives during our 2013 CEO transition, to allow our new CEO at the time to be able to rely on a stable base of executive leaders familiar with our business. The Severance Agreements provide that if an officer is terminated other than (1) by reason of such officer’s death or disability, or (2) for cause, then:
• | the company shall pay such officer a lump sum cash payment equal to 1.5 times such officer’s then-current annual base salary; |
• | for a period of up to 18 months, the company will reimburse such officer for healthcare coverage as then elected to the extent such costs exceed his or her employee contribution prior to the termination date; and |
• | all outstanding, unvested shares of time vesting restricted common stock held by such officer shall automatically become fully vested. |
55
Each Severance Agreement further provided that if the officer were employed by the company or one of its subsidiaries on July 1, 2014, then the company shall pay such officer a one-time retention bonus in an amount equal to 30% of such officer’s then-current base salary; such amounts were paid to Messrs. Shepard, Harrison and Munden and are reflected (in column (d) (Bonus)) in the Summary Compensation Table.
Severance Arrangements-CEO Agreement
Our CEO Agreement with Karen Puckett contains severance arrangements materially consistent with the CIC Agreements and Severance Agreements. The severance arrangements under these agreements differ materially from the foregoing only in that:
• | they are also entitled to severance compensation if employment is terminated by them for good reason (as defined in the employment agreement); |
• | the initial (inducement) restricted stock and option grants (but no subsequent grants) would vest one additional tranche upon a termination without cause or for good reason; and |
• | they would receive severance compensation equal to two times then-current base salary for most terminations not connected to a change in control. |
Discretionary Bonuses and Equity Awards
We pay sign-on and other bonuses and grant new-hire equity awards when necessary or appropriate to attract executive talent. Executives we recruit may have a significant amount of unrealized value in the form of unvested equity and other forgone compensation opportunities. Sign-on bonuses and special equity awards are an effective means of offsetting the compensation opportunities executives lose when they leave a former company to join Harte Hanks. The value of these awards was generally determined by reference to market benchmarks for such positions, negotiation with the candidates, and pro-ration for the term of service. As discussed above, Mr. Lal received equity awards in connection with his hiring, with the grant being sized as (and made in lieu of) any additional annual award for 2016. The allocation for these awards among our typical award features generally followed the same allocation adopted by the Committee for executives of the same level. Mr. Lal also received a $200,000 sign-on bonus to offset the value of equity awards he was forfeiting at his prior employer to take employment with the company.
In connection with our 2015 CEO transition, to ensure stability of senior leadership we offered retention bonuses to certain executive officers, including Messrs. Harrison and Munden, which provide for payment of a bonus of 25% of base salary if they remain employed by the company on July 1, 2016 (or upon a change in control); payment of this bonus was made in 2016 and is reflected in column (d) of the Summary Compensation Table below. Likewise, to recognize the significant additional responsibilities and commitment necessary in serving as our interim CEO, Mr. Shepard was awarded a grant of $450,000 in restricted stock (78,671 shares), vesting over three years (the value of which is included for 2015 in column (e) for Mr. Shepard in the Summary Compensation Table below).
We also may grant discretionary cash and equity awards from time to time when appropriate to retain key executives, to recognize expanded roles and responsibilities or for other reasons deemed appropriate by the Committee in its business judgment. The only such discretionary grant for 2016 was in connection with Mr. Shepard’s resignation: the Committee granted Mr. Munden a retention bonus of $125,000, payable if he remains employed by the company on December 31, 2017 (or upon a change in control). Aside from this grant, no other discretionary retention or recognition grants were made to named executive officers in 2016.
Internal Pay Equity
While comparisons to compensation levels at companies in our peer group are helpful in assessing the overall competitiveness of our compensation program, we believe that our executive compensation program also must be internally consistent and equitable to achieve our compensation objectives. Our compensation philosophy is consistent for all of our executive officer positions and, although the amounts vary, the elements of our executive compensation program are also consistent for our executives. In setting the various amounts and elements of 2016 compensation for our named executive officers, the Committee viewed each named executive officer’s compensation amounts and elements against those of the other named executive officers. The Committee did not establish any fixed formulas or ratios. Rather, the Committee’s ultimate compensation determinations were influenced by a number of factors, including internal pay equity, that were taken into consideration together in the Committee’s business judgment. We believe the total 2016 compensation we paid to each of our named executive officers was appropriate in relation to the other named executive officers, in light of their respective responsibilities, tenure and experience.
56
Stock Ownership Guidelines & Hedging Policies
The Committee believes that stock ownership requirements encourage officers to maintain a significant financial stake in our company, thus reinforcing the alignment of their interests with those of our stockholders. Consistent with this philosophy, we have stock ownership guidelines that require all officers to acquire and hold significant levels of our common stock. Under the new guidelines, a corporate officer must reach the minimum required level of common stock ownership no later than five years from commencement of employment (and sooner in some cases). Officers promoted to a level with a higher minimum equity ownership level have three years to reach the higher level of ownership. The target ownership level (relative to base annual salary) is 500% for the CEO, 200% for executive vice presidents and senior vice presidents, and 100% for vice presidents.
The recent stock ownership of our executive officers is reflected in the section below entitled “Security Ownership of Certain Beneficial Owners and Management and Related Stockholder Matters.” For purposes of measuring compliance with these stock ownership guidelines, all common stock (including restricted stock) owned by an executive officer is included. Neither options nor performance awards are included in the compliance calculation.
If an officer has not previously met the minimum equity ownership level, the officer must retain half of the “net shares” related to any option exercise or vesting of restricted stock or performance awards. “Net shares” means the number of shares remaining after the sale of shares to cover the exercise price of options and the sale of shares sufficient to pay taxes related to the exercise of options or vesting of restricted stock or performance awards. If an executive officer has previously met the applicable target ownership level, then so long as such officer maintains the number of shares needed for compliance at that time, the officer will be deemed to be in compliance notwithstanding any stock price fluctuations.
The ownership guidelines, and compliance by officers with the guidelines, are reviewed annually by the Committee. Any remedial action for failure to comply with the stock ownership guidelines is to be determined by the Committee on a case-by-case basis. Although Mr. Shepard was in compliance with guideline ownership level requirements, currently none of the other named executive officers are. Under the guidelines, Ms. Puckett will have through September 2020 and Mr. Lal through March 2021 to establish compliance. None of our executive officers have sold shares of the company’s stock during their tenure as executive officers.
As part of our Business Conduct Policy, we have adopted an insider trading policy that, among other things, forbids officers from engaging in hedging activities with respect to our securities.
Tax Deductibility of Executive Compensation
Section 162(m) of the Code prevents us from taking a tax deduction for non-performance-based compensation over $1 million in any fiscal year paid to certain senior executive officers. In designing our executive compensation program, we consider the effect of Section 162(m) together with other factors relevant to our business needs. We seek to design our annual cash incentive and long-term performance unit awards and stock option awards to be tax-deductible to Harte Hanks, so long as preserving the tax deduction does not inhibit our ability to achieve our executive compensation or other objectives. The Committee does have discretion to design and use compensation elements that are not deductible under Section 162(m) if the Committee believes that paying non-deductible compensation is appropriate to achieve our executive compensation objectives. The inducement awards made to Mr. Lal (and in 2015 to Ms. Puckett and Mr. Grillo) will not qualify as deductible compensation to the extent they (or they cause aggregate compensation in the applicable year to) exceed $1 million.
Review of and Conclusion Regarding All Components of Executive Compensation
The Compensation Committee has reviewed all components of the named executive officers’ 2016 compensation, including salary, bonus, long-term equity incentive compensation, accumulated realized and unrealized equity compensation gains (and losses), the value to the executive and the cost to the company of all perquisites and other personal benefits and any payments that may be payable under their respective severance agreements due to termination of their employment or a change in control of the company. The Committee also notes that company financial performance has been unsatisfactory for some time, and that performance is further reflected in the company’s stock price and stockholder value. Although the company’s compensation programs have not resulted in improved company performance, the use of performance-based compensation has had the intended effect of reducing compensation for executive officers when stockholders suffer: no equity-based performance awards have vested in the past five years, nor have any significant annual incentive plan bonuses been paid (and none in the past three years). Likewise, the use of equity awards for a significant portion of executive officer compensation has subjected them to the same diminished value felt by stockholders.
The Committee, like the company’s executive officers, are challenged by the steep declines faced by the business. Nevertheless, the company operates in an environment where there is competition for talent, and when executive officers take on additional
57
responsibilities as they navigate a turn-around, providing meaningful compensation that serves to reward their efforts, if successful, is essential. Based upon the Compensation Committee’s review, the Committee believes the compensation for our executive officers is competitive and that our compensation practices have enabled Harte Hanks to attract and retain the executive talent needed for the challenging turn-around the company is facing. The Committee also finds the named executive officers’ total compensation to be fair and reasonable for our circumstances, and consistent with the Committee’s and the company’s executive compensation philosophy.
Compensation Committee Report
The material in this report is not “soliciting material,” is not deemed “filed” with the SEC, and is not to be incorporated by reference into any filing under the Securities Act or the Exchange Act, whether made before or after the date hereof and irrespective of any general incorporation language in such filing.
The Compensation Committee of the Board of Directors has reviewed and discussed with management the Compensation Discussion and Analysis required by Item 402(b) of Regulation S-K and contained in this Form 10-K. Based on such review and discussions, the Compensation Committee recommended to the Board that the Compensation Discussion and Analysis be included in this Form 10-K.
Compensation Committee | |
Scott C. Key, Chair | |
Stephen E. Carley | |
Christopher M. Harte | |
Judy C. Odom | |
Important Note Regarding Compensation Tables
The following compensation tables in this Form 10-K have been prepared pursuant to SEC rules. Although some amounts (e.g., salary and non-equity incentive plan compensation) represent actual dollars paid to an executive, other amounts are estimates based on certain assumptions about future circumstances (e.g., payments upon termination of an executive’s employment) or they may represent dollar amounts recognized for financial statement reporting purposes in accordance with SFAS 123R, but do not represent actual dollars received by the executive (e.g., dollar values of stock awards and option awards). The footnotes and other explanations to the Summary Compensation table and the other tables herein contain important estimates, assumptions and other information regarding the amounts set forth in the tables and should be considered together with the quantitative information in the tables.
58
Summary Compensation Table
The following table sets forth information regarding compensation earned for 2016, 2015 and 2014 by our named executive officers. The amounts in column (i) are further described in the All Other Compensation table included below.
Salary | Bonus (1) | Stock Awards (2) | Option Awards (2) | Change in Pension Value and Nonqualified Deferred Compensation Earnings (4) | All Other Compensation | Total | |||||||||||||||||
Name and Principal Position | Year | ($) | ($) | ($) | ($) | ($) | ($) | ($) | |||||||||||||||
(a) | (b) | (c) | (d) | (e) | (f) | (h) | (i) | (j) | |||||||||||||||
Karen Puckett (4) | 2016 | 741,986 | — | 1,502,509 | — | — | 23,860 | 2,268,355 | |||||||||||||||
President and | 2015 | 234,615 | — | 1,610,086 | 577,115 | — | 88,657 | 2,510,473 | |||||||||||||||
Chief Executive Officer | 2014 | — | — | 59,999 | — | — | 68,450 | 128,449 | |||||||||||||||
Shirish Lal | 2016 | 323,980 | 200,000 | 338,759 | 149,999 | — | 1,620 | 1,014,358 | |||||||||||||||
Executive Vice President, Chief Operating | 2015 | — | — | — | — | — | — | — | |||||||||||||||
Officer & Chief Technology Officer | 2014 | — | — | — | — | — | — | — | |||||||||||||||
Doug Shepard (5) | 2016 | 458,820 | — | 523,685 | — | 25,749 | 26,086 | 1,034,340 | |||||||||||||||
Executive Vice President | 2015 | 426,635 | — | 964,678 | 171,561 | — | 58,565 | 1,621,439 | |||||||||||||||
and Chief Financial Officer | 2014 | 375,000 | 112,500 | 473,504 | 212,826 | 88,732 | 39,837 | 1,302,399 | |||||||||||||||
Robert Munden | 2016 | 313,820 | 79,175 | 298,028 | — | 11,768 | 17,088 | 719,879 | |||||||||||||||
Executive Vice President | 2015 | 316,731 | — | 296,803 | 98,936 | — | 36,549 | 749,019 | |||||||||||||||
and General Counsel & Secretary | 2014 | 305,000 | 91,500 | 273,058 | 122,733 | 43,275 | 34,629 | 870,195 | |||||||||||||||
Andrew Harrison | 2016 | 298,595 | 75,425 | 298,028 | — | 29,200 | 17,527 | 718,775 | |||||||||||||||
Executive Vice President, Human | 2015 | 301,154 | 2,000 | 296,803 | 98,936 | — | 38,001 | 736,894 | |||||||||||||||
Human Resources and Contact Centers | 2014 | 275,769 | 121,516 | 296,183 | 134,124 | 93,261 | 32,589 | 953,442 | |||||||||||||||
(1) | For Messrs. Shepard, Harrison and Munden in 2014, represents retention bonuses paid pursuant to their respective Severance Agreements, and additionally for Mr. Harrison, a discretionary retention incentive of $34,516 in the form of restricted stock and options granted in 2015 in part in respect of 2014 performance (the value of which are included in columns (e) and (f)). For Mr. Harrison in 2015, represents divisional anniversary bonus. For 2016, represents a signing bonus for Mr. Lal, and retention bonuses for Messrs. Harrison and Munden. |
(2) | The amounts in columns (e) and (f) reflect the full grant date fair value of the awards calculated in accordance with FASB ASC Topic 718. For a discussion of valuation assumptions, see note H of our audited financial statements for the fiscal year ended December 31, 2016 included in our Form 10-K. For performance based stock units the fair value assumed such awards vested based on probable outcome of the performance conditions as of the grant date. For Ms. Puckett, 2014 amount reflects stock award made in respect of her service as an independent director, and in 2015 includes $59,993 for similar stock grants. |
(3) | The amounts in column (h) reflect an estimate of the actuarial increase in the present value of the named executive officer’s benefits under the Restoration Pension Plan, determined using interest rate and mortality rate assumptions consistent with those used in our audited financial statements and described in note F of our audited financial statements for the fiscal year ended December 31, 2016 included in our Form 10-K. There can be no assurance that the amounts shown will ever be realized by the named executive officers |
(4) | Ms. Puckett served as a director before her appointment as President and CEO effective September 14, 2015. |
(5) | Mr. Shepard resigned from the company effective December 31, 2016. |
59
All Other Compensation
Name | Year | Insurance Premium (1) | Auto Allowance | Company Contributions to 401(k) Plan | Dividends on Restricted Stock (2) | Other (3) | Total | |||||||||||||||||||
Karen Puckett | 2016 | $ | 1,150 | $ | 3,975 | $ | — | $ | 18,735 | $ | — | $ | 23,860 | |||||||||||||
2015 | $ | — | $ | 5,300 | $ | — | $ | 23,357 | $ | 60,000 | $ | 88,657 | ||||||||||||||
2014 | $ | — | $ | — | $ | — | $ | 4,950 | $ | 63,500 | $ | 68,450 | ||||||||||||||
Shirish Lal | 2016 | $ | 1,054 | $ | 566 | $ | — | $ | — | $ | — | $ | 1,620 | |||||||||||||
2015 | $ | — | $ | — | $ | — | $ | — | $ | — | $ | — | ||||||||||||||
2014 | $ | — | $ | — | $ | — | $ | — | $ | — | $ | — | ||||||||||||||
Doug Shepard | 2016 | $ | 519 | $ | 2,925 | $ | 10,600 | $ | 12,042 | $ | — | $ | 26,086 | |||||||||||||
2015 | $ | 519 | $ | 11,700 | $ | 10,600 | $ | 35,746 | $ | — | $ | 58,565 | ||||||||||||||
2014 | $ | 519 | $ | 11,700 | $ | 10,400 | $ | 17,218 | $ | — | $ | 39,837 | ||||||||||||||
Robert Munden | 2016 | $ | 475 | $ | 2,925 | $ | 10,600 | $ | 3,088 | $ | — | $ | 17,088 | |||||||||||||
2015 | $ | 475 | $ | 11,700 | $ | 10,600 | $ | 13,774 | $ | — | $ | 36,549 | ||||||||||||||
2014 | $ | 475 | $ | 11,700 | $ | 10,400 | $ | 12,054 | $ | — | $ | 34,629 | ||||||||||||||
Andrew Harrison | 2016 | $ | 914 | $ | 2,925 | $ | 10,600 | $ | 3,088 | $ | — | $ | 17,527 | |||||||||||||
2015 | $ | 914 | $ | 11,700 | $ | 10,600 | $ | 14,787 | $ | — | $ | 38,001 | ||||||||||||||
2014 | $ | 580 | $ | 10,575 | $ | 10,400 | $ | 11,034 | $ | — | $ | 32,589 | ||||||||||||||
(1) | Reflects annual premium paid by Harte Hanks for life insurance policies obtained in connection with providing salary continuation benefits to each of the named executive officers; see “Perquisites” included above in the CD&A. |
(2) | Reflects dividends paid by Harte Hanks during the year on shares of restricted stock held by each of the named executive officers; such dividends are paid at the same rate as paid on other shares of common stock. |
(3) | Amounts for Ms. Puckett reflect (i) in 2015, board service fees of $50,000 earned during her tenure as an independent director, and reimbursement of $10,000 in legal fees incurred in connection with the negotiation of her employment agreement, and (ii) in 2014 board service fees earned as an independent director. |
60
Grants of Plan Based Awards
The following table sets forth information regarding grants of equity-based awards during 2016 to our named executive officers. All equity awards described below were granted pursuant to our 2013 Plan, except for inducement awards made to Ms. Puckett and Messrs. Grillo and Lal in connection with their hiring. Recipients receive dividends on unvested restricted stock at the same rate as other stockholders; dividends are not paid in respect of performance awards or stock options. See “Potential Payments Upon Termination or Change in Control” below for other circumstance in which equity awards may vest. Other than the amounts reported in the Summary Compensation table above, there were no non-equity incentive plan awards granted in 2016.
Estimated Future Payouts Under Non-Equity Incentive Plan Awards | Estimated Future Payouts Under Equity Incentive Plan Awards | All Other Stock Awards: Number of Shares of Stock or Units | All Other Option Awards: Number of Securities Underlying Options (2) | Exercise or Base Price of Option Awards (3) | Grant Date Fair Value of Stock and Option Awards (4) | |||||||||||||||||||||||||||||||||||
Threshold | Target | Maximum | Threshold | Target | Maximum | |||||||||||||||||||||||||||||||||||
Name | Award Type (1) | Grant Date | ($) | ($) | ($) | (#) | (#) | (#) | (#) | (#) | ($/Sh) | ($) | ||||||||||||||||||||||||||||
(a) | (b) | (c) | (d) | (e) | (f) | (g) | (h) | (i) | (j) | (k) | (l) | |||||||||||||||||||||||||||||
Karen Puckett | AIP | 3/29/2016 | $ | 186,475 | $ | 745,900 | $ | 1,491,800 | ||||||||||||||||||||||||||||||||
PSU(S) | 4/15/2016 | 46,250 | 92,500 | 185,000 | $ | 1.90 | $ | 175,750 | ||||||||||||||||||||||||||||||||
RSA | 4/15/2016 | 185,000 | $ | 2.69 | $ | 497,650 | ||||||||||||||||||||||||||||||||||
PSU(C) | 4/15/2016 | 130,548 | 195,822 | 261,096 | $ | 2.69 | $ | 526,761 | ||||||||||||||||||||||||||||||||
RSU | 4/15/2016 | 112,397 | $ | 2.69 | $ | 302,348 | ||||||||||||||||||||||||||||||||||
Shirish Lal | AIP | 3/29/2016 | $ | 77,194 | $ | 308,775 | $ | 617,550 | ||||||||||||||||||||||||||||||||
Option | 3/16/2016 | 120,371 | (4) | $ | 2.85 | $ | 149,999 | |||||||||||||||||||||||||||||||||
RSA | 3/16/2016 | 73,684 | $ | 2.85 | $ | 209,999 | ||||||||||||||||||||||||||||||||||
PSU(S) | 4/15/2016 | 12,000 | 24,000 | 48,000 | $ | 1.90 | $ | 45,600 | ||||||||||||||||||||||||||||||||
PSU(C) | 4/15/2016 | 20,610 | 30,914 | 41,219 | $ | 2.69 | $ | 83,159 | ||||||||||||||||||||||||||||||||
Doug Shepard | AIP | 3/29/2016 | $ | 80,798 | $ | 323,190 | $ | 646,380 | ||||||||||||||||||||||||||||||||
PSU(S) | 4/15/2016 | 18,750 | 37,500 | 75,000 | $ | 1.90 | $ | 71,250 | ||||||||||||||||||||||||||||||||
RSA | 4/15/2016 | 75,000 | $ | 2.69 | $ | 201,750 | ||||||||||||||||||||||||||||||||||
PSU(C) | 4/15/2016 | 34,061 | 51,092 | 68,122 | $ | 2.69 | $ | 137,437 | ||||||||||||||||||||||||||||||||
RSU | 4/15/2016 | 42,100 | $ | 2.69 | $ | 113,249 | ||||||||||||||||||||||||||||||||||
Robert Munden | AIP | 3/29/2016 | $ | 39,588 | $ | 158,350 | $ | 316,700 | ||||||||||||||||||||||||||||||||
PSU(S) | 4/15/2016 | 11,000 | 22,000 | 44,000 | $ | 1.90 | $ | 41,800 | ||||||||||||||||||||||||||||||||
RSA | 4/15/2016 | 44,000 | $ | 2.69 | $ | 118,360 | ||||||||||||||||||||||||||||||||||
PSU(C) | 4/15/2016 | 18,892 | 28,338 | 37,784 | $ | 2.69 | $ | 76,229 | ||||||||||||||||||||||||||||||||
RSU | 4/15/2016 | 22,914 | $ | 2.69 | $ | 61,639 | ||||||||||||||||||||||||||||||||||
Andrew Harrison | AIP | 3/29/2016 | $ | 37,713 | $ | 150,850 | $ | 301,700 | ||||||||||||||||||||||||||||||||
PSU(S) | 4/15/2016 | 11,000 | 22,000 | 44,000 | $ | 1.90 | $ | 41,800 | ||||||||||||||||||||||||||||||||
RSA | 4/15/2016 | 44,000 | $ | 2.69 | $ | 118,360 | ||||||||||||||||||||||||||||||||||
PSU(C) | 4/15/2016 | 18,892 | 28,338 | 37,784 | $ | 2.69 | $ | 76,229 | ||||||||||||||||||||||||||||||||
RSU | 4/15/2016 | 22,914 | $ | 2.69 | $ | 61,639 | ||||||||||||||||||||||||||||||||||
(1) | Type of Award: AIP = Annual Incentive Plan (cash); PSU(S) = Performance Award (unit settling in stock) with a TSR performance measure; RSA = Restricted Stock Award; PSU(C) = Performance Award (unit settling in cash) with a revenue performance measure; Option = Stock Option; see Additional Analysis of Executive Compensation Elements-Long Term Incentive Awards above for more details. |
(2) | The amount shown in column (k) is based upon the closing market price of our common stock on the grant date, as reported on the NYSE. |
(3) | The amounts shown in column (l) represent the full grant date fair value of the options and awards calculated in accordance with FASB ASC Topic 718. For a discussion of valuation assumptions, see Note H, Stock-Base Compensation, in this Form 10-K. |
(4) | Options were granted at exercise prices equal to the market value of our common stock on the grant date. Options expire on the tenth anniversary of the grant date and vest in four equal annual installments, one on each of the first four anniversaries of the grant date. |
61
Outstanding Equity Awards at Year End
The following table sets forth information regarding outstanding equity awards held at the end of 2016 by our named executive officers. Most of these equity awards were issued pursuant to the 2013 Plan or the 2005 Plan, except for the initial grants made to Ms. Puckett and Messrs. Grillo and Lal, which were issued as inducement awards outside our stockholder-approved plans as permitted by NYSE regulations. The 2013 Plan and 2005 Plan are filed as exhibits to this Form 10-K, as are the award documents for the inducement awards.
Option Awards | Stock Awards | ||||||||||||||||||||||||||||||||
Name | Number of Securities Underlying Unexercised Options (#) Exercisable | Number of Securities Underlying Unexercised Options (#) Unexercisable | Option Exercise Price ($) | Option Expiration Date | Number of Shares or Units of Stock That Have Not Vested (#) | Market Value of Shares or Units of Stock That Have Not Vested ($) | Equity Incentive Plan Awards: Number of Unearned Shares, Units or Other Rights That Have Not Vested (#) | Incentive Plan Awards: Market or Payout Value of Unearned Shares, Units or Other Rights That Have Not Vested ($) (1) (2) | |||||||||||||||||||||||||
(a) | (b) | (c) | (e) | (f) | (g) | (h) | (i) | (j) | |||||||||||||||||||||||||
Karen Puckett | 216,841 | 650,523 | (3 | ) | $ | 3.79 | 9/17/2025 | 112,397 | (7) | $ | 169,719 | 185,000 | (16 | ) | $ | 279,350 | |||||||||||||||||
185,000 | (8) | $ | 279,350 | 261,096 | (17 | ) | $ | 394,255 | |||||||||||||||||||||||||
141,601 | (9) | $ | 213,818 | 349,809 | (16 | ) | $ | 528,212 | |||||||||||||||||||||||||
5,154 | (10) | $ | 7,783 | ||||||||||||||||||||||||||||||
2,853 | (11) | $ | 4,308 | ||||||||||||||||||||||||||||||
Shirish Lal | — | 120,371 | (4 | ) | $ | 2.85 | 3/16/2016 | 73,684 | (12) | $ | 111,263 | 41,219 | (17 | ) | $ | 62,241 | |||||||||||||||||
48,000 | (16 | ) | $ | 72,480 | |||||||||||||||||||||||||||||
Doug Shepard | 20,774 | 62,324 | (5 | ) | $ | 7.68 | 4/15/2025 | 42,100 | (7) | $ | 63,571 | 75,000 | (16 | ) | $ | 113,250 | |||||||||||||||||
39,946 | 39,947 | (6 | ) | $ | 8.23 | 4/15/2024 | 75,000 | (8) | $ | 113,250 | 68,122 | (17 | ) | $ | 102,864 | ||||||||||||||||||
60,000 | — | $ | 7.25 | 9/18/2022 | 52,448 | (13) | $ | 79,196 | 30,833 | (18 | ) | $ | 46,558 | ||||||||||||||||||||
40,000 | — | $ | 9.91 | 2/5/2022 | 26,806 | (14) | $ | 40,477 | 26,589 | (19 | ) | $ | 40,149 | ||||||||||||||||||||
10,000 | — | $ | 12.31 | 2/5/2021 | 11,396 | (15) | $ | 17,208 | |||||||||||||||||||||||||
75,000 | — | $ | 11.90 | 2/5/2020 | |||||||||||||||||||||||||||||
90,000 | — | $ | 6.04 | 2/5/2019 | |||||||||||||||||||||||||||||
15,000 | — | $ | 15.90 | 2/5/2018 | |||||||||||||||||||||||||||||
50,000 | — | $ | 17.30 | 12/31/2017 | |||||||||||||||||||||||||||||
Robert Munden | 11,980 | 35,941 | (5 | ) | $ | 7.68 | 4/15/2025 | 22,914 | (7) | $ | 34,600 | 37,784 | (16 | ) | $ | 57,054 | |||||||||||||||||
23,036 | 23,037 | (6 | ) | $ | 8.23 | 4/15/2024 | 44,000 | (8) | $ | 66,440 | 44,000 | (17 | ) | $ | 66,440 | ||||||||||||||||||
60,000 | — | $ | 7.25 | 9/18/2022 | 15,459 | (14) | $ | 23,343 | 17,780 | (18 | ) | $ | 26,848 | ||||||||||||||||||||
28,000 | — | $ | 9.91 | 2/5/2022 | 6,572 | (15) | $ | 9,924 | 15,333 | (19 | ) | $ | 23,153 | ||||||||||||||||||||
12,000 | — | $ | 12.31 | 2/5/2021 | |||||||||||||||||||||||||||||
40,000 | — | $ | 13.19 | 4/9/2020 | |||||||||||||||||||||||||||||
Andrew Harrison | 11,980 | 35,941 | (5 | ) | $ | 7.68 | 4/15/2025 | 22,914 | (7) | $ | 34,600 | 37,784 | (16 | ) | $ | 57,054 | |||||||||||||||||
5,700 | — | $ | 7.76 | 2/5/2025 | 44,000 | (8) | $ | 66,440 | 44,000 | (17 | ) | $ | 66,440 | ||||||||||||||||||||
23,036 | 23,037 | (6 | ) | $ | 8.23 | 4/15/2024 | 15,459 | (14) | $ | 23,343 | 17,780 | (18 | ) | $ | 26,848 | ||||||||||||||||||
40,000 | — | $ | 7.25 | 9/18/2022 | 6,572 | (15) | $ | 9,924 | 15,333 | (19 | ) | $ | 23,153 | ||||||||||||||||||||
8,000 | — | $ | 9.91 | 2/5/2022 | |||||||||||||||||||||||||||||
4,000 | — | $ | 12.31 | 2/5/2021 | |||||||||||||||||||||||||||||
12,000 | — | $ | 11.90 | 2/5/2020 | |||||||||||||||||||||||||||||
11,250 | — | $ | 6.04 | 2/5/2019 | |||||||||||||||||||||||||||||
4,000 | — | $ | 15.90 | 2/5/2018 | |||||||||||||||||||||||||||||
750 | — | $ | 26.07 | 2/5/2017 | |||||||||||||||||||||||||||||
(1) | Based upon the closing market price of our common stock as of December 31, 2016 ($1.51), as reported on the NYSE. |
(2) | In 2014, 2015 and 2016, our Compensation Committee awarded our executives performance-based stock units which are payable, if earned, in shares of common stock or cash. The payout levels range from 0% to a maximum of 100% of the performance units granted. At the time of each grant, it was expected that the probable outcome of the performance criterion would lead to a payout level of 75%. |
(3) | These options vest in three equal annual installments on September 17 of 2017 - 2019. |
(4) | These options vest in four equal annual installments on March 16 of 2017 - 2020. |
(5) | These options vest in three equal annual installments on April 15 of 2017 - 2019. |
(6) | These options vest in two equal annual installments on April 15 of 2017 - 2018. |
(7) | Restricted stock vests in three equal annual installments on April 15 of 2017 - 2019. |
62
(8) | Restricted stock units (phantom stock) vests in four equal annual installments on April 15 of 2017 - 2020. |
(9) | Restricted stock vests in two equal annual installments on September 17 of 2017 - 2018. |
(10) | Restricted stock vest(ed) in two equal annual installments on February 5 of 2017 - 2018. |
(11) | Restricted stock vested on February 5, 2017. |
(12) | Restricted stock vest(ed) in three equal annual installments on March 16 of 2017 - 2019. |
(13) | Restricted stock vests in two equal annual installments on July 7 of 2017 - 2018. |
(14) | Restricted stock vests in two equal annual installments on April 15 of 2017 - 2018. |
(15) | Restricted stock vests on April 15, 2017. |
(16) | Performance stock unit vests (payable in stock) February 15, 2019, subject to relative TSR performance conditions. |
(17) | Performance stock unit vests (payable in cash) February 15, 2019, subject to revenue performance conditions. |
(18) | Performance stock unit vests (payable in stock) February 15, 2018, subject to operating income performance conditions. |
(19) | Performance stock unit would vest (payable in stock) February 15, 2017, subject to operating income performance conditions; conditions were not met, so no units vested. |
Option Exercises and Stock Vested
The following table sets forth information for our named executive officers regarding option exercises and equity vesting during 2016.
Stock Awards | ||||||
Name | Number of Shares Acquired on Vesting (#) | Value Realized on Vesting ($) | ||||
(a) | (d) | (e) (1) | ||||
Karen Puckett | 78,389 | $ | 134,505 | |||
Shirish Lal | — | $ | — | |||
Doug Shepard | 61,022 | $ | 136,723 | |||
Robert Munden | 22,635 | $ | 64,602 | |||
Andrew Harrison | 25,615 | $ | 74,049 | |||
(1) Calculated as the aggregate market value of the vested shares based on the closing price of our common stock on the vesting date.
Pension Benefits—Restoration Pension Plan
The table below under this heading sets forth information regarding estimated payments or other benefits payable at, following or in connection with retirement to which our named executive officers are entitled under our Restoration Pension Plan. The Restoration Pension Plan is administered by a committee comprised of Messrs. Copeland, Harrison and Munden.
The purpose of this unfunded, non-qualified pension plan is to provide executives with the benefits they would receive if our qualified defined benefit plan (in which no current named executive participates) were not subject to the benefit and compensation limits imposed by Section 415 and Section 401(a)(17) of the Code and had benefit accruals under such plan not been frozen at December 31, 1998. The Restoration Pension Plan was itself frozen to participation and benefit accruals as of April 1, 2014; all current participants-current or former executive officers-are fully vested. Benefits accrued and vested after December 31, 2004 under the Restoration Pension Plan are subject to non-qualified deferred compensation rules under Section 409A of the Code. The Restoration Pension Plan provides benefits based on a formula that takes into account the executive’s earnings for each fiscal year. For purposes of the calculation of the monthly amount payable starting after retirement under the Restoration Pension Plan, the following definitions apply:
“Average Monthly Compensation” means the monthly average of the five consecutive years’ compensation out of the last ten complete years on April 1, 2014 that gives the highest average. For purposes of determining the gross benefit under the Restoration Pension Plan, compensation includes W-2 compensation (subject to certain exclusions) plus any compensation deferred under a Section 125 or Section 401(k) plan, but only recognizes up to 100% of the target bonus amount for years prior to 2001 and up to 50% of the target bonus amount for years after 2000. The compensation for the gross Restoration Pension Plan benefit is not limited by the Code Section 401(a)(17) pay limit.
“Normal Retirement Date” means the date upon which a participant reaches age 65.
“Covered Compensation” means a 35-year average of the Maximum Taxable Wages ("MTW") under social security. The MTW is the annual limit on wages subject to the FICA tax for social security. The 35-year period ends with the year the employee reaches eligibility for an unreduced social security benefit (age 65, 66, or 67 depending on the year the
63
employee was born). For years after 2014 (the year of the Restoration Pension Plan freeze) and prior to the end of the 35-year period, the MTW from 2014 is used.
The monthly amount is the lesser of the sum of A and B multiplied by C and D as defined below:
A = | 1.0 percent of the Average Monthly Compensation multiplied by the projected number of years of credited service at the Normal Retirement Date. |
B = | 0.65 percent of the Average Monthly Compensation in excess of 1/12 of Covered Compensation multiplied by the number of years of projected credited service at the Normal Retirement Date up to 35 years. |
C = | Ratio of credited service at April 1, 2014 to projected credited service at the Normal Retirement Date. |
D = | 50 percent of Average Monthly Compensation. |
Participants are eligible for early retirement upon attainment of age 55 if they are vested (as all current participants are). The monthly amount payable upon early retirement is equal to the monthly accrued benefit at the date of termination multiplied by an early retirement factor as decreased by certain plan and Internal Revenue Service-prescribed early retirement factors. We do not have a policy for granting extra years of credited service. In the event of a change of control (as defined in the Restoration Benefit Plan), our then-current obligations may, in our discretion, be funded through the establishment of a trust fund.
The amounts reported in the following table equal the present value of the accumulated benefit through December 31, 2016 for our named executive officers under the Restoration Pension Plan based on the assumptions described in note (1).
Number of Years of Credited Service | Present Value of Accumulated Benefit (1) | Payments During Last Fiscal Year | |||||||||||
Name | Plan Name | (#) | ($) | ($) | |||||||||
(a) | (b) | (c) | (d) | (e) | |||||||||
Karen Puckett | Restoration Benefit Plan | — | $ | — | $ | — | |||||||
Shirish Lal | Restoration Benefit Plan | — | $ | — | $ | — | |||||||
Doug Shepard | Restoration Benefit Plan | 6.250 | $ | 274,921 | $ | — | |||||||
Robert Munden | Restoration Benefit Plan | 4.000 | $ | 122,859 | $ | — | |||||||
Andrew Harrison | Restoration Benefit Plan | 18.583 | $ | 290,653 | $ | — | |||||||
(1) | The accumulated benefit is based on service and earnings, as described above, considered by the plans for the period through December 31, 2015. The present value has been calculated using a discount rate of 4.21% and assuming the named executive officers will live and retire at the normal retirement age of 65 years. For purposes of calculating the actuarial present value, no pre-retirement decrements are factored into the calculations. The mortality assumption is based on the RP2006 generational mortality tables projected using Scale MP2016. |
Potential Payments Upon Termination or Change in Control
Payments Pursuant to Severance Agreements
In 2016 we had four types of severance arrangements with our executive officers, each addressing or intended to address different employment and/or termination circumstances:
• | the Executive Severance Policy; |
• | the CIC Agreements; |
• | Severance Agreements with Messrs. Harrison, Munden and Shepard; and |
• | CEO Agreement with Ms. Puckett. |
Severance Arrangements-Executive Severance Policy
In January 2015, we adopted an Executive Severance Policy applicable to corporate officers and certain other executive employees designated by the Committee. The Executive Severance Policy applies only for executives in circumstances when they do not have a specific agreement that determines their rights to severance, such as the CIC Agreements, Severance Agreements and CEO Agreement. The Executive Severance Policy provides executives whose employment is terminated without “cause,” (i) severance payments equal to such executive’s then-current base salary for the applicable severance period (two years for our CEO and one year for all others) and (ii) subject to certain conditions, up to a year of contributions toward health care coverage. In exchange, executives are required to deliver a full release to the company, and adhere to non-competition and non-solicitation covenants. The Executive Severance Policy does not provide any acceleration of vesting for
64
equity awards in the event of an executive’s termination. The Executive Severance Policy can be amended upon six months’ notice by the Committee, and it terminates immediately prior to a change of control of the company.
Severance Arrangements-CIC Agreements
In 2015 we adopted a new form for our CIC Agreements which has been accepted by all of our officers (except for the CEO, who has similar terms in her employment agreement). The CIC Agreements provide that if, after a change in control, an executive (i) is terminated other than for “cause” (as defined in the agreement), death or disability or (ii) elects to terminate his or her employment for "good reason", then such executive is entitled to severance compensation and a cash payment sufficient to cover health insurance premiums for a period of 24 months. The amount of severance compensation is the sum of (A) the executive’s annual base salary in effect immediately prior to the change in control or termination date, whichever is larger, plus (B) the executive’s target-level bonus or incentive compensation, multiplied by 1.0 for vice presidents, 2.0 for senior vice presidents and executive vice presidents, and 3.0 for the CEO. The foregoing severance multiples were reduced by 0.5 for levels below CEO as a result of the 2015 CIC Agreement changes, but incumbent officers retained their earlier-awarded higher multiples (as reflected in the Potential Termination and Change in Control Benefits table below).
In addition to adopting a more customary form, the revised CIC Agreement also eliminated the “single-trigger” automatic acceleration of equity awards upon a change in control for executives. Instead, so long as such awards are assumed or replaced with equivalent awards by the acquirer, there will be no acceleration of equity awards. Other changes to the CIC Agreements included:
• | Establishing a clear offset right for the company so that executives cannot claim duplicate compensation under multiple arrangements; |
• | Basing the bonus component of severance compensation on the target bonus payable to the executive, rather than an average of previously paid bonuses; and |
• | Reforming the term and tail-period provisions to provide more clarity and certainty. |
Severance Arrangements-Severance Agreements
The Severance Agreements were designed to promote the retention of key executives (including Messrs. Shepard, Harrison and Munden) during our 2013 CEO transition, to allow our new CEO at the time to be able to rely on a stable base of executive leaders familiar with our business. The Severance Agreements provide that if an officer is terminated other than (1) by reason of such officer’s death or disability, or (2) for cause, then:
• | the company shall pay such officer a lump sum cash payment equal to 1.5 times such officer’s then-current annual base salary; |
• | for a period of up to 18 months, the company will reimburse such officer for healthcare coverage as then elected to the extent such costs exceed his or her employee contribution prior to the termination date; and |
• | all outstanding, unvested shares of time vesting restricted common stock held by such officer shall automatically become fully vested. |
Severance Arrangements-CEO Agreements
Our employment agreement with Ms. Puckett contains severance arrangements materially consistent with the CIC Agreements and Severance Agreements. The severance arrangements under this agreement differs materially from the foregoing only in that:
• | she is also entitled to severance compensation if she terminates her employment for good reason (as defined in the employment agreement); |
• | her initial (inducement) restricted stock and option grants (but no subsequent grants) would vest one additional tranche upon a termination without cause or for good reason; and |
• | she would receive severance compensation equal to two times her then-current base salary for most terminations not connected to a change in control. |
The foregoing description of our executive severance agreements do not include all terms contained in the actual agreements. Please refer to the full text of the agreements for the complete terms and provisions, copies of which are filed as exhibits to our public filings with the SEC. Refer to the exhibit list below for the location of each of these agreements.
65
Payments Made Upon Retirement
For a description of the pension plans in which the named executive officers participate, see the Pension Benefits table above. The tables below provide the estimated pension benefits that would have become payable if the named executive officer had ceased to be employed as of December 31, 2016. None of our current named executive officers is eligible for early retirement.
Payments Made Upon Death or Disability
For a discussion of the supplemental life insurance benefits for the named executive officers, see the section above entitled “Perquisites” and the All Other Compensation table above. The tables below provide the amounts the beneficiaries of each named executive officer would have received had such officer died on December 31, 2016. The company pays for long-term disability insurance for all salaried employees, and the table below provides the estimated amounts payable to our named executive officers (or their guardians) if they had become eligible for payments under such policy on December 31, 2016.
Potential Termination and Change in Control Benefits
The following table illustrates an estimated amount of compensation potentially payable to each named executive officer upon termination of such executive’s employment under various scenarios. Any amount ultimately received will vary based on a variety of factors, including the reason for such executive’s termination of employment, the date of such executive’s termination of employment, and the executive’s age upon termination of employment. The amounts shown assume that such event occurred as of December 31, 2016, and, therefore are estimates of the amounts that would have been paid to such executives upon such event. Actual amounts to be paid can only be determined at the time of the event triggering the payment obligations. No additional payments are required in the event of a termination for cause in connection with a change in control. Mr. Shepard resigned effective December 31, 2016, and no payments (other than for wages and benefits accrued prior to termination) were made.
66
No Change in Control | Change in Control | |||||||||||||||||||
Disability | Death | Termination Without Cause | No Termination (1) | Termination Without Cause or For Good Reason | ||||||||||||||||
Karen Puckett | ||||||||||||||||||||
Retirement Benefits | $ | — | $ | — | $ | — | $ | — | $ | — | ||||||||||
Disability Benefits | 1,422,875 | — | — | — | — | |||||||||||||||
Salary Continuation (2) | — | 900,000 | — | — | — | |||||||||||||||
Cash Severence (3) | — | — | 1,491,800 | — | 4,475,400 | |||||||||||||||
Health Benefits (3) (4) | — | — | 20,071 | — | 40,044 | |||||||||||||||
Equity Vesting Acceleration (3) (5) | 674,978 | 674,978 | 674,978 | — | 1,876,794 | |||||||||||||||
Estimated Total | $ | 2,097,853 | $ | 1,574,978 | $ | 2,186,849 | $ | — | $ | 6,392,238 | ||||||||||
Shirish Lal | ||||||||||||||||||||
Retirement Benefits | $ | — | $ | — | $ | — | $ | — | $ | — | ||||||||||
Disability Benefits | 2,629,281 | — | — | — | — | |||||||||||||||
Salary Continuation (2) | — | 700,000 | — | — | — | |||||||||||||||
Cash Severence | — | — | 411,700 | — | 1,440,950 | |||||||||||||||
Health Benefits (4) | — | — | 20,071 | — | 40,044 | |||||||||||||||
Equity Vesting Acceleration (5) | 111,263 | 111,263 | 111,263 | — | 245,984 | |||||||||||||||
Estimated Total | $ | 2,740,544 | $ | 811,263 | $ | 543,034 | $ | — | $ | 1,726,978 | ||||||||||
Doug Shepard | ||||||||||||||||||||
Retirement Benefits (6) | $ | 274,921 | $ | 274,921 | $ | 274,921 | $ | 274,921 | $ | 274,921 | ||||||||||
Disability Benefits | 2,744,600 | — | — | — | — | |||||||||||||||
Salary Continuation (2) | — | 700,000 | — | — | — | |||||||||||||||
Cash Severence | — | — | 692,550 | — | 1,962,225 | |||||||||||||||
Health Benefits (4) | — | — | 15,295 | — | 30,354 | |||||||||||||||
Equity Vesting Acceleration (5) | 313,703 | 313,703 | 313,703 | — | 616,524 | |||||||||||||||
Estimated Total | $ | 3,333,224 | $ | 1,288,624 | $ | 1,296,469 | $ | 274,921 | $ | 2,884,024 | ||||||||||
Robert Munden | ||||||||||||||||||||
Retirement Benefits (6) | $ | 122,859 | $ | 122,859 | $ | 122,859 | $ | 122,859 | $ | 122,859 | ||||||||||
Disability Benefits | 2,306,070 | — | — | — | — | |||||||||||||||
Salary Continuation (2) | — | 700,000 | — | — | — | |||||||||||||||
Cash Severence | — | — | 475,050 | — | 1,187,625 | |||||||||||||||
Health Benefits (4) | — | — | 19,815 | — | 38,550 | |||||||||||||||
Equity Vesting Acceleration (5) | 134,307 | 134,307 | 134,307 | — | 307,801 | |||||||||||||||
Estimated Total | $ | 2,563,236 | $ | 957,166 | $ | 752,031 | $ | 122,859 | $ | 1,656,835 | ||||||||||
Andrew Harrison | ||||||||||||||||||||
Retirement Benefits (6) | $ | 290,653 | $ | 290,653 | $ | 290,653 | $ | 290,653 | $ | 290,653 | ||||||||||
Disability Benefits | 2,571,400 | — | — | — | — | |||||||||||||||
Salary Continuation (2) | — | 700,000 | — | — | — | |||||||||||||||
Cash Severence | — | — | 452,551 | — | 1,131,377 | |||||||||||||||
Health Benefits (4) | — | — | 20,070 | — | 39,941 | |||||||||||||||
Equity Vesting Acceleration (5) | 134,307 | 134,307 | 134,307 | — | 307,801 | |||||||||||||||
Estimated Total | $ | 2,996,360 | $ | 1,124,960 | $ | 897,581 | $ | 290,653 | $ | 1,769,772 | ||||||||||
(1) | Assumes equity awards are assumed or replaced with equivalents, as described under the terms of the CIC Agreements or CEO Agreement. |
(2) | Reflects the aggregate amount of 10 annual payments payable to the executive’s estate in the event of such executive’s death while employed. |
(3) | The non-change in control amounts are also payable if Ms. Puckett terminates for “good reason” as defined in her employment agreement. |
(4) | Reflects the estimated payments to (i) partially offset the cost of 18 months (no change in control) or (ii) entirely offset the cost of 24 months of future premiums (change in control) under our health and welfare benefit plans. |
(5) | Values are calculated based on the closing price of our common stock of $1.51 on December 31, 2016. |
(6) | Reflects the estimated single sum present value of Restoration Pension Plan accumulated benefit as of December 31, 2016, which the officer would be entitled to receive upon reaching age 65. Actual payments are made over time, not in a lump sum. None of our named executive officers with this benefit have reached normal retirement age. These amounts would also be payable in the event of termination with or without cause or voluntary resignation, provided that some or all of this amount is subject to clawback if, in the event of a “for cause” termination related to dishonest conduct, the Compensation Committee elects to deny vested retirement benefits under the Restoration Pension Plan. |
67
ITEM 12. SECURITY OWNERSHIP OF CERTAIN BENEFICIAL OWNERS AND MANAGEMENT AND RELATED STOCKHOLDER MATTERS
Equity Compensation Plan Information at Year-End 2016
The following table provides information as of the end of 2016 regarding total shares subject to outstanding stock options and rights and total additional shares available for issuance under our 2013 Plan and 2005 Omnibus Incentive Plan ("2005 Plan"), as well as the inducement awards granted to Ms. Puckett and Messrs. Grillo and Lal in connection with their hiring:
Plan Category | Number of securities to be issued upon exercise of outstanding options, warrants and rights (1) (a) | Weighted-average exercise price of outstanding options, warrants and rights (2) (b) | Number of securities remaining available for future issuance under equity compensation plans (excluding securities reflected in column (a)) (3) (c) | |||
Equity compensation plans approved by security holders | 3,111,358 | $9.39 | 2,477,276 | |||
Equity compensation plans not approved by security holders (4) | 1,438,850 | $3.73 | — | |||
Total | 4,550,208 | $7.72 | 2,477,276 | |||
(1) | Consisting of outstanding options and stock-denominated performance units. |
(2) | The weighted-average exercise price does not take into account any shares issuable upon vesting of outstanding restricted stock or performance restricted stock units, which have no exercise price. |
(3) | Represents shares available under our 2013 Plan; shares available for issuance under our 2013 Plan may be issued pursuant to stock options, restricted stock, performance restricted stock units, common stock and other awards that may be established pursuant to the 2013 Plan. No new options or securities may be granted under the 2005 Plan. |
(4) | Consists of inducement awards made to Ms. Puckett and Messrs. Grillo and Lal in connection with their employment; the terms of these grants are consistent with the 2013 Plan. |
68
Beneficial Ownership
The following table sets forth the number of shares of our common stock beneficially owned by (1) our “named executive officers” included in the Summary Compensation Table above, (2) each current Harte Hanks director and director nominee, (3) each person known by Harte Hanks to beneficially own more than 5% of the outstanding shares of our common stock, and (4) all current Harte Hanks directors and executive officers as a group. Except as otherwise noted, (a) the persons named in the table have sole voting and investment power with respect to all shares beneficially owned by them, and (b) ownership is as of May 1, 2017, when 62,619,537 shares of our common stock outstanding.
Name and Address of Beneficial Owner (1) | Number of Shares of Common Stock | Percent of Class | ||||
Named Executive Officers | ||||||
Karen A. Puckett (2) | 659,857 | 1.1 | % | |||
Andrew P. Harrison (3) | 232,902 | * | ||||
Shirish R. Lal (4) | 109,768 | * | ||||
Robert L. R. Munden (5) | 304,282 | * | ||||
Douglas C. Shepard | — | * | ||||
Directors | ||||||
Stephen E. Carley | 98,878 | * | ||||
David L. Copeland (6) | 4,731,347 | 7.6 | % | |||
William F. Farley (7) | 162,669 | * | ||||
Christopher M. Harte (8) | 1,158,765 | 1.9 | % | |||
Scott C. Key | 115,086 | * | ||||
Judy C. Odom | 129,606 | * | ||||
Karen A. Puckett (2) | 659,857 | 1.1 | % | |||
Other Known 5% Holders | ||||||
Houston H. Harte (9) | 6,608,179 | 10.6 | % | |||
Dimensional Fund Advisors, Inc. (10) | 3,961,916 | 6.3 | % | |||
Eidelman Virant Capital, Inc. (11) | 3,576,600 | 5.7 | % | |||
All Current Executive Officers and Directors as a Group (16 persons) (12) | 7,793,629 | 12.4 | % | |||
* | Less than 1%. | |
(1) | The address of (a) Houston H. Harte is P.O. Box 17424, San Antonio, TX 78217, (b) Dimensional Fund Advisors, Inc. is 6300 Bee Cave Road, Building One, Austin, TX 78746, (c) Eidelman Virant Capital, Inc. is 8000 Maryland Ave, Suite 380, St. Louis, MO 63105, and (d) each other beneficial owner is c/o Harte Hanks, Inc., 9601 McAllister Freeway, Suite 610, San Antonio, TX 78216 | |
(2) | Includes 216,841 shares that may be acquired upon the exercise of options exercisable within the next 60 days. | |
(3) | Includes 137,764 shares that may be acquired upon the exercise of options exercisable within the next 60 days. | |
(4) | Includes 30,092 shares that may be acquired upon the exercise of options exercisable within the next 60 days. | |
(5) | Includes 198,514 shares that may be acquired upon the exercise of options exercisable within the next 60 days. | |
(6) | Includes the following shares to which Mr. Copeland disclaims beneficial ownership: (a) 68,000 shares held as custodian for unrelated minors, (b) 1,241,721 shares that are owned by various trusts for which he serves as trustee or co-trustee, (c) 200,500 shares held by a limited partnership of which he is sole manager of the general partner, and (d) 3,062,465 shares owned by the Shelton Family Foundation, of which he is one of nine directors and an employee. | |
(7) | Includes (i) 124 shares owned indirectly by Mr. Farley via a trust in which his spouse is a beneficiary, as to which beneficial ownership is disclaimed, and (ii) 81,448 shares held in a trust for which Mr. Farley is a beneficiary. | |
(8) | Includes 768,939 shares held by Spicewood Family Partners, Ltd., of which he is the sole member and manager of the limited liability company that is the sole general partner, with exclusive voting and dispositive power over all the partnership’s shares, and the following shares to which he disclaims beneficial ownership: (a) 300 shares held as custodian for Mr. Harte’s step-children and child, (b) 58,850 shares held by trusts for which Mr. Harte serves as trustee, and (c) 120,001 shares held by other trusts for which Mr. Harte serves as a co-trustee. | |
(9) | All such shares are held in a trust for which Mr. Harte and his wife are co-trustees and beneficiaries. | |
69
(10) | Represents shares held by investment advisory clients of Dimensional Fund Advisors LP (“Dimensional”) for whom Dimensional serves as investment manager or sub-adviser to certain other commingled funds, group trusts and separate accounts (such investment companies, trusts and accounts, collectively referred to as the “Funds”). In its role as investment advisor, sub-adviser and/or manager, Dimensional or its subsidiaries possess sole voting power over 3,843,816 such shares and sole investment power over all such shares that are owned by the Funds, and may be deemed to be the beneficial owner of the shares of the Issuer held by the Funds. However, all securities reflected are owned by the Funds. Dimensional disclaims beneficial ownership of such securities. The Funds have the right to receive or the power to direct the receipt of dividends from, or the proceeds from the sale of the securities held in their respective accounts.To the knowledge of Dimensional, the interest of no one such Fund exceeds 5% of the company’s common stock. Information relating to this stockholder is based on the stockholder’s Schedule 13G, filed with the SEC on February 9, 2017. | |
(11) | Represents shares held by investment advisory clients of Eidelman Virant Capital none of which, to its knowledge, owns 5% or more of the company’s common stock. Information relating to this stockholder is based on the stockholder’s Schedule 13G, filed with the SEC on February 13, 2017 | |
(12) | Includes 621,143 shares that may be acquired upon the exercise of options exercisable within the next 60 days. | |
ITEM 13. CERTAIN RELATIONSHIPS AND RELATED TRANSACTIONS, AND DIRECTOR INDEPENDENCE
Independence of Directors
Questionnaires are used on an annual basis (or when a new director is added) to gather input to assist the Governance Committee and the Board in their determinations of the independence of the non-employee directors. Based on the foregoing and on such other due consideration and diligence as it deemed appropriate, the Governance Committee presented its 2016 findings to the Board on the independence of (1) Stephen E. Carley, (2) David L. Copeland, (3) William F. Farley, (4) Christopher M. Harte, (5) Scott C. Key and (6) Judy C. Odom, in each case in accordance with applicable federal securities laws and the rules of the NYSE. The Board determined that, other than in their capacity as directors, none of these non-employee directors had a material relationship with Harte Hanks, either directly or as a partner, stockholder or officer of an organization that has a relationship with Harte Hanks. The Board further determined that (i) each such non-employee director is otherwise independent under applicable NYSE listing standards for purposes of serving on the Board, the Audit Committee, the Compensation Committee and the Governance Committee, (ii) each such non-employee director satisfies the additional audit committee independence standards under Rule 10A-3 of the SEC and (iii) for purposes of serving on the Audit Committee, each such non-employee director is financially literate and, where applicable, certain of such directors are “audit committee financial experts” as such term is defined in the applicable SEC rules.
The Board has made the same determinations for 2017. However, in April of 2017 (and subsequent to its usual 2017 independence determinations), the Board reconsidered Mr. Copeland’s independence due to his service as sole manager of the guarantor of the Texas Capital Credit Facility. After a review, the Board determined such role as constituting a material relationship disqualifying his independence. Mr. Copeland promptly resigned from the Audit Committee and Compensation Committee in connection with the Board’s determination. For more information regarding the new credit facility and the guarantee, please refer to the relevant description in our Current Report on Form 8-K filed with the SEC on April 21, 2017.
When assessing the materiality of a director’s relationship with us, if any, the Board considers all known relevant facts and circumstances, not merely from the director’s standpoint, but from that of the persons or organizations with which the director has an affiliation, the frequency or regularity of the services, whether the services are being carried out at arm’s length in the ordinary course of business and whether the services are being provided substantially on the same terms to us as those prevailing at the time from unrelated parties for comparable transactions. Material relationships can include commercial, banking, industrial, consulting, legal, accounting, charitable and familial relationships.
In making its independence determinations in early 2017, the Board considered the following matters with respect to Mr. Copeland, and determined that they did not constitute material relationships with Harte Hanks or otherwise impair his independence as a director or a member any of its committees, including the Audit Committee:
• | As previously disclosed in our 2016 proxy statement, Mr. Copeland’s son is a member of the transaction services group of KPMG LLP, the independent registered public accounting firm we used in 2015 and prior fiscal years. This issue was previously reviewed and discussed by the Board in connection with assessing the continued independence of Mr. Copeland. This review process included discussing with KPMG the nature of its transaction services group and whether there was any relation to KPMG’s audit or tax compliance groups. As a result of this diligence and discussions with KPMG, it was determined that KPMG’s transaction services group is a separate and distinct group from KPMG’s audit and tax compliance practice groups. Accordingly, based on the nature of the services provided by the transaction services group and the fact that Harte Hanks has not purchased such transaction services from KPMG, this matter was not deemed to constitute a material relationship with Harte Hanks. We selected Deloitte & Touche LLP as our independent registered public accounting firm for 2016 and 2017. |
• | As disclosed in our 2016 proxy statement and further in this Form 10-K, in accordance with SEC rules, Mr. Copeland has reported, but disclaimed, “beneficial ownership” of approximately 7.6% of our outstanding shares of our common |
70
stock that are owned by (1) various trusts for which Mr. Copeland serves as trustee or co-trustee, (2) a limited partnership of which he is an officer of the general partner, and (3) the Shelton Family Foundation, of which he is one of nine directors and an employee. Based on the nature of Mr. Copeland’s role with these entities, his absence of any pecuniary interest in these shares and his disclaimer of any beneficial ownership in these shares, this matter is not deemed to constitute a material relationship with Harte Hanks.
Certain Relationships and Related Transactions
The Board has adopted certain policies and procedures relating to its review, approval or ratification of any transaction in which Harte Hanks is a participant and that is required to be reported by the SEC’s rules and regulations regarding transactions with related persons. As set forth in the Governance Committee’s charter, except for matters delegated by the Board to the Audit Committee, all proposed related transactions and conflicts of interest should be presented to the Governance Committee for its consideration. If required by law, NYSE rules or SEC regulations, such transactions must obtain Governance Committee approval. In reviewing any such transactions and potential transactions, the Governance Committee may take into account a variety of factors that it deems appropriate, which may include, for example, whether the transaction is on terms comparable to those that could be obtained in arm’s length dealings with an unrelated third party, the value and materiality of such transaction, any affiliate transaction restrictions that may be included in our debt agreements, any impact on the Board’s evaluation of a non-employee director’s independence or on such director’s eligibility to serve on one of the Board’s committees and any required public disclosures by Harte Hanks.
ITEM 14. PRINCIPAL ACCOUNTANT FEES AND SERVICES
The following table sets forth the aggregate fees billed by our independent auditors or fees payable for professional services in or related to 2015 and 2016.
2015 | 2016 | |||||||
(KPMG) | (Deloitte) | |||||||
Audit Fees (1) | $ | 970,000 | $ | 2,000,000 | ||||
Audit Related Fees (2) | 141,948 | 17,500 | ||||||
Tax Fees (relating to state, federal and international tax matters) | 62,586 | 171,226 | ||||||
All Other Fees | — | 2,132 | ||||||
Total | $ | 1,174,534 | $ | 2,190,858 | ||||
(1) | Fees for the annual financial statement audit, quarterly financial statement reviews and audit of internal control over financial reporting. |
(2) | Includes fees for assurance and related services other than those included in Audit Fees. Includes charges for statutory audits of certain of the company’s foreign subsidiaries required by countries in which they are domiciled in 2015 and 2016. |
71
PART IV
ITEM 15. | EXHIBITS AND FINANCIAL STATEMENT SCHEDULES | |
15(a)(1) | Financial Statements | |
The financial statements filed as part of this report and referenced in Item 8 are presented in the Consolidated Financial Statements and the notes thereto beginning at page 74 of this Form 10-K (Financial Statements). | ||
15(a)(2) | Financial Statement Schedules | |
All schedules for which provision is made in the applicable rules and regulations of the SEC have been omitted as the schedules are not required under the related instructions, are not applicable, or the information required thereby is set forth in the Consolidated Financial Statements or notes thereto. | ||
15(a)(3) | Exhibits | |
The Exhibit Index following the Notes to Consolidated Financial Statements in this Form 10-K lists the exhibits that are filed or furnished, as applicable, as part of this Form 10-K. | ||
72
SIGNATURES
Pursuant to the requirements of Section 13 or 15(d) of the Securities Exchange Act of 1934, Harte Hanks, Inc. has duly caused this report to be signed on its behalf by the undersigned, thereunto duly authorized.
HARTE HANKS, INC. | |||
By: | /s/ Karen A. Puckett | ||
Karen A. Puckett | |||
President and Chief Executive Officer | |||
Date: | June 16, 2017 | ||
Pursuant to the requirements of the Securities Exchange Act of 1934, this report has been signed below by the following persons on behalf of the registrant and in the capacities and on the dates indicated.
/s/ Karen A. Puckett | /s/ Robert L. R. Munden | |
Karen A. Puckett | Robert L. R. Munden | |
Director, President and Chief Executive Officer | Executive Vice President, Chief Financial Officer, | |
Date: June 16, 2017 | General Counsel and Secretary | |
Date: June 16, 2017 | ||
/s/ Carlos M. Alvarado | /s/ Christopher M. Harte | |
Carlos M. Alvarado | Christopher M. Harte, Chairman | |
Vice President, Finance and Corporate Controller | Date: June 16, 2017 | |
Date: June 16, 2017 | ||
/s/ Stephen E. Carley | /s/ Scott C. Key | |
Stephen E. Carley, Director | Scott C. Key, Director | |
Date: June 16, 2017 | Date: June 16, 2017 | |
/s/ David L. Copeland | /s/ Judy C. Odom | |
David L. Copeland, Director | Judy C. Odom, Director | |
Date: June 16, 2017 | Date: June 16, 2017 | |
/s/ William F. Farley | ||
William F. Farley, Director | ||
Date: June 16, 2017 | ||
73
Harte Hanks, Inc. and Subsidiaries
Index to Consolidated Financial Statements
All schedules for which provision is made in the applicable rules and regulations of the SEC have been omitted as the schedules are not required under the related instructions, are not applicable, or the information required thereby is set forth in the consolidated financial statements or notes thereto.
74
REPORT OF INDEPENDENT REGISTERED PUBLIC ACCOUNTING FIRM
To the Board of Directors and Stockholders of
Harte Hanks, Inc.
San Antonio, Texas
We have audited the accompanying consolidated balance sheet of Harte Hanks, Inc. and subsidiaries (the "Company") as of December 31, 2016, and the related consolidated statements of comprehensive income (loss), changes in equity, and cash flows for the year then ended. These financial statements are the responsibility of the Company's management. Our responsibility is to express an opinion on these financial statements based on our audit.
We conducted our audit in accordance with the standards of the Public Company Accounting Oversight Board (United States). Those standards require that we plan and perform the audit to obtain reasonable assurance about whether the financial statements are free of material misstatement. An audit includes examining, on a test basis, evidence supporting the amounts and disclosures in the financial statements. An audit also includes assessing the accounting principles used and significant estimates made by management, as well as evaluating the overall financial statement presentation. We believe that our audit provides a reasonable basis for our opinion.
In our opinion, such consolidated financial statements present fairly, in all material respects, the financial position of Harte Hanks, Inc. and subsidiaries as of December 31, 2016, and the results of their operations and their cash flows for the year then ended in conformity with accounting principles generally accepted in the United States of America.
We have also audited, in accordance with the standards of the Public Company Accounting Oversight Board (United States), the Company's internal control over financial reporting as of December 31, 2016, based on the criteria established in Internal Control-Integrated Framework (2013) issued by the Committee of Sponsoring Organizations of the Treadway Commission and our report dated June 16, 2017 expressed an adverse opinion on the Company's internal control over financial reporting.
/s/ DELOITTE & TOUCHE LLP
San Antonio, Texas
June 16, 2017
75
REPORT OF INDEPENDENT REGISTERED PUBLIC ACCOUNTING FIRM
The Board of Directors and Stockholders
Harte Hanks, Inc.:
We have audited the accompanying consolidated balance sheet of Harte Hanks, Inc. and subsidiaries as of December 31, 2015, and the related consolidated statements of comprehensive income (loss), changes in equity, and cash flows for each of the years in the two-year period ended December 31, 2015. These consolidated financial statements are the responsibility of the Company’s management. Our responsibility is to express an opinion on these consolidated financial statements based on our audits.
We conducted our audits in accordance with the standards of the Public Company Accounting Oversight Board (United States). Those standards require that we plan and perform the audit to obtain reasonable assurance about whether the financial statements are free of material misstatement. An audit includes examining, on a test basis, evidence supporting the amounts and disclosures in the financial statements. An audit also includes assessing the accounting principles used and significant estimates made by management, as well as evaluating the overall financial statement presentation. We believe that our audits provide a reasonable basis for our opinion.
In our opinion, the consolidated financial statements referred to above present fairly, in all material respects, the financial position of Harte Hanks, Inc. and subsidiaries as of December 31, 2015, and the results of their operations and their cash flows for each of the years in the two-year period ended December 31, 2015, in conformity with U.S. generally accepted accounting principles.
/s/ KPMG LLP
San Antonio, Texas
March 14, 2016 except for the restatement of discontinued operations in the consolidated balance sheet, statements of comprehensive income (loss), statements of cash flows and Notes A, D, E, H, K, and N, as to which the date is June 16, 2017.
76
Harte Hanks, Inc. and Subsidiaries Consolidated Balance Sheets
December 31, | ||||||||
In thousands, except per share and share amounts | 2016 | 2015 | ||||||
ASSETS | ||||||||
Current assets | ||||||||
Cash and cash equivalents | $ | 46,005 | $ | 16,564 | ||||
Accounts receivable (less allowance for doubtful accounts of $1,028 at December 31, 2016 and $974 at December 31, 2015) | 88,813 | 103,758 | ||||||
Inventory | 838 | 963 | ||||||
Prepaid expenses | 5,944 | 7,908 | ||||||
Prepaid income tax | 2,895 | 1,760 | ||||||
Other current assets | 4,934 | 6,664 | ||||||
Current assets of discontinued operations | — | 169,401 | ||||||
Total current assets | 149,429 | 307,018 | ||||||
Property, plant and equipment | ||||||||
Buildings and improvements | 18,673 | 16,631 | ||||||
Software | 53,672 | 55,901 | ||||||
Equipment and furniture | 92,367 | 99,726 | ||||||
Software development and equipment installations in progress | 600 | 1,015 | ||||||
Gross property, plant and equipment | 165,312 | 173,273 | ||||||
Less accumulated depreciation and amortization | (141,388 | ) | (145,137 | ) | ||||
Net property, plant and equipment | 23,924 | 28,136 | ||||||
Goodwill | 34,510 | 69,699 | ||||||
Other intangible assets (less accumulated amortization of $1,471 at December 31, 2016 and $650 at December 31, 2015) | 3,302 | 4,123 | ||||||
Deferred tax assets, net | — | 3,000 | ||||||
Other assets | 2,272 | 2,437 | ||||||
Total assets | $ | 213,437 | $ | 414,413 | ||||
LIABILITIES AND STOCKHOLDERS’ EQUITY | ||||||||
Current liabilities | ||||||||
Current maturities of long-term debt | $ | — | $ | 3,000 | ||||
Accounts payable | 45,563 | 36,617 | ||||||
Accrued payroll and related expenses | 9,990 | 7,416 | ||||||
Deferred revenue and customer advances | 6,505 | 6,240 | ||||||
Income taxes payable | 30,436 | 1,246 | ||||||
Customer postage and program deposits | 7,985 | 12,513 | ||||||
Other current liabilities | 4,188 | 6,342 | ||||||
Current liabilities of discontinued operations | — | 24,758 | ||||||
Total current liabilities | 104,667 | 98,132 | ||||||
Long-term debt | — | 74,105 | ||||||
Pensions | 60,836 | 55,491 | ||||||
Contingent consideration | 29,725 | 20,277 | ||||||
Deferred tax liability, net | 11,044 | 20,672 | ||||||
Other long-term liabilities | 4,509 | 5,420 | ||||||
Total liabilities | 210,781 | 274,097 | ||||||
Stockholders’ equity | ||||||||
Common stock, $1 par value, 250,000,000 shares authorized 120,436,735 shares issued at December 31, 2016 and 120,146,720 shares issued at December 31, 2015 | 120,437 | 120,147 | ||||||
Additional paid-in capital | 350,245 | 353,050 | ||||||
Retained earnings | 837,316 | 973,538 | ||||||
Less treasury stock, 58,791,630 shares at cost at December 31, 2016 and 58,879,742 shares at cost at December 31, 2015 | (1,259,164 | ) | (1,262,859 | ) | ||||
Accumulated other comprehensive loss | (46,178 | ) | (43,560 | ) | ||||
Total stockholders’ equity | 2,656 | 140,316 | ||||||
Total liabilities and stockholders’ equity | $ | 213,437 | $ | 414,413 | ||||
See Accompanying Notes to Consolidated Financial Statements.
77
Harte Hanks, Inc. and Subsidiaries Consolidated Statements of Comprehensive Income (Loss)
Year Ended December 31, | ||||||||||||
In thousands, except per share amounts | 2016 | 2015 | 2014 | |||||||||
Operating revenues | $ | 404,412 | $ | 444,166 | $ | 499,444 | ||||||
Operating expenses | ||||||||||||
Labor | 247,241 | 238,620 | 253,205 | |||||||||
Production and distribution | 117,126 | 141,920 | 165,307 | |||||||||
Advertising, selling, general and administrative | 44,804 | 44,579 | 42,758 | |||||||||
Impairment of goodwill | 38,669 | 209,938 | — | |||||||||
Depreciation, software and intangible asset amortization | 12,352 | 12,378 | 12,889 | |||||||||
Total operating expenses | 460,192 | 647,435 | 474,159 | |||||||||
Operating income (loss) | (55,780 | ) | (203,269 | ) | 25,285 | |||||||
Other expenses | ||||||||||||
Interest expense, net | 3,454 | 5,016 | 2,805 | |||||||||
Loss on sale | — | 9,501 | — | |||||||||
Other, net | 9,914 | 640 | 1,100 | |||||||||
Total other expenses | 13,368 | 15,157 | 3,905 | |||||||||
Income (loss) from continuing operations before income taxes | (69,148 | ) | (218,426 | ) | 21,380 | |||||||
Income tax expense (benefit) | 20,630 | (37,360 | ) | 7,626 | ||||||||
Income (loss) from continuing operations | $ | (89,778 | ) | $ | (181,066 | ) | $ | 13,754 | ||||
Income (loss) from discontinued operations, net of income taxes (including loss on disposal of $44,529 at December 31, 2016) | $ | (41,159 | ) | $ | 10,138 | $ | 10,237 | |||||
Net income (loss) | $ | (130,937 | ) | $ | (170,928 | ) | $ | 23,991 | ||||
Basic earnings (loss) per common share | ||||||||||||
Continuing operations | $ | (1.46 | ) | $ | (2.94 | ) | $ | 0.22 | ||||
Discontinued operations | (0.67 | ) | 0.17 | 0.16 | ||||||||
Basic earnings (loss) per common share | (2.13 | ) | $ | (2.77 | ) | $ | 0.38 | |||||
Weighted-average common shares outstanding | 61,487 | 61,643 | 62,444 | |||||||||
Diluted earnings (loss) per common share | ||||||||||||
Continuing operations | $ | (1.46 | ) | $ | (2.94 | ) | $ | 0.22 | ||||
Discontinued operations | (0.67 | ) | 0.17 | 0.16 | ||||||||
Diluted earnings (loss) per common share | $ | (2.13 | ) | $ | (2.77 | ) | $ | 0.38 | ||||
Weighted-average common and common equivalent shares outstanding | 61,487 | 61,643 | 62,658 | |||||||||
Net income (loss) | $ | (130,937 | ) | $ | (170,928 | ) | $ | 23,991 | ||||
Declared dividends per share | $ | 0.09 | $ | 0.34 | $ | 0.34 | ||||||
Other comprehensive income (loss), net of tax | ||||||||||||
Adjustment to pension liability | $ | (3,062 | ) | $ | 5,645 | $ | (17,281 | ) | ||||
Foreign currency translation adjustments | 444 | (1,976 | ) | (1,830 | ) | |||||||
Total other comprehensive income (loss), net of tax | (2,618 | ) | 3,669 | (19,111 | ) | |||||||
Comprehensive income (loss) | $ | (133,555 | ) | $ | (167,259 | ) | $ | 4,880 | ||||
See Accompanying Notes to Consolidated Financial Statements.
78
Harte Hanks, Inc. and Subsidiaries Consolidated Statements of Cash Flows
Year Ended December 31, | ||||||||||||
In thousands | 2016 | 2015 | 2014 | |||||||||
Cash Flows from Operating Activities | ||||||||||||
Net income (loss) | $ | (130,937 | ) | $ | (170,928 | ) | $ | 23,991 | ||||
Adjustments to reconcile net income (loss) to net cash provided by operating activities | ||||||||||||
(Income) loss from discontinued operations, net of tax | 41,159 | (10,138 | ) | (10,237 | ) | |||||||
Loss on sale | — | 9,501 | — | |||||||||
Impairment of goodwill | 38,669 | 209,938 | — | |||||||||
Depreciation and software amortization | 11,531 | 11,719 | 12,863 | |||||||||
Intangible asset amortization | 821 | 659 | 26 | |||||||||
Stock-based compensation | 2,673 | 5,442 | 3,978 | |||||||||
Excess tax benefits from stock-based compensation | — | (14 | ) | — | ||||||||
Net pension cost (payments) | 385 | (257 | ) | (2,860 | ) | |||||||
Interest accretion on contingent consideration | 2,430 | 2,337 | — | |||||||||
Adjustments to fair value of contingent consideration | 7,018 | — | — | |||||||||
Discount amortization | 208 | 356 | 357 | |||||||||
Deferred income taxes | 26,290 | (41,569 | ) | 5,794 | ||||||||
Other, net | (246 | ) | 333 | — | ||||||||
Changes in operating assets and liabilities, net of acquisitions: | ||||||||||||
Decrease (increase) in accounts receivable | 14,945 | 7,238 | (8,539 | ) | ||||||||
Decrease in inventory | 125 | 272 | 51 | |||||||||
Decrease in prepaid expenses and other current assets | 2,723 | 954 | 4,861 | |||||||||
Increase (decrease) in accounts payable | 9,126 | 1,888 | (739 | ) | ||||||||
(Decrease) increase in other accrued expenses and liabilities | 23,045 | (10,390 | ) | (16,299 | ) | |||||||
Other, net | — | — | 98 | |||||||||
Net cash provided by continuing operations | 49,965 | 17,341 | 13,345 | |||||||||
Net cash provided by (used in) discontinued operations | (35,375 | ) | 15,945 | 12,672 | ||||||||
Net cash provided by operating activities | 14,590 | 33,286 | 26,017 | |||||||||
Cash Flows from Investing Activities | ||||||||||||
Acquisitions, net of cash acquired | (3,500 | ) | (29,862 | ) | — | |||||||
Dispositions, net of cash transferred | — | 4,974 | — | |||||||||
Purchases of property, plant and equipment | (6,691 | ) | (7,907 | ) | (9,118 | ) | ||||||
Proceeds from the sale of property, plant and equipment | 755 | (76 | ) | 45 | ||||||||
Net cash used in investing activities within continuing operations | (9,436 | ) | (32,871 | ) | (9,073 | ) | ||||||
Net cash provided by (used in) investing activities within discontinued operations | 109,139 | (3,269 | ) | (2,084 | ) | |||||||
Net cash provided by (used in) investing activities | 99,703 | (36,140 | ) | (11,157 | ) | |||||||
Cash Flows from Financing Activities | ||||||||||||
Borrowings | 276,302 | 13,000 | — | |||||||||
Repayment of borrowings | (353,614 | ) | (18,375 | ) | (15,313 | ) | ||||||
Debt financing costs | (2,484 | ) | — | — | ||||||||
Issuance of common stock | (233 | ) | (909 | ) | (481 | ) | ||||||
Payment of capital leases | (168 | ) | — | — | ||||||||
Excess tax benefits from stock-based compensation | — | 14 | — | |||||||||
Purchase of treasury stock | — | (4,619 | ) | (7,354 | ) | |||||||
Issuance of treasury stock | 186 | 193 | — | |||||||||
Dividends paid | (5,285 | ) | (21,241 | ) | (21,485 | ) | ||||||
Net cash used in financing activities | (85,296 | ) | (31,937 | ) | (44,633 | ) | ||||||
Effect of exchange rate changes on cash and cash equivalents | 444 | (1,976 | ) | (1,830 | ) | |||||||
Net increase (decrease) in cash and cash equivalents | 29,441 | (36,767 | ) | (31,603 | ) | |||||||
Cash and cash equivalents at beginning of year | 16,564 | 53,331 | 84,934 | |||||||||
Cash and cash equivalents at end of year | $ | 46,005 | $ | 16,564 | $ | 53,331 | ||||||
See Accompanying Notes to Consolidated Financial Statements
79
Harte Hanks, Inc. and Subsidiaries Consolidated Statements of Changes in Equity
In thousands, except per share amounts | Common Stock | Additional Paid-in Capital | Retained Earnings | Treasury Stock | Accumulated Other Comprehensive Income(loss) | Total Stockholders’ Equity | ||||||||||||||||||
Balance at December 31, 2013 | $ | 119,187 | $ | 345,095 | $ | 1,163,201 | $ | (1,250,311 | ) | $ | (28,118 | ) | $ | 349,054 | ||||||||||
Exercise of stock options and release of unvested shares | 420 | (151 | ) | — | (750 | ) | — | (481 | ) | |||||||||||||||
Net tax effect of stock options exercised and release of unvested shares | — | (1,993 | ) | — | — | — | (1,993 | ) | ||||||||||||||||
Stock-based compensation | — | 4,055 | — | — | — | 4,055 | ||||||||||||||||||
Dividends paid ($0.34 per share) | — | — | (21,485 | ) | — | — | (21,485 | ) | ||||||||||||||||
Treasury stock issued | — | (767 | ) | — | 1,307 | — | 540 | |||||||||||||||||
Purchase of treasury stock | — | — | — | (7,894 | ) | — | (7,894 | ) | ||||||||||||||||
Net income | — | — | 23,991 | — | — | 23,991 | ||||||||||||||||||
Other comprehensive loss | — | — | — | — | (19,111 | ) | (19,111 | ) | ||||||||||||||||
Balance at December 31, 2014 | $ | 119,607 | $ | 346,239 | $ | 1,165,707 | $ | (1,257,648 | ) | $ | (47,229 | ) | $ | 326,676 | ||||||||||
Exercise of stock options and release of unvested shares | 540 | (329 | ) | — | (1,120 | ) | — | (909 | ) | |||||||||||||||
Net tax effect of stock options exercised and release of unvested shares | — | 1,742 | — | — | — | 1,742 | ||||||||||||||||||
Stock-based compensation | — | 5,733 | — | — | — | 5,733 | ||||||||||||||||||
Dividends paid ($0.34 per share) | — | — | (21,241 | ) | — | — | (21,241 | ) | ||||||||||||||||
Treasury stock issued | — | (335 | ) | — | 528 | — | 193 | |||||||||||||||||
Purchase of treasury stock | — | — | — | (4,619 | ) | — | (4,619 | ) | ||||||||||||||||
Net loss | — | — | (170,928 | ) | — | — | (170,928 | ) | ||||||||||||||||
Other comprehensive income | — | — | — | — | 3,669 | 3,669 | ||||||||||||||||||
Balance at December 31, 2015 | $ | 120,147 | $ | 353,050 | $ | 973,538 | $ | (1,262,859 | ) | $ | (43,560 | ) | $ | 140,316 | ||||||||||
Exercise of stock options and release of unvested shares | 290 | (290 | ) | — | (233 | ) | — | (233 | ) | |||||||||||||||
Net tax effect of stock options exercised and release of unvested shares | — | (1,259 | ) | — | — | — | (1,259 | ) | ||||||||||||||||
Stock-based compensation | — | 2,486 | — | — | — | 2,486 | ||||||||||||||||||
Dividends paid ($0.09 per share) | — | — | (5,285 | ) | — | — | (5,285 | ) | ||||||||||||||||
Treasury stock issued | — | (3,742 | ) | — | 3,928 | — | 186 | |||||||||||||||||
Purchase of treasury stock | — | — | — | — | — | — | ||||||||||||||||||
Net loss | — | — | (130,937 | ) | — | — | (130,937 | ) | ||||||||||||||||
Other comprehensive loss | — | — | — | — | (2,618 | ) | (2,618 | ) | ||||||||||||||||
Balance at December 31, 2016 | $ | 120,437 | $ | 350,245 | $ | 837,316 | $ | (1,259,164 | ) | $ | (46,178 | ) | $ | 2,656 | ||||||||||
See Accompanying Notes to Consolidated Financial Statements.
80
Harte Hanks, Inc. and Subsidiaries Notes to Consolidated Financial Statements
Note A — Significant Accounting Policies
The consolidated financial statements and accompanying notes are prepared in accordance with United States Generally Accepted Accounting Principles ("U.S. GAAP").
Consolidation
The accompanying consolidated financial statements present the financial position and the results of operations and cash flows of Harte Hanks, Inc., and its subsidiaries. All intercompany accounts and transactions have been eliminated in consolidation.
As used in this report, the terms “Harte Hanks,” “we,” “us,” or “our” may refer to Harte Hanks, Inc., one or more of our consolidated subsidiaries, or all of them taken as a whole.
Discontinued Operations
As discussed in Note N, Discontinued Operations, we sold the assets of our Trillium reporting unit as of December 23, 2016. As such, the results of operations, financial position, and cash flows for Trillium are reported separately as discontinued operations for all periods presented in the Consolidated Financial Statements. Results of the remaining Harte Hanks business are reported as continuing operations.
Debt under the 2016 Secured Credit Facility, as defined within Note C, Long-Term Debt, was required to be repaid as a result of the Trillium transaction. In accordance with the provisions of ASC 205-20-45-6, Allocation of Interest to Discontinued Operations, we have reclassified interest expense for the 2016 Secured Credit Facility to discontinued operations for December 31, 2016 in the Consolidated Financial Statements.
Reclassification of Prior Year Amounts
Certain prior year amounts have been reclassified to conform to the current year presentation. This includes amounts related to discontinued operations, which have been reclassified for comparative purposes in all periods presented. In addition, the retrospective adoption of ASU 2015-03, Interest—Imputation of Interest (Subtopic 835-30): Simplifying the Presentation of Debt Issuance Costs, resulted in the reclassification of $0.2 million of unamortized debt issuance costs from other assets to a direct reduction of the total debt on the company's consolidated balance sheet as of December 31, 2015.
Use of Estimates
The preparation of consolidated financial statements requires management to make estimates and assumptions that affect the reported amounts of assets, liabilities, revenue, and expenses. Actual results and outcomes could differ from those estimates and assumptions. Such estimates include, but are not limited to, estimates related to pension accounting; fair value for purposes of assessing goodwill, long-lived assets, and intangible assets for impairment; income taxes; and contingencies. On an ongoing basis, management reviews its estimates based on currently available information. Changes in facts and circumstances could result in revised estimates and assumptions.
Operating Expense Presentation in Consolidated Statements of Comprehensive Income (Loss)
The “Labor” line in the Consolidated Statements of Comprehensive Income (Loss) includes all employee payroll and benefits, including stock-based compensation, along with temporary labor costs. The “Production and distribution” and “Advertising, selling, general and administrative” lines do not include labor, depreciation, or amortization.
Revenue Recognition
We recognize revenue when all of the following criteria are satisfied: (i) persuasive evidence of an arrangement exists; (ii) the price is fixed or determinable; (iii) collectability is reasonably assured; and (iv) the service has been performed or the product has been delivered. In order to recognize revenue, we require either a purchase order, a statement of work signed by the client, a written contract, or some other form of written authorization from the client. Revenue that is not recognized at the time of sale because the foregoing conditions are not met are recognized when those conditions are subsequently met. Revenue is recognized net of any taxes collected from customers and subsequently remitted to governmental authorities. Any payments received in advance of the performance of services or delivery of the product are recorded as deferred revenue until such time as the services are performed or the product is delivered.
81
Revenue from agency and digital services, direct mail, and contact center is recognized as the work is performed. Fees for these services are determined by the terms set forth in the contact with the client. These are typically set at a fixed price or rate by transaction occurrence, service provided, time spent, or product delivered.
For arrangements requiring design and build of a database, revenue is not recognized until client acceptance occurs. Up-front fees billed during the setup phase for these arrangements are deferred and direct build costs are capitalized. Pricing for these types of arrangements are typically based on a fixed price determined in the contract. Revenue from other database marketing solutions is recognized ratably over the contractual service period. Pricing for these services are typically based on a fixed price per month or per contract.
Going Concern
Our recent operating and financial performance (most notably decreased cash flows from operations) have caused us to closely review our ability to continue as a going concern. We have had greater than five consecutive years of declining revenues from continuing operations, and we have not reduced costs at a pace that has allowed us to be profitable in the past two years. Among other things, these trends have caused us to reduce investments in our business, cease dividends and stock repurchases, and caused us to fall out of compliance with financial covenants in our credit facilities. These trends are also significant factors in the goodwill impairment charges we recorded in 2015 and 2016, as well as the valuation allowance we recorded for 2016 in regard to certain deferred tax assets. Changing these trends and returning to revenue growth is essential to our success.
In April of 2017, we entered into a new credit agreement with Texas Capital Bank, N.A. (the "Texas Capital Credit Facility"). Upon closing, the Texas Capital Credit Facility provided $20 million in borrowing capacity under a revolving credit line. The Texas Capital Credit Facility has far more favorable and flexible covenant requirements than the 2016 Secured Credit Facility, and was planned to be sufficient in size for our needs given the nature and performance of our operations. See Note P, Subsequent Events, for additional discussion.
We have also obtained the deferral of a significant contingent liability that otherwise would have been due in 2018. We are required (under the terms of the purchase agreement for the acquisition of 3Q Digital) to pay the former owners of 3Q Digital an additional sum contingent on achievement of certain revenue growth goals for that business. The maximum amount of future payments that could be required to be paid under the contingent consideration is $35 million. On May 1, 2017, the company entered into an Agreement (the "3Q Agreement") with 3Q Digital, which defers our obligation to pay the contingent consideration to the former owners until April 1, 2019 or the sale of the 3Q Digital business, whichever is earlier. See Note P, Subsequent Events, for additional discussion.
We believe that, in conjunction with our current liquidity position and management's execution of the new credit facility and the 3Q Agreement, there are no conditions or events, considered in the aggregate, that raise substantial doubt about our ability to continue as a going concern for the 12 months following the issuance of the financial statements.
We have taken actions to return the business to profitability and improve our cash, liquidity, and financial position. In 2016, we began implementing expense reduction actions, including workforce reductions. These workforce actions are expected to continue into 2017 and will result in further expense reductions in our support functions. We also initiated the closing of our Baltimore direct mail facility in response to the declining demand for printed marketing materials. Continuing work from this facility is being transitioned to other facilities, allowing for higher utilization rates. The favorable impact of the facility closure is expected to begin in the first half of 2017, when the closure is completed.
In addition to the actions discussed above, we are taking additional steps to improve our operational and financial performance. We continue to identify and act to secure additional cost reductions and operating efficiencies. We have also focused investments toward improving product offerings that we believe will improve revenue growth. Finally, to increase financial flexibility and allow us to focus on our core business, we have taken steps to sell our 3Q Digital business (as announced in April 2017). The liquidity from the potential sale of 3Q Digital will allow us the liquidity to invest in strategies to strengthen our core offerings.
Cash Equivalents
All highly liquid investments with an original maturity of 90 days or less at the time of purchase are considered to be cash equivalents. Cash equivalents are carried at cost, which approximates fair value.
82
Allowance for Doubtful Accounts
We maintain our allowance for doubtful accounts adequate to reduce accounts receivable to the amount of cash expected to be collected. The methodology used to determine the minimum allowance is based on our prior collection experience and is generally related to the accounts receivable balance in various aging categories. The balance is also influenced by specific clients’ financial strength and circumstance. Accounts that are determined to be uncollectible are written off in the period in which they are determined to be uncollectible. Periodic changes to the allowance balance are recorded as increases or decreases to bad debt expense, which is included in the “Advertising, selling, general, and administrative” line of our Consolidated Statements of Comprehensive Income (Loss). The changes in the allowance for doubtful accounts consisted of the following:
Year Ended December 31, | ||||||||||||
In thousands | 2016 | 2015 | 2014 | |||||||||
Balance at beginning of year | $ | 974 | $ | 878 | $ | 1,410 | ||||||
Net charges to expense | 711 | 685 | (109 | ) | ||||||||
Amounts recovered against the allowance | (657 | ) | (589 | ) | (423 | ) | ||||||
Balance at end of year | $ | 1,028 | $ | 974 | $ | 878 | ||||||
Inventory
Inventory, consisting primarily of print materials and operating supplies, is stated at the lower of cost (first-in, first-out method) or market.
Property, Plant and Equipment
Property, plant and equipment are stated on the basis of cost. Depreciation is computed using the straight-line method over the estimated useful lives of the assets. The general ranges of estimated useful lives are:
Buildings and improvements | 10 | to | 40 years |
Software | 3 | to | 10 years |
Equipment and furniture | 3 | to | 20 years |
Long-lived assets such as property, plant and equipment are reviewed for impairment whenever events or changes in circumstances indicate that the carrying amount of an asset may not be recoverable. The carrying amount of a long-lived asset group is not recoverable if it exceeds the sum of the undiscounted cash flows expected to result from the use and eventual disposition of the asset group. We did not record an impairment of long-lived assets in 2016, 2015, or 2014.
Property, plant and equipment includes capital lease assets. Capital lease assets at December 31, 2016 and 2015 consisted of:
December 31, | ||||||||
In thousands | 2016 | 2015 | ||||||
Equipment and furniture | $ | 2,357 | $ | 1,088 | ||||
Less accumulated depreciation | (903 | ) | (767 | ) | ||||
Net book value | $ | 1,454 | $ | 321 | ||||
Depreciation expense related to capital lease assets was $0.1 million, $0.1 million, and $0.2 million for the years ended December 31, 2016, 2015, and 2014, respectively. Capital leases accounted for $1.3 million of the additions to property, plant and equipment for the year ended December 31, 2016.
Depreciation and amortization on property, plant and equipment was $11.4 million, $11.6 million, and $12.7 million for the years ended December 31, 2016, 2015, and 2014, respectively.
Accounts payable related to additions of property, plant and equipment were $0.3 million, $0.3 million, and $0.5 million for the years ended December 31, 2016, 2015, and 2014, respectively.
83
Goodwill and Other Intangible Assets
Goodwill is recorded to the extent that the purchase price of an acquisition exceeds the fair value of the identifiable net assets acquired and is tested for impairment on an annual basis. We have established November 30 as the date for our annual test for impairment of goodwill. Interim testing is performed more frequently if events or circumstances indicate that it is “more likely than not” that goodwill might be impaired. Such events could include changes in the business climate in which we operate, attrition of key personnel, the current volatility in the capital markets, the company’s market capitalization compared to our book value, our recent operating performance, and financial projections.
Goodwill is tested for impairment by first assessing qualitative factors to determine whether the existence of events or circumstances leads to a determination that is more likely than not that the fair value of the reporting unit is less than its carrying amount. If after assessing the totality of events or circumstances, or based on management's judgment, we determine it is more likely than not that the fair value is less than its carrying amount, a two-step impairment test is performed. The first step compares the fair value of the reporting unit, using the discounted cash flow method, to its carrying amount. If the fair value is less than its carrying amount, a second step is performed. In the second step, the carrying value of the reporting unit is compared to all of the assets and liabilities of the reporting unit. If the carrying amount of the reporting unit's goodwill exceeds the implied fair value of its goodwill, and impairment loss is recognized in an amount equal to the excess.
Our acquired intangible assets are amortized on a straight-line basis over their estimated useful lives, which generally range from 2 to 10 years. Our acquired intangible assets do not have indefinite lives. Intangible assets are reviewed for impairment whenever events or changes in circumstances indicate the carrying amount of the intangible asset may not be recoverable. The carrying amount of an intangible asset is not recoverable if it exceeds the sum of the undiscounted cash flows expected to result from the use and eventual disposition of the asset. If it is determined that an impairment loss has occurred, the loss is measured as the amount by which the carrying amount of the intangible asset exceeds its fair value.
Income Taxes
Income tax expense includes U.S. and international income taxes accounted for under the asset and liability method. Certain income and expenses are not reported in tax returns and financial statements in the same year. Such temporary differences are reported as deferred tax. Deferred tax assets are reported net of valuation allowances where we have assessed that it is more likely than not that a tax benefit will not be realized.
Earnings Per Share
Basic earnings per common share are based upon the weighted-average number of common shares outstanding during the period. Diluted earnings per common share are based upon the weighted-average number of common shares and dilutive common stock equivalents outstanding during the period. Dilutive common stock equivalents are calculated based on the assumed exercise of stock options and vesting of unvested shares using the treasury stock method.
Stock-Based Compensation
All share-based awards are recognized as operating expense in the “Labor” line of the Consolidated Statements of Comprehensive Income (Loss). Calculated expense is based on the fair values of the awards on the date of grant and is recognized over the requisite service period.
Reserve for Healthcare, Workers’ Compensation, Automobile, and General Liability
We are self-insured for our workers’ compensation, automobile, general liability, and the majority of our healthcare insurance. The company pays actual medical claims up to a stop loss limit of $0.3 million. In the fourth quarter of 2016, the company moved to a guaranteed cost program for our workers' compensation and automobile programs. Prior to the change, our deductible for workers’ compensation was $0.5 million. Our deductible for general liability is $0.3 million.
The reserve is estimated using current claims activity, historical experience, and claims incurred but not reported. We use loss development factors that consider both industry norms and company specific information. Our liability is recorded at the estimate of the ultimate cost of claims at the balance sheet date. At December 31, 2016 and 2015, our reserve for healthcare, workers’ compensation, net, automobile, and general liability was $4.6 million and $6.1 million, respectively. Periodic changes to the reserve for workers’ compensation, automobile and general liability are recorded as increases or decreases to insurance expense, which is included in the “Advertising, selling, general and administrative” line of our Consolidated Statements of Comprehensive Income (Loss). Periodic changes to the reserve for healthcare are recorded as increases or decreases to
84
employee benefits expense, which is included in the “Labor” line of our Consolidated Statements of Comprehensive Income (Loss).
Foreign Currencies
In most instances the functional currencies of our foreign operations are the local currencies. Assets and liabilities recorded in foreign currencies are translated in U.S. dollars at the exchange rate on the balance sheet date. Revenue and expenses are translated at average rates of exchange prevailing during a given month. Adjustments resulting from this translation are charged or credited to other comprehensive loss.
Geographic Concentrations
Depending on the needs of our clients, our services are provided in an integrated approach through more than 28 facilities worldwide, of which 4 are located outside of the U.S.
Information about the operations in different geographic areas:
Year Ended December 31, | ||||||||||||
In thousands | 2016 | 2015 | 2014 | |||||||||
Revenue (1) | ||||||||||||
United States | $ | 324,625 | $ | 377,717 | $ | 427,535 | ||||||
Other countries | 79,787 | 66,449 | 71,909 | |||||||||
Total revenue | $ | 404,412 | $ | 444,166 | $ | 499,444 | ||||||
December 31, | ||||||||
In thousands | 2016 | 2015 | ||||||
Property, plant and equipment (2) | ||||||||
United States | $ | 19,810 | $ | 24,695 | ||||
Other countries | 4,114 | 3,441 | ||||||
Total property, plant and equipment | $ | 23,924 | $ | 28,136 | ||||
(1) | Geographic revenues are based on the location of the service being performed. |
(2) | Property, plant and equipment are based on physical location. |
Recent Accounting Pronouncements
In May 2017, the FASB issued ASU 2017-09, Compensation—Stock Compensation (Topic 718): Scope of Modification Accounting, which provides clarified guidance on applying modification accounting to changes in the terms or conditions of a share-base payment award. This ASU is effective for annual periods, and interim periods within those annual periods, beginning after December 15, 2017.This change is required to be applied prospectively to an award modified on or after the adoption date. Early adoption is permitted. We are evaluating the effect that this will have on our consolidated financial statements and related disclosures.
In March 2017, the FASB issued ASU 2017-07, Compensation—Retirement Benefits (Topic 715): Improving the Presentation of Net Periodic Pension Cost and Net Periodic Postretirement Benefit Cost, which requires entities to present the service cost component of net benefit cost with the other current compensation costs. All other components of net benefit cost are to be reported outside of operating income. This ASU is effective for annual periods beginning after December 15, 2017. This change is required to be applied using a retrospective transition method for each period presented. Early adoption is permitted as of the beginning of the annual period. We intend to adopt this ASU on January 1, 2017. The new standard will require all components of our net periodic benefit cost currently reported within operating expense, as we no longer have service cost, to be reclassified and reported within other expense. See Note F, Employee Benefit Plans, for our current components of net periodic benefit cost.
In January 2017, the FASB issued ASU 2017-04. Intangibles—Goodwill and Other (Topic 350): Simplifying the Test for Goodwill Impairment, which eliminates step two from the goodwill impairment test. Under the amendments in ASU 2017-04, an entity should recognize an impairment charge for the amount by which the carrying amount of a reporting unit exceeds its fair value; however, the loss recognized should not exceed the total amount of goodwill allocated to that reporting unit. This ASU is effective for annual periods beginning after December 15, 2020. Early adoption is permitted for interim or annual goodwill impairment
85
tests performed on testing dates after January 1, 2017. This change is required to be applied on a prospective basis. We are evaluating the effect that this will have on our consolidated financial statements and related disclosures.
In August 2016, the FASB issued ASU 2016-15, Statement of Cash Flows (Topic 230): Classification of Certain Cash Receipts and Cash Payments, which provides clarified guidance on the classification of certain cash receipts and payments in the statement of cash flows. This ASU is effective for annual periods beginning after December 15, 2018 and for interim periods for fiscal years beginning after December 15, 2019. This change is required to be applied using a retrospective transition method to each period presented. Early adoption is permitted. We are evaluating the effect that this will have on our consolidated financial statements and related disclosures.
In March 2016, the FASB issued ASU 2016-09, Compensation—Stock Compensation (Topic 718): Improvements to Employee Share-based Payment Accounting, which requires entities with share-based payment awards to recognize all related excess tax benefits and tax deficiencies as income tax expenses or benefit in the income statement. This ASU is effective for interim and annual periods beginning after December 15, 2016. Amendments related to the timing of when excess tax benefits are recognized, minimum statutory withholding requirements, forfeitures, and intrinsic value should be applied using a modified retrospective transition method by means of a cumulative-effect adjustment to equity as of the beginning of the period in which the guidance is adopted. Amendments related to the presentation of employee taxes paid on the statement of cash flows when an employer withholds shares to meet the minimum statutory withholding requirement should be applied retrospectively. Amendments requiring recognition of excess tax benefits and tax deficiencies in the income statement and the practical expedient for estimating expected term should be applied prospectively. An entity may elect to apply the amendments related to the presentation of excess tax benefits on the statement of cash flows using either a prospective transition method or a retrospective transition method. Early adoption is permitted. We are evaluating the effect that this will have on our consolidated financial statements and related disclosures.
In February 2016, the FASB issued ASU 2016-02, Leases, which requires all operating leases to be recorded on the balance sheet. The lessee will record a liability for its lease obligations (initially measured at the present value of the future lease payments not yet paid over the lease term, and an asset for its right to use the underlying asset equal to the lease liability, adjusted for lease payments made at or before lease commencement). This ASU is effective for interim and annual periods beginning after December 15, 2018. This change is required to be applied using a modified retrospective approach for leases that exist or are entered into after the beginning of the earliest comparative period in the financial statements. Full retrospective application is prohibited. Early adoption is permitted. We are evaluating the effect that this will have on our consolidated financial statements and related disclosures.
In May 2015, the FASB issued ASU 2015-07, Disclosures for Investments in Certain Entities That Calculate Net Asset Value per Share (or Its Equivalent), which removes the requirement to categorize investments for which fair value is measured using the net asset value per share practical expedient within the fair value hierarchy. This ASU is effective for fiscal years beginning after December 15, 2015, and interim periods within those fiscal years. This change is required to be applied retrospectively to all periods presented. The adoption of this ASU resulted in removing the disclosure of the fair value of certain assets in the fair value hierarchy table within Note F, Employee Benefit Plans. There was no change in total pension plan assets, financial condition, results of operations, or cash flows as a result of the adoption of ASU 2015-07.
In April 2015, the FASB issued ASU 2015-05, Intangibles—Goodwill and Other-Internal-Use Software (Subtopic 350-40): Customer’s Accounting for Fees Paid in a Cloud Computing Arrangement, which provides explicit guidance to help companies evaluate the accounting for fees paid by a customer in a cloud computing arrangement. This ASU is effective for interim and annual periods beginning after December 15, 2015. An entity can elect to adopt the amendments either prospectively for all arrangements entered into or materially modified after the effective date, or retrospectively. The adoption of this ASU did not have a material impact on our consolidated financial statements.
In April 2015, the FASB issued ASU 2015-03, Interest—Imputation of Interest (Subtopic 835-30): Simplifying the Presentation of Debt Issuance Costs, which requires that debt issuance costs related to a recognized debt liability be presented in the balance sheet as a direct deduction from the carrying amount of that debt liability, consistent with debt discounts. The ASU is effective for annual periods beginning after December 15, 2015, and interim periods within those annual periods. As a result, we reclassified $0.2 million in unamortized debt issuance costs as a reduction of the debt balance as of December 31, 2015 that were previously included in Other Assets (see Note C, Long-Term Debt).
In August 2014, the FASB issues ASU 2014-15, Presentation of Financial Statements—Going Concern (Subtopic 205-40): Disclosure of Uncertainties About an Entity's Ability to Continue as a Going Concern, which provide guidance in management's responsibility to evaluate whether there is substantial doubt about an entity's ability to continue as a going concern. The provision requires management to perform interim and annual assessments of an entity's ability to meet its obligations as they become due within one year from the date that the financial statements are issued. An entity must provide certain disclosures if conditions
86
or events raise substantial doubt about the entity's ability to continue as a going concern. The ASU is effective for annual periods ending after December 15, 2016, and interim periods thereafter, with early adoption permitted. See above for disclosure containing how substantial doubt may be raised, but is alleviated by management's plans and actions.
In May 2014, the FASB issued ASU 2014-09, Revenue from Contracts with Customers, which requires an entity to recognize the amount of revenue to which it expects to be entitled for the transfer of promised goods or services to customers. The ASU will replace most existing revenue recognition guidance in U.S. GAAP when it becomes effective. The standard permits the use of either the retrospective or cumulative effect transition method. On July 9, 2015, the FASB decided to delay the effective date of the new revenue standard by one year. The new effective date is for fiscal years, and interim periods within those fiscal years, beginning after December 15, 2017. Early adoption is permitted beginning January 1, 2017 (original effective date of the ASU). The company is evaluating the effect that ASU 2014-09 will have on its consolidated financial statements and related disclosures. The company has not yet selected a transition method nor has it determined the effect of the standard on its consolidated financial statements.
Note B — Fair Value of Financial Instruments
FASB ASC 820, Fair Value Measurements and Disclosures, ("ASC 820") defines fair value as the price that would be received to sell an asset or paid to transfer a liability in an orderly transaction between market participants at the measurement date. ASC 820 also establishes a fair value hierarchy that prioritizes the inputs used in valuation methodologies into three levels:
Level 1 | Quoted prices in active markets for identical assets or liabilities. | |
Level 2 | Observable inputs other than Level 1 prices, such as quoted prices for similar assets or liabilities; quoted prices in markets that are not active; or other inputs that are observable or can be corroborated by observable market data for substantially the full term of the assets or liabilities. | |
Level 3 | Unobservable inputs that are supported by little or no market activity and that are significant to the fair value of the assets or liabilities. | |
Because of their maturities and/or variable interest rates, certain financial instruments have fair values approximating their carrying values. These instruments include cash and cash equivalents, accounts receivable, and trade payables. The fair value of the assets in our funded pension plan is disclosed in Note F, Employee Benefit Plans. The assumptions used to determine the fair value of our reporting units in Step One and Step Two of our goodwill impairment tests and the discounted cash flow model used to calculate the fair value of our 3Q Digital customer relationship, trade name and non-compete agreement intangible assets are disclosed in Note E, Goodwill and Other Intangible Assets. The summary of our acquisition related contingent consideration accounted for at fair value on a recurring basis is disclosed in Note M, Acquisition and Disposition.
Note C — Long-Term Debt
Our long-term debt obligations at year-end were as follows:
December 31, | ||||||||
In thousands | 2016 | 2015 | ||||||
2016 Revolving Credit Facility, various interest rates based on the Base rate, due March 10, 2021 (effective rate of 6.00% at December 23, 2016 termination) | $ | — | N/A | |||||
2016 Term Loan Facility, various interest rates based on the Base rate plus the applicable margin, due March 10, 2021 (effective rate of 10.72% at December 23, 2016 termination) | — | N/A | ||||||
2013 Revolving Credit Facility ($60.6 million capacity), various interest rates based on the highest of (a) the Agent's prime rate, (b) the Federal Funds Rate plus 0.50% per annum, or (c) Eurodollar rate plus 1.00% per annum, plus a spread which is determined based on our total debt-to-EBITDA ratio then in effect, due August 16, 2016 (effective rate of 4.75% at December 31, 2015) | N/A | 13,000 | ||||||
2011 Term Loan Facility, various interest rates based on LIBOR (effective rate of 2.42% at December 31, 2015), due August 16, 2016 | N/A | 64,313 | ||||||
Less: unamortized discount and debt issuance costs | — | (208 | ) | |||||
Total debt | — | 77,105 | ||||||
Less current maturities | — | 3,000 | ||||||
Total long-term debt | $ | — | $ | 74,105 | ||||
87
The carrying values and estimated fair values of our outstanding debt at year-end were as follows:
December 31, | ||||||||||||||||
2016 | 2015 | |||||||||||||||
In thousands | Carrying Value | Fair Value | Carrying Value | Fair Value | ||||||||||||
Total debt | $ | — | $ | — | $ | 77,105 | $ | 77,105 | ||||||||
The estimated fair values were calculated using market quotes for debt of the same remaining maturity and characteristics. These current rates are considered Level 2 inputs under the fair value hierarchy established by ASC 820, Fair Value Measurement.
Credit Facilities
On August 16, 2011, we entered into a five-year $122.5 million term loan facility ("2011 Term Loan Facility") with Bank of America, N.A., as Administrative Agent. The 2011 Term Loan Facility was repaid on March 11, 2016 using the proceeds of the 2016 Secured Credit Facility.
On August 8, 2013, we entered into a three-year $80 million revolving credit facility, which included a $25 million letter of credit sub-facility and a $5 million swing line loan sub-facility ("2013 Revolving Credit Facility") with Bank of America, N.A. (as Administrative Agent, Swing Line Lender, and L/C Issuer) and the other lenders party thereto. The 2013 Revolving Credit Facility was repaid on March 11, 2016 using the proceeds of the 2016 Secured Credit Facility.
On March 10, 2016, we entered into a secured credit facility with Wells Fargo Bank, N.A. as Administrative Agent, consisting of a maximum $65.0 million revolving credit facility (the "2016 Revolving Credit Facility"), and a $45.0 million term loan facility (the "2016 Term Loan", and together with the 2016 Revolving Credit Facility, the "2016 Secured Credit Facility"). The 2016 Secured Credit Facility was secured by substantially all of our assets and material domestic subsidiaries. The 2016 Secured Credit Facility was used for general corporate purposes, and to replace, and repay remaining outstanding balances on, our (i) 2013 Revolving Credit Facility, and (ii) 2011 Term Loan Facility. The credit and guarantee agreements related to the 2013 Revolving Credit Facility and 2011 Term Loan Facility were terminated upon repayment.
As of April 30, 2016, we were not in compliance with the 2016 Secured Credit Facility's minimum fixed charge coverage ratio or leverage ratio for the period. For the May 1, 2015 to April 30, 2016 covenant reference period, our fixed charge coverage ratio was 0.9 to 1 as compared with the covenant minimum of at least 1.0 to 1 and our leverage ratio was 2.28 to 1 as compared to the requirement of not greater than 2.25 to 1. On May 16,2016, this noncompliance was waived when we entered into an Amendment and Waiver to the Credit Agreement (the "First Amendment and Waiver"). The First Amendment and Waiver also amended the 2016 Secured Credit Facility to provide that we may only make Restricted Payments (as defined therein) after January 1, 2017, provided the other payment conditions were satisfied.
As of June 30, 2016, we were not in compliance with the 2016 Secured Credit Facility's minimum fixed charge coverage ratio or leverage ratio for the period. On August 5, 2016, we entered into a Waiver and Second Amendment to the Credit Agreement (the "Second Amendment and Waiver"). Any covenant violation related to the fixed charge coverage ratio and leverage ratio existing during the period ending June 30, 2016 was waived by Wells Fargo as part of the Second Amendment and Waiver. The Second Amendment and Waiver waived the fixed charge coverage ratio and the leverage ratio until September 30, 2016. We were required to meet a minimum adjusted EBITDA amount that increased month to month starting at $0.5 million for the two-month period ending June 30, 2016 and increased monthly until it met $24.0 million for the period ending April 30, 2017 and each twelve-month period ending each month after that. The Amendment also increased the interest rate applicable to all loans by 1.0% effective May 31, 2016.
As of September 30, 2016, we were not in compliance with the 2016 Secured Credit Facility's minimum fixed charge coverage ratio or leverage ratio for the period. For the September 30, 2016 covenant reference period, our fixed charge coverage ratio was 0.6 to 1 as compared with the covenant minimum of 1.1 to 1 and our leverage ratio was 2.40 to 1 as compared to the covenant requirement of not greater than 2.25 to 1. On November 8, 2016, we entered into a Waiver to Credit Agreement (the "Third Waiver") in which any covenant violation related to the fixed charge coverage ratio and leverage ratio existing during the period ending September 30, 2016 was waived.
On December 13, 2016, we entered into a Waiver and Third Amendment to the Credit Agreement in which an event of default caused by the company's failure to meet the minimum fixed charge coverage ratio of 1.1 to 1 for the twelve-month period ending October 31, 2016 was waived. The Amendment also increased the interest rate applicable to all loans by 1.0% effective December 1, 2016.
88
Prepayment of the 2016 Secured Credit Facility was required upon the completion of the sale of Trillium in accordance with its terms. The proceeds of the Trillium sale were used to repay in full all outstanding loans, together with interest, and all other amounts due in connection with repayment. Prepayment penalties of approximately $1.3 million were incurred as a result of repaying the 2016 Secured Credit Facility. The credit and guarantee agreements related to the 2016 Secured Credit Facility were likewise terminated.
Cash payments for interest were $5.7 million, $1.7 million, and $2.5 million for the years ended December 31, 2016, 2015, and 2014, respectively.
On April 17, 2017, we entered into a secured credit facility with Texas Capital Bank, N.A., that provides a $20 million revolving credit facility (the "Texas Capital Credit Facility"). The Texas Capital Credit Facility will be used for general corporate purposes. The Texas Capital Credit Facility is secured by substantially all of the company's assets and its material domestic subsidiaries. The Texas Capital Credit Facility is secured by HHS Guaranty, LLC, an entity formed to provide credit support for Harte Hanks by certain members of the Shelton family (descendants of one of our founders).
The Texas Capital Credit Facility expires after two years at which point all outstanding principal amounts will be due. Harte Hanks can elect to accrue interest on outstanding principal balances at either LIBOR plus 1.95% or prime plus 0.75%. Unused credit balances will accrue interest at 0.50%. Harte Hanks is required to pay a quarterly fee of $0.1 million as consideration for the collateral balances provided by HHS Guaranty, LLC.
The Texas Capital Credit Facility is subject to customary covenants requiring insurance, legal compliance, payment of taxes, prohibition of second liens, and secondary indebtedness, as well as the filing of quarterly and annual financial statements.
Note D — Income Taxes
The components of income tax expense (benefit) are as follows:
Year Ended December 31, | ||||||||||||
In thousands | 2016 | 2015 | 2014 | |||||||||
Current | ||||||||||||
Federal | $ | (6,360 | ) | $ | 2,920 | $ | 1,519 | |||||
State and local | (107 | ) | 744 | 113 | ||||||||
Foreign | 807 | 545 | 200 | |||||||||
Total current | $ | (5,660 | ) | $ | 4,209 | $ | 1,832 | |||||
Deferred | ||||||||||||
Federal | $ | 18,619 | $ | (38,048 | ) | $ | 3,427 | |||||
State and local | 7,655 | (3,523 | ) | 1,637 | ||||||||
Foreign | 16 | 2 | 730 | |||||||||
Total deferred | $ | 26,290 | $ | (41,569 | ) | $ | 5,794 | |||||
Total income tax expense (benefit) | $ | 20,630 | $ | (37,360 | ) | $ | 7,626 | |||||
The U.S. and foreign components of income (loss) from continuing operations before income taxes were as follows:
Year Ended December 31, | ||||||||||||
In thousands | 2016 | 2015 | 2014 | |||||||||
United States | $ | (66,828 | ) | $ | (217,920 | ) | $ | 17,277 | ||||
Foreign | (2,320 | ) | (506 | ) | 4,103 | |||||||
Total income (loss) from continuing operations before income taxes | $ | (69,148 | ) | $ | (218,426 | ) | $ | 21,380 | ||||
89
The differences between total income tax expense (benefit) and the amount computed by applying the statutory federal income tax rate to income (loss) before income taxes were as follows:
Year Ended December 31, | |||||||||||||||||||||
In thousands | 2016 | Rate | 2015 | Rate | 2014 | Rate | |||||||||||||||
Computed expected income tax expense (benefit) | $ | (24,202 | ) | 35.0 | % | $ | (76,449 | ) | 35.0 | % | $ | 7,484 | 35.0 | % | |||||||
Goodwill impairment basis difference | 6,275 | -9.1 | % | 36,664 | -16.8 | % | — | — | % | ||||||||||||
Sold operations basis difference | — | — | % | 686 | -0.3 | % | — | — | % | ||||||||||||
Net effect of state income taxes | (954 | ) | 1.4 | % | 178 | -0.1 | % | 1,138 | 5.4 | % | |||||||||||
Foreign subsidiary dividend inclusions | 843 | -1.2 | % | 557 | -0.3 | % | 135 | 0.6 | % | ||||||||||||
Foreign tax rate differential | 722 | -1.0 | % | 291 | -0.1 | % | (668 | ) | -3.1 | % | |||||||||||
Change in valuation allowance | 34,478 | -49.9 | % | (153 | ) | 0.1 | % | (386 | ) | -1.8 | % | ||||||||||
Non-deductible interest | 3,219 | -4.7 | % | 715 | -0.3 | % | — | — | % | ||||||||||||
Other, net | 249 | -0.4 | % | 151 | -0.1 | % | (77 | ) | -0.4 | % | |||||||||||
Income tax expense (benefit) for the period | $ | 20,630 | -29.9 | % | $ | (37,360 | ) | 17.1 | % | $ | 7,626 | 35.7 | % | ||||||||
Total income tax expense (benefit) was allocated as follows:
Year Ended December 31, | ||||||||||||
In thousands | 2016 | 2015 | 2014 | |||||||||
Continuing operations | $ | 20,630 | $ | (37,360 | ) | $ | 7,626 | |||||
Discontinued operations | 8,994 | 5,446 | 5,689 | |||||||||
Loss on sale of discontinued operations | (4,600 | ) | — | — | ||||||||
Stockholders’ equity | (782 | ) | 2,021 | (9,527 | ) | |||||||
Total | $ | 24,242 | $ | (29,893 | ) | $ | 3,788 | |||||
90
The tax effects of temporary differences that gave rise to significant portions of the deferred tax assets and deferred tax liabilities were as follows:
Year Ended December 31, | ||||||||
In thousands | 2016 | 2015 | ||||||
Deferred tax assets | ||||||||
Deferred compensation and retirement plan | $ | 24,715 | $ | 22,884 | ||||
Accrued expenses not deductible until paid | 3,508 | 3,612 | ||||||
Employee stock-based compensation | 3,321 | 3,709 | ||||||
Accrued payroll not deductible until paid | 1,400 | 707 | ||||||
Accounts receivable, net | 406 | 1,208 | ||||||
Other, net | 393 | 417 | ||||||
Foreign net operating loss carryforwards | 2,271 | 2,657 | ||||||
State net operating loss carryforwards | 3,349 | 1,956 | ||||||
Foreign tax credit carryforwards | 785 | 785 | ||||||
Capital loss carryforwards | — | 6,278 | ||||||
Total gross deferred tax assets | 40,148 | 44,213 | ||||||
Less valuation allowances | (40,148 | ) | (9,958 | ) | ||||
Net deferred tax assets | $ | — | $ | 34,255 | ||||
Deferred tax liabilities | ||||||||
Property, plant and equipment | $ | (3,060 | ) | $ | (6,154 | ) | ||
Goodwill and other intangibles | (6,800 | ) | (45,212 | ) | ||||
Other, net | (1,184 | ) | (561 | ) | ||||
Total gross deferred tax liabilities | (11,044 | ) | (51,927 | ) | ||||
Net deferred tax liabilities | $ | (11,044 | ) | $ | (17,672 | ) | ||
A reconciliation of the beginning and ending balance of deferred tax valuation allowance is as follows:
In thousands | ||||
Balance at December 31, 2014 | $ | 10,933 | ||
Additions: | ||||
Charged to cost and expenses | 366 | |||
Charged to other accounts | — | |||
Deductions | (1,341 | ) | ||
Balance at December 31, 2015 | $ | 9,958 | ||
Additions: | ||||
Charged to cost and expenses | 37,798 | |||
Charged to other accounts | — | |||
Deductions | (7,608 | ) | ||
Balance at December 31, 2016 | $ | 40,148 | ||
In assessing the realizability of deferred tax assets, we consider whether it is more likely than not that some portion or all of the deferred tax assets will not be realized. The cumulative loss incurred over the two-year period ended December 31, 2016 constituted significant negative evidence. This evidence indicates that a full valuation allowance is necessary for these deferred tax assets for the year ended December 31, 2016. The valuation allowance for deferred tax assets was $40.1 million and $10.0 million at December 31, 2016 and 2015, respectively. The valuation allowance for 2016 relates to all deferred tax assets, and the valuation allowance for 2015 relates to net operating loss, capital loss, and foreign tax credit carryforwards, which are not expected to be realized. The amount of the deferred tax asset considered realizable could be adjusted if estimates of future taxable income during the carryforward period are increased, or if objective negative evidence in the form of cumulative losses is no longer present, and additional weight may be given to subjective evidence such as changes in our growth projections.
91
We or one of our subsidiaries file income tax returns in the U.S. federal, U.S. state, and foreign jurisdictions. For U.S. federal, U.S. state, and foreign returns, we are no longer subject to tax examinations for years prior to 2012.
A reconciliation of the beginning and ending amount of unrecognized tax benefit is as follows:
In thousands | ||||
Balance at December 31, 2013 | $ | 27 | ||
Additions for current year tax positions | — | |||
Additions for prior year tax positions | — | |||
Reductions for prior year tax positions | — | |||
Lapse of statute | (27 | ) | ||
Settlements | — | |||
Balance at December 31, 2014 | $ | — | ||
Additions for current year tax positions | — | |||
Additions for prior year tax positions | 761 | |||
Reductions for prior year tax positions | — | |||
Lapse of statute | — | |||
Settlements | — | |||
Balance at December 31, 2015 | $ | 761 | ||
Additions for current year tax positions | — | |||
Additions for prior year tax positions | 206 | |||
Reductions for prior year tax positions | — | |||
Lapse of statute | — | |||
Settlements | — | |||
Balance at December 31, 2016 | $ | 967 | ||
Included in the balance as of December 31, 2016 are $1.0 million of unrecognized tax benefits that, if recognized, would impact our effective tax rate. Any adjustments to this liability as a result of the finalization of audits or potential settlements would not be material.
We have elected to classify any interest and penalties related to income taxes within income tax expense in our Consolidated Statements of Comprehensive Income (Loss). We did not recognize any tax benefits for the reduction of accrued interest and penalties associated with the reduction of the liability for unrecognized tax benefits during the years ended December 31, 2016 and 2015. We did not have any interest and penalties accrued at December 31, 2016 or 2015.
As of December 31, 2016, we had net operating loss carryforwards that are available to reduce future taxable income and that will begin to expire in 2030.
Deferred income taxes have not been provided on the undistributed earnings of our foreign subsidiaries as these earnings have been, and under current plans will continue to be, permanently reinvested in these subsidiaries. As of December 31, 2016, the net cumulative undistributed earnings of these subsidiaries were approximately $0.3 million. If those earnings were not considered permanently reinvested, U.S. federal deferred income taxes would have been recorded, after consideration of U.S. foreign tax credits. However, it is not practicable to estimate the amount of additional taxes which may be payable upon the distribution of their cumulative earnings. As of December 31, 2016, approximately $0.5 million of cash is located within certain foreign subsidiaries that if repatriated would require that we accrue and pay approximately $0.2 million in additional tax.
Cash payments for income taxes were $2.6 million, $10.1 million, and $4.9 million in 2016, 2015, and 2014, respectively.
Note E — Goodwill and Other Intangible Assets
As discussed in Note A, Significant Accounting Policies, goodwill is not amortized, but is tested for impairment on an annual basis or when circumstances exist that indicate goodwill may be impaired. Prior to the transaction resulting in the sale of Trillium, the company's goodwill was allocated between two reporting units; Customer Interaction and Trillium. As of December 31, 2016 we had one reporting unit.
92
In conjunction with the sale of Trillium on December 23, 2016, the allocated fair value of goodwill of $149.3 million was written-off. This write-off is reflected in the Income (loss) from discontinued operations, net of income taxes line of the Consolidated Statements of Comprehensive Income (Loss) in the Consolidated Financial Statements.
During our annual impairment test in 2016, we performed a Step One analysis. During the first step we used the income-based approach, in which estimated future cash flows were discounted at a rate of 11.5%. The results were combined with results of the market-based approach to determine fair value of the business. The results indicated that the fair value of the reporting unit was less than its carrying amount and a Step Two analysis was warranted.
Under Step Two, the fair value of the reporting unit was estimated for the purpose of deriving an estimate of the implied fair value of goodwill. The fair value of tangible assets along with the estimated fair value of intangible assets including non-compete agreements, trade names, and customer relationships, were taken into consideration for the analysis. Additional assumptions used in measuring the fair value of the assets and liabilities included customer attrition rates, discount rates, and royalty rates used in valuing the intangible assets, and the consideration of the market environment in valuing tangible assets. The resulting implied fair value of the goodwill was then compared to the recorded goodwill to determine the amount of impairment.The results of Step Two indicated that a goodwill write down of $38.7 million was necessary.
During 2015, as a result of a sustained decline in our market capitalization below our book value of equity and recent operating performance, the company determined that a triggering event had occurred. Using the income-based approach and the marketing-based approach, the fair value of the reporting unit was estimated to be below the carrying value and therefore indicated impairment. The second step of the test indicated that goodwill was impaired by $209.9 million. The impairment charge resulted in a corresponding $36.8 million tax benefit resulting in a net income impact of $173.1 million. Our fair value estimates relied on management assumptions including discount rate, revenue growth rates, operating margins, attrition rates, and royalty rates.
Our accumulated goodwill impairment as of December 31, 2016 was $248.6 million.
We recorded $3.5 million in goodwill in 2016 in connection with the acquisition of the business of Aleutian Consulting, Inc. on March 4, 2016. The residual purchase price methodology used in the calculation relied on management's assumptions, which are considered Level 3 inputs, as they are unobservable. This goodwill will be tax deductible.
On April 14, 2015, we sold our B2B research businesses, Aberdeen Group and Harte Hanks Market Intelligence (the "B2B research business”). As a result, the $11.1 million allocated fair value within the net book value of Customer Interaction goodwill was written off. In addition, $2.3 million of intangible assets with indefinite useful lives related to the Aberdeen Group trade name was written off. These amounts are reflected in the Loss on sale in the Other expenses section of the Consolidated Statements of Comprehensive Income (Loss).
On March 16, 2015, we acquired 3Q Digital. We performed a valuation to estimate of the total purchase consideration and values for the tangible and identifiable intangible assets. As a result, we recorded $41.8 million in goodwill and $4.8 million of identified intangible assets with definite lives for client relationships and non-compete agreements. For further discussion on transactions discussed above, see Note M, Acquisition and Disposition.
The changes in the carrying amount of goodwill are as follows:
In thousands | ||||
Balance at December 31, 2014 | $ | 248,891 | ||
Purchase consideration | 41,845 | |||
Disposition | (11,099 | ) | ||
Impairment | (209,938 | ) | ||
Balance at December 31, 2015 | $ | 69,699 | ||
Additions | 3,480 | |||
Impairment | (38,669 | ) | ||
Balance at December 31, 2016 | $ | 34,510 | ||
We continue to monitor potential triggering events. The occurrence of one or more triggering events could require additional impairment testing, which could result in additional impairment charges.
93
Other intangibles with indefinite useful lives relate to trade names associated with the Aberdeen Group acquisition in September 2006. As discussed above, these intangibles were written-off in conjunction with the sale of the B2B research business. As of December 31, 2016, we do not have any remaining intangibles with indefinite lives.
The changes in the carrying amount of other intangibles with indefinite lives are as follows:
In thousands | ||||
Balance at December 31, 2014 | $ | 2,250 | ||
Acquisition | — | |||
Impairment | (2,250 | ) | ||
Balance at December 31, 2015 | $ | — | ||
Acquisition | — | |||
Disposition | — | |||
Balance at December 31, 2016 | $ | — | ||
Other intangibles with definite useful lives relate to contact databases, client relationships, and non-compete agreements. They are amortized on a straight-line basis over their respective estimated useful lives, typically a period of 2 to 10 years, and reviewed for impairment when events or changes in circumstances indicate that the carrying amount of an asset may not be recoverable.
The changes in the carrying amount of other intangibles with definite lives are as follows:
In thousands | ||||
Balance at December 31, 2014 | $ | 27 | ||
Disposition | (18 | ) | ||
Acquisition | 4,773 | |||
Amortization | (659 | ) | ||
Balance at December 31, 2015 | $ | 4,123 | ||
Amortization | (821 | ) | ||
Balance at December 31, 2016 | $ | 3,302 | ||
Amortization expense related to other intangibles with definite useful lives was $0.8 million, $0.7 million, and 0.0 million for the years ended December 31, 2016, 2015, and 2014, respectively. Expected amortization expense for the next five years is as follows:
In thousands | ||||
2017 | $ | 707 | ||
2018 | 627 | |||
2019 | 613 | |||
2020 | 613 | |||
2021 | 613 | |||
Thereafter | 129 | |||
Total | 3,302 | |||
Note F — Employee Benefit Plans
Prior to January 1, 1999, we maintained a defined benefit pension plan for which most of our employees were eligible (the "Qualified Pension Plan"). In conjunction with significant enhancements to our 401(k) plan, we elected to freeze benefits under the Qualified Pension Plan as of December 31, 1998.
In 1994, we adopted a non-qualified, unfunded, supplemental pension plan (the "Restoration Pension Plan") covering certain employees, which provides for incremental pension payments so that total pension payments equal those amounts that would have been payable from the principal pension plan were it not for limitations imposed by income tax regulation. The benefits
94
under the Restoration Pension Plan were intended to provide benefits equivalent to our Qualified Pension Plan as if such plan had not been frozen. We elected to freeze benefits under the Restoration Pension Plan as of April 1, 2014.
The overfunded or underfunded status of our defined benefit post-retirement plans is recorded as an asset or liability on our balance sheet. The funded status is measured as the difference between the fair value of plan assets and the projected benefit obligation. Periodic changes in the funded status are recognized through other comprehensive income. We currently measure the funded status of our defined benefit plans as of December 31, the date of our year-end consolidated balance sheets.
The status of the defined benefit pension plans at year-end was as follows:
Year Ended December 31, | ||||||||
In thousands | 2016 | 2015 | ||||||
Change in benefit obligation | ||||||||
Benefit obligation at beginning of year | $ | 178,715 | $ | 191,065 | ||||
Interest cost | 7,802 | 7,724 | ||||||
Actuarial (gain) loss | 2,127 | (10,861 | ) | |||||
Benefits paid | (9,397 | ) | (9,213 | ) | ||||
Benefit obligation at end of year | $ | 179,247 | $ | 178,715 | ||||
Change in plan assets | ||||||||
Fair value of plan assets at beginning of year | 121,682 | 124,372 | ||||||
Actual return on plan assets | 2,883 | 982 | ||||||
Contributions | 1,557 | 5,541 | ||||||
Benefits paid | (9,397 | ) | (9,213 | ) | ||||
Fair value of plan assets at end of year | $ | 116,725 | $ | 121,682 | ||||
Funded status at end of year | $ | (62,522 | ) | $ | (57,033 | ) | ||
The following amounts have been recognized in the Consolidated Balance Sheets at December 31:
In thousands | 2016 | 2015 | ||||||
Other current liabilities | $ | 1,686 | $ | 1,542 | ||||
Pensions | 60,836 | 55,491 | ||||||
Total | $ | 62,522 | $ | 57,033 | ||||
The following amounts have been recognized in accumulated other comprehensive loss, net of tax, at December 31:
In thousands | 2016 | 2015 | ||||||
Net loss | $ | 46,977 | $ | 43,915 | ||||
We are not required to make and do not intend to make any contributions to our Qualified Pension Plan in 2017. Based on current estimates we will not be required to make any contributions to our Qualified Pension Plan until 2018.
We are not required to make and do not intend to make any contributions to our Restoration Pension Plan in 2017 other than to the extent needed to cover benefit payments. We expect benefit payments under this supplemental pension plan to total approximately $1.7 million in 2017.
The following information is presented for pension plans with an accumulated benefit obligation in excess of plan assets:
In thousands | 2016 | 2015 | ||||||
Projected benefit obligation | $ | 179,247 | $ | 178,715 | ||||
Accumulated benefit obligation | $ | 179,247 | $ | 178,715 | ||||
Fair value of plan assets | $ | 116,725 | $ | 121,682 | ||||
95
The Restoration Pension Plan had an accumulated benefit obligation of $26.6 million and $26.4 million at December 31, 2016 and 2015, respectively.
The following table presents the components of net periodic benefit cost and other amounts recognized in other comprehensive income (loss) for both plans:
Year Ended December 31, | ||||||||||||
In thousands | 2016 | 2015 | 2014 | |||||||||
Net Periodic Benefit Cost (Pre-Tax) | ||||||||||||
Service cost | $ | — | $ | — | $ | 100 | ||||||
Interest cost | 7,802 | 7,724 | 7,698 | |||||||||
Expected return on plan assets | (8,245 | ) | (8,637 | ) | (8,418 | ) | ||||||
Recognized actuarial loss | 2,386 | 6,228 | 3,654 | |||||||||
Net periodic benefit cost | $ | 1,943 | $ | 5,315 | $ | 3,034 | ||||||
Amounts Recognized in Other Comprehensive Income (Loss) (Pre-Tax) | ||||||||||||
Net (gain) loss | $ | 5,103 | $ | (9,408 | ) | $ | 28,802 | |||||
Net (benefit) cost recognized in net periodic benefit cost and other comprehensive (income) loss | $ | 7,046 | $ | (4,093 | ) | $ | 31,836 | |||||
The estimated net loss for the defined benefit pension plans that will be amortized from accumulated other comprehensive loss into net periodic benefit cost in 2017 is $2.7 million. The period over which the net loss from the Qualified Pension Plan is amortized into net periodic benefit cost was changed in 2016 from the average future service of active participants (approximately 9 years) to the average future lifetime of all participants (approximately 23 years). This change reflects that the Qualified Pension Plan is frozen and that almost all of the plan's participants are not active employees.
The weighted-average assumptions used for measurement of the defined pension plans were as follows:
Year Ended December 31, | |||||||||
2016 | 2015 | 2014 | |||||||
Weighted-average assumptions used to determine net periodic benefit cost | |||||||||
Discount rate | 4.49 | % | 4.13 | % | 4.94 | % | |||
Expected return on plan assets | 7.00 | % | 7.00 | % | 7.00 | % | |||
December 31, | ||||||
2016 | 2015 | |||||
Weighted-average assumptions used to determine benefit obligations | ||||||
Discount rate | 4.21 | % | 4.49 | % | ||
The discount rate assumptions are based on current yields of investment-grade corporate long-term bonds. The expected long-term return on plan assets is based on the expected future average annual return for each major asset class within the plan’s portfolio (which is principally comprised of equity investments) over a long-term horizon. In determining the expected long-term rate of return on plan assets, we evaluated input from our investment consultants, actuaries, and investment management firms, including their review of asset class return expectations, as well as long-term historical asset class returns. Projected returns by such consultants and economists are based on broad equity and bond indices. Additionally, we considered our historical 15-year compounded returns, which have been in excess of the forward-looking return expectations.
96
The funded pension plan assets as of December 31, 2016 and 2015, by asset category, are as follows:
In thousands | 2016 | % | 2015 | % | ||||||||||
Equity securities | $ | 61,254 | 52 | % | $ | 83,185 | 68 | % | ||||||
Debt securities | 21,940 | 19 | % | 32,726 | 27 | % | ||||||||
Other | 33,531 | 29 | % | 5,771 | 5 | % | ||||||||
Total plan assets | $ | 116,725 | 100 | % | $ | 121,682 | 100 | % | ||||||
The current economic environment presents employee benefit plans with unprecedented circumstances and challenges, which, in some cases over the last several years, have resulted in large declines in the fair value of investments. The fair values presented have been prepared using values and information available as of December 31, 2016 and 2015.
The following tables present the fair value measurements of the assets in our funded pension plan:
In thousands | December 31, 2016 | Quoted Prices in Active Markets for Identical Assets (Level 1) | Significant Other Observable Inputs (Level 2) | Significant Unobservable Inputs (Level 3) | ||||||||||||
Equity securities | $ | 61,254 | $ | 61,254 | $ | — | $ | — | ||||||||
Debt securities | 21,940 | 21,940 | — | — | ||||||||||||
Total investments, excluding investments valued at NAV | 83,194 | 83,194 | — | — | ||||||||||||
Investments valued at NAV (1) | 33,531 | — | — | |||||||||||||
Total plan assets | $ | 116,725 | $ | 83,194 | $ | — | $ | — | ||||||||
In thousands | December 31, 2015 | Quoted Prices in Active Markets for Identical Assets (Level 1) | Significant Other Observable Inputs (Level 2) | Significant Unobservable Inputs (Level 3) | ||||||||||||
Equity securities | $ | 83,185 | $ | 83,185 | $ | — | $ | — | ||||||||
Debt securities | 32,726 | 32,726 | — | — | ||||||||||||
Total investments, excluding investments valued at NAV | 115,911 | 115,911 | — | — | ||||||||||||
Investments valued at NAV (1) | 5,771 | — | — | — | ||||||||||||
Total plan assets | $ | 121,682 | $ | 115,911 | $ | — | $ | — | ||||||||
(1) Investment valued at NAV are comprised of cash, cash equivalents, and short-term investments used to provide liquidity for the payment of benefits and other purposes. The commingled funds are valued at NAV based on the market value of the underlying investments, which are primarily government issued securities.
The investment policy for the Qualified Pension Plan focuses on the preservation and enhancement of the corpus of the plan’s assets through prudent asset allocation, quarterly monitoring and evaluation of investment results, and periodic meetings with investment managers.
The investment policy’s goals and objectives are to meet or exceed the representative indices over a full market cycle (3-5 years). The policy establishes the following investment mix, which is intended to subject the principal to an acceptable level of volatility while still meeting the desired return objectives:
Target | Acceptable Range | Benchmark Index | ||||||||
Domestic Equities | 50.0 | % | 35 | % | - | 75% | S&P 500 | |||
Large Cap Growth | 22.5 | % | 15 | % | - | 30% | Russell 1000 Growth | |||
Large Cap Value | 22.5 | % | 15 | % | - | 30% | Russell 1000 Value | |||
Mid Cap Value | 5.0 | % | 5 | % | - | 15% | Russell Mid Cap Value | |||
Mid Cap Growth | 0.0 | % | 0 | % | - | 10% | Russell Mid Cap Growth | |||
Domestic Fixed Income | 35.0 | % | 15 | % | - | 50% | LB Aggregate | |||
International Equities | 15.0 | % | 10 | % | - | 25% | MSC1 EAFE | |||
97
The funded pension plan provides for investment in various investment types. Investments, in general, are exposed to various risks, such as interest rate, credit, and overall market volatility risk. Due to the level of risk associated with investments, it is reasonably possible that changes in the value of investments will occur in the near term and may impact the funded status of the plan. To address the issue of risk, the investment policy places high priority on the preservation of the value of capital (in real terms) over a market cycle. Investments are made in companies with a minimum five-year operating history and sufficient trading volume to facilitate, under most market conditions, prompt sale without severe market effect. Investments are diversified across numerous market sectors and individual companies. Reasonable concentration in any one issue, issuer, industry, or geographic area is allowed if the potential reward is worth the risk.
Investment managers are evaluated by the performance of the representative indices over a full market cycle for each class of assets. The Pension Plan Committee reviews, on a quarterly basis, the investment portfolio of each manager, which includes rates of return, performance comparisons with the most appropriate indices, and comparisons of each manager’s performance with a universe of other portfolio managers that employ the same investment style.
The expected future pension benefit payments for the next ten years as of December 31, 2016 are as follows:
In thousands | ||||
2017 | $ | 9,736 | ||
2018 | 9,873 | |||
2019 | 9,967 | |||
2020 | 10,241 | |||
2021 | 10,513 | |||
2022-2026 | 56,362 | |||
Total | $ | 106,692 | ||
We also sponsor a 401(k) retirement plan in which we match a portion of employees’ voluntary before-tax contributions. Under this plan, both employee and matching contributions vest immediately. Total 401(k) expense recognized in 2016, 2015, and 2014 was $3.0 million, $3.0 million, and $3.0 million, respectively.
Note G — Stockholders’ Equity
We paid a dividend of $0.09 per share in the first quarter of 2016.
Under the stock repurchase program publicly announced in August of 2014, our board of directors provided authorization to spend up to $20.0 million to repurchase shares of our outstanding common stock. During 2016, no shares of our common stock were purchased. We had $11.4 million remaining under the current authorization as of December 31, 2016. From 1997 through December 2016, we have paid more than $1.2 billion to repurchase 67.9 million shares under this program and previously announced programs.
Awardees of stock-based compensation may elect to have shares of common stock withheld from vestings to meet tax obligations. These shares are returned to our treasury stock at the time of vesting. During 2016, we received 95,264 shares of our common stock, with an estimated market value of $0.2 million, from such arrangements.
Note H — Stock-Based Compensation
Compensation expense for stock-based awards is based on the fair values of the awards on the date of grant and is recognized on a straight-line basis over the vesting period of the entire award in the “Labor” line of the Consolidated Statements of Comprehensive Income (Loss). For the years ended December 31, 2016, 2015, and 2014, we recorded total stock-based compensation expense from continuing operations of $2.7 million, $5.4 million, and $4.0 million, respectively.
We granted equity awards to our Chief Operations Officer in 2016 and our Chief Executive Officer and Chief Marketing Officer in 2015 as a material inducement for acceptance of such positions. These option, restricted stock, and performance units awards were not submitted for stockholder approval, and were separately listed with the NYSE.
In May 2013, our stockholders approved the 2013 Omnibus Incentive Plan ("2013 Plan"), pursuant to which we may issue up to 5.0 million shares of stock-based awards to directors, employees, and consultants. The 2013 Plan replaced the stockholder-approved 2005 Omnibus Incentive Plan ("2005 Plan"), pursuant to which we issued equity securities to directors, officers, and key employees. No additional stock-based awards will be granted under the 2005 Plan, but awards previously granted under
98
the 2005 Plan will remain outstanding in accordance with their respective terms. As of December 31, 2016, there were 2.5 million shares available for grant under the 2013 Plan.
Stock Options
Options granted under the 2013 Plan or as inducement awards have an exercise price equal to the market value of the common stock on the grant date. These options become exercisable in 25% increments on the first four anniversaries of their date of grant, and expire on the tenth anniversary of their date of grant. Options to purchase 1.1 million shares granted as inducement awards were outstanding at December 31, 2016, with exercise prices ranging from $2.85 to $4.26 per share. Options to purchase 0.7 million shares granted under the 2013 Plan were outstanding as of December 31, 2016 with exercise prices ranging from $1.67 to $8.85 per share.
Following the third quarter 2015 resignation of Mr. Philpott, vesting was accelerated on his unvested stock options (pursuant to the terms of his employment agreement and inducement award), for which we recognized $0.5 million of accelerated expense in July 2015.
Options under the 2005 Plan were granted at exercise prices equal to the market value of the common stock on the grant date. All such awards have met their respective vesting dates. Options to purchase 1.9 million shares were outstanding under the 2005 Plan as of December 31, 2016, with exercise prices ranging from $6.04 to $26.07 per share.
Options issued from January 2013 through March 2015 vest in full (to the extent not previously vested) upon a change in control, as defined in the applicable equity plan. Options granted to officers after April 2015 or before January 2013 vest in full upon a change in control if such options are not assumed or replaced by a publicly-traded successor with an equivalent award (as defined in such officers’ change in control severance agreements). Additionally, 25% of the inducement options granted to the Chief Executive Officer will vest (if not previously vested) in the event her employment is terminated without cause, or if she terminates her employment for good reason (as such terms are defined in her employment agreement).
The following summarizes all stock option activity during the years ended December 31, 2016, 2015, and 2014:
In thousands | Number of Shares | Weighted- Average Option Price | Weighted- Average Remaining Contractual Term (Years) | Aggregate Intrinsic Value (Thousands) | |||||||||
Options outstanding at December 31, 2013 | 4,245,712 | $ | 13.65 | ||||||||||
Granted in 2014 | 1,002,955 | 8.01 | |||||||||||
Exercised in 2014 | (78,125 | ) | 6.19 | $ | 61 | ||||||||
Unvested options forfeited in 2014 | (437,984 | ) | 8.72 | ||||||||||
Vested options expired in 2014 | (268,537 | ) | 17.83 | ||||||||||
Options outstanding at December 31, 2014 | 4,464,021 | $ | 11.50 | ||||||||||
Granted in 2015 | 1,973,606 | 5.73 | |||||||||||
Exercised in 2015 | (35,000 | ) | 6.04 | $ | 67 | ||||||||
Unvested options forfeited in 2015 | (660,733 | ) | 7.96 | ||||||||||
Vested options expired in 2015 | (1,139,148 | ) | 14.89 | ||||||||||
Options outstanding at December 31, 2015 | 4,602,746 | $ | 8.74 | ||||||||||
Granted in 2016 | 150,371 | 2.61 | |||||||||||
Exercised in 2016 | — | — | $ | — | |||||||||
Unvested options forfeited in 2016 | (570,197 | ) | 7.57 | ||||||||||
Vested options expired in 2016 | (477,027 | ) | 16.06 | ||||||||||
Options outstanding at December 31, 2016 | 3,705,893 | $ | 7.72 | 4.74 | $ | — | |||||||
Vested and expected to vest at December 31, 2016 | 3,554,630 | $ | 7.86 | 4.58 | $ | — | |||||||
Exercisable at December 31, 2016 | 1,950,302 | $ | 9.83 | 2.74 | $ | — | |||||||
99
The aggregate intrinsic value at year end in the table above represents the total pre-tax intrinsic value that would have been received by the option holders if all of the in-the-money options were exercised on December 31, 2016. The pre-tax intrinsic value is the difference between the closing price of our common stock on December 31, 2016 and the exercise price for each in-the-money option. This value fluctuates with the changes in the price of our common stock.
The following table summarizes information about stock options outstanding at December 31, 2016:
Range of Exercise Prices | Number Outstanding | Weighted-Average Exercise Price | Weighted-Average Remaining Life (Years) | Number Exercisable | Weighted-Average Exercise Price | |||||||||||||||
$ | 0.00 | - | 6.99 | 1,638,475 | $ | 4.42 | 6.22 | 446,601 | $ | 4.86 | ||||||||||
$ | 7.00 | - | 10.99 | 1,352,768 | 8.07 | 4.64 | 789,051 | 8.26 | ||||||||||||
$ | 11.00 | - | 11.99 | 332,500 | 11.90 | 1.90 | 332,500 | 11.90 | ||||||||||||
$ | 12.00 | - | 15.99 | 259,100 | 14.48 | 1.75 | 259,100 | 14.48 | ||||||||||||
$ | 16.00 | - | 24.49 | 50,000 | 17.30 | 0.25 | 50,000 | 17.30 | ||||||||||||
$ | 24.50 | - | 28.85 | 73,050 | 26.07 | 0.10 | 73,050 | 26.07 | ||||||||||||
3,705,893 | $ | 7.72 | 4.74 | 1,950,302 | $ | 9.83 | ||||||||||||||
The fair value of each option grant is estimated on the date of grant using the Black-Scholes Option-Pricing Model based on the following weighted-average assumptions used for grants during 2016, 2015, and 2014:
Year Ended December 31, | |||||||||
2016 | 2015 | 2014 | |||||||
Expected term (in years) | 6.25 | 6.24 | 6.25 | ||||||
Expected stock price volatility | 44.80 | % | 40.60 | % | 47.10 | % | |||
Risk-free interest rate | 1.48 | % | 1.58 | % | 1.88 | % | |||
Expected dividend yield | — | % | 5.69 | % | 3.82 | % | |||
Expected term is estimated using the simplified method, which takes into account vesting and contractual term. The simplified method is being used to calculate expected term instead of historical experience due to a lack of relevant historical data resulting from changes in option vesting schedules and changes in the pool of employees receiving option grants. Expected stock price volatility is based on the historical volatility from traded shares of our stock over the expected term. The risk-free interest rate is based on the rate of a zero-coupon U.S. Treasury instrument with a remaining term approximately equal to the expected term. Expected dividend yield is based on historical stock price movement and anticipated future annual dividends over the expected term. Future annual dividends over the expected term are estimated to be $0.00 per share.
The weighted-average fair value of options granted during 2016, 2015, and 2014 was $1.17, $1.36, and $2.59, respectively. As of December 31, 2016, there was $1.2 million of total unrecognized compensation cost related to unvested stock options. This cost is expected to be recognized over a weighted average period of approximately 2.34 years.
Unvested Shares
Unvested shares granted as inducement awards or under the 2013 Plan vest in three equal increments on the first three anniversaries of their date of grant. Unvested shares settle solely in common stock and are treated as equity. Unvested shares granted from January 2013 through March 2015 vest in full (to the extent not previously vested) upon a change in control, as defined in the applicable equity plan. Unvested shares granted to officers since April 2015 as inducement awards or under the 2013 Plan vest in full (to the extent not previously vested) upon a change in control if such unvested shares are not assumed or replaced by a publicly-traded successor with an equivalent award (as such terms are defined in such officers’ change-in-control severance agreements).
Following the third quarter 2015 resignation of Mr. Philpott, vesting was accelerated on his unvested shares (pursuant to the terms of his employment agreement and inducement award), for which we recognized $1.2 million of accelerated expense in July 2015.
100
The following summarizes all unvested share activity during 2016, 2015, and 2014:
Number of Shares | Weighted- Average Grant Date Fair Value | ||||||
Unvested shares outstanding at December 31, 2013 | 686,045 | $ | 8.72 | ||||
Granted in 2014 | 529,426 | 7.90 | |||||
Vested in 2014 | (342,613 | ) | 8.98 | ||||
Forfeited in 2014 | (82,720 | ) | 8.37 | ||||
Unvested shares outstanding at December 31, 2014 | 790,138 | $ | 8.10 | ||||
Granted in 2015 | 836,775 | 6.38 | |||||
Vested in 2015 | (504,686 | ) | 8.23 | ||||
Forfeited in 2015 | (159,781 | ) | 7.90 | ||||
Unvested shares outstanding at December 31, 2015 | 962,446 | $ | 6.57 | ||||
Granted in 2016 | 741,954 | 2.63 | |||||
Vested in 2016 | (365,196 | ) | 6.70 | ||||
Forfeited in 2016 | (393,952 | ) | 5.78 | ||||
Unvested shares outstanding at December 31, 2016 | 945,252 | $ | 3.76 | ||||
The fair value of each unvested share is estimated on the date of grant as the closing market price of our common stock on the date of grant. As of December 31, 2016, there was $2.7 million of total unrecognized compensation cost related to unvested shares. This cost is expected to be recognized over a weighted average period of approximately 1.76 years.
Phantom Stock Units
In 2016 the Board of Directors approved grants of phantom stock units under the 2013 Plan. Phantom stock units vest in 25% increments on the first four anniversaries of the date of grant. Phantom stock units settle solely in cash and are treated as a liability. Grants of phantom stock units made to officers under the 2013 Plan vest in full (to the extent not previously vested) upon a change in control if they are not assumed or replaced by a publicly-traded successor with an equivalent award (as such terms are defined in such officers’ change-in-control severance agreements).
The following summarizes all phantom stock unit activity during 2016:
Number of Shares | Weighted- Average Grant Date Fair Value | ||||||
Phantom stock units outstanding at December 31, 2015 | — | $ | — | ||||
Granted in 2016 | 781,645 | 2.69 | |||||
Vested in 2016 | — | — | |||||
Forfeited in 2016 | (249,825 | ) | 2.69 | ||||
Phantom stock units outstanding at December 31, 2016 | 531,820 | $ | 2.69 | ||||
The fair value of each phantom stock unit is estimated on the date of grant as the closing market price of our common stock on the date of grant. Changes in our stock price will result in adjustments to compensation expense and the corresponding liability over the applicable service period. As of December 31, 2016, there was $0.7 million of total unrecognized compensation cost related to phantom stock units. This cost is expected to be recognized over a weighted average period of approximately 3.29 years.
101
Performance Stock Units
Under the 2013 Plan and grants of inducement awards, performance stock units are a form of share-based award similar to unvested shares, except that the number of shares ultimately issued is based on our performance against specific performance goals over a roughly three-year period. At the end of the performance period, the number of shares of stock issued will be determined in accordance with the specified performance target(s) in a range between 0% and 100%. Performance stock units vest solely in common stock and are treated as equity. Unvested performance stock units granted from January 2013 through March 2015 vest in full at the 100% performance level upon a change in control, as defined in the applicable equity plan. Unvested performance stock units granted to officers since April 2015 as inducement awards or under the 2013 Plan vest in full upon a change in control if such unvested performance stock units are not assumed or replaced by a publicly-traded successor with an equivalent award (as such terms are defined in such officers’ change-in-control severance agreements).
The following summarizes all performance stock unit activity during 2016, 2015, and 2014:
Number of Shares | Weighted- Average Grant-Date Fair Value | ||||||
Performance stock units outstanding at December 31, 2013 | 470,700 | $ | 8.58 | ||||
Granted in 2014 | 308,507 | 7.09 | |||||
Settled in 2014 | — | — | |||||
Forfeited in 2014 | (175,533 | ) | 9.30 | ||||
Performance stock units outstanding at December 31, 2014 | 603,674 | $ | 7.61 | ||||
Granted in 2015 | 669,839 | 4.30 | |||||
Settled in 2015 | — | — | |||||
Forfeited in 2015 | (572,129 | ) | 7.54 | ||||
Performance stock units outstanding at December 31, 2015 | 701,384 | $ | 4.51 | ||||
Granted in 2016 | 473,000 | 1.90 | |||||
Settled in 2016 | — | — | |||||
Forfeited in 2016 | (330,069 | ) | 5.76 | ||||
Performance stock units outstanding at December 31, 2016 | 844,315 | $ | 2.56 | ||||
The fair value of each performance stock unit is estimated on the date of grant as the closing market price of our common stock on the date of grant, minus the present value of anticipated dividend payments. Periodic compensation expense is based on the current estimate of future performance against specific performance goals over a three-year period and is adjusted up or down based on those estimates. As of December 31, 2016, there was $1.3 million of total unrecognized compensation cost related to performance stock units. This cost is expected to be recognized over a weighted average period of approximately 2.16 years.
Cash Performance Stock Units
In 2016 the Board of Directors approved grants of cash performance stock units under the 2013 Plan. Cash performance stock units are a form of share-based award similar to phantom stock units, except that the number of units ultimately issued is based on our performance against specific performance goals over a three-year period. At the end of the performance period, the number of units vesting will be determined in accordance with specified performance target(s) in a range between 0% and 100%. Cash performance stock units settle solely in cash and are treated as a liability. Grants of cash performance stock units made to officers under the 2013 Plan vest in full (to the extent not previously vested) upon a change in control if they are not assumed or replaced by a publicly-traded successor with an equivalent award (as such terms are defined in such officers’ change-in-control severance agreements).
102
The following summarizes all performance stock unit activity during 2016:
Number of Shares | Weighted- Average Grant-Date Fair Value | ||||||
Cash performance stock units outstanding at December 31, 2015 | — | $ | — | ||||
Granted in 2016 | 512,127 | 2.69 | |||||
Settled in 2016 | — | — | |||||
Forfeited in 2016 | (68,122 | ) | 2.69 | ||||
Cash performance stock units outstanding at December 31, 2016 | 444,005 | $ | 2.69 | ||||
The fair value of each cash performance stock unit is estimated on the date of grant as the closing market price of our common stock on the date of grant, minus the present value of anticipated dividend payments. Periodic compensation expense is based on the current estimate of future performance against specific performance goals over a three-year period and is adjusted up or down based on those estimates. As of December 31, 2016, there was $0.6 million of total unrecognized compensation cost related to performance stock units. This cost is expected to be recognized over a weighted average period of approximately 2.13 years.
Note I — Commitments and Contingencies
At December 31, 2016, we had letters of credit in the amount of $4.1 million backed by cash collateral. No amounts were drawn against these letters of credit at December 31, 2016. These letters of credit exist to support insurance programs relating to workers’ compensation, automobile, and general liability, and to offset liability relating to leasehold obligations.
In the normal course of our business, we are obligated under some agreements to indemnify our clients as a result of claims that we infringe on the proprietary rights of third parties. The terms and duration of these commitments vary and, in some cases, may be indefinite, and certain of these commitments do not limit the maximum amount of future payments we could become obligated to make there under; accordingly, our actual aggregate maximum exposure related to these types of commitments cannot be reasonably estimated. Historically, we have not been obligated to make significant payments for obligations of this nature, and no liabilities have been recorded for these obligations in our financial statements.
We are also currently subject to various other legal proceedings in the course of conducting our businesses and, from time to time, we may become involved in additional claims and lawsuits incidental to our businesses. In the opinion of management, after consultation with counsel, none of these matters is currently considered to be reasonably possible of resulting in a material adverse effect on our consolidated financial position or results of operations. Nevertheless, we cannot predict the impact of future developments affecting our pending or future claims and lawsuits and any resolution of a claim or lawsuit within a particular fiscal quarter may adversely impact our results of operations for that quarter. We expense legal costs as incurred, and all recorded legal liabilities are adjusted as required as better information becomes available to us. The factors we consider when recording an accrual for contingencies include, among others: (i) the opinions and views of our legal counsel, (ii) our previous experience, and (iii) the decision of our management as to how we intend to respond to the complaints.
Note J — Leases
We lease real estate and certain equipment under numerous lease agreements, most of which contain some renewal options. The total rent expense applicable to operating leases was $12.4 million, $13.6 million, and $14.3 million for the years ended December 31, 2016, 2015, and 2014, respectively.
Step rent provisions and escalation clauses, normal tenant improvements, rent holidays, and other lease concessions are taken into account in computing minimum lease payments. We recognize the minimum lease payments on a straight-line basis over the minimum lease term.
103
The future minimum rental commitments for all non-cancelable operating leases with terms in excess of one year as of December 31, 2016 are as follows:
In thousands | ||||
2017 | $ | 10,812 | ||
2018 | 7,482 | |||
2019 | 4,991 | |||
2020 | 2,842 | |||
2021 | 1,597 | |||
Thereafter | 2,352 | |||
Total | $ | 30,076 | ||
We also lease certain equipment and software under capital leases. Our capital lease obligations at year-end were as follows:
In thousands | 2016 | 2015 | ||||||
Current portion of capital leases | $ | 559 | $ | 132 | ||||
Long-term portion of capital leases | 1,018 | 204 | ||||||
Total capital lease obligation | $ | 1,577 | $ | 336 | ||||
Cash paid for capital leases was $0.2 million for the year ending December 31, 2016.
The future minimum lease payments for all capital leases operating as of December 31, 2016 are as follows:
In thousands | ||||
2017 | $ | 559 | ||
2018 | 522 | |||
2019 | 459 | |||
2020 | 35 | |||
2021 | 2 | |||
Thereafter | — | |||
Total | $ | 1,577 | ||
Note K — Earnings (Loss) Per Share
In periods in which the company has net income, the company is required to calculate earnings per share using the two-class method. The two-class method is required because the company's unvested shares are considered participating securities. Participating securities have the right to receive dividends should the company declare dividends on its common stock. Under the two-class method, undistributed and distributed earnings are allocated on a pro-rata basis to the common and restricted stockholders. The weighted-average number of common and restricted shares outstanding during the period is then used to calculate EPS for each class of shares.
In periods in which the company has a net loss, basic loss per share is calculated using the treasury stock method. The treasury stock method is calculated by dividing the net loss by the weighted-average number of common shares outstanding during the period. The two-class method is not used, because the two-class calculation is anti-dilutive.
104
Reconciliations of basic and diluted earnings per share ("EPS") are as follows
In thousands, except per share amounts | 2016 | 2015 | 2014 | |||||||||
Net Income (Loss) | ||||||||||||
Income (loss) from continuing operations | $ | (89,778 | ) | $ | (181,066 | ) | $ | 13,754 | ||||
Income (loss) from discontinued operations | (41,159 | ) | 10,138 | 10,237 | ||||||||
Net income (loss) | $ | (130,937 | ) | $ | (170,928 | ) | $ | 23,991 | ||||
Basic EPS | ||||||||||||
Weighted-average common shares outstanding used in earnings per share computations | 61,487 | 61,643 | 62,444 | |||||||||
Basic earnings (loss) per share | ||||||||||||
Continuing operations | $ | (1.46 | ) | $ | (2.94 | ) | $ | 0.22 | ||||
Discontinued operations | (0.67 | ) | 0.17 | 0.16 | ||||||||
Basic earnings (loss) per share | $ | (2.13 | ) | $ | (2.77 | ) | $ | 0.38 | ||||
Diluted EPS | ||||||||||||
Shares used in diluted earnings per share computations | 61,487 | 61,643 | 62,658 | |||||||||
Basic earnings (loss) per share | ||||||||||||
Continuing operations | $ | (1.46 | ) | $ | (2.94 | ) | $ | 0.22 | ||||
Discontinued operations | (0.67 | ) | 0.17 | 0.16 | ||||||||
Basic earnings (loss) per share | $ | (2.13 | ) | $ | (2.77 | ) | $ | 0.38 | ||||
Computation of Shares Used in Earnings Per Share Computations | ||||||||||||
Weighted-average common shares outstanding | 61,487 | 61,643 | 62,444 | |||||||||
Weighted-average common equivalent shares-dilutive effect of stock options and awards | — | — | 214 | |||||||||
Shares used in diluted earnings per share computations | 61,487 | 61,643 | 62,658 | |||||||||
For the purpose of calculating the shares used in the diluted EPS calculations, 4.2 million, 4.2 million, and 4.1 million anti-dilutive options have been excluded from the EPS calculations for the years ended December 31, 2016, 2015, and 2014, respectively. 1.1 million, 0.9 million, and 0.0 million anti-dilutive unvested shares were excluded from the calculation of shares used in the diluted EPS calculation for the years ended December 31, 2016, 2015, and 2014, respectively.
105
Note L — Comprehensive Income (Loss)
Comprehensive income (loss) for a period encompasses net income (loss) and all other changes in equity other than from transactions with our stockholders. Our comprehensive income (loss) was as follows:
Year Ended December 31, | ||||||||||||
In thousands | 2016 | 2015 | 2014 | |||||||||
Net income (loss) | $ | (130,937 | ) | $ | (170,928 | ) | $ | 23,991 | ||||
Other comprehensive income (loss): | ||||||||||||
Adjustment to pension liability | (5,103 | ) | 9,408 | (28,802 | ) | |||||||
Tax (expense) benefit | 2,041 | (3,763 | ) | 11,521 | ||||||||
Adjustment to pension liability, net of tax | (3,062 | ) | 5,645 | (17,281 | ) | |||||||
Foreign currency translation adjustment | 444 | (1,976 | ) | (1,830 | ) | |||||||
Total other comprehensive income (loss) | $ | (2,618 | ) | $ | 3,669 | $ | (19,111 | ) | ||||
Total comprehensive income (loss) | $ | (133,555 | ) | $ | (167,259 | ) | $ | 4,880 | ||||
Changes in accumulated other comprehensive income (loss) by component are as follows:
In thousands | Defined Benefit Pension Items | Foreign Currency Items | Total | |||||||||
Balance at December 31, 2014 | $ | (49,560 | ) | $ | 2,331 | $ | (47,229 | ) | ||||
Other comprehensive loss, net of tax, before reclassifications | — | (1,976 | ) | (1,976 | ) | |||||||
Amounts reclassified from accumulated other comprehensive income (loss), net of tax | 5,645 | — | 5,645 | |||||||||
Net current period other comprehensive income (loss), net of tax | 5,645 | (1,976 | ) | 3,669 | ||||||||
Balance at December 31, 2015 | $ | (43,915 | ) | $ | 355 | $ | (43,560 | ) | ||||
Other comprehensive loss, net of tax, before reclassifications | — | 444 | 444 | |||||||||
Amounts reclassified from accumulated other comprehensive income (loss), net of tax | (3,062 | ) | — | (3,062 | ) | |||||||
Net current period other comprehensive income (loss), net of tax | (3,062 | ) | 444 | (2,618 | ) | |||||||
Balance at December 31, 2016 | $ | (46,977 | ) | $ | 799 | $ | (46,178 | ) | ||||
Reclassification amounts related to the defined pension plans are included in the computation of net period pension benefit cost (see Note F, Employee Benefit Plans).
Note M — Acquisition and Disposition
On March 4, 2016, we acquired Aleutian Consulting, Inc. for $3.5 million in cash. The results of the acquired business, which now operates as Harte Hanks Consulting, have been included in continuing operations beginning the day of acquisition. The residual purchase price methodology was used for determination of fair value of the tangible assets and goodwill allocation. The calculation relied on management's assumptions, which are considered Level 3 inputs, as they are unobservable
On March 16, 2015, we acquired 3Q Digital. The results of the acquired entity have been included in continuing operations beginning the day of acquisition. The fair value of the purchase consideration recognized on acquisition was $48.2 million including an initial purchase price of $30.2 million in cash and a $17.9 million liability for the present value of a contingent consideration included in the agreement. The contingent consideration requires us to pay the former owners an additional sum dependent upon achievement of certain goals up to $35.0 million in cash. The estimate of the fair value of the contingent consideration requires subjective assumptions on expected revenue growth, discount rates, and probabilities. Subsequent revisions to these assumptions could materially change the estimate of the fair value of the contingent consideration. A portion of the fair value of the purchase consideration is allocated to the tangible and intangible assets transferred based on their estimated fair value at the acquisition date. The acquired intangible assets are as follows: customer relationships of $4.3 million (amortized over seven years), trade names and trademarks of $0.3 million (amortized over two years), and non-compete agreements of $0.2 million (amortized over three years).
106
On May 1, 2017, the company entered into the 3Q Agreement, which defers our obligation to pay the contingent consideration to the former owners until April 1, 2019 or the sale of the 3Q Digital business, whichever is earlier. Any portion of the contingent consideration that remains unpaid after March 1, 2018 will accrue interest at a rate of 8.5%. In addition, under the 3Q Agreement we agreed to pay a special bonus pool to the former owners of the 3Q Digital business as well as a sale bonus for certain current employees of 3Q Digital in the event the business is sold prior to April 1, 2019.
The following tables summarize the consideration paid and the amounts of estimated fair value of the assets acquired and liabilities assumed at the acquisition date.
In thousands | ||||
Cash consideration per purchase agreement | $ | 30,245 | ||
Estimated fair value of contingent consideration | 17,940 | |||
Fair value of total consideration | $ | 48,185 | ||
In thousands | ||||
Recognized amounts of tangible assets and liabilities: | ||||
Current assets | $ | 4,135 | ||
Property and equipment | 164 | |||
Other assets | 389 | |||
Current liabilities | (822 | ) | ||
Other liabilities | — | |||
Total tangible assets and liabilities | $ | 3,866 | ||
Identifiable intangible assets | 4,773 | |||
Goodwill (including deferred tax adjustment of $2,299) | 41,845 | |||
Total | $ | 50,484 | ||
A reconciliation of the beginning and ending accrued balances of the contingent consideration using significant unobservable inputs (Level 3) is as follows:
In thousands | ||||
Contingent consideration at acquisition date | $ | 17,940 | ||
Accretion of interest | 2,337 | |||
Accrued contingent consideration liability as of December 31, 2015 | 20,277 | |||
Accretion of interest | 2,430 | |||
Adjustments to fair value | 7,018 | |||
Accrued contingent consideration liability as of December 31, 2016 | $ | 29,725 | ||
The fair value of the contingent consideration is highly sensitive to changes in revenue. We estimate that a 1% reduction in the year three revenue projection would change the present value of the contingent consideration by approximately $5.9 million.
Adjustments to the fair value of the contingent consideration are recorded within the "Other, net" line in the Consolidated Statements of Comprehensive Income (Loss).
On April 14, 2015, Harte Hanks sold its B2B research business. The sale resulted in a pre-tax loss of $9.5 million in the second quarter of 2015. The related asset group represented less than 5% of our total 2014 revenue and did not meet the criteria to be classified as a component of the entity. As such, the related loss on sale is included in continuing operations of the Consolidated Financial Statements. The sale resulted in write-offs of both goodwill and intangible assets allocated to the B2B research business (see Note E, Goodwill and Other Intangible Assets).
Note N — Discontinued Operations
On December 23, 2016, we completed the sale of the equity interests of Trillium to Syncsort Ltd. The decision to sell Trillium was largely based on the prioritization of investments in support of optimizing our clients' customer journey across an omni-channel delivery platform, and the determination that the Trillium business is likely to be a better strategic fit and more valuable asset to other parties. The business was sold for gross proceeds of approximately $112.0 million in cash and resulted in a loss
107
on the sale of $39.9 million, net of $4.6 million of income tax benefit. We believe that the sale of Trillium will allow us to better focus on our core Customer Interaction businesses and moving towards growth.
Because the sale of Trillium represents a strategic shift that has a major effect on our operations and financial results, the results of operations, financial position, and cash flows for Trillium are reported separately as discontinued operations for all periods presented. Results of the remaining Harte Hanks business are reported as continuing operations.
Summarized operating results for the Trillium discontinued operations, through the dates of disposal, are as follows:
Year Ended December 31, | ||||||||||||
In thousands | 2016 | 2015 | 2014 | |||||||||
Revenue | $ | 45,639 | $ | 51,135 | $ | 54,232 | ||||||
Labor | 18,687 | 22,219 | 25,930 | |||||||||
Production and distribution | 703 | 1,404 | 1,651 | |||||||||
Advertising, selling, general and administrative | 10,255 | 9,951 | 9,142 | |||||||||
Depreciation, software and intangible asset amortization | 2,304 | 1,867 | 2,032 | |||||||||
Interest expense, net | 7,133 | (256 | ) | (246 | ) | |||||||
Loss on sale | 44,529 | — | — | |||||||||
Other, net | (1,207 | ) | 366 | (203 | ) | |||||||
Income (loss) from discontinued operations before income taxes | (36,765 | ) | 15,584 | 15,926 | ||||||||
Income tax expense | 4,394 | 5,446 | 5,689 | |||||||||
Net income (loss) from discontinued operations | $ | (41,159 | ) | $ | 10,138 | $ | 10,237 | |||||
The assets and liabilities for the Trillium discontinued operations as of December 31, 2016 and 2015 were as follows:
Year Ended December 31, | ||||||||
In thousands | 2016 | 2015 | ||||||
ASSETS | ||||||||
Current assets | ||||||||
Cash and cash equivalents | $ | — | $ | 1,049 | ||||
Accounts receivable, net | — | 11,397 | ||||||
Prepaid expenses | — | 1,640 | ||||||
Property, plant and equipment, net | — | 5,777 | ||||||
Goodwill | — | 149,273 | ||||||
Other current assets | — | 265 | ||||||
Total current assets of discontinued operations | $ | — | $ | 169,401 | ||||
LIABILITIES | ||||||||
Current liabilities | ||||||||
Accounts payable | $ | — | $ | 1,670 | ||||
Accrued payroll and related expenses | — | 924 | ||||||
Deferred revenue and customer advances | — | 21,186 | ||||||
Other current liabilities | — | 978 | ||||||
Total current liabilities of discontinued operations | $ | — | $ | 24,758 | ||||
108
Note O — Selected Quarterly Data (Unaudited)
First Quarter | Second Quarter | Third Quarter | Fourth Quarter | |||||||||||||||||||||||||||||
In thousands, except per share amounts | 2016 | 2015 | 2016 | 2015 | 2016 | 2015 | 2016 | 2015 | ||||||||||||||||||||||||
Revenues | $ | 99,563 | $ | 109,315 | $ | 97,317 | $ | 109,175 | $ | 97,425 | $ | 108,784 | $ | 110,107 | $ | 116,892 | ||||||||||||||||
Operating income (loss) from continuing operations | (9,033 | ) | (258 | ) | (7,175 | ) | 3,039 | (4,572 | ) | (209,640 | ) | (35,000 | ) | 3,590 | ||||||||||||||||||
Income (loss) from continuing operations before income taxes | (9,278 | ) | (457 | ) | (8,001 | ) | (8,613 | ) | (5,386 | ) | (208,742 | ) | (46,483 | ) | (613 | ) | ||||||||||||||||
Loss from continuing operations | (6,700 | ) | (404 | ) | (5,902 | ) | (6,690 | ) | (4,285 | ) | (172,856 | ) | (72,891 | ) | (1,115 | ) | ||||||||||||||||
Discontinued operations, net of tax | 1,097 | 2,019 | 1,639 | 2,518 | 1,244 | 1,942 | (45,139 | ) | 3,659 | |||||||||||||||||||||||
Net income (loss) | $ | (5,603 | ) | $ | 1,615 | $ | (4,263 | ) | (4,172 | ) | $ | (3,041 | ) | $ | (170,914 | ) | $ | (118,030 | ) | $ | 2,544 | |||||||||||
Basic earnings (loss) per common share | ||||||||||||||||||||||||||||||||
Continuing operations | $ | (0.11 | ) | $ | (0.01 | ) | $ | (0.10 | ) | $ | (0.11 | ) | $ | (0.07 | ) | $ | (2.81 | ) | $ | (1.18 | ) | $ | (0.02 | ) | ||||||||
Discontinued operations | $ | 0.02 | $ | 0.04 | $ | 0.03 | $ | 0.04 | $ | 0.02 | $ | 0.04 | $ | (0.74 | ) | $ | 0.06 | |||||||||||||||
Diluted earnings (loss) per common share | ||||||||||||||||||||||||||||||||
Continuing operations | $ | (0.11 | ) | $ | (0.01 | ) | $ | (0.10 | ) | $ | (0.11 | ) | $ | (0.07 | ) | $ | (2.81 | ) | $ | (1.18 | ) | $ | (0.02 | ) | ||||||||
Discontinued operations | $ | 0.02 | $ | 0.04 | $ | 0.03 | 0.04 | $ | 0.02 | $ | 0.04 | $ | (0.74 | ) | $ | 0.06 | ||||||||||||||||
Earnings per common share amounts are computed independently for each of the quarters presented. Therefore, the sum of the quarterly earnings per share amounts may not equal the quarterly earnings per share amounts or the annual earnings per share amounts due to rounding.
Note P — Subsequent Events
On April 17, 2017, we entered into a credit agreement with Texas Capital Bank, N.A. as Lender. The Texas Capital Facility consists of a two-year $20 million revolving credit facility guaranteed by HHS Guaranty, LLC, an entity formed by certain members of the Shelton family, descendants of one of the company's founders. The Texas Capital Credit Facility is secured by substantially all of the company's assets and its material domestic subsidiaries. See Note C, Long-Term Debt, for further discussion.
On May 1, 2017, we entered into the 3Q Agreement with our wholly owned subsidiary 3Q Digital, Inc. and Maury Domengeaux, as representative to the former stockholders and option holders of 3Q Digital (the “Effective Time Holders”) pursuant to that certain Agreement and Plan of Merger, dated as of March 16, 2015, by and among a wholly owned subsidiary of the company and 3Q Digital (the “2015 Merger Agreement”). The 3Q Agreement provides, among other things, for an amendment to the 2015 Merger Agreement to defer our obligation to pay the Effective Time Holders up to an additional $35 million in contingent consideration until the earlier of (x) the sale of the 3Q Digital business or (y) April 1, 2019, if and to the extent the conditions to payment of the contingent consideration as set forth in the 2015 Merger Agreement are satisfied. In addition, under the 3Q Agreement we agreed to (i) engage financial advisors to assist us in the formal process of soliciting potential bidders and bids for the sale of 3Q Digital, (ii) pay a special bonus pool for the Effective Time Holders upon the sale of the 3Q Digital business in the event such sale occurs prior to April 1, 2019, and (iii) approve and adopt a sale bonus plan for certain current employees of 3Q Digital, payable upon the sale of the 3Q Digital business in the event such sale occurs prior to April 1, 2019.
109
INDEX TO EXHIBITS
We are incorporating certain exhibits listed below by reference to other Harte Hanks filings with the Securities and Exchange Commission, which we have identified in parentheses after each applicable exhibit.
Exhibit | ||
No. | Description of Exhibit | |
Acquisition and Dispositions
2.1 | Asset Purchase Agreement, dated September 18, 2013, by and among Harte Hanks Shoppers, Inc., Southern Comprint Co. and Harte Hanks, Inc., on the one hand, and Pennysaver USA Publishing, LLC, Pennysaver USA Printing, LLC, Orbiter Properties, LLC and OpenGate Capital Management, LLC, on the other hand (filed as Exhibit 2.1 to the company’s Form 8-K dated September 19, 2013). | |
2.2 | Agreement and Plan of Merger, dated March 16, 2015, among Harte Hanks, Inc., Harte Hanks Smart, Inc., 3Q Digital, Inc. and Maury Domengeaux, as representative to the stockholders of 3Q Digital, Inc. (filed as Exhibit 2.1 to the company's Form 10-Q dated May 7, 2015). | |
2.3 | Membership Interest Purchase Agreement, dated April 14, 2015, between AMI Intermediate, LLC and Harte Hanks, Inc. relating to the sale of Aberdeen Group and Harte Hanks Market Intelligence (filed as Exhibit 2.2 to the company's Form 10-Q dated May 7, 2015). | |
2.4 | Stock Purchase Agreement, dated November 29, 2016, by and among Syncsort Incorporated, Syncsort Limited, Syncsort GmbH, Harte Hanks, Inc., Harte-Hanks UK Limited, Harte-Hanks GmbH, Trillium Software, Inc., Harte-Hanks Trillium UK Limited, Harte-Hanks Trillium Software Germany GmbH and Harte Hanks, Inc. as sellers’ representative (filed as Exhibit 2.1 to the company's Form 8-K dated December 30, 2016). | |
2.5 | 3Q Agreement, dated May 1, 2017, by and between Harte Hanks, Inc. and 3Q Digital, Inc. and Maury Domengeaux, as representative to the former stockholders and option holders of 3Q Digital, Inc. (filed as Exhibit 2.1 to the company's Form 8-K dated May 5, 2017 | |
Charter Documents
3(a) | Amended and Restated Certificate of Incorporation as amended through May 5, 1998 (filed as Exhibit 3(e) to the company’s Form 10-Q for the six months ended June 30, 1998). | |
3(b) | Fifth Amended and Restated Bylaws (filed as Exhibit 3.1 to the company’s Form 8-K dated December 23, 2015). | |
3(c) | Certificate of Amendment of Incorporation dated January 30, 2015 (filed as Exhibit 3.1 to the company’s Form 8-K dated January 30, 2015). | |
Credit Agreements
10.1(a) | Term Loan Agreement by and between Harte Hanks, Inc. and Wells Fargo Bank, as administrative agent, dated March 10, 2016 (filed as Exhibit 10.1 to the company's Form 8-K dated March 11, 2016). | |
10.1(b) | Waiver and First Amendment to Credit Agreement as of May 16, 2016, with Wells Fargo Bank, N.A., as Administrative Agent (filed as Exhibit 10.1 in the company's Form 8-K dated May 20, 2016). | |
10.1(c) | Waiver and Second Amendment to Credit Agreement as of August 5, 2016, with Wells Fargo Bank, N.A., as Administrative Agent (filed as Exhibit 10.1 in the company's Form 8-K dated August 9, 2016). | |
10.1(d) | Waiver to Credit Agreement dated November 8, 2016, with Wells Fargo Banks, N.A., as Administrative Agent (filed as Exhibit 10.1 in the company's Form 10-Q dated November 9, 2016. | |
10.1(e) | Waiver and Third Amendment to Credit Agreement as of December 13, 2016, with Wells Fargo Bank, N.A. as administrative agent (filed as Exhibit 10.1 in the company's Form 8-K dated December 16, 2016). | |
10.1(f) | Credit Agreement by and between Harte Hanks, Inc. and Texas Capital Bank, as lender, dated April 17, 2017 (filed as 10.1 to the company's Form 8-K dated April 21, 2017. | |
110
Management and Director Compensatory Plans and Forms of Award Agreements
10.2(a) | Harte Hanks, Inc. Restoration Pension Plan (As Amended and Restated Effective January 1, 2008) (filed as Exhibit 10.1 to the company’s Form 8-K dated June 27, 2008). | |
10.2(b) | Harte Hanks, Inc. 2005 Omnibus Incentive Plan (As Amended and Restated Effective February 13, 2009) (filed as Exhibit 10.1 to the company’s Form 8-K dated February 13, 2009). | |
10.2(c) | Amendment to Harte Hanks, Inc. 2005 Omnibus Incentive Plan, dated as of May 12, 2009 (incorporated by reference to Exhibit 4.4 to Harte Hanks Registration Statement on Form S-8, filed on May 12, 2009). | |
10.2(d) | Form of 2005 Omnibus Incentive Plan Non-Qualified Stock Option Agreement (filed as Exhibit 10.2(i) to the company’s Form 10-K dated March 7, 2012). | |
10.2(e) | Form of 2005 Omnibus Incentive Plan Bonus Stock Agreement (filed as Exhibit 10.2(j) to the company’s Form 10-K dated March 7, 2012). | |
10.2(f) | Form of 2005 Omnibus Incentive Plan Restricted Stock Award Agreement (filed as Exhibit 10.2(k) to the company’s Form 10-K dated March 7, 2012). | |
10.2(g) | Form of 2005 Omnibus Incentive Plan Performance Unit Award Agreement (filed as Exhibit 10.2(l) to the company’s Form 10-K dated March 7, 2012). | |
10.2(h) | Summary of Non-Employee Directors’ Compensation (included within the company’s Schedule of 14A proxy statement filed April 11, 2016). | |
10.2(i) | Harte Hanks, Inc. 2013 Omnibus Incentive Plan (filed as Annex A to the company’s Schedule 14A proxy statement filed April 15, 2013). | |
10.2(j) | Form of 2013 Omnibus Incentive Plan Non-Qualified Stock Option Agreement (filed as Exhibit 10.4 to the company’s Registration Statement on Form S-8 dated June 7, 2013). | |
10.2(k) | Form of 2013 Omnibus Incentive Plan Restricted Stock Award Agreement (General) (filed as Exhibit 10.1 to the company’s Registration Statement on Form S-8 dated June 7, 2013). | |
10.2(l) | Form of 2013 Omnibus Incentive Plan Restricted Stock Award Agreement (Director) (filed as Exhibit 10.2 to the company’s Registration Statement on Form S-8 dated June 7, 2013). | |
10.2(m) | Form of 2013 Omnibus Incentive Plan Performance Unit Award Agreement (filed as Exhibit 10.3 to the company’s Registration Statement on Form S-8 dated June 7, 2013). | |
10.2(n) | Form of Non-Qualified Stock Option Agreement between the company and Karen A. Puckett (filed as Exhibit 10.2 to the company's Form 8-K dated September 14, 2015). | |
10.2(o) | Form of Restricted Stock Award Agreement between the company and Karen A. Puckett (filed as Exhibit 10.3 to the company's Form 8-K dated September 14, 2015). | |
10.2(p) | Form of Performance Unit Award Agreement between the company and Karen A. Puckett (filed as Exhibit 10.4 to the company's Form 8-K dated September 14, 2015). | |
10.2(q) | Form of Non-Qualified Stock Option Agreement between Harte Hanks, Inc. and Shirish R. Lal (filed as Exhibit 10.2 to the company's Form 8-K dated February 17, 2016). | |
10.2(r) | Form of Restricted Stock Award Agreement between Harte Hanks, Inc. and Shirish R. Lal (filed as Exhibit 10.3 to the company's Form 8-K dated February 17, 2016). | |
10.2(s) | First Amendment to the Harte Hanks, Inc. Amended & Restated Restoration Pension Plan, dated October 11, 2016 (filed as Exhibit 10.1 to the company's Form 8-K dated October 14, 2016). | |
111
Executive Officer Employment-Related and Separation Agreements
10.3(a) | Form of Change of Control Severance Agreement between the company and its Corporate Officers (filed as Exhibit 10.1 to the company’s Form 8-K, dated March 19, 2015). | |
10.3(b) | Form of Employment Restrictions Agreement signed by the Corporate Officers of the company (filed as Exhibit 10.3 to the company’s Form 8-K dated March 15, 2011). | |
10.3 (c) | Transition and Consulting Agreement, dated as of July 25, 2011, Between the company and Peter E. Gorman (filed as Exhibit 10.1 to the company’s Form 8-K dated July 26, 2011). | |
10.3 (d) | Transition Agreement dated July 30, 2012 between the company and Gary J. Skidmore (filed as Exhibit 10.2 to the company’s 8-K dated August 2, 2012) | |
10.3 (e) | Form of Indemnification Agreement for Directors and Officers (filed as Exhibit 10.1 to the company’s 8-K dated August 2, 2012) | |
10.3 (f) | Retirement & Consulting Agreement between the company and Larry D. Franklin dated June 7, 2013 (filed as Exhibit 10.5 to the company’s 8-K dated June 11, 2013). | |
10.3 (g) | Employment Agreement between the company and Robert A. Philpott dated June 8, 2013 (filed as Exhibit 10.1 to the company’s 8-K dated June 11, 2013). | |
10.3 (h) | Form of Severance Agreement between the company and certain of its officers (filed as Exhibit 10.6 to the company’s 8-K dated June 11, 2013). | |
10.3(i) | Executive Severance Policy applicable to the company’s executive officers and certain others (filed as Exhibit 10.1 to the company’s Form 8-K, dated January 30, 2015). | |
10.3(j) | Retention Bonus Agreement applicable to the company's executive officers (filed as Exhibit 10.1 to the company's Form 8-K, dated July 9, 2015). | |
10.3(k) | Employment Agreement between the company and Karen A. Puckett dated September 13, 2015 (filed as Exhibit 10.1 to the company's Form 8-K, dated September 14, 2015). | |
10.3(l) | Employment Agreement between the company and Shirish R. Lal dated February 3, 2016 (filed as Exhibit 10.1 to the company's Form 8-K, dated February 17, 2016). | |
10.3(m) | Retention Bonus Agreement between the company and Robert L. R. Munden dated December 31, 2016 (filed as Exhibit 10.1 to the company's Form 8-K, dated December 15, 2016). | |
10.3(n) | Transition and Consulting Agreement, dated as of December 31, 2016, between the company and Douglas C. Shepard (filed as Exhibit 10.2 to the company's Form 8-K, dated December 15, 2016). | |
Other Exhibits
*10.1 | Form of Non-Qualified Stock Option Agreement between Harte Hanks, Inc. and Frank M. Grillo | |
*10.2 | Form of Restricted Stock Agreement between Harte Hanks, Inc. and Frank M. Grillo | |
*10.3 | Revolving Promissory Note, dated April 17, 2017, between Harte Hanks, Inc. and Texas Capital Bank, National Association. | |
*21 | Subsidiaries of Harte Hanks, Inc. | |
*23.1 | Consent of KPMG LLP, Independent Registered Public Accounting Firm. | |
*23.2 | Consent of Deloitte & Touche LLP, Independent Registered Public Accounting Firm. | |
*31.1 | Certification of Chief Executive Officer pursuant to Section 302 of the Sarbanes-Oxley Act of 2002. | |
*31.2 | Certification of Chief Financial Officer pursuant to Section 302 of the Sarbanes-Oxley Act of 2002. | |
*32.1 | Furnished Certification of Chief Executive Officer pursuant to 18 U.S.C Section 1350, as adopted pursuant to Section 906 of the Sarbanes-Oxley Act of 2002. | |
*32.2 | Furnished Certification of Chief Financial Officer pursuant to 18 U.S.C Section 1350, as adopted pursuant to Section 906 of the Sarbanes-Oxley Act of 2002. | |
*101 | XBRL Interactive Data Files. | |
*Filed or furnished herewith, as applicable
112