Attached files
| file | filename |
|---|---|
| EX-32 - EXHIBIT 32 - BROWN FORMAN CORP | bfb-ex32_2017430x10k.htm |
| EX-31.2 - EXHIBIT 31.2 - BROWN FORMAN CORP | bfb-ex312_2017430x10k.htm |
| EX-31.1 - EXHIBIT 31.1 - BROWN FORMAN CORP | bfb-ex311_2017430x10k.htm |
| EX-23 - EXHIBIT 23 - BROWN FORMAN CORP | bfb-ex23_2017430x10k.htm |
| EX-21 - EXHIBIT 21 - BROWN FORMAN CORP | bfb-ex21_2017430x10k.htm |
| EX-12 - EXHIBIT 12 - BROWN FORMAN CORP | bfb-ex12_2017430x10k.htm |
UNITED STATES
SECURITIES AND EXCHANGE COMMISSION
Washington, D.C. 20549
Form 10-K
(Mark One) | |
þ | ANNUAL REPORT PURSUANT TO SECTION 13 OR 15(d) OF THE SECURITIES EXCHANGE ACT OF 1934 |
For the fiscal year ended April 30, 2017 | |
OR | |
¨ | TRANSITION REPORT PURSUANT TO SECTION 13 OR 15(d) OF THE SECURITIES EXCHANGE ACT OF 1934 |
For the transition period from to | |
Commission File Number 001-00123
BROWN-FORMAN CORPORATION
(Exact name of registrant as specified in its charter)
Delaware | 61-0143150 | |
(State or other jurisdiction of incorporation or organization) | (IRS Employer Identification No.) | |
850 Dixie Highway Louisville, Kentucky | 40210 | |
(Address of principal executive offices) | (Zip Code) | |
Registrant’s telephone number, including area code (502) 585-1100
Securities registered pursuant to Section 12(b) of the Act:
Title of each class | Name of each exchange on which registered | |
Class A Common Stock (voting) $0.15 par value | New York Stock Exchange | |
Class B Common Stock (nonvoting) $0.15 par value | New York Stock Exchange | |
Securities registered pursuant to Section 12(g) of the Act: None
Indicate by check mark if the registrant is a well-known seasoned issuer, as defined in Rule 405 of the Securities Act. Yes þ No ¨
Indicate by check mark if the registrant is not required to file reports pursuant to Section 13 or Section 15(d) of the Act. Yes ¨ No þ
Indicate by check mark whether the registrant (1) has filed all reports required to be filed by Section 13 or 15(d) of the Securities Exchange Act of 1934 during the preceding 12 months (or for such shorter period that the registrant was required to file such reports), and (2) has been subject to such filing requirements for the past 90 days. Yes þ No ¨
Indicate by check mark whether the registrant has submitted electronically and posted on its corporate Web site, if any, every Interactive Data File required to be submitted and posted pursuant to Rule 405 of Regulation S-T during the preceding 12 months (or for such shorter period that the registrant was required to submit and post such files). Yes þ No ¨
Indicate by check mark if disclosure of delinquent filers pursuant to Item 405 of Regulation S-K is not contained herein, and will not be contained, to the best of registrant’s knowledge, in definitive proxy or information statements incorporated by reference in Part III of this Form 10-K or any amendment to this Form 10-K. ¨
Indicate by check mark whether the registrant is a large accelerated filer, an accelerated filer, a non-accelerated filer, smaller reporting company, or an emerging growth company. See the definitions of “large accelerated filer,” “accelerated filer,” “smaller reporting company,” and “emerging growth company” in Rule 12b-2 of the Exchange Act.
Large accelerated filer | þ | Accelerated filer | ¨ | |
Non-accelerated filer | ¨ | (Do not check if a smaller reporting company) | Smaller reporting company | ¨ |
Emerging growth company | ¨ | |||
If an emerging growth company, indicate by check mark if the registrant has elected not to use the extended transition period for complying with any new or revised financial accounting standards provided pursuant to Section 13(a) of the Exchange Act. ¨
Indicate by check mark whether the registrant is a shell company (as defined in Rule 12b-2 of the Act). Yes ¨ No þ
The aggregate market value, as of the last business day of the most recently completed second fiscal quarter, of the voting and nonvoting equity held by nonaffiliates of the registrant was approximately $12,600,000,000.
The number of shares outstanding for each of the registrant’s classes of Common Stock on May 31, 2017, was:
Class A Common Stock (voting) | 169,027,456 | |
Class B Common Stock (nonvoting) | 215,178,607 | |
DOCUMENTS INCORPORATED BY REFERENCE
Portions of the Proxy Statement of Registrant for use in connection with the Annual Meeting of Stockholders to be held July 27, 2017, are incorporated by reference into Part III of this report.
1
Table of Contents | ||
Page | ||
PART I | ||
Item 1. | ||
Item 1A. | ||
Item 1B. | ||
Item 2. | ||
Item 3. | ||
Item 4. | ||
PART II | ||
Item 5. | ||
Item 6. | ||
Item 7. | ||
Item 7A. | ||
Item 8. | ||
Item 9. | ||
Item 9A. | ||
Item 9B. | ||
PART III | ||
Item 10. | ||
Item 11. | ||
Item 12. | ||
Item 13. | ||
Item 14. | ||
PART IV | ||
Item 15. | ||
Item 16. | ||
2
Forward-Looking Statement Information. Certain matters discussed in this report, including the information presented in Part II under “Item 7. Management’s Discussion and Analysis of Financial Condition and Results of Operations,” contain statements, estimates, and projections that are “forward-looking statements” as defined under U.S. federal securities laws. Words such as “aim,” “anticipate,” “aspire,” “believe,” “can,” “continue,” “could,” “envision,” “estimate,” “expect,” “expectation,” “intend,” “may,” “might,” “plan,” “potential,” “project,” “pursue,” “see,” “seek,” “should,” “will,” “would,” and similar words indicate forward-looking statements, which speak only as of the date we make them. Except as required by law, we do not intend to update or revise any forward-looking statements, whether as a result of new information, future events, or otherwise. By their nature, forward-looking statements involve risks, uncertainties, and other factors (many beyond our control) that could cause our actual results to differ materially from our historical experience or from our current expectations or projections. These risks and uncertainties include, but are not limited to, those described in Part I under “Item 1A. Risk Factors” and those described from time to time in our future reports filed with the Securities and Exchange Commission, including:
• | Unfavorable global or regional economic conditions and related low consumer confidence, high unemployment, weak credit or capital markets, budget deficits, burdensome government debt, austerity measures, higher interest rates, higher taxes, political instability, higher inflation, deflation, lower returns on pension assets, or lower discount rates for pension obligations |
• | Risks associated with being a U.S.-based company with global operations, including commercial, political, and financial risks; local labor policies and conditions; protectionist trade policies or economic or trade sanctions; compliance with local trade practices and other regulations, including anti-corruption laws; terrorism; and health pandemics |
• | Fluctuations in foreign currency exchange rates, particularly a stronger U.S. dollar |
• | Changes in laws, regulations, or policies – especially those that affect the production, importation, marketing, labeling, pricing, distribution, sale, or consumption of our beverage alcohol products |
• | Tax rate changes (including excise, sales, VAT, tariffs, duties, corporate, individual income, dividends, capital gains) or changes in related reserves, changes in tax rules (for example, LIFO, foreign income deferral, U.S. manufacturing, and other deductions) or accounting standards, and the unpredictability and suddenness with which they can occur |
• | Dependence upon the continued growth of the Jack Daniel’s family of brands |
• | Changes in consumer preferences, consumption, or purchase patterns – particularly away from larger producers in favor of small distilleries or local producers, or away from brown spirits, our premium products, or spirits generally, and our ability to anticipate or react to them; bar, restaurant, travel, or other on-premise declines; shifts in demographic trends; or unfavorable consumer reaction to new products, line extensions, package changes, product reformulations, or other product innovation |
• | Decline in the social acceptability of beverage alcohol in significant markets |
• | Production facility, aging warehouse, or supply chain disruption |
• | Imprecision in supply/demand forecasting |
• | Higher costs, lower quality, or unavailability of energy, water, raw materials, product ingredients, labor, or finished goods |
• | Route-to-consumer changes that affect the timing of our sales, temporarily disrupt the marketing or sale of our products, or result in higher implementation-related or fixed costs |
• | Inventory fluctuations in our products by distributors, wholesalers, or retailers |
• | Competitors’ consolidation or other competitive activities, such as pricing actions (including price reductions, promotions, discounting, couponing, or free goods), marketing, category expansion, product introductions, or entry or expansion in our geographic markets or distribution networks |
• | Risks associated with acquisitions, dispositions, business partnerships, or investments – such as acquisition integration, termination difficulties or costs, or impairment in recorded value |
• | Inadequate protection of our intellectual property rights |
• | Product recalls or other product liability claims, or product counterfeiting, tampering, contamination, or quality issues |
• | Significant legal disputes and proceedings, or government investigations |
• | Failure or breach of key information technology systems |
• | Negative publicity related to our company, brands, marketing, personnel, operations, business performance, or prospects |
• | Failure to attract or retain key executive or employee talent |
• | Our status as a family “controlled company” under New York Stock Exchange rules |
Use of Non-GAAP Financial Information. Certain matters discussed in this report, including the information presented in Part II under “Item 7. Management’s Discussion and Analysis of Financial Condition and Results of Operations,” include measures that are not measures of financial performance under U.S. generally accepted accounting principles (GAAP). These non-GAAP measures should not be considered in isolation or as a substitute for any measure derived in accordance with GAAP, and also may be inconsistent with similarly titled measures presented by other companies. In Part II under “Item 7. Management’s Discussion and Analysis of Financial Condition and Results of Operations,” we present the reasons we use these measures under the heading, “Non-GAAP Financial Measures,” and we reconcile these measures to the most closely comparable GAAP measures under the heading “Results of Operations – Year-Over-Year Comparisons.”
3
PART I
Item 1. Business
Overview
Brown-Forman Corporation (the “Company,” “Brown-Forman,” “we,” “us,” or “our” below) was incorporated under the laws of the State of Delaware in 1933, successor to a business founded in 1870 as a partnership and later incorporated under the laws of the Commonwealth of Kentucky in 1901. We primarily manufacture, bottle, import, export, market, and sell a wide variety of alcoholic beverages under recognized brands. We employ over 4,700 people on six continents, including approximately 1,300 people in Louisville, Kentucky, USA, home of our world headquarters. We are the largest American-owned spirits and wine company with global reach. We are a “controlled company” under New York Stock Exchange rules as the Brown family owns more than 50% of our voting stock. Additionally, taking into account ownership of shares of our non-voting stock, the Brown family controls more than 50% of the economic ownership in Brown‑Forman.
For a discussion of recent developments, see “Item 7. Management’s Discussion and Analysis of Financial Condition and Results of Operations – Executive Summary.”
Brands
Beginning in 1870 with Old Forester Bourbon Whisky – our founding brand – and spanning the generations since, we have built a portfolio of more than 40 spirit, wine, and ready-to-drink cocktail (RTD) brands that includes some of the best-known and most-loved trademarks in our industry. The most important brand in our portfolio is Jack Daniel’s Tennessee Whiskey, which is the fourth-largest spirits brand of any kind and the largest American whiskey brand in the world, according to Impact Databank’s “Top 100 Premium Spirits Brands Worldwide” list. Among the top five premium spirits brands on the list, Jack Daniel’s Tennessee Whiskey was the only one to grow by volume in 2016. In its fourth year on the Worldwide Impact list, Jack Daniel’s Tennessee Honey remains the second-largest-selling flavored whiskey. Our other leading global brands on the Worldwide Impact list are Finlandia, the tenth-largest-selling vodka; Canadian Mist, the fourth-largest-selling Canadian whisky; and el Jimador, which is the fourth-largest-selling tequila and designated as an Impact “Hot Brand.” Additionally, Woodford Reserve was once again selected as an Impact “Hot Brand.”1
Principal Brands | ||
Jack Daniel’s Tennessee Whiskey | el Jimador Tequilas | |
Jack Daniel’s Tennessee Honey | el Jimador New Mix RTDs | |
Jack Daniel’s RTDs | Herradura Tequilas | |
Gentleman Jack Rare Tennessee Whiskey | Sonoma-Cutrer California Wines | |
Jack Daniel’s Tennessee Fire | Canadian Mist Canadian Whisky | |
Jack Daniel’s Single Barrel Collection2 | GlenDronach Single Malt Scotch Whisky5 | |
Jack Daniel’s Winter Jack | BenRiach Single Malt Scotch Whisky5 | |
Jack Daniel’s Sinatra Select | Glenglassaugh Single Malt Scotch Whisky5 | |
Jack Daniel’s No. 27 Gold Tennessee Whiskey | Chambord Liqueur | |
Jack Daniel’s Tennessee Rye3 | Early Times Kentucky Whisky and Bourbon | |
Korbel California Champagnes4 | Old Forester Kentucky Bourbon | |
Korbel California Brandy4 | Pepe Lopez Tequila | |
Woodford Reserve Kentucky Bourbon | Antiguo Tequila | |
Woodford Reserve Double Oaked | Coopers’ Craft Kentucky Bourbon6 | |
Woodford Reserve Kentucky Rye Whiskey | Collingwood Canadian Whisky | |
Finlandia Vodkas | Slane Irish Whiskey6 | |
1All references in this paragraph are derived from Impact Databank, a well-known U.S. trade publication, who published these industry statistics in March 2017. | |
2The Jack Daniel’s Single Barrel Collection includes Jack Daniel’s Single Barrel Select, Jack Daniel’s Single Barrel Barrel Proof, Jack Daniel’s Single Barrel Rye, and Jack Daniel’s Single Barrel 100 Proof. | |
3New brand to be launched in fiscal year 2018. | |
4While Korbel is not an owned brand, we sell Korbel products under contract in the United States and other select markets. | |
5Single Malt Scotch whisky brands acquired in June 2016. | |
6New brands launched in limited markets during fiscal year 2017. | |
4
See “Item 7. Management’s Discussion and Analysis of Financial Condition and Results of Operations – Results of Operations – Fiscal 2017 Brand Highlights” for brand performance details.
Our vision in marketing is to “be the best brand builders in the industry.” We build our brands by investing in programs that we believe create enduring connections with our consumers. These programs cover a wide spectrum of activities, including media (TV, radio, print, outdoor, and, increasingly, digital and social media), consumer and trade promotions, sponsorships, and visitor center programs at our distilleries and our winery. We expect to grow our sales and profits by consistently delivering creative, responsible marketing programs that drive brand recognition, brand trial, brand loyalty, and, ultimately, consumer demand around the world.
Markets
We sell our products in more than 165 countries around the world. The United States, our largest, most important market, accounted for 48% of our net sales in fiscal 2017. Our largest international markets include the United Kingdom, Australia, Mexico, Germany, France, Poland, Japan, Canada, and Russia. Over the last decade, we have continued to expand our international footprint. In fiscal 2017, we generated 52% of our net sales outside the United States compared to 51% ten years ago. The U.S. proportion of net sales grew from fiscal 2015 to fiscal 2016 then stayed constant in fiscal 2017, mainly due to the negative effect of foreign exchange on our international business. We present the percentage of total net sales by geographic area for our most recent three fiscal years and, to provide historical context, fiscal 2008, below:
Percentage of Total Net Sales by Geographic Area | |||||||||
Year ended April 30 | |||||||||
2008 | ... | 2015 | 2016 | 2017 | |||||
United States | 49 | % | ... | 46 | % | 48 | % | 48 | % |
International: | ... | ||||||||
Europe | ... | 27 | % | 27 | % | 26 | % | ||
Australia | ... | 6 | % | 5 | % | 5 | % | ||
Other | ... | 21 | % | 20 | % | 21 | % | ||
Total International | 51 | % | ... | 54 | % | 52 | % | 52 | % |
TOTAL | 100 | % | 100 | % | 100 | % | 100 | % | |
Note: Totals may differ due to rounding | |||||||||
For details about net sales in our largest markets, refer to “Item 7. Management’s Discussion and Analysis of Financial Condition and Results of Operations – Fiscal 2017 Market Highlights.” For details about our reportable segment and for additional geographic information about net sales and long-lived assets, refer to Note 15 to the Consolidated Financial Statements in “Item 8. Financial Statements and Supplementary Data.” For details on risks related to our global operations, see “Item 1A. Risk Factors.”
Distribution Network and Customers
Our distribution network, which we sometimes refer to as our “route-to-consumer” (RTC), takes a variety of forms, depending on (a) a market’s laws and regulatory framework for trade in beverage alcohol, (b) our assessment of a market’s long-term attractiveness and competitive dynamics, (c) the relative profitability of distribution options available to us, (d) the structure of the retail and wholesale trade in a market, and (e) our portfolio’s development stage in a market. As these factors change, we evaluate our RTC strategy and, from time to time, adapt our model.
In the United States, which generally prohibits wine and spirits manufacturers from selling their products directly to consumers, we sell our brands either to distributors or (in states that directly control alcohol sales) to state governments that then sell to retail customers and consumers.
Outside the United States, we use a variety of RTC models, which can be grouped into three categories: owned distribution, partner, and government controlled markets. We own and operate distribution companies in 13 markets: Australia, Brazil, Canada, China, the Czech Republic, France, Germany, Hong Kong, South Korea, Mexico, Poland, Thailand, and Turkey. In these markets, and in a large portion of the travel retail channel, we sell our products directly to retailers, to wholesalers, or, in Canada, to provincial governments. Over the past decade, we began distribution operations in multiple markets outside the United States, as shown in the table below.
5
Recent Route-to-Consumer Changes | ||
Fiscal year | Market | |
2011 | Germany | |
Brazil | ||
2012 | Turkey | |
2014 | France | |
2018 (planned) | Spain | |
In the United Kingdom, we partner in a cost-sharing arrangement with another supplier, Bacardi Limited, to sell a portfolio of both companies’ brands. In many other markets, including Italy, Japan, Russia, and South Africa, we rely on others to distribute our brands, generally under fixed-term distribution contracts.
We believe that our customer relationships are good. We believe our exposure to concentrations of credit risk is limited due to the diverse geographic areas covered by our operations.
Seasonality
Holiday buying makes the fourth calendar quarter (generally our third fiscal quarter) the peak season for our business. Approximately 32%, 31%, and 30% of our net sales for fiscal 2015, fiscal 2016, and fiscal 2017, respectively, were in the fourth calendar quarter.
Competition
Trade information indicates that we are one of the largest global suppliers of premium spirits and wine. According to International Wine & Spirit Research (IWSR), for calendar year 2016, the ten largest global spirits companies controlled less than 20% of the total global market for spirits (on a volume basis). While we believe that the overall market environment offers considerable growth opportunities for us, our industry is now, and will remain, highly competitive. We compete against many global, regional, and local brands in a variety of categories of beverage alcohol, but our brands compete primarily in the industry’s premium-and-higher price categories. Our competitors include major global wine and spirits companies, such as Bacardi Limited, Beam Suntory Inc., Davide Campari-Milano S.p.A., Diageo PLC, LVMH Moët Hennessy Louis Vuitton SE, Pernod Ricard SA, and Rémy Cointreau. In addition, particularly in the United States, we increasingly compete with national companies and craft spirit brands, many of which are recent entrants to the industry.
Brand recognition, brand provenance, quality of product and packaging, availability, flavor profile, and price affect consumers’ choices among competing brands in our industry. Several factors influence consumers’ buying decisions, including: advertising; promotions; merchandising in bars, restaurants, and shops; expert or celebrity endorsement; social media and word of mouth; and the timing and relevance of new product introductions. Although some competitors have substantially greater resources than we do, we believe that our competitive position is strong, particularly as it relates to brand recognition, quality, availability, and relevance of new product introductions.
Ingredients and Other Supplies
The principal raw materials used in manufacturing and packaging our distilled spirits, liqueurs, RTD products, and wines are shown in the table below.
Principal Raw Materials | ||||||||
Distilled Spirits | Liqueurs | RTD Products | Wines | Packaging | ||||
Agave | Flavorings | Flavorings | Grapes | Aluminum cans | ||||
Barley | Neutral spirits | Malt | Wood | Cartons | ||||
Corn | Sugar | Neutral spirits | Closures | |||||
Malted barley | Water | Sugar | Glass bottles | |||||
Rye | Whiskey | Tequila | PET1 bottles | |||||
Sugar | Wine | Water | Labels | |||||
Water | Whiskey | |||||||
Wood | ||||||||
1Polyethylene terephthalate (PET) is a polymer used in non-glass containers. | |
6
Our grape supply comes from a combination of our California vineyards and contracts with independent growers. We believe that our relationships with our growers are good. Currently, none of these raw materials are in short supply, but shortages could occur. From time to time, our agricultural ingredients (corn, rye, malted barley, agave, and grapes) could be adversely affected by weather and other forces that might constrain supply.
Whiskeys, certain tequilas, and other distilled spirits must be aged. Because we must schedule production years in advance to meet future demand for these products, our inventories of them may be larger in relation to sales and total assets than in many other businesses.
For details on risks related to the availability of raw materials and the uncertainty inherent in forecasting supply and demand, refer to “Item 1A. Risk Factors.”
Intellectual Property
Our intellectual property rights include trademarks, copyrights, proprietary packaging and trade dress, proprietary manufacturing technologies, know-how, and patents. Our intellectual property, especially our trademarks, is essential to our business. We register our trademarks broadly – some of them in every country where registration is possible. We register others where we sell or expect to sell our products. We protect our intellectual property rights vigorously but fairly. We have licensed some of our trademarks to third parties for use with services or on products other than alcoholic beverages, which we believe enhances the awareness and protection of our brands.
For details on risks related to the protection of our intellectual property, refer to “Item 1A. Risk Factors.” For details on our most important brands, refer to “Item 7. Management’s Discussion and Analysis of Financial Condition and Results of Operations – Results of Operations – Fiscal 2017 Brand Highlights.”
Regulatory Environment
Federal, state, local, and foreign authorities regulate the production, storage, transportation, distribution, and sale of our products. Some countries and local jurisdictions prohibit or restrict the marketing or sale of distilled spirits in whole or in part.
In the United States, at the federal level, the Alcohol and Tobacco Tax and Trade Bureau of the U.S. Department of the Treasury regulates the wine and spirits industry with respect to the production, blending, bottling, labeling, sales, advertising, and transportation of beverage alcohol. Similar regulatory regimes exist at the state level and in most non-U.S. jurisdictions where we sell our products. In addition, beverage alcohol products are subject to customs duties or excise taxation in many countries, including taxation at the federal, state, and local level in the United States.
Laws of each nation define distilling and maturation requirements; for example, under U.S. federal regulations, bourbon and Tennessee whiskeys must be aged in new charred oak barrels; we typically age our whiskeys three to six years. Canadian whisky is required to be manufactured in Canada in compliance with Canadian laws. Mexican authorities regulate the production and bottling of tequilas; they mandate minimum aging periods for extra anejo (three years), anejo (one year), and reposado (two months) tequilas. Irish whiskey must be matured at least three years in a wood cask, such as oak, on the island of Ireland. Scotch whisky must be matured in oak casks for at least three years in Scotland. We comply with all of the above laws and regulations.
Our operations are subject to various environmental protection statutes and regulations, and our policy is to comply with them.
Strategy
Seven years ago, we introduced our “Brown-Forman 150” long-term strategy, focused on driving sustainable growth toward our 150th anniversary in 2020. The B-F Arrow articulates our core principles: our purpose as well as the vision, values, and behaviors that we expect our employees to embrace and exhibit.
7

These core principles are a constant and powerful means of connecting our stakeholders to a shared vision of “Building Forever,” and we continue to refresh our strategies to reflect current realities. The strategic ambitions described below both demonstrate a sustained focus on several drivers of our recent growth and acknowledge today’s emerging opportunities.
We seek to build brands and businesses that can create shareholder value – ones that deliver strong and sustainable growth, solid margins, and high returns on investment. In addition, given our growing size and scale, we focus on building brands that can be meaningful for our company over time. Our first priority is to innovate and grow our premium spirits portfolio organically. But as opportunities arise, we will consider acquisitions and partnerships that meet our rigorous quantitative and qualitative criteria.
The Jack Daniel’s family of brands, including Jack Daniel’s Tennessee Whiskey, is our most valuable asset. We will always work to keep Jack Daniel’s Tennessee Whiskey strong, healthy, and relevant to consumers worldwide, and to take advantage of the abundant opportunities to grow the Jack Daniel’s family of brands across markets, price points, channels, and consumer groups. Product innovation has become a meaningful contributor to our company’s performance in recent years. We will continue to evaluate opportunities to grow the Jack Daniel’s family of brands through thoughtful new product introductions, including the recently announced U.S. launch of Jack Daniel’s Tennessee Rye in the fall of 2017, and the continued expansion of Jack Daniel’s Tennessee Fire in markets outside of the United States.
We are the global leader in American whiskey1, and we will continue to pursue growth in the broader global, premium whiskey category. We believe that we can leverage our whiskey-making knowledge, production assets, trademarks, and brand- building skills to accomplish this objective. We will focus first on the global growth of our most important whiskey, Jack Daniel’s. In addition, we expect to generate excellent growth with our other whiskey brands around the world, particularly Woodford Reserve and Old Forester, which have both experienced rapid growth in recent years.
In 2016, we launched Coopers’ Craft, our first new bourbon trademark in more than 20 years, in select markets in the United States. We unveiled our first expression of our Slane Irish Whiskey brand in April 2017 in Travel Retail in Ireland, and we expect to introduce the brand in the United States, the United Kingdom, and Australia during the summer of 2017. We added three single malt Scotch whisky brands, GlenDronach, BenRiach, and Glenglassaugh, to our world-class whiskey portfolio in June 2016 with the acquisition of The BenRiach Distillery Company Limited. We believe that super- and ultra-premium whiskeys are attractive long-term businesses for us, and we will continue to pursue global growth in these categories.
Fiscal 2017 marks the ten year anniversary of our acquisition of Casa Herradura, and we are pleased with the development of both our business in Mexico and our portfolio of world-class tequila brands globally. Looking ahead, we plan to expand Herradura tequila in order to realize its full potential, reaching new consumers in Mexico, the United States, and other high-potential markets. After repositioning el Jimador tequila as a more premium brand at home in Mexico, we are encouraged by our prospects for long-term, profitable growth there. Outside Mexico, we have nearly quadrupled el Jimador’s volumes since fiscal 2008, and we remain confident in el Jimador’s potential to improve its position among the world’s leading tequila brands.
Finlandia is the tenth-largest-selling vodka in the world,2 and it is additionally prominent in several of the world’s largest vodka markets, such as Poland, Russia, Ukraine, and Czechia. We plan to grow Finlandia where its position is strong, including in its largest market, Poland, where Finlandia accounts for five out every ten bottles of imported vodka sold.1
1 IWSR, 2016 data. | |
2Impact Databank, March 2017. | |
8
In fiscal 2016, as part of our evolving portfolio strategy and our efforts to focus resources on our highest strategic priorities, we sold our Southern Comfort and Tuaca brands. This decision reflects our continuing efforts to reshape our portfolio by developing, divesting, and acquiring brands to create value and improve growth.
The United States remains our largest market, and continuing to grow in this market is important to our long-term success. We expect to foster this growth by emphasizing fast-growing spirits categories such as super-premium whiskeys and tequila, continued product and packaging innovation, continued route-to-consumer proficiency, and brand building within growing consumer segments (with increasing emphasis on multicultural marketing).
Over the last two decades, our business outside the United States has grown more quickly than our business within it. Although the past three years have been an exception to this trend, we expect the longer-term trend to resume. Our ability to achieve our long-term growth objectives requires further development of our business globally, especially in emerging markets. We expect to continue to grow our business in developed markets such as France, Germany, Australia, and the United Kingdom. We will continue to pursue RTC strategies that will expand our access to and understanding of consumers in these diverse markets, such as the establishment of our own distribution organization in Spain this summer, which is the world’s ninth largest whiskey market. In addition, we expect increasingly significant contributions to our growth from emerging markets including Mexico, Poland, Turkey, Brazil, China, Russia, Southeast Asia, Africa, and Eastern Europe.
We believe that having a long-term-focused, committed, engaged shareholder base, anchored by the Brown family, gives us an important strategic advantage, particularly in a business with aged products and multi-generational brands. For nearly 150 years, the Company and the Brown family have been committed to preserving Brown-Forman as a thriving, family controlled, independent company.
Recognizing the strong cash-generating capacity and the capital efficiency of our business, we will continue to pursue what we believe to be well-balanced capital deployment strategies aimed at perpetuating Brown-Forman’s strength and independence.
Corporate Responsibility
In pursuing the objectives described above, we will strive to be responsible in everything we do. Our history of responsibility began in 1870, when our founder, George Garvin Brown, first sold medicinal whiskey in glass bottles to ensure quality and safety – an innovative idea back when whiskey was usually sold by the barrel. Today, achieving our stated business purpose, to “enrich the experience of life,” is possible only within a context of corporate responsibility. This means promoting responsible consumer enjoyment of our brands; working to reduce alcohol abuse and misuse; protecting the environment; providing a healthy, safe, and inclusive workplace; and contributing to the communities where we operate around the globe.
Alcohol Responsibility. Our business is based on the belief that beverage alcohol, consumed in moderation, can enrich the experience of life. However, we are well aware that when consumed irresponsibly, alcohol can have harmful effects on people and society. We appreciate the need for governments to regulate our industry appropriately and effectively, taking into account national circumstances and local cultures. We also appreciate that some people should not drink or choose not to drink, and we respect this choice. Acting in partnership with others, we want to be part of the solution to real, complex problems such as underage drinking, drunk driving, overconsumption, and alcoholism.
As a significant player in the global beverage alcohol industry, we foster collective action with our peers. Working with other producers, we are able to leverage our views on a scale that can create change. For example, we continue to work with 11 other industry leaders that signed the Beer, Wine and Spirits Producers’ Commitments to Reduce Harmful Drinking. In the fourth year of our five year plan, we tailored our work to address key concerns in individual markets with programs that leveraged the strengths of local- and country-level partnerships. We also innovated strategies to promote responsible drinking and develop approaches that can help build programs and interventions to reduce harmful drinking. Our collective progress on these commitments will be reported annually through 2018 and can be seen at www.producerscommitments.org.
Since 2009, we have hosted an open forum to share our points of view, post the research of outside experts, and encourage the opinions of others at www.OurThinkingAboutDrinking.com. In the United States, we support The Ad Council’s “Buzzed Driving is Drunk Driving” campaigns and safe ride services. In 2016, Gentleman Jack partnered with the largest U.S. designated driver service to provide free designated drivers in 24 cities nationwide. We also continued to collaborate with the Responsible Retailing Forum, which brings together diverse stakeholders seeking to reduce underage sales, among other initiatives. In our consumer relationships, we seek to communicate through responsible advertising content and placement, relying on our comprehensive internal marketing code and adhering to industry marketing and advertising guidelines. We also engage consumers where they are through innovative programs such as the Cascadia Challenge, a partnership with U.S. Major League Soccer to get fans to pledge to be designated drivers at games in the Pacific Northwest.
9
As part of our commitment to responsible marketing, and to enable consumers to make more informed decisions, in February 2017 we launched a website, nutrition.brown-forman.com, providing nutritional information on our brands. Our individual brand websites will be linked to this content later this year. We also are founding members of, and contribute significant resources to, the Foundation for Advancing Alcohol Responsibility (responsibility.org), an organization created by spirits producers to prevent drunk driving and underage drinking as well as promote responsible decision-making. While this is a U.S. organization, we participate actively in similar organizations in other markets, such as DrinkWise in Australia, BSI in Germany, The Portman Group in the United Kingdom, and FISAC in Mexico. Our team in Finland and the Association of Finnish Alcoholic Beverage Suppliers created a website in 2016 to help parents educate their teens on how to say no to alcohol. We also provide long-running support for alcohol education programs at the University of Louisville and the University of Kentucky (two major universities in the state of our corporate headquarters).
Environmental Sustainability. We view environmental sustainability as integral to our strategy to perpetuate Brown-Forman and Build Forever. Our environmental sustainability strategy aims to protect and conserve resources that we depend on. It also reinforces our business strategy through programs that reduce costs through efficiency, lessen risks to our operations, and improve effectiveness through innovation. We invest in renewable energy, energy efficiency, and efficient transportation to reduce our carbon footprint. Mindful of our overall impact, in fiscal 2014, we set ambitious environmental sustainability goals for fiscal 2023: (a) reducing our absolute greenhouse gas emissions by 15%, (b) sending zero waste to landfill, and (c) reducing our water use and wastewater discharges per unit of product by 30% (versus 2012 baseline year). These goals support our ambition to responsibly grow our brands and our company while protecting and enriching the natural environment. We have refreshed our strategy to now include a greater focus beyond our operational borders into our supply chain. We report on our progress toward these goals in our biennial Corporate Responsibility Reports, available on our corporate website. In 2016, Newsweek magazine named Brown-Forman the third “greenest” U.S. beverage company, and number 52 among the 500 largest publicly traded companies in the United States. Rankings were based on eight measures of corporate sustainability and environmental performance.
Diversity, Inclusion, and Human Rights. We believe that having a diverse and inclusive workforce is central to our success. As we work to increase our brands’ relevance and appeal to diverse consumer groups, we need a diversity of experiences and outlooks within our own workforce. We also want employees to feel comfortable in contributing their whole selves and different perspectives to their work. Over the past few years, we have made progress with diverse representation at the senior level. Three women and one African American serve on our Board of Directors. Four members of our 14-member Executive Leadership Team are women and two are minorities. In 2017, we once again earned a perfect score of 100% in the Corporate Equality Index by the Human Rights Campaign, a civil rights organization promoting equality for lesbian, gay, bisexual, and transgender (LGBT) Americans. This makes us one of the “Best Places to Work for LGBT equality”1 in the United States for the seventh consecutive year. Our Employee Resource Groups (ERGs) have been the core of our diversity culture by supporting employees’ growth while enhancing their contributions. Our eight ERGs foster a diverse and inclusive environment that drives our high-commitment, high-performance organization and encourages our employees to bring their individuality to work. Our commitment to diversity extends to our partnerships with small and diverse suppliers. By 2020, our goal is to source at least 16% of our procurement from businesses owned by ethnic minorities, women, LGBT persons, people with disabilities, and veterans. To date, we have procured approximately 11% of our supplies from such businesses.
In the marketplace, we focus on promoting fair and ethical business practices. We remain committed to the guidelines set forth in our Global Human Rights Statement, defining our commitment to respecting the fundamental rights of all human beings. Our work in this area helped inform our response to the U.K.’s recent passage of the Modern Slavery Act in 2015, which is available on our corporate website.
Community Involvement. Our approach to philanthropy reflects our values as a corporate citizen. Our civic engagement supports non-profit organizations that improve the lives of individuals and the vitality of our communities. We believe, as a responsible and caring corporate citizen, it is vital that we give back to the communities that support both our employees and our business. Through our contributions, we work to create communities that ensure basic living standards, support healthy and sustainable living, and enhance intellectual and cultural living. While we focus on our hometown of Louisville, Kentucky, our civic engagement activities extend to the communities around the globe where our employees live, work, and raise their families.
In fiscal 2017, we donated approximately $11 million, logged approximately 15,000 volunteer hours, and had 128 employees serve on boards of directors of 211 non-profit organizations.
Our Corporate Responsibility reports are available at www.brown-forman.com/responsibility.
1Human Rights Campaign 2016 Corporate Equity Index at www.hrc.org/resources/best-places-to-work-2016. | |
10
Employees and Executive Officers
As of April 30, 2017, we employed approximately 4,700 people worldwide (2,700 in the United States), including about 260 employed on a part-time or temporary basis. Approximately 15% of our employees are represented by a union. We believe our employee relations are good.
The following persons serve as executive officers as of June 15, 2017:
Name | Age | Principal Occupation and Business Experience |
Paul C. Varga | 53 | Company Chairman and Chief Executive Officer since 2007. Chief Executive Officer since 2005. |
Jane C. Morreau | 58 | Executive Vice President and Chief Financial Officer since 2014. Senior Vice President, Chief Production Officer, and Head of Information Technology from 2013 to 2014. Senior Vice President and Director of Financial Management, Accounting, and Technology from 2008 to 2013. |
Matthew E. Hamel | 57 | Executive Vice President, General Counsel, and Secretary since 2007. |
Jill Ackerman Jones | 51 | Executive Vice President and President for North America, CCSA, IMEA, and Global Travel Retail since February 2015. Executive Vice President and President for North America and Latin America Regions from 2013 to 2015. Executive Vice President and Chief Production Officer from 2007 to 2012. |
Mark I. McCallum | 62 | Executive Vice President and President of Jack Daniel’s Brands since February 2015. Executive Vice President and President for Europe, Africa, Middle East, Asia Pacific, and Travel Retail from 2013 to 2015. Executive Vice President and Chief Operating Officer from 2009 to 2013. Executive Vice President and Chief Brands Officer from 2006 to 2009. |
Lawson E. Whiting | 48 | Executive Vice President and Chief Brands and Strategy Officer since February 2015. Senior Vice President and Chief Brands Officer from 2013 to 2015. Senior Vice President and Managing Director for Western Europe from 2011 to 2013. Vice President and Finance Director for Western Europe from 2010 to 2011. Vice President and Finance Director for North America from 2009 to 2010. |
Alejandro “Alex” Alvarez | 49 | Senior Vice President and Chief Production Officer since 2014. Vice President and General Manager for Brown-Forman Tequila Mexico Operations from 2008 to 2014. |
Ralph De Chabert | 70 | Senior Vice President and Chief Diversity Officer since 2007. |
Brian P. Fitzgerald | 44 | Senior Vice President and Chief Accounting Officer since 2013. Vice President and Finance Director for Greater Europe and Africa from 2009 to 2013. |
Kirsten M. Hawley | 47 | Senior Vice President and Chief Human Resources Officer since February 2015. Senior Vice President and Director of HR Business Partnerships from 2013 to 2015. Vice President and Director of Organization and Leader Development 2011 to 2013. Assistant Vice President and Director of Employee Engagement from 2009 to 2011. |
Thomas Hinrichs | 55 | Senior Vice President and President for Europe, North Asia, and ANZSEA since February 2015. Senior Vice President and Managing Director for Europe from 2013 to 2015. Senior Vice President and Managing Director for Greater Europe and Africa from 2006 to 2013. |
Lisa P. Steiner | 57 | Senior Vice President, Chief of Staff, and Director of Global Corporate Communications and Services since February 2015. Senior Vice President and Chief Human Resources Officer from 2009 to 2015. Senior Vice President and Director of Global Human Resources from 2007 to 2009. |
Available Information
You can read and copy any materials that we file with the SEC in its Public Reference Room at 100 F Street, NE, Washington, D.C. 20549. Information on the Public Reference Room may be obtained by calling the SEC at 1-800-SEC-0330. In addition, the SEC maintains a website that contains reports, proxy and information statements, and other information regarding issuers that file with the SEC at www.sec.gov.
Our website address is www.brown-forman.com. Our annual reports on Form 10-K, quarterly reports on Form 10-Q, current reports on Form 8-K, and any amendments to these reports are available free of charge on our website as soon as reasonably practicable after we electronically file those reports with the SEC. The information provided on our website is not part of this report, and is therefore not incorporated by reference, unless that information is otherwise specifically referenced elsewhere in this report.
On our website, we have posted our Code of Conduct that applies to all our directors and employees, and our Code of Ethics that applies specifically to our senior financial officers. If we amend or waive any of the provisions of our Code of Conduct or our Code of Ethics applicable to our principal executive officer, principal financial officer, or principal accounting officer that relates to any element of the definition of “code of ethics” enumerated in Item 406(b) of Regulation S-K under the Securities Act
11
of 1934 Act, we intend to disclose these actions on our website. We have also posted on our website our Corporate Governance Guidelines and the charters of our Audit Committee, Compensation Committee, Corporate Governance and Nominating Committee, and Executive Committee of our Board of Directors. Copies of these materials are also available free of charge by writing to our Secretary, Matthew E. Hamel, 850 Dixie Highway, Louisville, Kentucky 40210 or emailing him at Secretary@b-f.com.
Item 1A. Risk Factors
We believe the following discussion identifies the most significant risks and uncertainties that could adversely affect our business. If any of the following risks were actually to occur, our business, results of operations, cash flows, or financial condition could be materially and adversely affected. Additional risks not currently known to us, or that we currently deem to be immaterial, could also materially and adversely affect our business, results of operations, cash flows, or financial condition.
Unfavorable economic conditions could negatively affect our operations and results.
Unfavorable global or regional economic conditions, including uncertainty caused by unstable geopolitical environments in many parts of the world, could adversely affect our business and financial results. While the major economic disruptions of the most recent financial crisis have largely subsided, many markets where our products are sold still face significant economic challenges resulting from the global economic downturn that followed, including low consumer confidence, high unemployment, budget deficits, burdensome governmental debt, austerity measures, increased taxes, and weak financial, credit, and housing markets. Unfavorable economic conditions such as these can cause governments to increase taxes on beverage alcohol to attempt to raise revenue, reduce consumers’ willingness to make discretionary purchases of beverage alcohol products, or pay for premium brands such as ours. In unfavorable economic conditions, consumers may make more value-driven and price-sensitive purchasing choices and drink more at home rather than at restaurants, bars, and hotels, which tend to favor many of our premium and super-premium products.
Unfavorable economic conditions could also adversely affect our suppliers, distributors, and retailers, who in turn could experience cash flow problems, more costly or unavailable financing, credit defaults, and other financial hardships. This could lead to distributor or retailer destocking, increase our bad debt expense, or cause us to increase the levels of unsecured credit that we provide to customers. Other potential negative consequences to our business from poor economic conditions include higher interest rates, an increase in the rate of inflation, deflation, exchange rate fluctuations, credit or capital market instability, or lower returns on pension assets or lower discount rates for pension obligations (possibly requiring higher contributions to our pension plans). For details on the effects of changes in the value of our benefit plan obligations and assets on our financial results, see Note 9 to the Consolidated Financial Statements in “Item 8. Financial Statements and Supplementary Data.”
Our global business is subject to commercial, political, and financial risks, including foreign currency exchange rate fluctuations.
Our products are sold in more than 165 countries; accordingly, we are subject to risks associated with doing business globally, including commercial, political, and financial risks. In the long term, we continue to expect our growth rates in non-U.S. markets to surpass our growth rates in the United States. Emerging regions, such as eastern Europe, Latin America, Asia, and Africa, as well as more developed markets, such as the United Kingdom, France, Germany, and Australia, provide growth opportunities for us. If shipments of our products – particularly Jack Daniel’s Tennessee Whiskey – to our global markets were to experience significant disruption due to these risks or for other reasons, it could have a material adverse effect on our financial results.
In addition, we are subject to potential business disruption caused by military conflicts; potentially unstable governments or legal systems; civil or political upheaval or unrest; local labor policies and conditions; possible expropriation, nationalization, or confiscation of assets; problems with repatriation of foreign earnings; economic or trade sanctions; closure of markets to imports; anti-American sentiment; terrorism or other types of violence in or outside the United States; health pandemics; and a significant reduction in global travel. For example, Europe is a key commercial and production region for some of our products, and further outbreaks of violence there could disrupt our operations. Furthermore, uncertainty related to the future of the European Union may affect our business and financial performance in Europe. For instance, in June 2016, the United Kingdom voted by referendum to leave the European Union (Brexit), and, until the United Kingdom’s exit from the European Union is finalized, there may be a period of economic and political uncertainty related to the negotiation of any successor trading arrangement with other countries as well as volatility in exchange rates, risk to supply chains across the European Union, restrictions on the mobility of employees and consumers, or changes to customs duties, tariffs or industry specific requirements and regulations. In addition, any new trade barriers, sanctions, or tariffs could materially adversely affect our operations abroad, such as those proposed during the course of the 2016 U.S. presidential campaign by the current U.S. President regarding Mexico. Our success will depend, in part, on our ability to overcome the challenges we encounter with respect to these risks and other factors affecting U.S. companies with global operations.
12
The more we expand our business globally, the more exchange rate fluctuations relative to the U.S. dollar influence our financial results. In many markets outside the United States, we sell our products and pay for some goods, services, and labor primarily in local currencies. Because our foreign currency revenues exceed our foreign currency expense, we have a net exposure to changes in the value of the U.S. dollar relative to those currencies. Over time, our reported financial results generally will be hurt by a stronger U.S. dollar and improved by a weaker one. For instance, profits from our overseas businesses for fiscal 2017 were adversely affected by the recent strengthening of the U.S. dollar against currencies in our major markets, including the euro, British pound, and Mexican peso. We do not attempt to hedge all of our foreign currency exposure. We may, from time to time, attempt to hedge a portion of our foreign currency exposure through the use of foreign currency derivatives or other means; however, even in those cases, we may not be successful in fully eliminating our foreign currency exposure. For details on how foreign exchange affects our business, see “Item 7A. Quantitative and Qualitative Disclosures about Market Risk – Foreign Exchange.”
National and local governments may adopt regulations or undertake investigations that could limit our business activities or increase our costs.
Our business is subject to extensive regulatory requirements regarding production, exportation, importation, marketing and promotion, labeling, distribution, pricing, and trade practices, among others. Changes in laws, regulatory measures, or governmental policies, or the manner in which current ones are interpreted, could cause us to incur material additional costs or liabilities, and jeopardize the growth of our business in the affected market. For instance, in fiscal 2017, Australia announced the launch of container deposit/recycling schemes, which, when implemented, may impair affordability and convenience at retail. Specifically, governments may prohibit, impose, or increase limitations on advertising and promotional activities, or times or locations where beverage alcohol may be sold or consumed, or adopt other measures that could limit our opportunities to reach consumers or sell our products. In Europe, for example, legislation is pending in a number of countries that would result in significant limitations on the marketing and sale of beverage alcohol. Certain countries historically have banned all television, newspaper, magazine, and internet advertising for beverage alcohol products. Increases in regulation of this nature could substantially reduce consumer awareness of our products in the affected markets and make the introduction of new products more challenging.
Some countries where we do business have a higher risk of corruption than others. While we are committed to doing business in accordance with applicable anti-corruption and other laws, our Code of Conduct, Code of Ethics for Senior Financial Officers, and other Company policies, we remain subject to the risk that an employee will violate our policies, or that any of our many affiliates or agents, such as importers, wholesalers, distributors, or other business partners, may take action determined to be in violation of international trade, money laundering, anti-corruption, or other laws, including the U.S. Foreign Corrupt Practices Act of 1977, the U.K. Bribery Act 2010, or equivalent local laws. Any determination that our operations or activities are not, or were not, in compliance with U.S. or foreign laws or regulations could result in investigations, interruption of business, loss of business partner relationships, suspension or termination of licenses and permits (our own or those of our partners), imposition of fines, legal or equitable sanctions, negative publicity, and management distraction. Further, our compliance with applicable anti-corruption or other laws, our Code of Conduct, Code of Ethics for Senior Financial Officers, and our other policies could result in higher operating costs.
Additional regulation in the United States and other countries addressing climate change, use of water, and other environmental issues could increase our operating costs. Increasing regulation of fuel emissions could increase the cost of energy, including fuel, required to operate our facilities or transport and distribute our products, thereby substantially increasing the production, distribution, and supply chain costs associated with our products.
Tax increases and changes in tax rules could adversely affect our financial results.
Our business is sensitive to changes in both direct and indirect taxes. As a multinational company based in the United States, we are more exposed to the impact of U.S. tax changes than some of our major competitors, especially those that affect the effective corporate income tax rate. Comments made during the course of the 2016 U.S. presidential campaign and since the election indicate that the U.S. federal government may propose changes to international trade agreements, tariffs, taxes, and other government rules and regulations. The current U.S. administration has indicated that tax reform is among its top priorities, and the U.S. Congress is reviewing and may, in the future, propose new tax legislation. Certain tax changes that have been or are currently proposed by the U.S. Congress or the President exemplify this risk, including a repatriation or “transition” tax on foreign earnings; decreasing or eliminating the U.S. manufacturing deduction; changing the rules related to interest deductibility; changing the rules relating to the depreciation of capital expenditures; the imposition of a “border adjustment” tax; or repealing LIFO (last-in, first-out accounting treatment of inventory) for tax purposes. While we cannot predict what changes will actually occur, such changes could affect our business and results of operations.
Our business operations are also subject to numerous duties or taxes that are not based on income, sometimes referred to as “indirect taxes,” which include excise taxes, sales or value-added taxes, property taxes, and payroll taxes. Increases in or the
13
imposition of new indirect taxes on our operations or products would increase the cost of our products or, to the extent levied directly on consumers, make our products less affordable, which could negatively affect our financial results by reducing purchases of our products and encouraging consumers to switch to lower-priced or lower-taxed product categories. For example, certain countries have increased and may continue to increase excise taxes on beverage alcohol products, which could increase the cost of our products to consumers and could reduce consumer demand in those countries. Our global business can also be negatively affected by import and export duties, tariff barriers, and related local governmental protectionist measures, and the suddenness and unpredictability with which these can occur. As governmental entities look for increased sources of revenue, it is possible that they may increase taxes on beverage alcohol products. For example, the United Kingdom recently increased its tax on beer, cider, wine, and spirits by 3.9% with additional increases to come. The United Kingdom’s need to find additional sources of revenue to fund its post-Brexit obligations and, the European Union’s complementary need to find additional sources of revenue to make up for the loss of the United Kingdom’s expected contributions to the European Union’s budget and excise taxes may result in future increased taxes on beverage alcohol products and continued uncertainty as to the impact on taxes and tariffs arising from the decision by the United Kingdom to leave the European Union. New tax rules, accounting standards, or pronouncements, and changes in interpretation of existing ones, could also have a significant adverse effect on our business and financial results. This includes potential changes in tax rules or the interpretation of tax rules arising out of the Base Erosion & Profit Shifting project initiated by the Organization for Economic Co-operation and Development, as well as changes in the interpretation of tax rules arising out of the European Union State Aid investigations.
Our business performance is substantially dependent upon the continued health of the Jack Daniel’s family of brands.
The Jack Daniel’s family of brands is the primary driver of our revenue and growth. Jack Daniel’s is an iconic global trademark with a loyal consumer fan base, and we invest much effort and many resources to protect and preserve the brand’s reputation for quality, craftsmanship, and authenticity. A brand’s reputational value is based in large part on consumer perceptions, and even an isolated incident that causes harm – particularly one resulting in widespread negative publicity – could adversely influence these perceptions and erode consumer trust and confidence in the brand. Significant damage to the brand equity of Jack Daniel’s would adversely affect our business. Given the importance of Jack Daniel’s to our overall success, a significant or sustained decline in volume or selling price of our Jack Daniel’s products would have a negative effect on our growth and our stock price. Additionally, should we not be successful in our efforts to maintain or increase the relevance of the Jack Daniel’s brand in the minds of current and future consumers, our business and operating results could suffer. For details on the importance of the Jack Daniel’s family of brands to our business, see “Item 7. Management’s Discussion and Analysis of Financial Condition and Results of Operations – Results of Operations – Fiscal 2017 Brand Highlights.”
Changes in consumer preferences and purchases, and our ability to anticipate or react to them, could negatively affect our business results.
We are a branded consumer products company in a highly competitive market, and our success depends on our continued ability to offer consumers appealing, high-quality products. Consumer preferences and purchases may shift due to a host of factors, many of which are difficult to predict, including changes in economic conditions, demographic and social trends; public health policies and initiatives; changes in government regulation of beverage alcohol products; the potential legalization of marijuana use on a more widespread basis within the United States or elsewhere; and changes in travel, leisure, dining, gifting, entertaining, and beverage consumption trends. Consumers may begin to shift their consumption and purchases of our premium and super-premium products, more commonly found in on-premise establishments, in favor of off-premise purchases. This includes consumption at home as a result of various factors, including shifts in social trends, proliferation of smoking bans, and stricter laws relating to driving while under the influence of alcohol. Shifts in consumption channels such as these could adversely impact our profitability. Consumers also may begin to prefer the products of competitors or may generally reduce their demand for brands produced by larger companies. Over the past several years, the number of small, local distilleries in the United States has grown significantly. This is being driven by a trend of consumers showing increasing interest in locally produced, regionally sourced products. As many more competitive brands enter the market, it could have a negative impact on the demand for our premium and super-premium American whiskey brands, including Jack Daniel’s. In addition, we could experience unfavorable business results if we fail to attract consumers from diverse backgrounds and ethnicities in the United States and in our non-U.S. markets. Demographic forecasts in the United States for several years after 2017 indicate a slight decrease in the population segment aged 21 to 24; fewer potential consumers in this age bracket could have a negative effect on industry growth rates and our business. To continue to succeed, we must anticipate or react effectively to shifts in demographics, consumer behavior, consumer preferences, drinking tastes, and drinking occasions.
Our plans call for the continued growth of the Jack Daniel’s family of brands. In particular, we plan to continue to grow Jack Daniel’s Tennessee Honey sales globally and to further expand our launch of Jack Daniel’s Tennessee Fire in additional international markets in fiscal 2018. If these plans are unsuccessful, or if we otherwise fail to develop or implement effective business, portfolio, and brand strategies, our growth, stock price, or financial results could suffer. More broadly, if consumers shift away from spirits
14
(particularly brown spirits such as American whiskey and bourbon), our premium-priced brands, or our RTD products, our financial results could be adversely affected.
We believe that new products, line extensions, label and bottle changes, product reformulations, and similar product innovations by both our competitors and us will compete increasingly for consumer drinking occasions. Product innovation, such as our recently announced U.S. launch of Jack Daniel’s Tennessee Rye, is a significant element of our growth strategy; however, there can be no assurance that we will continue to develop and implement successful line extensions, packaging, formulation or flavor changes, or new products. Unsuccessful implementation or short-lived popularity of our product innovations could result in inventory write-offs and other costs, reduction in profits from one year to the next, and also could damage consumers’ perception of the brand family. Our inability to attract consumers to our product innovations relative to our competitors’ products – especially over time – could negatively affect our growth, business, and financial results.
Production facility disruption could adversely affect our business.
Some of our largest brands, including Jack Daniel’s, Finlandia Vodka, and our tequilas, are distilled at single locations. A catastrophic event causing physical damage, disruption, or failure at one of our major distillation or bottling facilities could adversely affect our business. Further, because whiskeys and some tequilas are aged for various periods, we maintain a substantial inventory of aged and maturing products in warehouses at a number of different sites. The loss of a substantial amount of aged inventory – through fire, other natural or man-made disaster, contamination, or otherwise – could significantly reduce the supply of the affected product or products. A consequence of any of these or other supply or supply chain disruptions could result in our inability to meet consumer demand for the affected products for a period of time. In addition, insurance proceeds may be insufficient to cover the replacement value of our inventory of maturing products and other assets if they were to be lost. Disaster recovery plans may not prevent business disruption, and reconstruction of any damaged facilities could require a significant amount of time.
The inherent uncertainty in supply/demand forecasting could adversely affect our business, particularly with respect to our aged products.
There is an inherent risk of forecasting imprecision in determining the quantity of aged and maturing products to produce and hold in inventory in a given year for future sale. The forecasting strategies we use to balance product supply with fluctuations in consumer demand may not be effective for particular years or products. For example, in addition to our whiskeys and some tequilas, which are aged for various periods, our recent acquisitions of The GlenDronach, BenRiach, and Glenglassaugh Scotch whisky brands and distilleries introduce a new category of inventory, which require long term maturation of up to 30 years or more, making forecasts of demand for such products in future periods subject to significant uncertainty. There is an inherent risk of forecasting error in determining the quantity of maturing stock to lay down in a given year for future consumption as a result of changes in business strategy, market demand and preferences, macroeconomic conditions, introductions of competing products, and other changes in market conditions. Any forecasting error could lead to our inability to meet the objectives of our business strategy, future demand, or lead to a future surplus of inventory and consequent write down in value of maturing stocks. If we are unable to accurately forecast demand for our products or efficiently manage its inventory, this may have a material adverse effect on our business and financial results. Further, we cannot be certain that we will be successful in using various levers, such as pricing changes, to create the desired balance of available supply and consumer demand for particular years or products. As a consequence, we may be unable to meet consumer demand for the affected products for a period of time. Furthermore, not having our products in the market on a consistent basis may adversely affect our brand equity and future sales.
Higher costs or unavailability of materials could adversely affect our financial results, as could our inability to obtain certain finished goods or to sell used materials.
Our products use materials and ingredients that we purchase from suppliers. Our ability to make and sell our products depends upon the availability of the raw materials, product ingredients, finished products, wood, glass and PET bottles, cans, bottle closures, packaging, and other materials used to produce and package them. Without sufficient quantities of one or more key materials, our business and financial results could suffer. For instance, only a few glass producers make bottles on a scale sufficient for our requirements, and a single producer supplies most of our glass requirements. In addition, if we were to experience a disruption in the supply of American oak logs to produce the new charred oak barrels in which we age our whiskeys, our production capabilities would be compromised. If any of our key suppliers were no longer able to meet our timing, quality, or capacity requirements, ceased doing business with us, or significantly raised prices, and we could not promptly develop alternative cost-effective sources of supply or production, our operations and financial results could suffer.
Higher costs or insufficient availability of suitable grain, agave, water, grapes, wood, glass, closures, and other input materials, or higher associated labor costs or insufficient availability of labor, may adversely affect our financial results because we may not be able to pass along such cost increases or the cost of such shortages through higher prices to customers without reducing demand or sales. Similarly, when energy costs rise, our transportation, freight, and other operating costs, such as distilling and bottling
15
expenses, also may increase. Our financial results may be adversely affected if we are not able to pass along energy cost increases through higher prices to our customers without reducing demand or sales.
Weather, the effects of climate change, diseases, and other agricultural uncertainties that affect the mortality, health, yield, quality, or price of the various raw materials used in our products also present risks for our business, including in some cases potential impairment in the recorded value of our inventory. Changes in weather patterns or intensity can disrupt our supply chain as well, which may affect production operations, insurance costs and coverage, and the timely delivery of our products.
Water is an essential component of our products, so the quality and quantity of available water is important to our ability to operate our business. If droughts become more common or severe, or if our water supply were interrupted for other reasons, high-quality water could become scarce in some key production regions for our products, including Tennessee, Kentucky, California, Finland, Canada, Mexico, Scotland, and Ireland.
Our ability to sell used materials for reuse may be affected by fluctuations in the market. For example, weaker demand from blended Scotch industry buyers, lower prices, and increased supply of used barrels may make it increasingly difficult to sell our used barrels at sustainable prices which could negatively affect our financial results.
If the social acceptability of our products declines, or governments adopt policies disadvantageous to beverage alcohol, our business could be adversely affected.
Our ability to market and sell our products depends heavily on societal attitudes toward drinking and governmental policies that both flow from and affect those attitudes. In recent years, increased social and political attention has been directed at the beverage alcohol industry. For example, there remains continued attention focused largely on public health concerns related to alcohol abuse, including drunk driving, underage drinking, and the negative health impacts of the abuse and misuse of beverage alcohol. While most people who drink enjoy alcoholic beverages in moderation, it is commonly known and well reported that excessive levels or inappropriate patterns of drinking can lead to increased risk of a range of health conditions and, for certain people, can result in alcohol dependence. Some academics, public health officials, and critics of the alcohol industry in the United States, Europe, and other parts of the world continue to seek governmental measures to make beverage alcohol more expensive, less available, or more difficult to advertise and promote. If future high-quality scientific research indicated more widespread serious health risks associated with alcohol consumption – particularly with moderate consumption – or if for any reason the social acceptability of beverage alcohol were to decline significantly, sales of our products could decrease.
Significant additional labeling or warning requirements or limitations on the availability of our products could inhibit sales of affected products.
Various jurisdictions have adopted or may seek to adopt significant additional product labeling or warning requirements or limitations on the availability of our products relating to the content or perceived adverse health consequences of some of our products. Several such labeling regulations or laws require warnings on any product with substances that the state lists as potentially associated with cancer or birth defects. Our products already raise health and safety concerns for some regulators, and heightened requirements could be imposed. If additional or more severe requirements of this type become applicable to one or more of our major products under current or future health, environmental, or other laws or regulations, they could inhibit sales of such products.
We face substantial competition in our industry, including many new entrants into spirits and consolidation among beverage alcohol producers, wholesalers, and retailers, and changes to our route-to-consumer model, could hinder the marketing, sale, or distribution of our products.
We use different business models to market and distribute our products in different countries around the world. In the United States, we sell our products either to distributors for resale to retail outlets or, in those states that control alcohol sales, to state governments who then sell them to retail customers and consumers. In our non-U.S. markets, we use a variety of route-to-consumer models – including, in many markets, reliance on others to market and sell our products. Consolidation among spirits producers, distributors, wholesalers, suppliers, or retailers could create a more challenging competitive landscape for our products. Consolidation at any level could hinder the distribution and sale of our products as a result of reduced attention and resources allocated to our brands both during and after transition periods, because our brands might represent a smaller portion of the new business portfolio. Expansion into new product categories by other suppliers, or innovation by new entrants into the market, could increase competition in our product categories. For example, we are experiencing increased competition for some of our products from new entrants in the small-batch or craft spirits category.
Changes to our route-to-consumer models or partners in important markets could result in temporary or longer-term sales disruption, could result in higher costs, and could negatively affect other business relationships we might have with that partner. Disruption of our distribution network or fluctuations in our product inventory levels at distributors, wholesalers, or retailers could negatively affect our results for a particular period. Further, while we believe we have sufficient scale to succeed relative to our
16
major competitors, we nevertheless face a risk that continuing consolidation of large beverage alcohol companies could put us at a competitive disadvantage.
Our competitors may respond to industry and economic conditions more rapidly or effectively than we do. Other suppliers, as well as wholesalers and retailers of our brands, offer products that compete directly with ours for shelf space, promotional displays, and consumer purchases. Pricing (including price promotions, discounting, couponing, and free goods), marketing, new product introductions, entry into our distribution networks, and other competitive behavior by other suppliers, and by wholesalers and retailers, could adversely affect our sales, margins, and business and financial results. While we seek to take advantage of the efficiencies and opportunities that large retail customers can offer, they often seek lower pricing and purchase volume flexibility, offer competing own-label products, and represent a large number of other competing products. If the buying power of these large retail customers continues to increase, it could negatively affect our financial results.
We might not succeed in our strategies for acquisitions and dispositions.
From time to time, we acquire or invest in additional brands or businesses. We expect to continue to seek acquisition and investment opportunities that we believe will increase long-term shareholder value, but we may not be able to find and purchase brands or businesses at acceptable prices and terms. Acquisitions involve risks and uncertainties, including potential difficulties integrating acquired brands and personnel; the possible loss of key customers or employees most knowledgeable about the acquired business; implementing and maintaining consistent U.S. public company standards, controls, procedures, policies, and information systems; exposure to unknown liabilities; business disruption; and management distraction. Acquisitions, investments, or joint ventures could also lead us to incur additional debt and related interest expenses, issue additional shares, become exposed to contingent liabilities, and lead to dilution in our earnings per share and reduction in our return on average invested capital. We could incur future restructuring charges or record impairment losses on the value of goodwill or other intangible assets resulting from previous acquisitions, which may also negatively affect our financial results.
We also evaluate from time to time the potential disposition of assets or businesses that may no longer meet our growth, return, or strategic objectives. In selling assets or businesses, we may not get prices or terms as favorable as we anticipated. We could also encounter difficulty in finding buyers on acceptable terms in a timely manner, which could delay our accomplishment of strategic objectives. Expected cost savings from reduced overhead relating to the sold assets may not materialize, and the overhead reductions could temporarily disrupt our other business operations. Any of these outcomes could negatively affect our financial results.
Counterfeiting or inadequate protection of our intellectual property rights could adversely affect our business prospects.
Our brand names, trademarks, and related intellectual property rights are critical assets, and our business depends on our protecting them on-line and in the countries where we do business. We may be unsuccessful in protecting our intellectual property rights in a given market or in challenging those who infringe our rights or imitate or counterfeit our products. Although we believe that our intellectual property rights are legally protected in the markets in which we do business, the ability to register and enforce intellectual property rights varies from country to country. In some countries, for example, it may be more difficult to successfully stop counterfeiting or look-alike products, either because the law is inadequate or because of judicial or administrative decisions that are arbitrary or unjust. We may not be able to register our trademarks in every country where we want to sell a particular product, and we may not obtain favorable decisions by courts or trademark offices.
Many global spirits brands, including some of our brands, experience problems with product counterfeiting and other forms of trademark infringement. We combat counterfeiting by working with other spirits industry companies through our membership in the International Federation of Spirits Producers (IFSP) and with brand owners in other industries via our membership in an organization called React. While we believe IFSP and React are effective organizations, they are not active in every market, and their efforts are subject to obtaining the cooperation of local authorities and courts in the markets where they are active. Despite the efforts of IFSP, React and our own teams, lower-quality and counterfeit products that could be harmful to consumers could reach the market and adversely affect our intellectual property rights, brand equity, corporate reputation, and financial results. In addition, the industry as a whole could suffer negative effects related to the manufacture, sale, and consumption of illegally produced beverage alcohol.
Product recalls or other product liability claims could materially and adversely affect our sales.
The success of our brands depends upon the positive image that consumers have of those brands. We could decide to, or be required to, recall products due to suspected or confirmed product contamination, product tampering, spoilage, or other quality issues. Any of these events could adversely affect our sales. Actual contamination, whether deliberate or accidental, could lead to inferior product quality and even illness, injury, or death to consumers, potential liability claims, and material loss. Should a product recall become necessary, or we voluntarily recall a product in the event of contamination, damage, or other quality issue, sales of
17
the affected product or our broader portfolio of brands could be adversely affected. A significant product liability judgment or widespread product recall may negatively impact the sales and business and financial results of the affected brand or brands. Even if a product liability claim is unsuccessful or is not fully pursued, resulting negative publicity could adversely affect our reputation with existing and potential customers and our corporate and brand image.
Litigation and legal disputes could expose our business to financial and reputational risk.
Major private or governmental litigation challenging the production, marketing, promotion, distribution, or sale of beverage alcohol or specific brands could affect our ability to sell our products. Because litigation and other legal proceedings can be costly to defend, even actions that are ultimately decided in our favor could have a negative impact on our business reputation or financial results. Lawsuits have been brought against beverage alcohol companies alleging problems related to alcohol abuse, negative health consequences from drinking, problems from alleged marketing or sales practices, and underage drinking. While these lawsuits have been largely unsuccessful in the past, others may succeed in the future. We could also experience employment-related class actions, environmental claims, commercial disputes, product liability actions stemming from a beverage or container production defect, a whistleblower suit, or other major litigation that could adversely affect our business results, particularly if there is negative publicity or to the extent the losses or expenses were not covered by insurance.
Governmental actions around the world to enforce trade practice, anti-money laundering, anti-corruption, competition, tax, environmental, and other laws are also a continuing compliance risk for global companies such as ours. In addition, as a U.S. public company, we are exposed to the risk of securities-related class action suits, particularly following a precipitous drop in the share price of our stock. Adverse developments in major lawsuits concerning these or other matters could result in management distraction and have a material adverse effect on our business.
A failure or corruption of one or more of our key information technology systems, networks, processes, associated sites, or service providers could have a material adverse impact on our business.
We rely on information technology (IT) systems, networks, and services, including internet sites, data hosting and processing facilities and tools, hardware (including laptops and mobile devices), software, and technical applications and platforms, some of which are managed, hosted, provided, or used by third parties or their vendors, to help us manage our business. The various uses of these IT systems, networks, and services include, but are not limited to: hosting our internal network and communication systems; ordering and managing materials from suppliers; supply/demand planning; production; shipping products to customers; hosting our branded websites and marketing products to consumers; collecting and storing customer, consumer, employee, investor, and other data; processing transactions; summarizing and reporting results of operations; hosting, processing, and sharing confidential and proprietary research, business plans, and financial information; complying with regulatory, legal, or tax requirements; providing data security; and handling other processes necessary to manage our business.
Increased IT security threats and more sophisticated cyber crimes pose a potential risk to the security and availability of our IT systems, networks, and services, including those that are managed, hosted, provided, or used by third parties, as well as the confidentiality, availability, and integrity of our data. If the IT systems, networks, or service providers we rely upon fail to function properly, or if we suffer a loss or disclosure of business or other sensitive information, due to any number of causes, ranging from catastrophic events to power outages to security breaches, and our business continuity plans do not effectively and timely address these failures, we may suffer interruptions in our ability to manage operations and reputational, competitive, or business harm, which may adversely affect our business operations or financial results. In addition, such events could result in unauthorized disclosure of material confidential information, and we may suffer financial and reputational damage because of lost or misappropriated confidential information belonging to us or to our partners, our employees, customers, suppliers, or consumers. In any of these events, we could also be required to spend significant financial and other resources to remedy the damage caused by a security breach or to repair or replace networks and IT systems, which, in any case, could require a significant amount of time.
Negative publicity could affect our stock price and business performance.
Unfavorable publicity, whether accurate or not, related to our industry or to us or our brands, marketing, personnel, operations, business performance, or prospects could negatively affect our corporate reputation, stock price, ability to attract high-quality talent, or the performance of our business. Adverse publicity or negative commentary on social media outlets, particularly any that go “viral,” could cause consumers to react by avoiding our brands or choosing brands offered by our competitors, which could materially negatively affect our financial results.
18
Our failure to attract or retain key executive or employee talent could adversely affect our business.
Our success depends upon the efforts and abilities of our senior management team, other key employees, and a high-quality employee base, as well as our ability to attract, motivate, reward, and retain them. Difficulties in hiring or retaining key executive or other employee talent, or the unexpected loss of experienced employees, could have an adverse impact on our business performance.
The Brown family has the ability to control the outcome of matters submitted for stockholder approval.
We are considered a “controlled company” under New York Stock Exchange rules. Controlled companies are exempt from New York Stock Exchange listing standards that require a board composed of a majority of independent directors, a fully independent nominating/corporate governance committee, and a fully independent compensation committee. We avail ourselves of the exemptions from having a board composed of a majority of independent directors and a fully independent nominating/corporate governance committee. Notwithstanding the available exemption, our Compensation Committee is composed exclusively of independent directors. As a result of our use of some “controlled company” exemptions, our corporate governance practices differ from those of non-controlled companies, which are subject to all of the New York Stock Exchange corporate governance requirements.
A substantial majority of our voting stock is controlled by members of the Brown family, and collectively, they have the ability to control the outcome of stockholder votes, including the election of all of our directors and the approval or rejection of any merger, change of control, or other significant corporate transactions. We believe that having a long-term-focused, committed, and engaged shareholder base provides us with an important strategic advantage, particularly in a business with aged products and multi-generational brands. This advantage could be eroded or lost, however, should Brown family members cease, collectively, to be controlling stockholders of the Company. We desire to remain independent and family-controlled, and we believe the Brown family stockholders share these interests. However, the Brown family’s interests may not always be aligned with other stockholders’ interests. By exercising their control, the Brown family could cause the Company to take actions that are at odds with the investment goals of institutional, short-term, non-voting, or other non-controlling investors, or that have a negative effect on our stock price.
Item 1B. Unresolved Staff Comments
None.
19
Item 2. Properties
Our company-owned production facilities include distilleries, a winery, a concentrate plant, bottling plants, warehousing operations, sawmills, and cooperages. We also have agreements with other parties for contract production in Australia, Belgium, Brazil, China, Estonia, Finland, Ireland, Mexico, the Netherlands, South Africa, and the United States.
In addition to our company-owned corporate offices in Louisville, Kentucky, we lease office space for use in our sales, marketing, and administrative operations in the United States and in over 40 other cities around the globe. The lease terms expire at various dates and are generally renewable. Our most significant office locations outside Louisville are:
• | United States: Irvine, California; Irving, Texas; Atlanta, Georgia; Baltimore, Maryland; and Washington, D.C. |
• | International: Guadalajara, Mexico; Hamburg, Germany; Sydney, Australia; London, United Kingdom; Warsaw, Poland; Paris, France; Prague, Czech Republic; São Paulo, Brazil; Mexico City, Mexico; Barcelona, Spain; Moscow, Russia; Istanbul, Turkey; Tokyo, Japan; Amsterdam, Netherlands; Seoul, South Korea; Shanghai, China; Hong Kong; Gurgaon, India; Cape Town, South Africa; and Dubai, United Arab Emirates. |
Significant Properties | ||
Location | Principal Activities | Notes |
United States: | ||
Louisville, Kentucky | Corporate offices | Includes several renovated historic structures |
Distilling, bottling, warehousing | ||
Cooperage | Brown-Forman Cooperage | |
Visitors’ center | Future home of Old Forester | |
Lynchburg, Tennessee | Distilling, bottling, warehousing | Home of Jack Daniel’s |
Visitors’ center | ||
Woodford County, Kentucky | Distilling, bottling, warehousing | Home of Woodford Reserve |
Visitors’ center | ||
Windsor, California | Vineyards, winery, bottling, warehousing | Home of Sonoma-Cutrer |
Visitors’ center | ||
Decatur, Alabama | Cooperage | Jack Daniel Cooperage |
Clifton, Tennessee | Stave and heading mill | |
Stevenson, Alabama | Stave and heading mill | |
Spencer, Indiana | Stave and heading mill | |
Jackson, Ohio | Stave and heading mill | Land is leased from a third party |
International: | ||
Collingwood, Canada | Distilling, warehousing | Home of Canadian Mist |
Cour-Cheverny, France | Distilling, bottling, warehousing | Home of Chambord |
Amatitán, Mexico | Distilling, bottling, warehousing | Home of our tequilas and New Mix RTDs |
Visitors’ center | ||
Slane, Ireland | Distilling | Future home of Slane Irish Whiskey |
Visitors’ center | ||
Aberdeenshire, Scotland | Distilling, warehousing | Home of Glendronach |
Visitors’ center | ||
Morayshire, Scotland | Distilling, warehousing | Home of BenRiach |
Newbridge, Scotland | Bottling | |
Portsoy, Scotland | Distilling, warehousing | Home of Glenglassaugh |
Visitors’ center | ||
We believe that our facilities are in good condition and are adequate for our business.
20
Item 3. Legal Proceedings
We operate in a litigious environment and we are sued in the normal course of business. We do not anticipate that any currently pending suits will have, individually or in the aggregate, a material adverse effect on our financial position, results of operations, or liquidity.
Item 4. Mine Safety Disclosures
Not applicable.
21
PART II
Item 5. Market for the Registrant’s Common Equity, Related Stockholder Matters, and Issuer Purchases of Equity Securities
Our Class A and Class B common stock is traded on the New York Stock Exchange under the symbols “BFA” and “BFB,” respectively. As of May 31, 2017, there were 2,673 holders of record of Class A common stock and 4,880 holders of record of Class B common stock. Because of overlapping ownership between classes, as of May 31, 2017, we had only 5,529 distinct common stockholders of record.
The following table presents, for the periods indicated, the high and low sales prices per share for our Class A and Class B common stock, as reported on the New York Stock Exchange composite index, and dividend per share information:
Fiscal 2016 | Fiscal 2017 | |||||||||||||||||||||||||||||||||||||||
First Quarter | Second Quarter | Third Quarter | Fourth Quarter | Year | First Quarter | Second Quarter | Third Quarter | Fourth Quarter | Year | |||||||||||||||||||||||||||||||
Market price per share: | ||||||||||||||||||||||||||||||||||||||||
Class A high | $ | 59.75 | $ | 61.15 | $ | 58.77 | $ | 56.12 | $ | 61.15 | $ | 54.28 | $ | 54.45 | $ | 49.32 | $ | 50.05 | $ | 54.45 | ||||||||||||||||||||
Class A low | 46.55 | 52.94 | 49.75 | 50.20 | 46.55 | 50.78 | 47.00 | 45.62 | 46.36 | 45.62 | ||||||||||||||||||||||||||||||
Class B high | 54.21 | 55.41 | 53.44 | 51.70 | 55.41 | 50.40 | 51.06 | 47.04 | 48.95 | 51.06 | ||||||||||||||||||||||||||||||
Class B low | 45.33 | 47.61 | 45.30 | 46.63 | 45.30 | 46.95 | 44.66 | 43.96 | 45.01 | 43.96 | ||||||||||||||||||||||||||||||
Cash dividends per share: | ||||||||||||||||||||||||||||||||||||||||
Declared | 0.3150 | — | 0.3400 | — | 0.6550 | 0.3400 | — | 0.3650 | — | 0.7050 | ||||||||||||||||||||||||||||||
Paid | 0.1575 | 0.1575 | 0.1700 | 0.1700 | 0.6550 | 0.1700 | 0.1700 | 0.1825 | 0.1825 | 0.7050 | ||||||||||||||||||||||||||||||
Note: Amounts have been adjusted for a 2-for-1 stock split that occurred in August 2016.
Equity Compensation Plan Information
The following table summarizes information as of April 30, 2017, about our equity compensation plans under which we have made grants of stock options, stock appreciation rights, restricted stock, market value units, performance units, or other equity awards.
Plan Category | Number of Securities to Be Issued Upon Exercise of Outstanding Options, Warrants and Rights1 | Weighted-Average Exercise Price of Outstanding Options, Warrants and Rights2 | Number of Securities Remaining Available for Future Issuance Under Equity Compensation Plans | ||||
Equity compensation plans approved by Class A common stockholders | 2,393,482 | $32.17 | 12,710,672 | ||||
1Includes 2,186,226 Class B common shares to be issued upon exercise of stock-settled stock appreciation rights (SSARs); 79,080 Class B common restricted stock units (RSUs); 86,549 Class A common deferred stock units (DSUs); and 41,627 Class B common DSUs issued under the Brown-Forman 2004 or 2013 Omnibus Compensation Plans. Does not include issued shares of performance-based restricted stock. SSARs are exercisable for an amount of our common stock with a value equal to the increase in the fair market value of the common stock from the date the SSARs were granted. The fair market value of our common stock at fiscal year-end has been used for the purposes of reporting the number of shares to be issued upon exercise of the 6,615,257 SSARs outstanding at fiscal year-end.
2RSUs and DSUs have no exercise price because their value depends on continued employment or service over time, and are to be settled for shares of Class B common stock. Accordingly, these have been disregarded for purposes of computing the weighted-average exercise price.
22
Stock Performance Graph
The graph below compares the cumulative total shareholder return of our Class B common stock for the last five years with the Standard & Poor’s 500 Stock Index, the Dow Jones U.S. Consumer Goods Index, and the Dow Jones U.S. Food & Beverage Index. The information presented assumes an initial investment of $100 on April 30, 2012, and that all dividends were reinvested. The cumulative returns shown represent the value that these investments would have had on April 30 in the years since 2012.
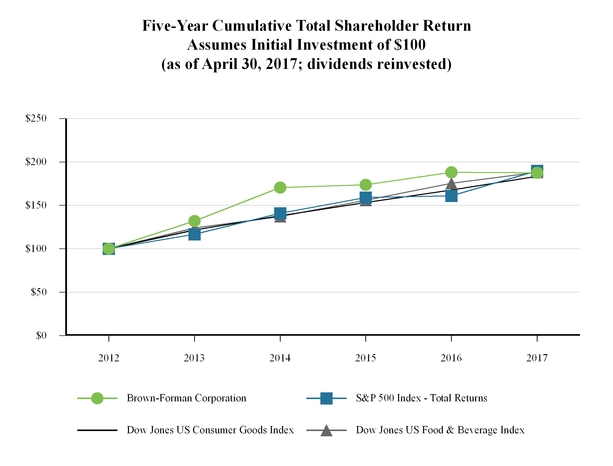
23
Item 6. Selected Financial Data
This selected financial data should be read in conjunction with “Item 7. Management’s Discussion and Analysis of Financial Condition and Results of Operations” and our Consolidated Financial Statements and the accompanying Notes contained in “Item 8. Financial Statements and Supplementary Data.”
(Dollars in millions, except per share amounts) | |||||||||||||||||||||
2008 | 2009 | 2010 | 2011 | 2012 | 2013 | 2014 | 2015 | 2016 | 2017 | ||||||||||||
For Year Ended April 30: | |||||||||||||||||||||
Sales | $ | 3,282 | 3,192 | 3,226 | 3,404 | 3,614 | 3,784 | 3,946 | 4,096 | 4,011 | 3,857 | ||||||||||
Excise taxes | $ | 700 | 711 | 757 | 818 | 891 | 935 | 955 | 962 | 922 | 863 | ||||||||||
Net sales | $ | 2,582 | 2,481 | 2,469 | 2,586 | 2,723 | 2,849 | 2,991 | 3,134 | 3,089 | 2,994 | ||||||||||
Gross profit | $ | 1,695 | 1,577 | 1,611 | 1,724 | 1,795 | 1,955 | 2,078 | 2,183 | 2,144 | 2,021 | ||||||||||
Operating income | $ | 685 | 661 | 710 | 855 | 788 | 898 | 971 | 1,027 | 1,533 | 989 | ||||||||||
Net income | $ | 440 | 435 | 449 | 572 | 513 | 591 | 659 | 684 | 1,067 | 669 | ||||||||||
Weighted average shares used to calculate earnings per share | |||||||||||||||||||||
– Basic | 459.2 | 451.4 | 443.5 | 436.8 | 429.1 | 426.7 | 426.9 | 423.2 | 406.0 | 387.7 | |||||||||||
– Diluted | 463.2 | 454.1 | 445.7 | 439.5 | 432.2 | 430.0 | 430.2 | 426.2 | 408.6 | 390.5 | |||||||||||
Earnings per share from continuing operations | |||||||||||||||||||||
– Basic | $ | 0.96 | 0.96 | 1.01 | 1.31 | 1.20 | 1.38 | 1.54 | 1.62 | 2.63 | 1.72 | ||||||||||
– Diluted | $ | 0.95 | 0.96 | 1.01 | 1.30 | 1.19 | 1.37 | 1.53 | 1.60 | 2.61 | 1.71 | ||||||||||
Gross margin | 65.6 | % | 63.5 | % | 65.3 | % | 66.7 | % | 65.9 | % | 68.6 | % | 69.5 | % | 69.7 | % | 69.4 | % | 67.5 | % | |
Operating margin | 26.5 | % | 26.6 | % | 28.8 | % | 33.1 | % | 29.0 | % | 31.5 | % | 32.5 | % | 32.8 | % | 49.6 | % | 33.0 | % | |
Effective tax rate | 31.7 | % | 31.1 | % | 34.1 | % | 31.0 | % | 32.5 | % | 31.7 | % | 30.5 | % | 31.7 | % | 28.3 | % | 28.3 | % | |
Average invested capital | $ | 2,747 | 2,893 | 2,825 | 2,711 | 2,803 | 2,834 | 3,131 | 3,196 | 3,221 | 3,680 | ||||||||||
Return on average invested capital | 17.2 | % | 15.9 | % | 16.6 | % | 21.8 | % | 19.1 | % | 21.7 | % | 21.6 | % | 22.0 | % | 34.1 | % | 19.3 | % | |
Cash flow from operations | $ | 534 | 491 | 545 | 527 | 516 | 537 | 649 | 608 | 524 | 639 | ||||||||||
Cash dividends declared per common share | $ | 0.343 | 0.373 | 0.392 | 0.747 | 0.447 | 2.488 | 0.545 | 0.605 | 0.655 | 0.705 | ||||||||||
Dividend payout ratio | 35.8 | % | 38.9 | % | 38.7 | % | 57.0 | % | 37.4 | % | 179.8 | % | 35.3 | % | 37.5 | % | 25.0 | % | 40.9 | % | |
As of April 30: | |||||||||||||||||||||
Total assets | $ | 3,405 | 3,475 | 3,383 | 3,712 | 3,477 | 3,626 | 4,103 | 4,188 | 4,183 | 4,625 | ||||||||||
Long-term debt | $ | 417 | 509 | 508 | 504 | 503 | 997 | 997 | 743 | 1,230 | 1,689 | ||||||||||
Total debt | $ | 1,006 | 999 | 699 | 759 | 510 | 1,002 | 1,005 | 1,183 | 1,501 | 2,149 | ||||||||||
Notes:
1. | Includes the results of our Hopland-based wine brands, which were sold in April 2011 but retained in our portfolio as agency brands through December 2011. Includes the results of Southern Comfort and Tuaca, both of which were sold in March 2016. Includes the results of BenRiach since its acquisition in June 2016. |
2. | Weighted average shares, earnings per share, and cash dividends declared per common share have been adjusted for a 5-for-4 stock split in October 2008, a 3-for-2 stock split in August 2012, and a 2-for-1 stock split that occurred in August 2016. |
3. | See “Item 7. Management’s Discussion and Analysis of Financial Condition and Results of Operation – Non-GAAP Financial Measures” for details on our use of “return on average invested capital,” including how we calculate this measure and why we think this information is useful to readers. |
4. | Cash dividends declared per common share include special cash dividends of $0.333 per share in fiscal 2011 and $2.00 per share in fiscal 2013. |
5. | We define dividend payout ratio as cash dividends divided by net income. |
6. | Results for fiscal 2016 include a gain of $485 million on the sale of Southern Comfort and Tuaca. See “Item 7. Management’s Discussion and Analysis of Financial Condition and Results of Operations” for additional information about the impact of that sale on our operating results for fiscal 2016. |
24
Item 7. Management’s Discussion and Analysis of Financial Condition and Results of Operations
Introduction
This Management’s Discussion and Analysis of Financial Condition and Results of Operations (MD&A) is intended to help the reader better understand Brown-Forman, our operations, our financial results, and our current business environment. Please read the MD&A in conjunction with our Consolidated Financial Statements and the accompanying Notes contained in “Item 8. Financial Statements and Supplementary Data.” All per share amounts have been adjusted for the 2-for-1 stock split that occurred in August 2016. See Note 11 to the accompanying financial statements for details. Our MD&A is organized as follows:
Table of Contents | |
Page | |
Presentation basis. This MD&A reflects the basis of presentation described in Note 1 “Accounting Policies”. In addition, we define statistical and non-GAAP financial measures that we believe help readers understand our results of operations and the trends affecting our business. | |
Significant developments. We discuss developments during the most recent three fiscal years. Please read this section in conjunction with “Item 1. Business”, which provides a general description of our business and strategy. | |
Executive summary. We discuss (a) fiscal 2017 highlights and (b) our outlook for fiscal 2018, including the trends, developments, and uncertainties that we expect to affect our business. | |
Results of operations. We discuss (a) fiscal 2017 results for our largest markets, (b) fiscal 2017 results for our largest brands, and (c) the causes of year-over-year changes in our income statement line items, including transactions and other items that affect the comparability of our results, for fiscal years 2016 and 2017. | |
Liquidity and Capital Resources. We discuss (a) the causes of year-over-year changes in cash flows from operating activities, investing activities, and financing activities; (b) recent and expected future capital expenditures; (c) dividends and share repurchases; and (d) our liquidity position, including capital resources available to us. | |
Off-Balance Sheet Arrangements and Long-term Obligations. | |
Critical accounting policies and estimates. We discuss the critical accounting policies and estimates that require significant management judgment. | |
Presentation Basis
Volume and Depletions
When discussing volume, unless otherwise specified, we refer to “depletions,” a term commonly used in the beverage alcohol industry. Depending on the context, “depletions” means either (a) our shipments directly to retailers or wholesalers, or (b) shipments from our distributor customers to retailers and wholesalers. We generally record revenues when we ship our products to our customers, so our reported sales for a period do not necessarily reflect actual consumer purchases during that period. We believe that our depletions measure volume in a way that more closely reflects consumer demand than our shipments to distributor customers do.
Volume is discussed on a nine-liter equivalent unit basis (nine-liter cases) unless otherwise specified. At times, we use a “drinks-equivalent” measure for volume when comparing single-serve ready-to-drink (RTD) or ready-to-pour (RTP) brands to a parent spirits brand. “Drinks-equivalent” depletions are RTD and RTP nine-liter cases converted to nine-liter cases of a parent brand on the basis of the number of drinks in one nine-liter case of the parent brand. To convert RTD volumes from a nine-liter case basis to a drinks-equivalent nine-liter case basis, RTD nine-liter case volumes are divided by 10, while RTP nine-liter case volumes are divided by 5.
Non-GAAP Financial Measures
We use certain financial measures in this report that are not measures of financial performance under GAAP. These non-GAAP measures, defined below, should be viewed as supplements to (not substitutes for) our results of operations and other measures reported under GAAP. The non-GAAP measures we use in this report may not be defined and calculated by other companies in the same manner.
“Underlying change” in income statement measures. We present changes in certain income statement measures, or line items, that are adjusted to an “underlying” basis. We use “underlying change” for the following income statement measures: (a) underlying net sales, (b) underlying cost of sales, (c) underlying gross profit, (d) underlying advertising expenses, (e) underlying selling, general, and administrative (SG&A) expenses, and (f) underlying operating income. To calculate these measures, we adjust, as
25
applicable, for (a) acquisition and divestiture activity, (b) foreign exchange, and (c) estimated net changes in distributor inventories. We explain these adjustments below.
• | “Acquisitions and divestitures.” In fiscal 2016, we sold our Southern Comfort and Tuaca brands and related assets to Sazerac Company, Inc. In fiscal 2017, we acquired The BenRiach Distillery Company Limited (BenRiach). See discussion below and Notes 16 and 17 in the accompanying financial statements for details. This adjustment removes (a) transaction-related costs for the acquisition and divestiture, (b) the gain on the sale of Southern Comfort and Tuaca, and (c) operating activity for the acquisition and divestiture for the non-comparable periods. With respect to comparisons of fiscal 2016 to fiscal 2015, the non-comparable period comprised March and April; with respect to comparisons of fiscal 2017 to fiscal 2016, the non-comparable period comprised all months. We believe that these adjustments allow us to understand better our underlying results on a comparable basis. |
• | “Foreign exchange.” We calculate the percentage change in our income statement line items in accordance with GAAP and adjust to exclude the cost or benefit of currency fluctuations. Adjusting for foreign exchange allows us to understand our business on a constant-dollar basis, as fluctuations in exchange rates can distort the underlying trend both positively and negatively. (In this report, “dollar” always means the U.S. dollar unless stated otherwise.) To eliminate the effect of foreign exchange fluctuations when comparing across periods, we translate current year results at prior-year rates. |
• | “Estimated net change in distributor inventories.” This adjustment refers to the estimated net effect of changes in distributor inventories on changes in our income statement line items. For each period compared, we use depletion information provided by our distributors to estimate the effect of distributor inventory changes on our income statement line items. We believe that adjusting for the effect of varying levels of distributor inventories on changes in our income statement line items allows us to understand better underlying results and trends. |
We use the non-GAAP measures “underlying change” for the following reasons: (a) to understand our performance from period to period on a consistent basis and to compare our performance to that of our competitors; (b) in connection with management incentive compensation calculations; (c) in our planning and forecasting processes; and (d) in communications concerning our financial performance with the board of directors, stockholders, and investment analysts. We provide reconciliations of the “underlying changes in income statement measures” to their nearest GAAP measures in the tables below under “Results of Operations - Year-Over-Year Comparisons.” We have consistently applied the adjustments within our reconciliations in arriving at each non-GAAP measure.
“Return on average invested capital.” This measure refers to the sum of net income and after-tax interest expense, divided by average invested capital. Average invested capital equals assets less liabilities, excluding interest-bearing debt, and is calculated using the average of the most recent 13 month-end balances. After-tax interest expense equals interest expense multiplied by one minus our effective tax rate. We use this non-GAAP measure because we consider return on average invested capital to be a meaningful indicator of how effectively and efficiently we use capital invested in our business.
“Adjusted” measures for (a) operating income, (b) operating margin, (c) effective tax rate, (d) diluted earnings per share, and (e) return on average invested capital. These measures remove the effects of (a) the gain on the sale of Southern Comfort and Tuaca, (b) those transaction-related costs not included in the gain on sale of Southern Comfort and Tuaca, (c) financing-related costs for the acquisition of BenRiach, and (d) operating activity for the acquired and divested businesses in the non-comparable periods. With respect to the comparison of fiscal 2017 to fiscal 2016, the non-comparable period comprised all months of both years. Tax effects on relevant adjustments are calculated consistent with the nature of the underlying transaction. We provide these adjusted measures to identify the effect of the sale of Southern Comfort and Tuaca and the acquisition of BenRiach on reported income from operations and other key measures derived therefrom; adjusting for these effects allows us to analyze results and trends on a comparable basis.
We reconcile each of these measures to their nearest GAAP measures in the table below under “Item 7. Management’s Discussion and Analysis of Financial Condition and Results of Operations – Executive Summary.” We have consistently applied the adjustments within our reconciliations in arriving at each non-GAAP measure.
Significant Developments
Below we discuss the significant developments in our business during fiscal 2015, fiscal 2016, and fiscal 2017. These developments relate to (a) innovation, (b) acquisitions and divestitures, and (c) capital deployment.
Innovation
• | Jack Daniel’s family of brands. Following the successful launch and subsequent global rollout of Jack Daniel’s Tennessee Honey (JDTH) starting in fiscal 2011, we introduced a second flavored whiskey product, Jack Daniel’s Tennessee Fire (JDTF), |
26
starting with the United States in late fiscal 2015. In fiscal 2016, we completed the U.S. launch and continued the global rollout of JDTF. In fiscal 2017, we expanded JDTF to markets including France, Germany, and Travel Retail. The chart below shows the volume development of JDTF from fiscal 2015 through fiscal 2017.
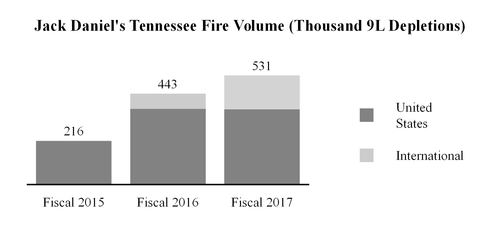
• | Other American whiskeys. We continue to capitalize on consumers’ interest in high-quality, super- and ultra-premium whiskey with our range of brands including Woodford Reserve and Old Forester. |
◦ | In fiscal 2015, we launched Woodford Reserve Rye Whiskey. In fiscal 2017, we unveiled new packaging for Woodford Reserve Double Oaked, the most successful line extension from Woodford Reserve to date (first introduced in 2012). The Rye and Double Oaked variants of Woodford Reserve continued to contribute meaningfully to the brand’s growth and collectively surpassed 50 thousand nine-liter cases in fiscal 2017. |
◦ | In February 2017, we launched new packaging for our oldest brand, Old Forester. We continued to invest in the renaissance of our founding brand, which grew net sales by more than 39% on a compound annual growth rate from fiscal 2014 through fiscal 2017. |
◦ | Also in fiscal 2017, we introduced our first entirely new bourbon in 20 years, Coopers’ Craft, a super-premium brand now in limited distribution in the United States. |
• | Tequila brands. We experienced another record year for our tequila brands in fiscal 2017, as Herradura, el Jimador, and New Mix contributed significantly to our overall net sales growth. In fiscal 2015, we released Herradura Ultra to participate in the fast-growing market for ultra-premium “cristalino” tequilas in Mexico. Herradura Ultra reached nearly 50 thousand nine-liter cases in fiscal 2017 and has been a driver of our tequila growth during the last three fiscal years. |
Acquisitions and Divestitures
• | In June 2015, we purchased all of the shares of Slane Castle Irish Whiskey Limited and announced plans to introduce new Irish whiskeys using high-quality whiskey purchased from other Irish distillers and triple-cask finished to Slane’s specifications while the whiskey made at the new Slane Distillery matures. In April 2017, we unveiled the first product from our Slane Irish Whiskey brand in Travel Retail in Ireland, and we expect to introduce the brand in the United States, the United Kingdom, and Australia during the summer of 2017. |
• | In March 2016, we sold our Southern Comfort and Tuaca brands and related assets to Sazerac Company, Inc. for $543 million in cash, which resulted in a gain of $485 million in the fourth quarter of fiscal 2016. We substantially completed all activities related to this transition of ownership in fiscal 2017. See ‘‘Executive Summary’’ below and Note 16 to the accompanying financial statements for details about the financial impact of the sale of Southern Comfort and Tuaca. |
• | On June 1, 2016, we acquired The BenRiach Distillery Company Limited (BenRiach) for aggregate consideration of $407 million, consisting of a purchase price of $341 million and $66 million in assumed debt and transaction-related obligations that we have since paid. The acquisition, which brought three single malt Scotch whisky brands into our portfolio, included brand trademarks, inventories, three malt distilleries, a bottling plant, and BenRiach’s headquarters in Edinburgh, Scotland. We believe that these super-premium brands will provide us an opportunity to participate in the growing single malt Scotch category and strengthen our portfolio’s long-term growth prospects in the United States, the United Kingdom, Taiwan, Germany, and Travel Retail. See Note 17 to the accompanying financial statements for details. |
27
Capital Deployment
Beyond the acquisition and divestiture activities described above, our capital deployment initiatives have been focused on (1) enabling the expected future growth of our existing businesses through investments in our production capacity, barrel whiskey inventory, and brand-building efforts for our existing portfolio; and (2) returning cash to our shareholders.
Investments. From fiscal 2015 through fiscal 2017, our capital expenditures totaled $340 million and were focused on enabling the growth of our premium whiskey brands as further detailed below.
◦ | Jack Daniel’s. We expanded our distilling capacity and constructed three new warehouses, and we continued work on the expansion of our shipping warehouse facility. |
◦ | Woodford Reserve. We expanded our bottling facility and constructed five new warehouses. We also continued construction of an additional warehouse. |
◦ | Old Forester. We continued construction of the Old Forester Distillery and visitors’ center on Main Street in Louisville, Kentucky, which is expected to open in the spring of 2018. |
◦ | Slane Irish Whiskey. We continued building a new distillery and consumer experience on the historic Slane Castle Estate, which is expected to open in the summer of 2017. |
• | Debt and equity transactions. From fiscal 2015 through fiscal 2017, we returned $2.9 billion to our shareholders through $0.8 billion in regular quarterly dividends and $2.1 billion in share repurchases. We issued long-term debt totaling $1.2 billion (net), including (a) the $500 million 4.5% 30-year notes in June 2015 and (b) two foreign currency denominated bonds, the €300 million 1.2% 10-year notes and the £300 million 2.6% 12-year notes, in June 2016. |
Executive Summary
Fiscal 2017 Highlights
Key highlights of our operating results in fiscal 2017 include:
• | We delivered net sales of $3.0 billion, a decrease of 3% compared to fiscal 2016. Excluding the impact of acquisitions and divestitures, net sales were flat. After additionally adjusting for the negative effect of foreign exchange and the estimated net decrease in distributor inventories, we grew underlying net sales 3%. |
• | We delivered operating income of $1.0 billion, a decrease of 35% compared to fiscal 2016. Excluding the impact of acquisitions and divestitures, operating income was flat. After additionally adjusting for the negative effect of foreign exchange and the estimated net decrease in distributor inventories, we grew underlying operating income 7%. |
• | We delivered diluted earnings per share of $1.71, a decrease of 34% compared to fiscal 2016. Excluding the impact of acquisitions and divestitures, we delivered adjusted diluted earnings per share growth of 5%. |
• | Our return on average invested capital declined to 19.3% in fiscal 2017, compared to 34.1% in fiscal 2016. Excluding the impact of acquisitions and divestitures, adjusted average return on invested capital declined to 21.3% in fiscal 2017 from 22.1% in fiscal 2016. |
Our underlying operating results were primarily driven by the performance of the Jack Daniel's family of brands, our tequila brands, and Woodford Reserve, partially offset by declines in used barrel sales. From a geographic perspective, the United States and our developed international markets led the growth; emerging markets growth accelerated compared to fiscal 2016; and our business in Travel Retail returned to growth in fiscal 2017 following declines in fiscal 2016. In addition, our underlying operating results benefited from the reduction of underlying SG&A expenses.
Foreign exchange negatively affected our reported operating results, driven by the dollar’s strengthening against a number of currencies, including, the Mexican peso, euro, and British pound. An estimated net reduction in distributor inventories due primarily to the United States and Russia also negatively affected our reported results.
28
Summary of Operating Performance Fiscal 2015 - 2017 | |||||||||||||||||||||||
Reported Change | Underlying Change1 | ||||||||||||||||||||||
Fiscal year ended April 30 | 2015 | 2016 | 2017 | 2016 vs. 2015 | 2017 vs. 2016 | 2016 vs. 2015 | 2017 vs. 2016 | ||||||||||||||||
Net sales | $ | 3,134 | $ | 3,089 | $ | 2,994 | (1 | %) | (3 | %) | 5 | % | 3 | % | |||||||||
Cost of sales | 951 | 945 | 973 | (1 | %) | 3 | % | 3 | % | 4 | % | ||||||||||||
Gross profit | 2,183 | 2,144 | 2,021 | (2 | %) | (6 | %) | 5 | % | 3 | % | ||||||||||||
Advertising | 437 | 417 | 383 | (4 | %) | (8 | %) | 2 | % | 2 | % | ||||||||||||
SG&A | 697 | 688 | 667 | (1 | %) | (3 | %) | 2 | % | (2 | %) | ||||||||||||
Operating income | $ | 1,027 | $ | 1,533 | $ | 989 | 49 | % | (35 | %) | 8 | % | 7 | % | |||||||||
Gross margin | 69.7 | % | 69.4 | % | 67.5 | % | (0.3pp | ) | (1.9pp | ) | |||||||||||||
Operating margin | 32.8 | % | 49.6 | % | 33.0 | % | 16.8pp | (16.6pp | ) | ||||||||||||||
Interest expense, net | $ | 25 | $ | 44 | $ | 56 | 70 | % | 29 | % | |||||||||||||
Effective tax rate | 31.7 | % | 28.3 | % | 28.3 | % | (3.4pp | ) | — | ||||||||||||||
Diluted earnings per share | $ | 1.60 | $ | 2.61 | $ | 1.71 | 63 | % | (34 | %) | |||||||||||||
Return on average invested capital2 | 22.0 | % | 34.1 | % | 19.3 | % | 12.1pp | (14.8pp | ) | ||||||||||||||
1See “Non-GAAP Financial Measures” above for details on our use of “underlying changes,” including how we calculate these measures and why we think this information is useful to readers.
2See “Non-GAAP Financial Measures” above for details on our use of “return on average invested capital,” including how we calculate this measure and why we think this information is useful to readers.
Adjusted Measures for Acquired and Divested Brands1 | ||||||||||||||||
Operating income | Operating margin | Effective tax rate | Diluted earnings per share | Return on average invested capital2 | ||||||||||||
Fiscal year ended April 30, 2016 | ||||||||||||||||
Reported | $ | 1,533 | 49.6 | % | 28.3 | % | $ | 2.61 | 34.1 | % | ||||||
Sale of Southern Comfort and Tuaca | $ | (486 | ) | (15.7 | %) | 1.1 | % | $ | (0.88 | ) | (11.1 | %) | ||||
Effect of acquired and divested brands | $ | (57 | ) | (0.4 | %) | — | % | $ | (0.10 | ) | (0.9 | %) | ||||
Adjusted | $ | 990 | 33.5 | % | 29.4 | % | $ | 1.63 | 22.1 | % | ||||||
Fiscal year ended April 30, 2017 | ||||||||||||||||
Reported | $ | 989 | 33.0 | % | 28.3 | % | $ | 1.71 | 19.3 | % | ||||||
Effect of acquired and divested brands | $ | (1 | ) | 0.5 | % | — | % | $ | 0.01 | 2.0 | % | |||||
Adjusted | $ | 988 | 33.5 | % | 28.3 | % | $ | 1.72 | 21.3 | % | ||||||
Adjusted percentage change | — | % | 5 | % | ||||||||||||
1See “Non-GAAP Financial Measures” above for details on our use of “adjusted measures,” including how we calculate these measures and why we think this information is useful to readers.
2See “Non-GAAP Financial Measures” above for details on our use of “return on average invested capital,” including how we calculate this measure and why we think this information is useful to readers.
29
Fiscal 2018 Outlook
We are optimistic about our prospects for growth of net sales, operating income, and diluted earnings per share in fiscal 2018. Below we discuss our current expectations for fiscal 2018, including trends, developments, and uncertainties that we expect to affect our business.
Outlook for key measures:
• | Net sales. We expect the Jack Daniel’s family of brands, our portfolio of premium bourbons, and our tequila brands to drive our net sales growth. We expect that volume will be the most significant driver of net sales growth in fiscal 2018. |
Additionally, we expect that recent and new additions to our portfolio will contribute to our net sales growth; these include: (a) the fall 2017 introduction of Jack Daniel’s Tennessee Rye in the United States, (b) the expansion of our Scotch whiskey brands following their successful integration in fiscal 2017, and (c) the rollout of Slane Irish Whiskey.
• | Operating expenses. We expect total operating expenses to grow at a slower rate than net sales. In addition, we expect: (a) for cost of sales, input costs should increase in the low single digits, (b) advertising expenses to grow at a rate similar to our net sales growth rate, and (c) SG&A expenses to be approximately unchanged compared to fiscal 2017. |
Additional considerations related to our fiscal 2018 outlook:
• | Sale of Southern Comfort and Tuaca. In fiscal 2016, we sold our Southern Comfort and Tuaca brands and related assets. Our fiscal 2017 results compared to fiscal 2016 were negatively affected by this sale. Looking ahead to fiscal 2018, we do not expect our growth rates compared to the prior fiscal year period to be affected by the divestiture. See discussion above and Note 16 to the accompanying financial statements for details about the financial impact of the sale of Southern Comfort and Tuaca. |
• | Productivity and efficiency initiative. In June 2017, we announced a multiyear cost saving and productivity initiative designed to (a) deliver sustainable cost savings, and (b) accelerate our net sales growth rate, as a portion of the cost savings generated by the initiative are expected to be invested in incremental advertising and promotional activities. Our fiscal 2018 outlook reflects the currently expected effects of this initiative. |
• | Foreign exchange. In fiscal 2017, our reported results were significantly affected by negative foreign exchange due to the strength of the U.S. dollar; however, we anticipate our fiscal 2018 results will not be as negatively affected. See “Item 7A. Quantitative and Qualitative Disclosures about Market Risk” for more information about foreign exchange and our business. |
• | Global whiskey trends and competition. We expect that the continued success of our existing premium-plus whiskeys, as well as the introduction and expansion of our new whiskeys, will drive our net sales growth in fiscal 2018. The American, Irish, and single malt Scotch whiskey categories are growing faster than total distilled spirits globally,1 but competition has intensified as industry participants seek to capitalize on consumers’ interest in these categories. While we believe that we are well-positioned to benefit from these trends, we may also be negatively affected by the increased competition. |
1 IWSR, 2016 data. |
30
Results of Operations
Fiscal 2017 Market Highlights
The following table shows net sales results for our ten largest markets, summarized by geographic area, for fiscal 2017, compared to fiscal 2016. We discuss the most significant changes in net sales for each market.
Top 10 Markets - Percentage of Fiscal 2017 Total Net Sales and Fiscal 2017 Net Sales Growth by Geographic Area | |||||||||||||||
Net Sales1 % Change vs. 2016 | |||||||||||||||
Markets | % of Fiscal 2017 Net Sales | Reported | Acquisitions and Divestitures | Foreign Exchange | Net Chg in Est. Distributor Inventories | Underlying | |||||||||
United States | 48 | % | (3 | %) | 5 | % | — | % | 2 | % | 4 | % | |||
Europe | 26 | % | (8 | %) | 3 | % | 6 | % | 3 | % | 4 | % | |||
United Kingdom | 7 | % | (12 | %) | 10 | % | 6 | % | — | % | 5 | % | |||
Germany | 4 | % | (1 | %) | 1 | % | 6 | % | — | % | 6 | % | |||
France | 4 | % | 5 | % | (1 | %) | 5 | % | — | % | 10 | % | |||
Poland | 2 | % | 5 | % | (1 | %) | 4 | % | — | % | 9 | % | |||
Russia | 1 | % | (43 | %) | — | % | 4 | % | 46 | % | 7 | % | |||
Rest of Europe | 7 | % | (10 | %) | — | % | 5 | % | 2 | % | (3 | %) | |||
Australia | 5 | % | (2 | %) | 5 | % | (2 | %) | — | % | 2 | % | |||
Other geographies | 14 | % | 1 | % | — | % | 5 | % | (3 | %) | 4 | % | |||
Mexico | 5 | % | — | % | — | % | 15 | % | (1 | %) | 15 | % | |||
Japan | 1 | % | 30 | % | — | % | (4 | %) | (9 | %) | 18 | % | |||
Canada | 1 | % | (8 | %) | 4 | % | 3 | % | 3 | % | 1 | % | |||
Remaining geographies2 | 7 | % | — | % | — | % | — | % | (5 | %) | (5 | %) | |||
Travel Retail3 | 4 | % | 3 | % | 3 | % | 2 | % | — | % | 7 | % | |||
Other non-branded4 | 3 | % | 11 | % | (30 | %) | — | % | — | % | (18 | %) | |||
Total | 100 | % | (3 | %) | 3 | % | 2 | % | 1 | % | 3 | % | |||
Note: Totals may differ due to rounding | |||||||||||||||
1See “Non-GAAP Financial Measures” above for details on our use of “underlying change” in net sales, including how we calculate this measure and why we think this information is useful to readers.
2“Remaining geographies” represents over 110 countries, with the largest being Brazil, South Africa, and Chile.
3“Travel Retail” represents our sales to global duty free customers, travel retail customers, and the U.S. military.
4“Other non-branded” includes used barrel, bulk whiskey and wine, and contract bottling sales.
The United States, our largest and most important market, accounted for 48% of our reported net sales in both fiscal 2017 and fiscal 2016. In fiscal 2017, reported net sales in the United States fell 3%, while underlying net sales increased 4%, after adjusting for the absence of revenues associated with Southern Comfort and Tuaca (which were sold last March) and an estimated net decrease in distributor inventories. Underlying net sales gains were driven primarily by (a) our American whiskey portfolio, led by JDTW, Woodford Reserve, Old Forester, and Gentleman Jack; (b) our tequila brands, led by el Jimador and Herradura; (c) Sonoma-Cutrer; and (d) Korbel Champagne. This growth was partially offset by declines of Canadian Mist.
Europe accounted for 26% of our reported net sales in fiscal 2017, down from 27% in fiscal 2016. For fiscal 2017, reported net sales in Europe were down 8%, while underlying net sales grew 4%, after adjusting for (a) the net effect of acquired and divested brands, (b) the negative effect of foreign exchange driven by the strengthening of the dollar against the euro, British pound, and Turkish lira, and (c) an estimated net decrease in distributor inventories primarily in Russia. The growth in underlying net sales was driven by gains in France, the United Kingdom, Germany, Poland, Ukraine, and Russia, partially offset by declines in Belgium and Turkey.
• | In the United Kingdom, underlying net sales growth was driven by higher volumes of JDTW, Jack Daniel’s ready-to-drinks (JD RTDs), and Chambord as well as higher prices and favorable customer mix of JDTW. |
31
• | In Germany, underlying net sales growth was driven by higher volumes of JD RTDs and JDTH, and the introduction of JDTF. JDTW volumes declined driven by customer buying patterns, although consumer takeaway trends remained solid. |
• | In France, underlying net sales growth was primarily driven by higher volumes for JDTW and the introduction of JDTF, as the Jack Daniel’s family of brands continued to gain market share in the world’s fourth largest whiskey market. |
• | In Poland, higher volumes of JDTW led underlying net sales growth, partially offset by a decline in volume of Finlandia. |
• | In Russia, underlying net sales growth was driven by price increases on Finlandia and JDTW intended to mitigate the effect of the devaluation of the ruble, partially offset by volume declines of both brands. After a period of declines driven by the challenging economic environment, Russia returned to growth in the second half of fiscal 2017, driven by JDTW and Finlandia, as the market began to stabilize. |
Australia accounted for 5% of our reported net sales in fiscal 2017 and fiscal 2016. In fiscal 2017, reported net sales were down 2%, but underlying net sales were up 2% after adjusting for the negative effect of the absence of revenues resulting from the sale of Southern Comfort and Tuaca and the positive effect of foreign exchange. Underlying net sales growth was driven by the Jack Daniel’s family of brands, led by recently launched JD RTD products, which were partially offset by declines of Jack Daniel’s & Cola.
Net sales for our other geographies constituted 14% of our reported net sales in fiscal 2017, up from 13% in fiscal 2016. Reported net sales increased 1% in fiscal 2017 and underlying net sales were up 4% after adjusting reported results for the negative effect of foreign exchange driven by the strengthening of the dollar against the Mexican peso and the estimated net increase in distributor inventories in Japan. Underlying net sales growth was led by Mexico and Japan, the latter of which benefited from price increases in fiscal 2017. These gains were partially offset by declines in Southeast Asia, China, and sub-Saharan Africa.
Travel Retail accounted for 4% of our reported net sales in fiscal 2017 and fiscal 2016. Reported net sales increased 3% and underlying net sales increased 7% after adjusting reported results for the absence of revenues resulting from the sale of Southern Comfort and Tuaca and the negative effect of foreign exchange. Following declines in fiscal 2016, underlying net sales growth was led by higher volumes of JDTW and JDTH, distribution gains on Woodford Reserve, and the expansion of JDTF into Europe.
Other non-branded. Reported net sales increased 11%, while underlying net sales declined 18% after removing the net effect of acquired and divested businesses (primarily bulk whiskey and contract bottling sales). The reduction in underlying net sales was due primarily to declines in used barrel sales largely reflecting lower prices due to increased supply of used barrels and somewhat weaker demand from blended Scotch industry buyers.
32
Fiscal 2017 Brand Highlights
The following table highlights the worldwide results of our largest brands for fiscal 2017, compared to the results for fiscal 2016. We discuss results of the brands most affecting our performance below the table.
Major Brands Worldwide Results for Fiscal 20171 | |||||||||||||||||
Depletion Volume | Net Sales % Change vs. 2016 | ||||||||||||||||
Brand family / brand | Nine-Liter Cases (Millions) | % Change vs. 2016 | Drinks Equivalent (Millions) | % Change vs. 2016 | Reported | Foreign Exchange | Net Chg in Est. Distributor Inventories | Underlying | |||||||||
Jack Daniel’s Family | 23.3 | 4 | % | 16.1 | 3 | % | — | % | 2 | % | 1 | % | 3 | % | |||
Jack Daniel’s Tennessee Whiskey | 12.5 | 1 | % | 12.5 | 1 | % | (1 | %) | 2 | % | 1 | % | 3 | % | |||
Jack Daniel’s Tennessee Honey | 1.6 | 6 | % | 1.6 | 6 | % | 3 | % | 2 | % | (2 | %) | 4 | % | |||
Other Jack Daniel’s whiskey brands2 | 1.3 | 9 | % | 1.3 | 9 | % | 3 | % | 1 | % | 1 | % | 5 | % | |||
Jack Daniel’s RTDs/RTP3 | 8.0 | 8 | % | 0.8 | 8 | % | 3 | % | 3 | % | — | % | 6 | % | |||
New Mix RTDs | 6.3 | 7 | % | 0.6 | 7 | % | 2 | % | 15 | % | — | % | 17 | % | |||
Finlandia | 3.0 | — | % | 3.0 | — | % | (10 | %) | 3 | % | 6 | % | (1 | %) | |||
Canadian Mist | 1.2 | (7 | %) | 1.2 | (7 | %) | (13 | %) | — | % | 1 | % | (12 | %) | |||
el Jimador | 1.2 | 4 | % | 1.2 | 4 | % | — | % | 4 | % | 4 | % | 8 | % | |||
Woodford Reserve | 0.6 | 18 | % | 0.6 | 18 | % | 14 | % | 1 | % | 4 | % | 19 | % | |||
Herradura | 0.4 | 12 | % | 0.4 | 12 | % | 9 | % | 7 | % | (2 | %) | 14 | % | |||
Note: Totals may differ due to rounding | |||||||||||||||||
1See “Non-GAAP Financial Measures” above for details on our use of “underlying change” in net sales, including how we calculate this measure and why we think this information is useful to readers; see “Volume and Depletions” above for definitions of volume measures presented here.
2In addition to the brands separately listed here, the Jack Daniel’s family of brands includes Gentleman Jack, Jack Daniel’s Single Barrel Collection, Jack Daniel’s Sinatra Select, Jack Daniel’s No. 27 Gold Tennessee Whiskey, Jack Daniel’s 1907 Tennessee Whiskey, Jack Daniel’s Single Barrel Rye Whiskey, and Jack Daniel’s Tennessee Fire.
3Jack Daniel’s RTD and RTP products include all RTD line extensions of Jack Daniel’s, such as Jack Daniel’s & Cola, Jack Daniel’s & Diet Cola, Jack & Ginger, Jack Daniel’s Country Cocktails, Gentleman Jack & Cola, Jack Daniel’s Double Jack, Jack Daniel’s American Serve, Jack Daniel’s Tennessee Honey RTD, and the seasonal Jack Daniel’s Winter Jack RTP.
In fiscal 2017, the Jack Daniel’s family of brands grew volumes 3% globally to 16.1 million drinks-equivalent nine-liter cases across all expressions of the brand. Reported net sales for the family were flat, while underlying net sales increased 3% after adjusting for the negative effect of foreign exchange primarily due to the strengthening of the dollar against the British pound, euro, Mexican peso, and Turkish lira. Jack Daniel’s family of brands was the most significant contributor to our total underlying net sales growth in fiscal 2017. The following are details about the underlying performance of the Jack Daniel’s family of brands:
33
Jack Daniel’s Tennessee Whiskey generates a significant percentage of our total net sales, and it is our top priority. As the world’s fourth-largest premium spirits brand measured by both volume and retail value,1 JDTW is one of the most valuable spirits brands in the world. During calendar 2016, JDTW grew volume for the 25th consecutive year and, among the top five premium spirits brands on the list, Jack Daniel’s Tennessee Whiskey was the only one to grow by volume in 20161 – an achievement that underscores our belief in the brand’s sustainable appeal and long-term growth potential. JDTW grew volumes 1% globally in fiscal 2017, down from its 3% growth rate in fiscal 2016. JDTW reported net sales declined 1%, while underlying net sales grew 3% led by the United States, Poland, France, the United Kingdom, Japan, Mexico, and Travel Retail. These increases were partially offset by declines in Belgium, Southeast Asia, sub-Saharan Africa, China, and Turkey.
Since its introduction in late fiscal 2011, Jack Daniel’s Tennessee Honey has contributed significantly to our net sales growth. JDTH is now the 12th largest brand in the world priced over $25 per 750ml bottle.2 In fiscal 2017, JDTH grew volumes by 6%, on top of the 8% growth rate last fiscal year. JDTH grew reported net sales 3% and underlying net sales 4% driven by higher volumes in the United States, Travel Retail, and Germany. These gains were partially offset by declines in Brazil.
Our Other Jack Daniel’s whiskey brands reported net sales grew 3% and underlying net sales increased 5%. The most significant contributor to underlying net sales growth was JDTF, which was led by the expansion in France, Germany, and Travel Retail. In the United States, JDTF full-year results declined as volumes in the first half of last year were high due to the national introduction in late fiscal 2015, but the brand returned to growth in the second half of fiscal 2017. Gentleman Jack also contributed to underlying net sales growth, while Jack Daniel’s Sinatra declined.
The Jack Daniel’s RTDs/RTPs brands grew volume 8%, reported net sales 3%, and underlying net sales 6% in fiscal 2017. JD RTDs’ underlying net sales growth was driven by consumer-led volumetric gains, distribution expansion, and product innovation in Mexico, Germany, the United Kingdom, and Australia.
In fiscal 2017, New Mix volumes increased 7%. Reported net sales increased 2%, while underlying net sales grew 17% after adjusting for the negative effect of foreign exchange due to the strengthening of the dollar against the Mexican peso. The growth in underlying net sales was driven by higher prices and volume gains.
Finlandia volumes were flat in fiscal 2017, while reported net sales were down 10% and underlying net sales declined 1% after adjusting for the negative effect of foreign exchange and an estimated net decrease in distributor inventories. The decline in underlying net sales was driven predominantly by lower volumes in Poland, the brand’s largest market, and in the United States. These declines were partially offset by volume gains in Travel Retail.
Canadian Mist volumes declined 7%, while reported net sales decreased 13% and underlying net sales declined 12% in fiscal 2017. The net sales declines were driven by volume declines and lower prices in the United States, which is the brand’s largest market.
el Jimador volumes grew 4% in fiscal 2017. Reported net sales were flat, while underlying net sales were up 8% after adjusting for the negative effect of foreign exchange due to the strengthening of the dollar against the Mexican peso. Underlying net sales growth was driven by higher volumes in the United States, where el Jimador remained on the Impact’s “Hot Brands” list3 in calendar 2016.
Woodford Reserve grew volumes 18% in fiscal 2017 (after growing 26% in fiscal 2016 and 30% in fiscal 2015) and was once again selected as an Impact’s “Hot Brand.”3 In addition, reported net sales increased 14% and underlying net sales grew 19% in fiscal 2017. The United States is by far the brand’s most important market and was responsible for most of its growth during fiscal 2017. Woodford Reserve continued its momentum outside the United States as well, growing volumes 23%, driven by distribution expansion in Travel Retail. During fiscal 2017, we increased our advertising investment behind Woodford Reserve both in the United States and internationally. Woodford Reserve led a fast-growing competitive set of super-premium American whiskeys, and we believe it is poised for continued growth as interest in bourbon increases around the world. We plan to devote substantial resources to Woodford Reserve to support its growth potential, including sustained advertising investment focused on consumer communications and capital spending.
1Based on industry statistics published by Impact Databank, a well-known U.S. trade publication, in March 2017. | |
2IWSR, 2016 data. | |
3Impact Databank published the Impact’s “Hot Brands - Spirits” list in March 2017. | |
34
In fiscal 2017, Herradura volumes grew 12%. Reported net sales increased 9% and underlying net sales were up 14% after adjusting for the negative effect of foreign exchange due to the strengthening of the dollar against the Mexican peso. This growth was driven primarily by increased volumes in the brand’s largest markets, Mexico and the United States, as well as higher prices in Mexico. Both of these markets benefited from consumer-led volumetric growth of Herradura Ultra, our “cristalino” tequila expression released in fiscal 2015. We remain focused on developing Herradura in the United States (where we continue to see considerable potential for growth), strengthening our position in Mexico, and continuing to build our presence in higher-value tequila markets throughout the world.
35
Year-Over-Year Comparisons
Net Sales | |||||||||
Percentage change versus the prior fiscal year ended April 30 | 2017 | 2016 | |||||||
Change in reported net sales | (3 | %) | (1 | %) | |||||
Acquisitions and divestitures | 3 | % | 1 | % | |||||
Foreign exchange | 2 | % | 5 | % | |||||
Estimated net change in distributor inventories | 1 | % | — | % | |||||
Change in underlying net sales | 3 | % | 5 | % | |||||
Change in underlying net sales attributed to: | |||||||||
Volume | 2 | % | 1 | % | |||||
Net price/mix | 2 | % | 4 | % | |||||
Note: Totals may differ due to rounding | |||||||||
Fiscal 2017 compared to Fiscal 2016
Net sales of $2,994 million decreased 3%, or $95 million, in fiscal 2017 compared to fiscal 2016. After adjusting reported results for (a) the net effect of acquisitions and divestitures, (b) the negative effect of foreign exchange, and (c) the estimated net decrease in distributor inventories, underlying net sales grew 3%. The negative effect of foreign exchange was driven primarily by the dollar’s strengthening against the Mexican peso, euro, and British pound. The change in underlying net sales was driven almost equally by the positive impact of price/mix and volume growth. Volume growth was led by the Jack Daniel's family and the tequilas, partially offset by declines in Canadian Mist. Improved price/mix was driven by (a) higher average pricing on JDTW and the tequilas, and (b) a shift in sales out of lower-priced brands (most notably, Canadian Mist) to higher priced brands (most notably, Jack Daniel's family and Woodford Reserve; the gains were partially offset by declines in used barrel sales.
The primary factors contributing to underlying net sales growth were:
• | our American whiskey portfolio in the United States, led by JDTW, Woodford Reserve, Old Forester, and Gentleman Jack; |
• | JDTW in several international markets, most notably, Poland, France, the United Kingdom, Japan, Mexico, and Travel Retail; |
• | our tequila brands, led by (1) higher prices and volume gains of New Mix in Mexico, (2) higher volumes of Herradura and el Jimador in the United States, and (3) higher volumes and price increases of Herradura in Mexico; |
• | JD RTDs, partially due to new product introductions, led by Mexico, Germany, the United Kingdom, and Australia; |
• | Sonoma-Cutrer and Korbel Champagne in the United States; |
• | JDTF driven by launches in Germany, France, and Travel Retail; and |
• | Woodford Reserve outside of the United States, driven by distribution expansion in Travel Retail. |
The primary factors partially offsetting growth in underlying net sales were declines of:
• | used barrel sales, reflecting lower prices due to increased supply of used barrels and somewhat weaker demand from blended Scotch industry buyers; |
• | JDTW in Belgium, Southeast Asia, sub-Saharan Africa, China, and Turkey; |
• | Canadian Mist volumes in the United States; and |
• | lower-margin agency brands that we no longer distribute. |
Fiscal 2016 compared to Fiscal 2015
Net sales of $3,089 million decreased 1%, or $45 million, in fiscal 2016 compared to fiscal 2015. Underlying net sales growth was 5%, after adjusting reported results for the negative effects of foreign exchange and the sale of Southern Comfort and Tuaca. The negative effect of foreign exchange was driven primarily by the dollar’s broad strengthening against most currencies. The change in underlying net sales was driven by the 4% positive impact of price/mix and 1% volume growth. Improved price/mix was driven by a shift in sales out of lower-priced brands, most notably Finlandia and Canadian Mist, to higher-priced brands, led by the Jack Daniel’s family and Woodford Reserve.
36
The primary factors contributing to underlying net sales growth were:
• | our American whiskey portfolio in the United States, led by JDTW, Woodford Reserve, Gentleman Jack, and Old Forester; |
• | JDTW volumes in several international markets, led by the United Kingdom, France, Germany, and Mexico; and beneficial channel mix in Turkey; |
• | JDTF, due to its launch in the United States and the United Kingdom; |
• | our tequila brands, led by (1) higher volumes of New Mix in Mexico, (2) higher prices and volumes of Herradura in the United States and Mexico, and (3) higher volumes of el Jimador in the United States; |
• | Korbel Champagne and Sonoma-Cutrer in the United States; |
• | JDTH outside the United States, led by Brazil and France; and |
• | used barrel sales driven by higher prices. |
The primary factors partially offsetting growth in underlying net sales were declines of:
• | JDTW volumes in Travel Retail and Russia; |
• | lower-margin brands that we discontinued in fiscal 2016 and lower-margin agency brands that we no longer distribute; |
• | Southern Comfort in the United States before the sale; |
• | Canadian Mist in the United States; |
• | Finlandia in Europe, most notably in Russia; and |
• | volume of el Jimador in Mexico. |
Cost of Sales | |||||||||
Percentage change versus the prior fiscal year ended April 30 | 2017 | 2016 | |||||||
Change in reported cost of sales | 3 | % | (1 | %) | |||||
Acquisitions and divestitures | — | % | — | % | |||||
Foreign exchange | — | % | 4 | % | |||||
Estimated net change in distributor inventories | 1 | % | — | % | |||||
Change in underlying cost of sales | 4 | % | 3 | % | |||||
Change in underlying cost of sales attributed to: | |||||||||
Volume | 2 | % | 1 | % | |||||
Cost/mix | 3 | % | 2 | % | |||||
Note: Totals may differ due to rounding | |||||||||
Fiscal 2017 compared to Fiscal 2016
Cost of sales of $973 million increased $28 million, or 3%, in fiscal 2017 compared to fiscal 2016. Underlying cost of sales grew 4% after adjusting reported costs for the estimated net change in distributor inventories. The increase in underlying costs of sales was driven by growth in sales volumes and higher input costs, including wood and grain. Looking ahead to fiscal 2018, we currently expect that input costs will increase in the low single digits.
Fiscal 2016 compared to Fiscal 2015
Cost of sales of $945 million decreased $6 million, or 1%, in fiscal 2016 compared to fiscal 2015. Underlying cost of sales grew 3% after adjusting reported costs for the positive effect of foreign exchange. About one-third of the underlying increase in costs of sales was driven by growth in sales volumes, while the other two-thirds related to higher input costs, including wood and grain, and a shift in product mix to higher-cost brands.
37
Gross Profit | |||||
Percentage change versus the prior fiscal year ended April 30 | 2017 | 2016 | |||
Change in reported gross profit | (6 | %) | (2 | %) | |
Acquisitions and divestitures | 4 | % | 1 | % | |
Foreign exchange | 3 | % | 6 | % | |
Estimated net change in distributor inventories | 1 | % | — | % | |
Change in underlying gross profit | 3 | % | 5 | % | |
Note: Totals may differ due to rounding | |||||
Gross Margin | |||||
Fiscal year ended April 30 | 2017 | 2016 | |||
Prior year gross margin | 69.4 | % | 69.7 | % | |
Price/mix | 0.1 | % | 0.3 | % | |
Cost | (0.4 | %) | (0.2 | %) | |
Acquisitions and divestitures | (0.9 | %) | (0.1 | %) | |
Foreign exchange | (0.7 | %) | (0.3 | %) | |
Change in gross margin | (1.9 | %) | (0.3 | %) | |
Current year gross margin | 67.5 | % | 69.4 | % | |
Note: Totals may differ due to rounding | |||||
Fiscal 2017 compared to Fiscal 2016
Gross profit of $2,021 million decreased $123 million, or 6%, in fiscal 2017 compared to fiscal 2016. Gross profit on an underlying basis improved 3% after adjusting reported gross profit for (a) the net effect of acquisitions and divestitures, (b) the negative effect of foreign exchange, and (c) the estimated net change in distributor inventories. The increase in underlying gross profit resulted from the same factors that contributed to the increase in underlying net sales partially offset by the same factors that drove higher underlying cost of sales.
Gross margin decreased to 67.5% in fiscal 2017, down 190 basis points from 69.4% in fiscal 2016. The decrease in gross margin was primarily due to (a) the net effect of acquisitions and divestitures, (b) the negative effect of foreign exchange, and (c) an increase in underlying cost of sales.
Fiscal 2016 compared to Fiscal 2015
Gross profit of $2,144 million decreased $39 million, or 2%, in fiscal 2016 compared to fiscal 2015. Gross profit on an underlying basis improved 5% after adjusting reported gross profit for the negative effects of foreign exchange and the sale of Southern Comfort and Tuaca. The increase resulted from the same factors that contributed to the increase in underlying net sales for the year partially offset by the same factors that drove higher underlying cost of sales.
Gross margin decreased to 69.4% in fiscal 2016, down 30 basis points from 69.7% in fiscal 2015. The decrease in gross margin was primarily due to the negative effect of foreign exchange, partially offset by higher pricing and favorable mix shift.
Advertising Expenses | |||||
Percentage change versus the prior fiscal year ended April 30 | 2017 | 2016 | |||
Change in reported advertising | (8 | %) | (4 | %) | |
Acquisitions and divestitures | 8 | % | 2 | % | |
Foreign exchange | 2 | % | 5 | % | |
Change in underlying advertising | 2 | % | 2 | % | |
Note: Totals may differ due to rounding | |||||
38
Fiscal 2017 compared to Fiscal 2016
Advertising expenses of $383 million decreased $34 million, or 8%, in fiscal 2017 compared to fiscal 2016. Underlying advertising expenses increased 2% after adjusting reported results for the net effect of acquisitions and divestitures and the benefit of foreign exchange. The increase in underlying advertising expense was driven by higher spending on (a) JDTW, due in part to the 150th anniversary of Jack Daniel’s Distillery, (b) JD RTDs, partially due to new innovations, and (c) the launch of JDTF outside the United States. These increases were partially offset by lower spending for JDTF in the United States following the national introduction in late fiscal 2015 and for Finlandia Vodka.
Fiscal 2016 compared to Fiscal 2015
Advertising expenses of $417 million decreased $20 million, or 4%, in fiscal 2016 compared to fiscal 2015. Underlying advertising expenses increased 2% after adjusting reported results for the positive effects of foreign exchange and the sale of Southern Comfort and Tuaca. The increase in underlying advertising expenses was driven primarily by investments in the United States for Woodford Reserve, JDTW, and JDTF, as well as higher spending outside the United States on the Jack Daniel’s family. These increases were partially offset by lower spending for Southern Comfort globally and Finlandia Vodka in many markets.
Selling, General, and Administrative (SG&A) Expenses | |||||
Percentage change versus the prior fiscal year ended April 30 | 2017 | 2016 | |||
Change in reported SG&A | (3 | %) | (1 | %) | |
Acquisitions and divestitures | — | % | — | % | |
Foreign exchange | 1 | % | 4 | % | |
Change in underlying SG&A | (2 | %) | 2 | % | |
Note: Totals may differ due to rounding | |||||
Fiscal 2017 compared to Fiscal 2016
SG&A expenses of $667 million decreased $21 million, or 3%, in fiscal 2017 compared to fiscal 2016, while underlying SG&A dropped 2% after adjusting reported results for the benefit of foreign exchange. The most significant contributors to the year-over-year decrease in underlying SG&A were lower compensation-related expenses and tight management of discretionary spending.
Fiscal 2016 compared to Fiscal 2015
SG&A expenses of $688 million decreased $9 million, or 1%, in fiscal 2016 compared to fiscal 2015, while underlying SG&A grew 2% after adjusting reported results for the positive effect of foreign exchange. The most significant contributors to the year-over-year increase in underlying SG&A were higher compensation and related expenses.
Operating Income | |||||
Percentage change versus the prior fiscal year ended April 30 | 2017 | 2016 | |||
Change in reported operating income | (35 | %) | 49 | % | |
Acquisitions and divestitures | 35 | % | (46 | %) | |
Foreign exchange | 4 | % | 4 | % | |
Estimated net change in distributor inventories | 3 | % | 1 | % | |
Change in underlying operating income | 7 | % | 8 | % | |
Note: Totals may differ due to rounding | |||||
Fiscal 2017 compared to Fiscal 2016
Operating income was $989 million in fiscal 2017, a decrease of $544 million, or 35%, compared to fiscal 2016. Underlying operating income growth was 7% after adjusting for (a) the net effect of acquisitions and divestitures, (b) the negative effect of foreign exchange, and (c) the estimated net change in distributor inventories, driven primarily by the United States and Russia. The same factors that contributed to the growth in underlying gross profit also contributed to the growth in underlying operating income, enhanced by meaningful operating expense leverage as SG&A spend declined and underlying advertising expenses grew 2% compared to underlying net sales growth of 3%.
39
Operating margin declined 16.6 percentage points to 33.0% in fiscal 2017 from 49.6% in fiscal 2016. The decrease in our operating margin was primarily due to the net 16.6 percentage point effect of acquisitions and divestitures and the negative effect of foreign exchange, partially offset by a reduction in SG&A spend.
Fiscal 2016 compared to Fiscal 2015
Operating income was $1,533 million in fiscal 2016, an increase of $506 million, or 49%, compared to fiscal 2015. Underlying operating income growth was 8% after adjusting for (a) the positive effect of the sale of Southern Comfort and Tuaca; (b) the negative effect of foreign exchange related to the broad strengthening of the dollar; and (c) the estimated net decrease in distributor inventories, driven primarily by the absence of the distributor inventory increase in the United States associated with the nationwide rollout of JDTF in the fourth quarter of fiscal 2015. The same factors that contributed to the growth in underlying gross profit also contributed to the growth in underlying operating income, enhanced by a slower rate of growth in operating expenses.
Operating margin grew 16.8 percentage points to 49.6% in fiscal 2016 from 32.8% in fiscal 2015. The increase in our operating margin was primarily due to the sale of Southern Comfort and Tuaca, which increased our operating margin 15.7 percentage points. In addition, the slower rate of growth in operating expenses compared to the gross profit growth rate also contributed to the operating margin expansion.
Fiscal 2017 compared to Fiscal 2016
Interest expense (net) increased $12 million, or 29%, in fiscal 2017 compared to fiscal 2016, primarily due to our July 2016 issuance of €300 million 1.20% and £300 million 2.60% senior unsecured notes due on July 7, 2026 and July 7, 2028, respectively.
Our effective tax rates for fiscal 2017 and fiscal 2016 were 28.3%. A decrease in the beneficial impact of foreign earnings at lower rates and an increase in foreign exchange gains in non-U.S. entities that are currently subject to U.S. tax were offset by an increase in the tax benefit related to discrete items. Additionally, the absence of the beneficial impact of the sale of the Southern Comfort and Tuaca business was primarily offset by the beneficial impact of the excess tax benefits from stock-based awards.
Diluted earnings per share were $1.71 in fiscal 2017, down 34% from $2.61 in fiscal 2016. This decrease resulted from the same factors that contributed to the decrease in reported operating income, including (a) the absence of the $0.88 gain from the sale of Southern Comfort and Tuaca in fiscal 2016, (b) the absence of net income contribution from those brands, and (c) higher interest expense in fiscal 2017, partially offset by (d) a reduction in shares outstanding due to share repurchases.
Fiscal 2016 compared to Fiscal 2015
Interest expense (net) increased $19 million, or 70%, in fiscal 2016 compared to fiscal 2015, primarily due to our June 2015 issuance of $500 million 4.50% senior unsecured notes due on July 15, 2045 and the increase in our commercial paper borrowing.
Our effective tax rate for fiscal 2016 was 28.3% compared to 31.7% in fiscal 2015. The decrease in our effective tax rate was driven primarily by an increase in the beneficial impact of foreign earnings and the impact of the sale of the Southern Comfort and Tuaca business.
Diluted earnings per share were $2.61 in fiscal 2016, up 63% from $1.60 in fiscal 2015. This increase resulted from (a) the same factors that contributed to the increase in operating income, including $0.88 from the sale of Southern Comfort and Tuaca, (b) the reduction in the shares outstanding resulting from share repurchases, and (c) the decrease in the effective tax rate.
40
Liquidity and Capital Resources
Our ability to generate cash from operations consistently is one of our most significant financial strengths. Our strong cash flows enable us to invest in our people, invest in our brands, invest in our assets, pay dividends, make strategic acquisitions that we believe will enhance shareholder value, repurchase shares of common stock, and, from time to time, pay special dividends. Investment-grade credit ratings (A1 by Moody’s, A by Fitch, and A- by Standard & Poor’s) provide us with financial flexibility when accessing global credit markets. We believe cash flows from operations are sufficient to meet our expected operating and capital requirements.
Cash Flow Summary
(Dollars in millions) | 2015 | 2016 | 2017 | |||||||||
Operating activities | $ | 608 | $ | 524 | $ | 639 | ||||||
Investing activities: | ||||||||||||
Proceeds from sale of business | — | 543 | — | |||||||||
Acquisition of business | — | — | (307 | ) | ||||||||
Additions to property, plant, and equipment | (120 | ) | (108 | ) | (112 | ) | ||||||
Other | (5 | ) | (2 | ) | (3 | ) | ||||||
(125 | ) | 433 | (422 | ) | ||||||||
Financing activities: | ||||||||||||
Net change in short-term borrowings | 183 | 80 | (122 | ) | ||||||||
Net issuance (repayment) of long-term debt | — | 240 | 717 | |||||||||
Acquisition of treasury stock | (462 | ) | (1,107 | ) | (561 | ) | ||||||
Dividends paid | (256 | ) | (266 | ) | (274 | ) | ||||||
Other | 4 | (7 | ) | (45 | ) | |||||||
(531 | ) | (1,060 | ) | (285 | ) | |||||||
Foreign exchange effect | (19 | ) | (4 | ) | (13 | ) | ||||||
Change in cash and cash equivalents | $ | (67 | ) | $ | (107 | ) | $ | (81 | ) | |||
Fiscal 2017 compared to Fiscal 2016
Cash and cash equivalents declined $81 million in fiscal 2017, compared to a decline of $107 million in fiscal 2016. Cash provided by operations of $639 million was up $115 million from last year, largely reflecting the absence of a $125 million payment made during fiscal 2016 for estimated income taxes incurred on the sale of the Southern Comfort and Tuaca business. Cash used for investing activities was $422 million during fiscal 2017, an increase of $855 million over the $433 million in cash provided by investing activities during fiscal 2016. The increase of $855 million largely reflects the impact of the sale of the Southern Comfort and Tuaca business (for which we received cash of $543 million) in fiscal 2016 and the acquisition of BenRiach (for which we paid cash of $307 million) in fiscal 2017.
Cash used for financing activities was $285 million during fiscal 2017, compared to $1,060 million during fiscal 2016. The $775 million decrease in cash used for financing activities largely reflects a $546 million decrease in share repurchases and a $477 million increase in proceeds from long-term debt net of repayments, partially offset by a $202 million decline in net proceeds from short-term borrowings and the payment of $30 million in November 2016 to settle an obligation related to our acquisition of BenRiach. The impact on cash and cash equivalents as a result of exchange rate changes was a decline of $13 million for fiscal 2017, compared to a decline of $4 million in the prior fiscal year.
Fiscal 2016 compared to Fiscal 2015
Cash and cash equivalents decreased $107 million during fiscal 2016, compared to a decrease of $67 million during fiscal 2015. Cash provided by operations during fiscal 2016 was $524 million, compared to $608 million in fiscal 2015. The $84 million decline was primarily due to a $55 million increase in income tax payments, largely reflecting a $125 million payment made during the fourth quarter of fiscal 2016 for the estimated taxes incurred on the sale of the Southern Comfort and Tuaca business, partially offset by the absence of $64 million paid during fiscal 2015 in connection with an intercompany transfer of assets. The decline in cash provided by operations also reflected a $14 million increase in interest payments, due to higher debt balances and interest rates.
41
Cash provided by investing activities was $433 million in fiscal 2016. The increase of $558 million over fiscal 2015 primarily reflected the proceeds of $543 million from the sale of the Southern Comfort and Tuaca business in fiscal 2016. Cash used for financing activities was $1,060 million during fiscal 2016, compared to $531 million for fiscal 2015. The $529 million increase largely reflected a $645 million increase in share repurchases and the repayment of $250 million in aggregate principal amount of 2.5% notes that matured in January 2016, partially offset by proceeds of $490 million from the issuance of 4.50% senior notes due 2045 issued in June 2015, and an $80 million increase in short-term borrowings. The impact on cash and cash equivalents as a result of exchange rate changes was a decline of $4 million in fiscal 2016, compared to a decline of $19 million in fiscal 2015.
Capital Expenditures
Investments in property, plant, and equipment were $120 million in fiscal 2015, $108 million in fiscal 2016, and $112 million in fiscal 2017. Average expenditures over those three fiscal years were 61% higher than our average expenditures in the previous five fiscal years. Approximately 80% of total spend in fiscal 2017 related to production operations that continued to expand capacity, reduce costs, and build our brands. Our focus has been building our American whiskey brands, with an emphasis on JDTW, Woodford Reserve, and Old Forester.
For fiscal 2018, we expect to spend up to $140 million in capital expenditures. Our capital spending plans for fiscal 2018 include continued investment in our American whiskey brands, led by spending on our shipping warehouse facility at Jack Daniel’s and the Old Forester Distillery and homeplace. In addition, we will continue building a new distillery and consumer experience on the historic Slane Castle Estate in Ireland. We expect capital expenditures in fiscal 2019 and fiscal 2020 to remain elevated as we complete several key, multiyear projects.
Share Repurchases
We have repurchased approximately 46.2 million shares of our common stock since the beginning of fiscal 2014. The following table summarizes information about those share repurchases by period.
Shares Purchased | Average Price Per Share, Including Brokerage Commissions | Total Cost of Shares | ||||||||||||||||
Period | Class A | Class B | Class A | Class B | (Millions) | |||||||||||||
May 1, 2013 – April 30, 2014 | 49,600 | 1,322,944 | $ | 34.02 | $ | 34.52 | $ | 47 | ||||||||||
May 1, 2014 – April 30, 2015 | 130,210 | 10,068,660 | $ | 45.11 | $ | 45.18 | $ | 461 | ||||||||||
May 1, 2015 – April 30, 2016 | 42,082 | 22,714,698 | $ | 47.72 | $ | 48.49 | $ | 1,104 | ||||||||||
May 1, 2016 – April 30, 2017 | 30,312 | 11,799,240 | $ | 48.46 | $ | 47.19 | $ | 558 | ||||||||||
252,204 | 45,905,542 | $ | 2,170 | |||||||||||||||
We repurchased these shares under three separate repurchase programs, including the most recent $1 billion program that began on April 1, 2016, and concluded on March 31, 2017. Under the most recent program, we have repurchased a total of 14,159,578 shares for approximately $670 million.
The results of the three share repurchase programs are summarized in the following table.
Average Price Per Share, Including | Total Spent on Stock Repurchase | |||||||||||||||||||
Dates | Shares Purchased | Brokerage Commissions | Program | |||||||||||||||||
Starting | Ending | Class A | Class B | Class A | Class B | (Millions) | ||||||||||||||
October 2013 | September 2014 | 94,926 | 5,723,252 | $ | 39.41 | $ | 43.04 | $ | 250 | |||||||||||
October 2014 | March 2016 | 126,966 | 26,053,024 | $ | 45.90 | $ | 47.76 | $ | 1,250 | |||||||||||
April 2016 | March 2017 | 30,312 | 14,129,266 | $ | 48.46 | $ | 47.30 | $ | 670 | |||||||||||
252,204 | 45,905,542 | $ | 2,170 | |||||||||||||||||
Liquidity
We continue to manage liquidity conservatively to meet current obligations, fund capital expenditures, maintain dividends, and repurchase shares from time to time while reserving adequate debt capacity for acquisition opportunities.
In addition to our cash and cash equivalent balances, we have access to several liquidity sources to supplement our cash flow from operations. One of those sources is our $800 million commercial paper program that we regularly use to fund our short-term credit needs and to maintain our access to the capital markets. During fiscal 2016, our commercial paper borrowings averaged
42
$331 million, with an average maturity of 29 days and an average interest rate of 0.42%. During fiscal 2017, our commercial paper borrowings averaged $576 million, with an average maturity of 31 days and an average interest rate of 0.69%. Commercial paper outstanding was $269 million at April 30, 2016, and $208 million at April 30, 2017.
Our commercial paper program is supported with available commitments under our currently undrawn $800 million bank credit facility that matures on November 20, 2018. Further, we believe that the markets for investment-grade bonds and private placements are accessible sources of long-term financing that could meet any additional liquidity needs. Although unlikely, under extreme market conditions, one or more participating banks may not be able to fully fund its commitments under our credit facility.
We have high credit standards when initiating transactions with counterparties, and we closely monitor our counterparty risks with respect to our cash balances and derivative contracts. If a counterparty’s credit quality were to deteriorate below our credit standards, we would expect either to liquidate exposures or require the counterparty to post appropriate collateral.
As of April 30, 2017, we had total cash and cash equivalents of $182 million. Of this amount, $153 million was held by foreign subsidiaries whose earnings we expect to reinvest indefinitely outside of the United States. We do not expect to need the cash generated by those foreign subsidiaries to fund our domestic operations. In the unforeseen event that we were to repatriate cash from those foreign subsidiaries, we would be required to provide for and pay U.S. taxes on permanently repatriated earnings. See Note 13 to our Consolidated Financial Statements for further information about the taxes that would have been provided on the undistributed earnings of these foreign subsidiaries if not considered indefinitely reinvested.
As announced on May 24, 2017, our Board of Directors declared a regular quarterly cash dividend of $0.1825 per share on our Class A and Class B common stock. Stockholders of record on June 5, 2017, will receive the dividend on July 3, 2017.
We believe our current liquidity position is strong and sufficient to meet all of our future financial commitments. A quantitative covenant of our $800 million bank credit facility requires the ratio of consolidated EBITDA (as defined in the agreement) to consolidated interest expense to be at least 3 to 1. At April 30, 2017, with a ratio of 18 to 1, we were well within the covenant’s parameters.
Off-Balance Sheet Arrangements
As of April 30, 2017, we were not involved in any off-balance sheet arrangements that have or are reasonably likely to have a material effect on our financial condition, results of operations, or liquidity.
Long-Term Obligations
We have long-term obligations related to contracts, leases, borrowing arrangements, and employee benefit plans that we enter into in the normal course of business (see Notes 4, 5, and 9 to our Consolidated Financial Statements). The following table summarizes the amounts of those obligations as of April 30, 2017, and the years when they must be paid:
Long-Term Obligations1
(Dollars in millions) | Total | 2018 | 2019-2020 | 2021-2022 | After 2022 | |||||||||||||||
Long-term debt | $ | 1,965 | $ | 250 | $ | — | $ | — | $ | 1,715 | ||||||||||
Interest on long-term debt | 1,058 | 53 | 103 | 103 | 799 | |||||||||||||||
Grape purchase obligations | 35 | 12 | 15 | 7 | 1 | |||||||||||||||
Operating leases | 48 | 17 | 22 | 8 | 1 | |||||||||||||||
Postretirement benefit obligations2 | 38 | 38 | n/a | n/a | n/a | |||||||||||||||
Agave purchase obligations3 | 4 | n/a | n/a | n/a | n/a | |||||||||||||||
Total | $ | 3,148 | $ | 370 | $ | 140 | $ | 118 | $ | 2,516 | ||||||||||
1 | Excludes liabilities for tax uncertainties, as we cannot reasonably predict the ultimate amount or timing of settlement. |
2 | As of April 30, 2017, we have unfunded pension and other postretirement benefit obligations of $322 million. Because we cannot determine the specific periods in which those obligations will be funded, the table above reflects no amounts related to those obligations other than the $38 million of expected contributions (including $30 million of expected discretionary contributions) in fiscal 2018. |
3 | As discussed in Note 4 to our Consolidated Financial Statements, we have obligations to purchase agave, a plant whose sap forms the raw material for tequila. As of April 30, 2017, based on current market prices, obligations under these contracts totaled $4 million. Because we cannot determine the specific periods in which those obligations will be paid, the above table reflects only the total related to those obligations. |
We expect to meet these obligations with internally generated funds.
43
Critical Accounting Policies and Estimates
Our financial statements reflect some estimates involved in applying the following critical accounting policies that entail uncertainties and subjectivity. Using different estimates or policies could have a material effect on our operating results and financial condition.
Goodwill and Other Intangible Assets
We have obtained most of our brands by acquiring other companies. When we acquire another company, we first allocate the purchase price to identifiable assets and liabilities, including intangible brand names and trademarks (“brand names”), based on estimated fair value. We then record any remaining purchase price as goodwill. We do not amortize goodwill or other intangible assets with indefinite lives. We consider all of our brand names to have indefinite lives.
We assess our goodwill and other indefinite-lived intangible assets for impairment at least annually. If an asset’s fair value is less than its book value, we write it down to its estimated fair value. For goodwill, if the book value of the reporting unit exceeds its estimated fair value, we measure for potential impairment by comparing the implied fair value of the reporting unit’s goodwill, determined in the same manner as in a business combination, to the goodwill’s book value. We estimate the reporting unit’s fair value using discounted estimated future cash flows or market information. We typically estimate the fair value of a brand name using either the “relief from royalty” or “excess earnings” method. We also consider market values for similar assets when available. Considerable management judgment is necessary to estimate fair value, including making assumptions about future cash flows, discount rates, and royalty rates.
We have the option, before quantifying the fair value of a reporting unit or brand name, to evaluate qualitative factors to assess whether it is more likely than not that our goodwill or brand names are impaired. If we determine that is not the case, then we are not required to quantify the fair value. That assessment also takes considerable management judgment.
Based on our assumptions, we believe none of our goodwill or other intangibles are impaired. Further, we estimate the fair values to substantially exceed the carrying values of all of our goodwill and other intangible assets.
Pension and Other Postretirement Benefits
We sponsor various defined benefit pension plans as well as postretirement plans providing retiree health care and retiree life insurance benefits. Benefits are based on factors such as years of service and compensation level during employment. We expense the benefits expected to be paid over employees’ expected service. This requires us to make assumptions to determine the net benefit expense and obligations, such as interest rates, return on plan assets, the rate of salary increases, expected service, and health care cost trend rates.
The assets, obligations, and assumptions used to measure pension and retiree medical expenses are determined at the beginning of the year (“measurement date”). Because obligations are measured on a discounted basis, the discount rate is a significant assumption. It is based on interest rates for high-quality, long-term corporate debt at each measurement date. The expected return on pension plan assets reflects expected capital market returns for each asset class that are based on historical returns, adjusted for the expected effects of diversification and active management (net of fees) of the assets. The other assumptions also reflect our historical experience and management’s best judgment regarding future expectations.
Beginning in fiscal 2018, we plan to change the method used to estimate the service cost and interest cost components of net periodic benefit cost for our U.S. pension and other postretirement benefit plans. The new estimation approach will discount the individual expected cash flows underlying the service cost and interest cost using the applicable spot rates derived from the yield curve used to discount the cash flows used to measure the benefit obligation at the beginning of the period. Previously, we estimated these service and interest cost components using a single weighted-average discount rate derived from the yield curve used to measure the benefit obligation at the beginning of the period. We believe the new approach will provide a more precise measurement of service and interest costs by improving the correlation between projected benefit cash flows to the corresponding spot yield curve rates. We will account for this change in estimate prospectively, beginning May 1, 2017. The new approach will not affect the measurement of our plan obligations, but will generally result in lower service cost and interest cost in periods when the yield curve is upward-sloping. For fiscal 2018, we estimate that using the new estimation approach will reduce total service and interest cost by approximately $7 million when compared to the cost computed using the prior approach.
Income Taxes
Significant judgment is required in evaluating our tax positions. We establish liabilities when some positions are likely to be challenged and may not succeed, despite our belief that our tax return positions are fully supportable. We adjust these liabilities in light of changing circumstances, such as the progress of a tax audit. We believe current liabilities are appropriate for all known contingencies, but this situation could change.
44
Years can elapse before we can resolve a particular matter for which we have established a tax liability. Although predicting the final outcome or the timing of resolution of any particular tax matter can be difficult, we believe our liabilities reflect the likely outcome of known tax contingencies. Unfavorable settlement of any particular issue could require use of our cash. Conversely, a favorable resolution could result in reduced cash tax payments, the reversal of previously established liabilities, or some combination of these results, which could reduce our effective tax rate.
New Accounting Pronouncements
As discussed in Note 1 to the accompanying financial statements, we are currently evaluating the potential impact of several new accounting pronouncements to be adopted in the next few years.
Item 7A. Quantitative and Qualitative Disclosures about Market Risk
Risk Management Framework
Success in business requires risk-taking, but we must balance risk and reward appropriately. Our enterprise risk management process is intended to ensure that we take risks knowingly and thoughtfully and that we balance potential risks and rewards appropriately. Our integrated enterprise risk management framework is designed to identify, evaluate, communicate, and appropriately mitigate risks across our operations. Within this framework:
• | Our Board of Directors is responsible for overseeing our enterprise risk assessment and mitigation processes and procedures. The Board itself oversees some strategic enterprise risks and delegates responsibility for other risks to committees that report to the Board regularly on matters within their purview, and to management. |
◦ | The Audit Committee oversees policies and processes related to enterprise risk management, compliance with legal and regulatory requirements, and financial reporting and accounting control risks. |
◦ | The Compensation Committee periodically reviews our compensation policies and practices to assess whether they could lead to unnecessary risk taking. |
• | Our Enterprise Risk Management Committee, composed of managers from an array of levels, functions, and geographies, reports to the Board at least annually. It leads our risk management program globally, which systematically identifies and evaluates the major risks we face, identifies people responsible for managing each risk, ensures that risk mitigation plans are in place and, together with internal audit, verifies that mitigation plans are being followed. |
• | Our management Ethics, Compliance and Risk Team, comprising a number of senior executives and subject matter experts, meets throughout the year to address issues related to risk, ethics, and compliance; to coordinate the work of those areas; and to oversee the formulation and promulgation of company policies and the training of employees in compliance with them. |
• | Our Risk Management function identifies and assesses potential operational hazards and safety and security risks, and facilitates ongoing communication about those risks with the Enterprise Risk Management Committee and our executive leaders. |
• | Our Internal Audit Department evaluates the ongoing effectiveness of our key internal controls through periodic audit and review procedures. |
• | The Chief Ethics and Compliance Officer in our legal department helps ensure that all of our employees’ actions globally comply with all internal policies and applicable laws. |
Market Risks
We are exposed to market risks arising from adverse changes in foreign exchange rates, commodity prices affecting the cost of our raw materials and energy, and interest rates. We try to manage risk responsibly through a variety of strategies, including production initiatives and hedging. Our foreign currency hedging contracts are subject to exchange rate changes, our commodity forward purchase contracts are subject to commodity price changes, and some of our debt obligations are subject to interest rate changes. Below, we discuss these exposures and provide a sensitivity analysis as to how these changes could affect our results of operations. See Notes 6 and 8 to our Consolidated Financial Statements for details.
See Note 4 to our Consolidated Financial Statements for details on our grape and agave purchase obligations, which are exposed to commodity price risk, and “Critical Accounting Estimates” in “Item 7. Management’s Discussion and Analysis of Financial Condition and Results of Operations” for a discussion of our pension and other postretirement plans’ exposure to interest
45
rate risks. Also see “Item 1A. Risk Factors” for details on how economic conditions affecting market risks also affect the demand for and pricing of our products and how we are affected by exchange rate fluctuations.
Foreign Exchange. The more we expand our business outside the United States, the more our financial results will be exposed to exchange rate fluctuations. This exposure includes sales of our products in currencies other than the dollar and the cost of goods, services, and manpower we purchase in currencies other than the dollar. Because we sell more in local currencies than we purchase, we have a net exposure to changes in the dollar’s value. To buffer these exchange rate fluctuations, we regularly hedge a portion of our foreign currency exposure. But over the long term, our reported financial results will generally be negatively affected by a stronger dollar and positively affected by a weaker dollar.
We estimate that our foreign currency revenue for our largest exposures will exceed our foreign currency expenses by approximately $655 million in fiscal 2018. Foreign exchange rates also affect the carrying value of our foreign-currency-denominated assets and liabilities.
We routinely use foreign currency forward and option contracts to hedge a portion of our transactional foreign exchange risk and, in some circumstances, our net asset exposure. If these contracts remain effective, we will not recognize any unrealized gains or losses until we either recognize the underlying hedged transactions in earnings or convert the underlying hedged net asset exposures. At April 30, 2017, our total foreign currency hedges had a notional value of $1,188 million, with a maximum term outstanding of 36 months, and were recorded as a net asset at their fair value of $15 million.
As of April 30, 2017, we hedged approximately 77% of our total transactional exposure to foreign exchange fluctuations in fiscal 2018 for our major currencies by entering into foreign currency forward contracts. Considering these hedges, we estimate that a 10% increase/decrease in the average value of the dollar in fiscal 2018 relative to fiscal 2017’s effective exchange rates for our significant currency exposures would decrease/increase our fiscal 2018 operating income by approximately $18 million.
Commodity Prices. Commodity prices are affected by weather, supply and demand, as well as geopolitical and economic variables. To reduce price volatility, we use deliverable contracts for corn (in which we take physical delivery of the corn underlying each contract) rather than futures contracts or options.
Interest Rates. Our cash and cash equivalents ($182 million as of April 30, 2017) and variable-rate debt ($211 million as of April 30, 2017) are exposed to the risk of interest rate changes. Based on the net balance of these items as of April 30, 2017, a 1% increase in interest rates would result in a negligible increase in net interest expense.
46
Item 8. Financial Statements and Supplementary Data
Table of Contents | |
Page | |
47
REPORTS OF MANAGEMENT
MANAGEMENT’S RESPONSIBILITY FOR FINANCIAL STATEMENTS
Our management is responsible for the preparation, presentation, and integrity of the financial information presented in this report. The consolidated financial statements were prepared in conformity with accounting principles generally accepted in the United States, including amounts based on management’s best estimates and judgments. In management’s opinion, the consolidated financial statements fairly present the Company’s financial position, results of operations, and cash flows.
The Audit Committee of the Board of Directors, comprising only independent directors, meets regularly with our external auditors, the independent registered public accounting firm PricewaterhouseCoopers LLP (PwC), with our internal auditors, and with representatives of management to review accounting, internal control structure, and financial reporting matters. Our internal auditors and PwC have full, free access to the Audit Committee. As set forth in our Code of Conduct and Compliance Guidelines, we are firmly committed to adhering to the highest standards of moral and ethical behavior in our business activities.
MANAGEMENT’S REPORT ON INTERNAL CONTROL OVER FINANCIAL REPORTING
Management is also responsible for establishing and maintaining effective internal control over financial reporting, as defined in Rule 13a-15(f) under the Securities Exchange Act of 1934. Our internal control over financial reporting is designed to provide reasonable assurance regarding the reliability of financial reporting and the preparation of financial statements for external purposes in accordance with accounting principles generally accepted in the United States. Because of its inherent limitations, internal control over financial reporting may not prevent or detect misstatements.
As of the end of our fiscal year, management conducted an assessment of the effectiveness of our internal control over financial reporting based on the framework and criteria in Internal Control - Integrated Framework (2013) issued by the Committee of Sponsoring Organizations of the Treadway Commission. Based on this assessment, management concluded that our internal control over financial reporting was effective as of April 30, 2017. PwC has audited the effectiveness of our internal control over financial reporting as of April 30, 2017, as stated in their report.
The Company acquired The BenRiach Distillery Company Limited (BenRiach) in a purchase business combination during fiscal 2017. Based on SEC staff interpretive guidance for newly-acquired businesses, management excluded BenRiach from its assessment of our internal control over financial reporting as of April 30, 2017. BenRiach is a wholly-owned subsidiary whose total assets and total net sales represented approximately 4% and 1% respectively, of the related consolidated financial statement amounts as of and for the year ended April 30, 2017.
Dated: | June 14, 2017 | ||
By: | /s/ Paul C. Varga | ||
Paul C. Varga | |||
Chief Executive Officer and Chairman of the Company | |||
By: | /s/ Jane C. Morreau | ||
Jane C. Morreau | |||
Executive Vice President and Chief Financial Officer | |||
48
Report of Independent Registered Public Accounting Firm
To the Board of Directors and Stockholders
of Brown-Forman Corporation:
In our opinion, the consolidated financial statements listed in the index appearing under Item 15(a)(1) present fairly, in all material respects, the financial position of Brown- Forman Corporation and its subsidiaries at April 30, 2017 and 2016, and the results of their operations and their cash flows for each of the three years in the period ended April 30, 2017 in conformity with accounting principles generally accepted in the United States of America. In addition, in our opinion, the financial statement schedule listed in the index appearing under Item 15(a)(2) presents fairly, in all material respects, the information set forth therein when read in conjunction with the related consolidated financial statements. Also in our opinion, the Company maintained, in all material respects, effective internal control over financial reporting as of April 30, 2017, based on criteria established in Internal Control - Integrated Framework (2013) issued by the Committee of Sponsoring Organizations of the Treadway Commission (COSO). The Company's management is responsible for these financial statements and financial statement schedule, for maintaining effective internal control over financial reporting and for its assessment of the effectiveness of internal control over financial reporting, included in the accompanying Management's Report on Internal Control over Financial Reporting. Our responsibility is to express opinions on these financial statements, on the financial statement schedule, and on the Company's internal control over financial reporting based on our integrated audits. We conducted our audits in accordance with the standards of the Public Company Accounting Oversight Board (United States). Those standards require that we plan and perform the audits to obtain reasonable assurance about whether the financial statements are free of material misstatement and whether effective internal control over financial reporting was maintained in all material respects. Our audits of the financial statements included examining, on a test basis, evidence supporting the amounts and disclosures in the financial statements, assessing the accounting principles used and significant estimates made by management, and evaluating the overall financial statement presentation. Our audit of internal control over financial reporting included obtaining an understanding of internal control over financial reporting, assessing the risk that a material weakness exists, and testing and evaluating the design and operating effectiveness of internal control based on the assessed risk. Our audits also included performing such other procedures as we considered necessary in the circumstances. We believe that our audits provide a reasonable basis for our opinions.
As discussed in Note 1 to the consolidated financial statements, the Company changed the manner in which it presents excise taxes in fiscal year 2017.
A company’s internal control over financial reporting is a process designed to provide reasonable assurance regarding the reliability of financial reporting and the preparation of financial statements for external purposes in accordance with generally accepted accounting principles. A company’s internal control over financial reporting includes those policies and procedures that (i) pertain to the maintenance of records that, in reasonable detail, accurately and fairly reflect the transactions and dispositions of the assets of the company; (ii) provide reasonable assurance that transactions are recorded as necessary to permit preparation of financial statements in accordance with generally accepted accounting principles, and that receipts and expenditures of the company are being made only in accordance with authorizations of management and directors of the company; and (iii) provide reasonable assurance regarding prevention or timely detection of unauthorized acquisition, use, or disposition of the company’s assets that could have a material effect on the financial statements.
Because of its inherent limitations, internal control over financial reporting may not prevent or detect misstatements. Also, projections of any evaluation of effectiveness to future periods are subject to the risk that controls may become inadequate because of changes in conditions, or that the degree of compliance with the policies or procedures may deteriorate.
As described in Management’s Report on Internal Control over Financial Reporting, management has excluded The BenRiach Distillery Company Limited (“BenRiach”) from its assessment of internal control over financial reporting as of April 30, 2017 because BenRiach was acquired by the Company in a purchase business combination during fiscal year 2017. We have also excluded BenRiach from our audit of internal control over financial reporting. BenRiach is a wholly-owned subsidiary whose total assets and total net sales represent 4% and 1%, respectively, of the related consolidated financial statement amounts as of and for the year ended April 30, 2017.
/s/ PricewaterhouseCoopers LLP
Louisville, KY
June 14, 2017
49
BROWN-FORMAN CORPORATION
CONSOLIDATED STATEMENTS OF OPERATIONS
(Dollars in millions, except per share amounts)
Year Ended April 30, | 2015 | 2016 | 2017 | ||||||||
Sales | $ | 4,096 | $ | 4,011 | $ | 3,857 | |||||
Excise taxes | 962 | 922 | 863 | ||||||||
Net sales | 3,134 | 3,089 | 2,994 | ||||||||
Cost of sales | 951 | 945 | 973 | ||||||||
Gross profit | 2,183 | 2,144 | 2,021 | ||||||||
Advertising expenses | 437 | 417 | 383 | ||||||||
Selling, general, and administrative expenses | 697 | 688 | 667 | ||||||||
Gain on sale of business | — | (485 | ) | — | |||||||
Other expense (income), net | 22 | (9 | ) | (18 | ) | ||||||
Operating income | 1,027 | 1,533 | 989 | ||||||||
Interest income | 2 | 2 | 3 | ||||||||
Interest expense | 27 | 46 | 59 | ||||||||
Income before income taxes | 1,002 | 1,489 | 933 | ||||||||
Income taxes | 318 | 422 | 264 | ||||||||
Net income | $ | 684 | $ | 1,067 | $ | 669 | |||||
Earnings per share: | |||||||||||
Basic | $ | 1.62 | $ | 2.63 | $ | 1.72 | |||||
Diluted | $ | 1.60 | $ | 2.61 | $ | 1.71 | |||||
The accompanying notes are an integral part of the consolidated financial statements.
50
BROWN-FORMAN CORPORATION
CONSOLIDATED STATEMENTS OF COMPREHENSIVE INCOME
(Dollars in millions)
Year Ended April 30, | 2015 | 2016 | 2017 | ||||||||
Net income | $ | 684 | $ | 1,067 | $ | 669 | |||||
Other comprehensive income (loss), net of tax: | |||||||||||
Currency translation adjustments | (114 | ) | (23 | ) | (73 | ) | |||||
Cash flow hedge adjustments | 32 | (17 | ) | — | |||||||
Postretirement benefits adjustments | (30 | ) | (10 | ) | 33 | ||||||
Net other comprehensive income (loss) | (112 | ) | (50 | ) | (40 | ) | |||||
Comprehensive income | $ | 572 | $ | 1,017 | $ | 629 | |||||
The accompanying notes are an integral part of the consolidated financial statements.
51
BROWN-FORMAN CORPORATION
CONSOLIDATED BALANCE SHEETS
(Dollars in millions)
April 30, | 2016 | 2017 | |||||
ASSETS | |||||||
Cash and cash equivalents | $ | 263 | $ | 182 | |||
Accounts receivable, less allowance for doubtful accounts of $9 in 2016 and $7 in 2017 | 559 | 557 | |||||
Inventories: | |||||||
Barreled whiskey | 666 | 873 | |||||
Finished goods | 187 | 186 | |||||
Work in process | 116 | 119 | |||||
Raw materials and supplies | 85 | 92 | |||||
Total inventories | 1,054 | 1,270 | |||||
Other current assets | 357 | 342 | |||||
Total current assets | 2,233 | 2,351 | |||||
Property, plant, and equipment, net | 629 | 713 | |||||
Goodwill | 590 | 753 | |||||
Other intangible assets | 595 | 641 | |||||
Deferred tax assets | 17 | 16 | |||||
Other assets | 119 | 151 | |||||
Total assets | $ | 4,183 | $ | 4,625 | |||
LIABILITIES | |||||||
Accounts payable and accrued expenses | $ | 501 | $ | 501 | |||
Accrued income taxes | 19 | 9 | |||||
Short-term borrowings | 271 | 211 | |||||
Current portion of long-term debt | — | 249 | |||||
Total current liabilities | 791 | 970 | |||||
Long-term debt | 1,230 | 1,689 | |||||
Deferred tax liabilities | 101 | 152 | |||||
Accrued pension and other postretirement benefits | 353 | 314 | |||||
Other liabilities | 146 | 130 | |||||
Total liabilities | 2,621 | 3,255 | |||||
Commitments and contingencies | |||||||
STOCKHOLDERS’ EQUITY | |||||||
Common stock: | |||||||
Class A, voting, $0.15 par value | 13 | 25 | |||||
Class B, nonvoting, $0.15 par value | 21 | 43 | |||||
Additional paid-in capital | 114 | 65 | |||||
Retained earnings | 4,065 | 4,470 | |||||
Accumulated other comprehensive income (loss), net of tax | (350 | ) | (390 | ) | |||
Treasury stock, at cost (59,143,000 and 70,540,000 shares in 2016 and 2017, respectively) | (2,301 | ) | (2,843 | ) | |||
Total stockholders’ equity | 1,562 | 1,370 | |||||
Total liabilities and stockholders’ equity | $ | 4,183 | $ | 4,625 | |||
The accompanying notes are an integral part of the consolidated financial statements.
52
BROWN-FORMAN CORPORATION
CONSOLIDATED STATEMENTS OF CASH FLOWS
(Dollars in millions)
Year Ended April 30, | 2015 | 2016 | 2017 | ||||||||
Cash flows from operating activities: | |||||||||||
Net income | $ | 684 | $ | 1,067 | $ | 669 | |||||
Adjustments to reconcile net income to net cash provided by operations: | |||||||||||
Gain on sale of business | — | (485 | ) | — | |||||||
Depreciation and amortization | 51 | 56 | 58 | ||||||||
Stock-based compensation expense | 15 | 15 | 14 | ||||||||
Deferred income taxes | 6 | 10 | (10 | ) | |||||||
Other, net | 9 | 2 | 2 | ||||||||
Changes in assets and liabilities, excluding the effects of sale and acquisition of businesses: | |||||||||||
Accounts receivable | (50 | ) | 8 | 6 | |||||||
Inventories | (102 | ) | (127 | ) | (86 | ) | |||||
Other current assets | (30 | ) | (57 | ) | 12 | ||||||
Accounts payable and accrued expenses | 64 | 29 | (17 | ) | |||||||
Accrued income taxes | (58 | ) | 7 | (11 | ) | ||||||
Noncurrent assets and liabilities | 19 | (1 | ) | 2 | |||||||
Cash provided by operating activities | 608 | 524 | 639 | ||||||||
Cash flows from investing activities: | |||||||||||
Proceeds from sale of business | — | 543 | — | ||||||||
Acquisition of business, net of cash acquired | — | — | (307 | ) | |||||||
Additions to property, plant, and equipment | (120 | ) | (108 | ) | (112 | ) | |||||
Acquisition of brand names and trademarks | (4 | ) | — | — | |||||||
Computer software expenditures | (1 | ) | (2 | ) | (3 | ) | |||||
Cash provided by (used for) investing activities | (125 | ) | 433 | (422 | ) | ||||||
Cash flows from financing activities: | |||||||||||
Net change in short-term borrowings | 183 | 80 | (122 | ) | |||||||
Repayment of long-term debt | — | (250 | ) | — | |||||||
Proceeds from long-term debt | — | 490 | 717 | ||||||||
Debt issuance costs | — | (5 | ) | (5 | ) | ||||||
Net payments related to exercise of stock-based awards | (14 | ) | (17 | ) | (10 | ) | |||||
Excess tax benefits from stock-based awards | 18 | 15 | — | ||||||||
Acquisition of treasury stock | (462 | ) | (1,107 | ) | (561 | ) | |||||
Dividends paid | (256 | ) | (266 | ) | (274 | ) | |||||
Repayment of short-term obligation associated with acquisition of business | — | — | (30 | ) | |||||||
Cash used for financing activities | (531 | ) | (1,060 | ) | (285 | ) | |||||
Effect of exchange rate changes on cash and cash equivalents | (19 | ) | (4 | ) | (13 | ) | |||||
Net increase (decrease) in cash and cash equivalents | (67 | ) | (107 | ) | (81 | ) | |||||
Cash and cash equivalents, beginning of period | 437 | 370 | 263 | ||||||||
Cash and cash equivalents, end of period | $ | 370 | $ | 263 | $ | 182 | |||||
Supplemental disclosure of cash paid for: | |||||||||||
Interest | $ | 27 | $ | 41 | $ | 48 | |||||
Income taxes | $ | 375 | $ | 430 | $ | 266 | |||||
The accompanying notes are an integral part of the consolidated financial statements.
53
BROWN-FORMAN CORPORATION
CONSOLIDATED STATEMENTS OF STOCKHOLDERS’ EQUITY
(Dollars in millions, except per share amounts)
Class A Common Stock | Class B Common Stock | Additional Paid-in Capital | Retained Earnings | AOCI | Treasury Stock | Total | |||||||||||||||||||||
Balance at April 30, 2014 | $ | 13 | $ | 21 | $ | 81 | $ | 2,894 | $ | (188 | ) | $ | (789 | ) | $ | 2,032 | |||||||||||
Net income | 684 | 684 | |||||||||||||||||||||||||
Net other comprehensive income (loss) | (112 | ) | (112 | ) | |||||||||||||||||||||||
Cash dividends ($0.605 per share) | (256 | ) | (256 | ) | |||||||||||||||||||||||
Acquisition of treasury stock | (462 | ) | (462 | ) | |||||||||||||||||||||||
Stock-based compensation expense | 15 | 15 | |||||||||||||||||||||||||
Stock issued under compensation plans | 23 | 23 | |||||||||||||||||||||||||
Loss on issuance of treasury stock issued under compensation plans | (15 | ) | (22 | ) | (37 | ) | |||||||||||||||||||||
Excess tax benefits from stock-based awards | 18 | 18 | |||||||||||||||||||||||||
Balance at April 30, 2015 | 13 | 21 | 99 | 3,300 | (300 | ) | (1,228 | ) | 1,905 | ||||||||||||||||||
Net income | 1,067 | 1,067 | |||||||||||||||||||||||||
Net other comprehensive income (loss) | (50 | ) | (50 | ) | |||||||||||||||||||||||
Cash dividends ($0.655 per share) | (266 | ) | (266 | ) | |||||||||||||||||||||||
Acquisition of treasury stock | (1,107 | ) | (1,107 | ) | |||||||||||||||||||||||
Stock-based compensation expense | 15 | 15 | |||||||||||||||||||||||||
Stock issued under compensation plans | 34 | 34 | |||||||||||||||||||||||||
Loss on issuance of treasury stock issued under compensation plans | (15 | ) | (36 | ) | (51 | ) | |||||||||||||||||||||
Excess tax benefits from stock-based awards | 15 | 15 | |||||||||||||||||||||||||
Balance at April 30, 2016 | 13 | 21 | 114 | 4,065 | (350 | ) | (2,301 | ) | 1,562 | ||||||||||||||||||
Cumulative effect of change in accounting principle (Note 1) | 10 | 10 | |||||||||||||||||||||||||
Stock split (Note 11) | 12 | 22 | (34 | ) | — | ||||||||||||||||||||||
Net income | 669 | 669 | |||||||||||||||||||||||||
Net other comprehensive income (loss) | (40 | ) | (40 | ) | |||||||||||||||||||||||
Cash dividends ($0.705 per share) | (274 | ) | (274 | ) | |||||||||||||||||||||||
Acquisition of treasury stock | (561 | ) | (561 | ) | |||||||||||||||||||||||
Stock-based compensation expense | 14 | 14 | |||||||||||||||||||||||||
Stock issued under compensation plans | 19 | 19 | |||||||||||||||||||||||||
Loss on issuance of treasury stock issued under compensation plans | (29 | ) | (29 | ) | |||||||||||||||||||||||
Balance at April 30, 2017 | $ | 25 | $ | 43 | $ | 65 | $ | 4,470 | $ | (390 | ) | $ | (2,843 | ) | $ | 1,370 | |||||||||||
The accompanying notes are an integral part of the consolidated financial statements.
54
NOTES TO CONSOLIDATED FINANCIAL STATEMENTS
(Dollars and other currency amounts in millions, except per share data)
1. ACCOUNTING POLICIES
We prepare our consolidated financial statements in conformity with accounting principles generally accepted in the United States (GAAP). We also apply the following accounting policies when preparing our consolidated financial statements:
Principles of consolidation. Our consolidated financial statements include the accounts of all subsidiaries in which we have a controlling financial interest. We eliminate all intercompany transactions.
Estimates. To prepare financial statements that conform with GAAP, our management must make informed estimates that affect how we report revenues, expenses, assets, and liabilities, including contingent assets and liabilities. Actual results could differ from these estimates.
Cash equivalents. Cash equivalents include bank demand deposits and all highly liquid investments with original maturities of three months or less.
Allowance for doubtful accounts. We evaluate the collectability of accounts receivable based on a combination of factors. When we are aware of circumstances that may impair a specific customer’s ability to meet its financial obligations, we record a specific allowance to reduce the net recognized receivable to the amount we believe will be collected. We write off the uncollectable amount against the allowance when we have exhausted our collection efforts.
Inventories. Inventories are valued at the lower of cost or market value. Approximately 54% of our consolidated inventories are valued using the last-in, first-out (LIFO) cost method, which we use for the majority of our U.S. inventories. We value the remainder of our inventories primarily using the first-in, first-out (FIFO) cost method. FIFO cost approximates current replacement cost. If we had used the FIFO method for all inventories, they would have been $248 and $272 higher than reported at April 30, 2016 and 2017, respectively.
Because we age most of our whiskeys in barrels for three to six years, we bottle and sell only a portion of our whiskey inventory each year. Following industry practice, we classify all barreled whiskey as a current asset. We include warehousing, insurance, ad valorem taxes, and other carrying charges applicable to barreled whiskey in inventory costs.
We classify bulk wine, agave inventories, tequila, and liquid in bottling tanks as work in process.
Property, plant, and equipment. We state property, plant, and equipment at cost less accumulated depreciation. We calculate depreciation on a straight-line basis using our estimates of useful life, which are 20–40 years for buildings and improvements; 3–10 years for machinery, equipment, vehicles, furniture, and fixtures; and 3–7 years for capitalized software.
We assess our property, plant, and equipment for impairment whenever events or changes in circumstances indicate that the carrying value of those assets may not be recoverable. When we do not expect to recover the carrying value of an asset (or asset group) through undiscounted future cash flows, we write it down to its estimated fair value. We determine fair value using discounted estimated future cash flows, considering market values for similar assets when available.
When we retire or dispose of property, plant, and equipment, we remove its cost and accumulated depreciation from our balance sheet and reflect any gain or loss in operating income. We expense the costs of repairing and maintaining our property, plant, and equipment as we incur them.
Goodwill and other intangible assets. We have obtained most of our brands by acquiring other companies. When we acquire another company, we first allocate the purchase price to identifiable assets and liabilities, including intangible brand names and trademarks (“brand names”), based on estimated fair value. We then record any remaining purchase price as goodwill. We do not amortize goodwill or other intangible assets with indefinite lives. We consider all of our brand names to have indefinite lives.
We assess our goodwill and other indefinite-lived intangible assets for impairment at least annually. If an asset’s fair value is less than its book value, we write it down to its estimated fair value. For goodwill, if the book value of the reporting unit exceeds its estimated fair value, we measure for potential impairment by comparing the implied fair value of the reporting unit’s goodwill, determined in the same manner as in a business combination, to the goodwill’s book value. We estimate the reporting unit’s fair value using discounted estimated future cash flows or market information. We typically estimate the fair value of a brand name using the either the “relief from royalty” or “excess earnings” method. We also consider market values for similar assets when available. Considerable management judgment is necessary to estimate fair value, including the selection of assumptions about future cash flows, discount rates, and royalty rates.
55
We have the option, before quantifying the fair value of a reporting unit or brand name, to evaluate qualitative factors to assess whether it is more likely than not that our goodwill or brand names are impaired. If we determine that is not the case, then we are not required to quantify the fair value. That assessment also takes considerable management judgment.
Foreign currency transactions and translation. We report all gains and losses from foreign currency transactions (those denominated in a currency other than the entity’s functional currency) in current income. The U.S. dollar is the functional currency for most of our consolidated entities. The local currency is the functional currency for some of our consolidated foreign entities. We translate the financial statements of those foreign entities into U.S. dollars, using the exchange rate in effect at the balance sheet date to translate assets and liabilities, and using the average exchange rate for the reporting period to translate income and expenses. We record the resulting translation adjustments in other comprehensive income (loss).
Revenue recognition. We recognize revenue when title and risk of loss pass to the customer, typically when the product is shipped. Some sales contracts contain customer acceptance provisions that grant a right of return on the basis of either subjective or objective criteria. We record revenue net of estimated sales returns, allowances, and discounts.
Excise taxes. Our sales are often subject to excise taxes that we collect from our customers and remit to governmental authorities. Effective beginning May 1, 2016, we changed our presentation of excise taxes from the gross method (included in sales and costs) to the net method (excluded from sales). As a result, the amounts presented as “net sales” in our financial statements now exclude excise taxes. We believe the change in presentation to the net method is preferable because it is more representative of the internal financial information reviewed by management in assessing our performance and more consistent with the presentation used by our major competitors in their external financial statements. Prior period financial statements have been recast to conform to the new presentation.
Cost of sales. Cost of sales includes the costs of receiving, producing, inspecting, warehousing, insuring, and shipping goods sold during the period.
Shipping and handling fees and costs. We report the amounts we bill to our customers for shipping and handling as net sales, and we report the costs we incur for shipping and handling as cost of sales.
Advertising costs. We expense the costs of advertising during the year when the advertisements first take place.
Selling, general, and administrative expenses. Selling, general, and administrative expenses include the costs associated with our sales force, administrative staff and facilities, and other expenses related to our non-manufacturing functions.
Income taxes. We base our annual provision for income taxes on the pre-tax income reflected in our consolidated statement of operations. We establish deferred tax liabilities or assets for temporary differences between GAAP and tax reporting bases and later adjust them to reflect changes in tax rates expected to be in effect when the temporary differences reverse. We record a valuation allowance as necessary to reduce a deferred tax asset to the amount that we believe is more likely than not to be realized. We do not provide deferred income taxes on undistributed earnings of foreign subsidiaries that we expect to permanently reinvest. We record a deferred tax charge in prepaid taxes for the difference between GAAP and tax reporting bases with respect to the elimination of intercompany profit in ending inventory.
We assess our uncertain income tax positions using a two-step process. First, we evaluate whether the tax position will more likely than not, based on its technical merits, be sustained upon examination, including resolution of any related appeals or litigation. For a tax position that does not meet this first criterion, we recognize no tax benefit. For a tax position that does meet the first criterion, we recognize a tax benefit in an amount equal to the largest amount of benefit that we believe has more than a 50% likelihood of being realized upon ultimate resolution. We record interest and penalties on uncertain tax positions as income tax expense.
Recently-adopted accounting pronouncements. During fiscal 2017, we adopted new guidance related to certain aspects of the accounting for stock-based compensation, including the income tax consequences. Under the new guidance, we recognize all tax benefits related to stock-based compensation as an income tax benefit in our statement of operations, and include all income tax cash flows within operating activities in our statement of cash flows. Under the previous accounting guidance, we recognized some of those tax benefits (excess tax benefits) as additional paid-in capital and classified that amount as a financing activity in our statement of cash flows. We adopted these provisions of the new guidance on a prospective basis as of May 1, 2016. As a result, our net income and operating cash flows for fiscal 2017 include excess tax benefits of $9. Prior period financial statements have not been adjusted.
56
Also, under the new guidance, we recognize the excess tax benefits during the period in which the related awards vest or are exercised. Under the previous accounting guidance, we recognized those benefits during the period in which they reduced taxes payable. We adopted this provision of the new guidance on a modified retrospective basis with a cumulative-effect adjustment of $10 to retained earnings as of May 1, 2016.
During fiscal 2017, we also adopted revised disclosure guidance related to investments measured at net asset value. Under the revised guidance, investments measured at net asset value as a practical expedient are no longer categorized in the fair value hierarchy.
New accounting pronouncements to be adopted. In May 2014, the Financial Accounting Standards Board (FASB) issued a new revenue recognition standard that, along with various amendments issued in 2015 and 2016, will replace substantially all existing revenue recognition guidance in U.S. GAAP. The core principle of the standard requires an entity to recognize revenue to depict the transfer of goods or services to customers in an amount that reflects the consideration that it expects to be entitled to in exchange for those goods or services. The new standard also requires significantly more financial statement disclosures than existing revenue standards do.
The new standard can be adopted using either of two transition options: a full retrospective transition method or a modified retrospective method. Under the full retrospective method, the guidance would be applied to each prior reporting period presented. Under the modified retrospective method, the cumulative effect of initially applying the new guidance would be recorded as an adjustment to the opening balance of retained earnings for the annual reporting period that includes the date of initial application.
We are continuing to assess the potential impact of the new guidance on our financial statements. Based on our assessment to date, we currently expect our accounting for certain customer incentives to be the area most likely affected by the new recognition requirements. We also expect to disclose additional information about revenues under the new standard. As we progress in our assessment, we are also identifying and preparing to make any changes to our accounting policies and practices, systems, processes, and controls that may be required to implement the new standard. We currently expect to choose the modified retrospective method in transitioning to the new standard, which we will adopt effective May 1, 2018.
We are also currently evaluating the potential impact on our financial statements of the additional new accounting pronouncements described below:
• | In February 2016, the FASB issued a new standard on accounting for leases. Under the new standard, a lessee should recognize on the balance sheet a liability to make lease payments and a right-of-use asset representing its right to use the underlying asset for the lease term. The standard permits an entity to make an accounting policy election not to recognize lease assets and liabilities for leases with a term of 12 months or less. The standard, which also requires additional quantitative and qualitative disclosures about leasing arrangements, will become effective for us beginning fiscal 2020. It is to be applied using a modified retrospective transition approach for leases existing at the beginning of the earliest comparative period presented in the adoption-period financial statements. |
• | In August 2016, the FASB issued new guidance on the classification of certain cash receipts and cash payments on the statement of cash flows. The new guidance, which addresses eight specific cash flow classification issues, is intended to reduce diversity in practice. It will become effective for us beginning fiscal 2019 and is to be applied retrospectively. |
• | In October 2016, the FASB issued revised guidance that requires the recognition of the income tax consequences (expense or benefit) of an intercompany transfer of assets other than inventory when the transfer occurs. It maintains the existing requirement to defer the recognition of the income tax consequences of an intercompany transfer of inventory until the inventory is sold to an outside party. The guidance will become effective for us beginning fiscal 2019 and is to be applied on a modified retrospective basis through a cumulative-effect adjustment directly to retained earnings as of the beginning of the period of adoption. |
• | In January 2017, the FASB issued updated guidance that eliminates the second step of the existing two-step quantitative test of goodwill for impairment. Under the new guidance, the quantitative test will consist of a single step in which the carrying amount of the reporting unit will be compared to its fair value. An impairment charge would be recognized for the amount by which the carrying amount exceeds the reporting unit’s fair value; however, the amount of the impairment would be limited to the total amount of goodwill allocated to the reporting unit. The guidance does not affect the existing option to perform the qualitative assessment for a reporting unit to determine whether the quantitative impairment test is necessary. It will become effective for us beginning fiscal 2021 and is to be applied prospectively. |
57
• | In March 2017, the FASB issued new guidance for the presentation of the net periodic cost (NPC) associated with pension and other postretirement benefit plans. The guidance requires the service cost component of the NPC to be reported in the income statement in the same line item(s) as other compensation costs arising from services rendered by the pertinent employees during the period. The other components of the NPC are to be presented separately from the service cost and outside of income from operations. In addition, the guidance allows only the service cost component of NPC to be eligible for capitalization when applicable. The guidance will become effective for us beginning fiscal 2019. It is to be applied retrospectively for the presentation in the income statement and prospectively, on and after the effective date, for the capitalization of service cost. |
Early application of any of the new accounting pronouncements described above is permitted. Although we have not yet determined our plans for adoption, we do not currently expect to apply any of the new guidance before their effective dates.
2. BALANCE SHEET INFORMATION
Supplemental information on our year-end balance sheets is as follows:
April 30, | 2016 | 2017 | |||||
Other current assets: | |||||||
Prepaid taxes | $ | 208 | $ | 210 | |||
Other | 149 | 132 | |||||
$ | 357 | $ | 342 | ||||
Property, plant, and equipment: | |||||||
Land | $ | 76 | $ | 81 | |||
Buildings | 468 | 497 | |||||
Equipment | 619 | 659 | |||||
Construction in process | 54 | 96 | |||||
1,217 | 1,333 | ||||||
Less accumulated depreciation | 588 | 620 | |||||
$ | 629 | $ | 713 | ||||
Accounts payable and accrued expenses: | |||||||
Accounts payable, trade | $ | 121 | $ | 137 | |||
Accrued expenses: | |||||||
Advertising and promotion | 133 | 111 | |||||
Compensation and commissions | 105 | 97 | |||||
Excise and other non-income taxes | 58 | 61 | |||||
Other | 84 | 95 | |||||
380 | 364 | ||||||
$ | 501 | $ | 501 | ||||
Other liabilities: | |||||||
Deferred benefit – tax (Note 13) | $ | 59 | $ | 43 | |||
Other | 87 | 87 | |||||
$ | 146 | $ | 130 | ||||
58
3. GOODWILL AND OTHER INTANGIBLE ASSETS
The following table shows the changes in goodwill (which include no accumulated impairment losses) and other intangible assets over the past two years:
Goodwill | Other Intangible Assets | ||||||
Balance as of April 30, 2015 | $ | 607 | $ | 611 | |||
Sale of business (Note 16) | (16 | ) | (22 | ) | |||
Foreign currency translation adjustment | (1 | ) | 6 | ||||
Balance as of April 30, 2016 | 590 | 595 | |||||
Acquisition of business (Note 17) | 183 | 65 | |||||
Foreign currency translation adjustment | (20 | ) | (19 | ) | |||
Balance as of April 30, 2017 | $ | 753 | $ | 641 | |||
Our other intangible assets consist of trademarks and brand names, all with indefinite useful lives.
4. COMMITMENTS AND CONTINGENCIES
Commitments. We made rental payments for real estate, vehicles, and office, computer, and manufacturing equipment under operating leases of $23, $23, and $23 during 2015, 2016, and 2017, respectively. We have commitments related to minimum lease payments of $17 in 2018, $13 in 2019, $9 in 2020, $5 in 2021, $3 in 2022, and $1 after 2022.
We have contracted with various growers and wineries to supply some of our future grape and bulk wine requirements. Many of these contracts call for prices to be adjusted annually up or down, according to market conditions. Some contracts set a fixed purchase price that might be higher or lower than prevailing market prices. We have total purchase obligations related to both types of contracts of $12 in 2018, $9 in 2019, $6 in 2020, $4 in 2021, $3 in 2022, and $1 after 2022.
We also have contracts for the purchase of agave, which is used to produce tequila. These contracts provide for prices to be determined based on market conditions at the time of harvest, which, although not specified, is expected to occur over the next 10 years. As of April 30, 2017, based on current market prices, obligations under these contracts total $4.
Contingencies. We operate in a litigious environment, and we are sued in the normal course of business. Sometimes plaintiffs seek substantial damages. Significant judgment is required in predicting the outcome of these suits and claims, many of which take years to adjudicate. We accrue estimated costs for a contingency when we believe that a loss is probable and we can make a reasonable estimate of the loss, and then adjust the accrual as appropriate to reflect changes in facts and circumstances. We do not believe it is reasonably possible that these existing loss contingencies, individually or in the aggregate, would have a material adverse effect on our financial position, results of operations, or liquidity. No material accrued loss contingencies are recorded as of April 30, 2017.
Guaranty. We have guaranteed the repayment by a third-party importer of its obligation under a bank credit facility that it uses in connection with its importation of our products in Russia. If the importer were to default on that obligation, which we believe is unlikely, our maximum possible exposure under the existing terms of the guaranty would be approximately $25 (subject to changes in foreign currency exchange rates). Both the fair value and carrying amount of the guaranty are insignificant.
As of April 30, 2017, our actual exposure under the guaranty of the importer’s obligation is approximately $6. We also have accounts receivable from that importer of approximately $7 at that date, which we expect to collect in full.
Based on the financial support we provide to the importer, we believe it meets the definition of a variable interest entity. However, because we do not control this entity, it is not included in our consolidated financial statements.
59
5. DEBT AND CREDIT FACILITIES
Our long-term debt (net of unamortized discounts and issuance costs) consisted of:
April 30, | 2016 | 2017 | |||||
1.00% senior notes, $250 principal amount, due January 15, 2018 | $ | 249 | $ | 249 | |||
2.25% senior notes, $250 principal amount, due January 15, 2023 | 248 | 248 | |||||
1.20% senior notes, €300 principal amount, due July 7, 2026 | — | 324 | |||||
2.60% senior notes, £300 principal amount, due July 7, 2028 | — | 383 | |||||
3.75% senior notes, $250 principal amount, due January 15, 2043 | 248 | 248 | |||||
4.50% senior notes, $500 principal amount, due July 15, 2045 | 485 | 486 | |||||
1,230 | 1,938 | ||||||
Less current portion | — | 249 | |||||
$ | 1,230 | $ | 1,689 | ||||
Debt payments required over the next five fiscal years consist of $250 in 2018, $0 in 2019, $0 in 2020, $0 in 2021, $0 in 2022, and $1,715 after 2022.
The senior notes contain terms and covenants customary of these types of unsecured securities, including limitations on the amount of secured debt we can issue.
We issued senior, unsecured notes with an aggregate principal amount of €300 in July 2016. Interest on these notes will accrue at a rate of 1.20% and be paid annually. As of April 30, 2017, the carrying amount of these notes was $324 ($327 principal, less unamortized discounts and issuance costs). These notes are due on July 7, 2026.
In addition, we issued senior, unsecured notes with an aggregate principal amount of £300 in July 2016. Interest on these notes will accrue at a rate of 2.60% and be paid annually. As of April 30, 2017, the carrying amount of these notes was $383 ($389 principal, less unamortized discounts and issuance costs). These notes are due on July 7, 2028.
As of April 30, 2016, our short-term borrowings of $271 included $269 of commercial paper, with an average interest rate of 0.53%, and an average remaining maturity of 26 days. As of April 30, 2017, our short-term borrowings of $211 included $208 of commercial paper, with an average interest rate of 1.04%, and an average remaining maturity of 22 days.
We have a committed revolving credit agreement with various U.S. and international banks for $800 that expires in November 2018. Its most restrictive quantitative covenant requires that the ratio of our consolidated EBITDA (as defined in the agreement) to consolidated interest expense not be less than 3 to 1. At April 30, 2017, with a ratio of 18 to 1, we were well within this covenant’s parameters and had no borrowing outstanding under this facility.
6. FAIR VALUE MEASUREMENTS
Fair value is defined as the exchange price that would be received for an asset or paid to transfer a liability in the principal or most advantageous market for the asset or liability in an orderly transaction between market participants at the measurement date. We categorize the fair values of assets and liabilities into three levels based upon the assumptions (inputs) used to determine those values. Level 1 provides the most reliable measure of fair value, while Level 3 generally requires significant management judgment. The three levels are:
• | Level 1 – Quoted prices (unadjusted) in active markets for identical assets or liabilities. |
• | Level 2 – Observable inputs other than those included in Level 1, such as quoted prices for similar assets and liabilities in active markets, quoted prices for identical or similar assets and liabilities in inactive markets, or other inputs that are observable or can be derived from or corroborated by observable market data. |
• | Level 3 – Unobservable inputs supported by little or no market activity. |
60
The following table summarizes the assets and liabilities measured at fair value on a recurring basis:
Level 1 | Level 2 | Level 3 | Total | ||||||||||||
April 30, 2016 | |||||||||||||||
Assets: | |||||||||||||||
Currency derivatives | $ | — | $ | 19 | $ | — | $ | 19 | |||||||
Liabilities: | |||||||||||||||
Currency derivatives | — | 10 | — | 10 | |||||||||||
Short-term borrowings | — | 271 | — | 271 | |||||||||||
Long-term debt | — | 1,293 | — | 1,293 | |||||||||||
April 30, 2017 | |||||||||||||||
Assets: | |||||||||||||||
Currency derivatives | — | 25 | — | 25 | |||||||||||
Liabilities: | |||||||||||||||
Currency derivatives | — | 10 | — | 10 | |||||||||||
Short-term borrowings | — | 211 | — | 211 | |||||||||||
Current portion of long-term debt | — | 249 | — | 249 | |||||||||||
Long-term debt | — | 1,752 | — | 1,752 | |||||||||||
We determine the fair values of our currency derivatives (forwards contracts) using standard valuation models. The significant inputs used in these models, which are readily available in public markets or can be derived from observable market transactions, include the applicable spot rates, forward rates, and discount rates. The discount rates are based on the historical U.S. Treasury rates.
The fair value of short-term borrowings approximates their carrying value. We determine the fair value of long-term debt primarily based on the prices at which similar debt has recently traded in the market and also considering the overall market conditions on the date of valuation.
We measure some assets and liabilities at fair value on a nonrecurring basis. That is, we do not measure them at fair value on an ongoing basis, but we do adjust them to fair value in some circumstances (for example, when we determine that an asset is impaired). No material nonrecurring fair value measurements were required during the periods presented in these financial statements.
7. FAIR VALUE OF FINANCIAL INSTRUMENTS
The fair values of cash, cash equivalents, and short-term borrowings approximate the carrying amounts due to the short maturities of these instruments. We determine the fair values of currency derivatives and long-term debt as discussed in Note 6.
Below is a comparison of the fair values and carrying amounts of these instruments:
2016 | 2017 | ||||||||||||||
April 30, | Carrying Amount | Fair Value | Carrying Amount | Fair Value | |||||||||||
Assets: | |||||||||||||||
Cash and cash equivalents | $ | 263 | $ | 263 | $ | 182 | $ | 182 | |||||||
Currency derivatives | 19 | 19 | 25 | 25 | |||||||||||
Liabilities: | |||||||||||||||
Currency derivatives | 10 | 10 | 10 | 10 | |||||||||||
Short-term borrowings | 271 | 271 | 211 | 211 | |||||||||||
Current portion of long-term debt | — | — | 249 | 249 | |||||||||||
Long-term debt | 1,230 | 1,293 | 1,689 | 1,752 | |||||||||||
8. DERIVATIVE FINANCIAL INSTRUMENTS AND HEDGING ACTIVITIES
Our multinational business exposes us to global market risks, including the effect of fluctuations in currency exchange rates, commodity prices, and interest rates. We use derivatives to help manage financial exposures that occur in the normal course of
61
business. We formally document the purpose of each derivative contract, which includes linking the contract to the financial exposure it is designed to mitigate. We do not hold or issue derivatives for trading or speculative purposes.
We use currency derivative contracts to limit our exposure to the currency exchange risk that we cannot mitigate internally by using netting strategies. We designate most of these contracts as cash flow hedges of forecasted transactions (expected to occur within three years). We record all changes in the fair value of cash flow hedges (except any ineffective portion) in accumulated other comprehensive income (AOCI) until the underlying hedged transaction occurs, at which time we reclassify that amount into earnings. We assess the effectiveness of these hedges based on changes in forward exchange rates. The ineffective portion of the changes in fair value of our hedges (recognized immediately in earnings) during the periods presented in this report was not material.
We had outstanding currency derivatives, related primarily to our euro, British pound, and Australian dollar exposures, with notional amounts totaling $1,265 and $1,188 at April 30, 2016 and 2017, respectively.
During fiscal 2017, we used some currency derivative forward contracts and foreign currency-denominated long-term debt as after-tax net investment hedges of our investments in certain foreign subsidiaries. Any change in value of the designated portion of the hedging instruments is recorded in AOCI, offsetting the foreign currency translation adjustment of the related net investments that is also recorded in AOCI. As of April 30, 2017, $511 of our foreign currency-denominated debt was designated as a net investment hedge. Our net investment hedges are intended to mitigate foreign exchange exposure related to non-U.S. dollar net investments in certain foreign subsidiaries against changes in foreign exchange rates. There was no ineffectiveness related to our net investment hedges.
We do not designate some of our currency derivatives and foreign currency-denominated debt as hedges because we use them to at least partially offset the immediate earnings impact of changes in foreign exchange rates on existing assets or liabilities. We immediately recognize the change in fair value of these instruments in earnings.We use forward purchase contracts with suppliers to protect against corn price volatility. We expect to physically take delivery of the corn underlying each contract and use it for production over a reasonable period of time. Accordingly, we account for these contracts as normal purchases rather than as derivative instruments.
During May 2015, we entered into interest rate derivative contracts (U.S. Treasury lock agreements) to manage the interest rate risk related to the anticipated issuance of fixed-rate senior, unsecured notes. We designated the contracts as cash flow hedges of the future interest payments associated with the anticipated notes. Upon issuance in June 2015 of an aggregate principal amount of $500 of the 4.50% notes, due July 15, 2045, we settled the contracts for a gain of $8. The entire gain was recorded to AOCI and will be amortized as a reduction of interest expense over the life of the notes.
The following table presents the pre-tax impact that changes in the fair value of our derivative instruments and non-derivative hedging instruments had on AOCI and earnings in 2016 and 2017:
Classification in Statement of Operations | 2016 | 2017 | |||||||
Derivative Instruments | |||||||||
Currency derivatives designated as cash flow hedges: | |||||||||
Net gain (loss) recognized in AOCI | n/a | $ | 22 | $ | 41 | ||||
Net gain (loss) reclassified from AOCI into earnings | Net sales | 60 | 40 | ||||||
Interest rate derivatives designated as cash flow hedges: | |||||||||
Net gain (loss) recognized in AOCI | n/a | 8 | — | ||||||
Currency derivatives designated as net investment hedge: | |||||||||
Net gain (loss) recognized in AOCI | n/a | — | 8 | ||||||
Currency derivatives not designated as hedging instruments: | |||||||||
Net gain (loss) recognized in earnings | Net sales | 1 | 2 | ||||||
Net gain (loss) recognized in earnings | Other income | (5 | ) | (5 | ) | ||||
Non-Derivative Hedging Instruments | |||||||||
Foreign currency-denominated debt designated as net investment hedge: | |||||||||
Net gain (loss) recognized in AOCI | n/a | — | 2 | ||||||
Foreign currency-denominated debt not designated as hedging instrument: | |||||||||
Net gain (loss) recognized in earnings | Other income | — | 3 | ||||||
62
We expect to reclassify $12 of deferred net gains on cash flow hedges recorded in AOCI as of April 30, 2017, to earnings during fiscal 2018. This reclassification would offset the anticipated earnings impact of the underlying hedged exposures. The actual amounts that we ultimately reclassify to earnings will depend on the exchange rates in effect when the underlying hedged transactions occur. The maximum term of outstanding derivative contracts was 36 months at both April 30, 2016 and 2017.
The following table presents the fair values of our derivative instruments as of April 30, 2016 and 2017:
Balance Sheet Classification | Fair Value of Derivatives in a Gain Position | Fair Value of Derivatives in a Loss Position | |||||||
April 30, 2016 | |||||||||
Designated as cash flow hedges: | |||||||||
Currency derivatives | Other current assets | $ | 23 | $ | (2 | ) | |||
Currency derivatives | Other assets | 3 | (2 | ) | |||||
Currency derivatives | Accrued expenses | 4 | (8 | ) | |||||
Currency derivatives | Other liabilities | 3 | (9 | ) | |||||
Not designated as hedges: | |||||||||
Currency derivatives | Other current assets | 1 | (4 | ) | |||||
April 30, 2017 | |||||||||
Designated as cash flow hedges: | |||||||||
Currency derivatives | Other current assets | 21 | (2 | ) | |||||
Currency derivatives | Other assets | 9 | (4 | ) | |||||
Currency derivatives | Accrued expenses | 2 | (8 | ) | |||||
Currency derivatives | Other liabilities | 1 | (4 | ) | |||||
Not designated as hedges: | |||||||||
Currency derivatives | Other current assets | 2 | (1 | ) | |||||
Currency derivatives | Accrued expenses | — | (1 | ) | |||||
The fair values reflected in the above table are presented on a gross basis. However, as discussed further below, the fair values of those instruments subject to net settlement agreements are presented on a net basis in the accompanying consolidated balance sheets.
In our statement of cash flows, we classify cash flows related to cash flow hedges in the same category as the cash flows from the hedged items.
Credit risk. We are exposed to credit-related losses if the counterparties to our derivative contracts default. This credit risk is limited to the fair value of the contracts. To manage this risk, we contract only with major financial institutions that have earned investment-grade credit ratings and with whom we have standard International Swaps and Derivatives Association (ISDA) agreements that allow for net settlement of the derivative contracts. Also, we have established counterparty credit guidelines that are regularly monitored, and we monetize contracts when we believe it is warranted. Because of these safeguards, we believe we have no derivative positions that warrant credit valuation adjustments.
Some of our derivative instruments require us to maintain a specific level of creditworthiness, which we have maintained. If our creditworthiness were to fall below that level, then the counterparties to our derivative instruments could request immediate payment or collateralization for derivative instruments in net liability positions. The aggregate fair value of all derivatives with creditworthiness requirements that were in a net liability position was $8 and $9 at April 30, 2016 and 2017, respectively.
Offsetting. As noted above, our derivative contracts are governed by ISDA agreements that allow for net settlement of derivative contracts with the same counterparty. It is our policy to present the fair values of current derivatives (that is, those with a remaining term of 12 months or less) with the same counterparty on a net basis in the balance sheet. Similarly, we present the fair values of noncurrent derivatives with the same counterparty on a net basis. Current derivatives are not netted with noncurrent derivatives in the balance sheet.
63
The following table summarizes the gross and net amounts of our derivative contracts:
Gross Amounts of Recognized Assets (Liabilities) | Gross Amounts Offset in Balance Sheet | Net Amounts Presented in Balance Sheet | Gross Amounts Not Offset in Balance Sheet | Net Amounts | |||||||||||||||
April 30, 2016 | |||||||||||||||||||
Derivative assets | $ | 34 | $ | (15 | ) | $ | 19 | $ | (6 | ) | $ | 13 | |||||||
Derivative liabilities | (25 | ) | 15 | (10 | ) | 6 | (4 | ) | |||||||||||
April 30, 2017 | |||||||||||||||||||
Derivative assets | 35 | (10 | ) | 25 | (1 | ) | 24 | ||||||||||||
Derivative liabilities | (20 | ) | 10 | (10 | ) | 1 | (9 | ) | |||||||||||
No cash collateral was received or pledged related to our derivative contracts as of April 30, 2016 or 2017.
9. PENSION AND OTHER POSTRETIREMENT BENEFITS
We sponsor various defined benefit pension plans as well as postretirement plans providing retiree health care and retiree life insurance benefits. Below, we discuss our obligations related to these plans, the assets dedicated to meeting the obligations, and the amounts we recognized in our financial statements as a result of sponsoring these plans.
Obligations. We provide eligible employees with pension and other postretirement benefits based on factors such as years of service and compensation level during employment. The pension obligation shown below (“projected benefit obligation”) consists of: (a) benefits earned by employees to date based on current salary levels (“accumulated benefit obligation”); and (b) benefits to be received by employees as a result of expected future salary increases. (The obligation for medical and life insurance benefits is not affected by future salary increases.) The following table shows how the present value of our obligation changed during each of the last two years.
Pension Benefits | Medical and Life Insurance Benefits | ||||||||||||||
2016 | 2017 | 2016 | 2017 | ||||||||||||
Obligation at beginning of year | $ | 887 | $ | 898 | $ | 57 | $ | 56 | |||||||
Service cost | 26 | 26 | 1 | 1 | |||||||||||
Interest cost | 35 | 35 | 2 | 2 | |||||||||||
Net actuarial loss (gain) | 8 | (14 | ) | (1 | ) | — | |||||||||
Plan amendments | — | 1 | — | (4 | ) | ||||||||||
Retiree contributions | — | — | 1 | 1 | |||||||||||
Benefits paid | (58 | ) | (53 | ) | (4 | ) | (4 | ) | |||||||
Obligation at end of year | $ | 898 | $ | 893 | $ | 56 | $ | 52 | |||||||
Service cost represents the present value of the benefits attributed to service rendered by employees during the year. Interest cost is the increase in the present value of the obligation due to the passage of time. Net actuarial loss (gain) is the change in value of the obligation resulting from experience different from that assumed or from a change in an actuarial assumption. (We discuss actuarial assumptions used at the end of this note.) Plan amendments may also change the value of the obligation.
As shown in the previous table, the change in the value of our pension and other postretirement benefit obligations also includes the effect of benefit payments and retiree contributions. Expected benefit payments (net of retiree contributions) over the next 10 years are as follows:
Pension Benefits | Medical and Life Insurance Benefits | ||||||
2018 | $ | 52 | $ | 3 | |||
2019 | 53 | 3 | |||||
2020 | 54 | 3 | |||||
2021 | 55 | 3 | |||||
2022 | 58 | 3 | |||||
2023 – 2027 | 309 | 16 | |||||
64
Assets. We invest in specific assets to fund our pension benefit obligations. Our investment goal is to earn a total return that, over time, will grow assets sufficiently to fund our plans’ liabilities, after providing appropriate levels of contributions and accepting prudent levels of investment risk. To achieve this goal, plan assets are invested primarily in funds or portfolios of funds managed by outside managers. Investment risk is managed by company policies that require diversification of asset classes, manager styles, and individual holdings. We measure and monitor investment risk through quarterly and annual performance reviews, and through periodic asset/liability studies.
Asset allocation is the most important method for achieving our investment goals and is based on our assessment of the plans’ long-term return objectives and the appropriate balances needed for liquidity, stability, and diversification. As of April 30, 2017, our target asset allocation is a mix of 46% public equity investments, 33% fixed income investments, 20% alternative investments, and 1% cash equivalents.
The following table shows the fair value of pension plan assets by category as of the end of the last two years. (Fair value levels are defined in Note 6.)
Level 1 | Level 2 | Level 3 | Total | ||||||||||||
April 30, 2016 | |||||||||||||||
Equity securities | $ | 78 | $ | — | $ | — | $ | 78 | |||||||
Limited partnership interests1 | — | — | 29 | 29 | |||||||||||
$ | 78 | $ | — | $ | 29 | 107 | |||||||||
Investments measured at net asset value: | |||||||||||||||
Commingled trust funds2: | |||||||||||||||
Equity funds | 197 | ||||||||||||||
Fixed income funds | 197 | ||||||||||||||
Real estate funds | 59 | ||||||||||||||
Short-term investments | 4 | ||||||||||||||
Hedge funds3 | 30 | ||||||||||||||
Total | $ | 594 | |||||||||||||
April 30, 2017 | |||||||||||||||
Equity securities | $ | 78 | $ | — | $ | — | $ | 78 | |||||||
Limited partnership interests1 | — | — | 32 | 32 | |||||||||||
$ | 78 | $ | — | $ | 32 | 110 | |||||||||
Investments measured at net asset value: | |||||||||||||||
Commingled trust funds2: | |||||||||||||||
Equity funds | 206 | ||||||||||||||
Fixed income funds | 229 | ||||||||||||||
Real estate funds | 63 | ||||||||||||||
Short-term investments | 7 | ||||||||||||||
Hedge funds3 | 8 | ||||||||||||||
Total | $ | 623 | |||||||||||||
1Limited partnership interests are valued at the percentage ownership of total partnership equity as determined by the general partner. These valuations require significant judgment due to the absence of quoted market prices, the inherent lack of liquidity, and the long-term nature of these investments.
2Commingled trust fund valuations are based on the net asset value (NAV) of the funds as determined by the fund administrators and reviewed by us. NAV represents the underlying assets owned by the fund, minus liabilities and divided by the number of shares or units outstanding.
3Hedge fund valuations are based primarily on the NAV of the funds as determined by fund administrators and reviewed by us. During our review, we determine whether it is necessary to adjust a valuation for inherent liquidity and redemption issues that may exist within a fund’s underlying assets or fund unit values.
65
The following table shows how the fair value of the Level 3 assets changed during each of the last two years. There were no transfers of assets between Level 3 and either of the other two levels.
Level 3 | |||
Balance as of April 30, 2015 | $ | 26 | |
Return on assets held at end of year | 1 | ||
Purchases and settlements | 5 | ||
Sales and settlements | (3 | ) | |
Balance as of April 30, 2016 | 29 | ||
Return on assets held at end of year | 1 | ||
Purchases and settlements | 5 | ||
Sales and settlements | (3 | ) | |
Balance as of April 30, 2017 | $ | 32 | |
The following table shows how the total fair value of all pension plan assets changed during each of the last two years. (We do not have assets set aside for postretirement medical or life insurance benefits.)
Pension Benefits | Medical and Life Insurance Benefits | ||||||||||||||
2016 | 2017 | 2016 | 2017 | ||||||||||||
Assets at beginning of year | $ | 626 | $ | 594 | $ | — | $ | — | |||||||
Actual return on assets | 2 | 51 | — | — | |||||||||||
Retiree contributions | — | — | 1 | 1 | |||||||||||
Company contributions | 24 | 31 | 3 | 3 | |||||||||||
Benefits paid | (58 | ) | (53 | ) | (4 | ) | (4 | ) | |||||||
Assets at end of year | $ | 594 | $ | 623 | $ | — | $ | — | |||||||
We currently expect to contribute $35 to our pension plans and $3 to our postretirement medical and life insurance benefit plans during 2018.
Funded status. The funded status of a plan refers to the difference between its assets and its obligations. The following table shows the funded status of our plans.
Pension Benefits | Medical and Life Insurance Benefits | ||||||||||||||
April 30, | 2016 | 2017 | 2016 | 2017 | |||||||||||
Assets | $ | 594 | $ | 623 | $ | — | $ | — | |||||||
Obligations | (898 | ) | (893 | ) | (56 | ) | (52 | ) | |||||||
Funded status | $ | (304 | ) | $ | (270 | ) | $ | (56 | ) | $ | (52 | ) | |||
The funded status reflected above includes obligations attributable to our non-qualified Supplemental Executive Retirement Plan that is not funded with those plan assets presented above. However, we have set aside investments in corporate-owned life insurance policies to cover these obligations. The value of those investments, which are included in “other assets” on the accompanying balance sheets, is $64 and $81 as of April 30, 2016 and 2017, respectively.
66
The funded status is recorded on the accompanying consolidated balance sheets as follows:
Pension Benefits | Medical and Life Insurance Benefits | |||||||||||||||
April 30, | 2016 | 2017 | 2016 | 2017 | ||||||||||||
Accounts payable and accrued expenses | (4 | ) | (5 | ) | (3 | ) | (3 | ) | ||||||||
Accrued postretirement benefits | (300 | ) | (265 | ) | (53 | ) | (49 | ) | ||||||||
Net liability | $ | (304 | ) | $ | (270 | ) | $ | (56 | ) | $ | (52 | ) | ||||
Accumulated other comprehensive income (loss), before tax: | ||||||||||||||||
Net actuarial gain (loss) | $ | (372 | ) | $ | (322 | ) | $ | (13 | ) | $ | (13 | ) | ||||
Prior service credit (cost) | (4 | ) | (4 | ) | 15 | 17 | ||||||||||
$ | (376 | ) | $ | (326 | ) | $ | 2 | $ | 4 | |||||||
The following table compares our pension plans whose assets exceed their accumulated benefit obligations with those whose obligations exceed their assets. (As discussed above, we have no assets set aside for postretirement medical or life insurance benefits.)
Plan Assets | Accumulated Benefit Obligation | Projected Benefit Obligation | |||||||||||||||||||||
April 30, | 2016 | 2017 | 2016 | 2017 | 2016 | 2017 | |||||||||||||||||
Plans with assets in excess of accumulated benefit obligation | $ | — | $ | 48 | $ | — | $ | 47 | $ | — | $ | 48 | |||||||||||
Plans with accumulated benefit obligation in excess of assets | 594 | 575 | 776 | 729 | 898 | 845 | |||||||||||||||||
Total | $ | 594 | $ | 623 | $ | 776 | $ | 776 | $ | 898 | $ | 893 | |||||||||||
Pension expense. The following table shows the components of the pension expense recognized during each of the last three years. The amount for each year includes amortization of the prior service cost/credit and net actuarial loss/gain included in accumulated other comprehensive loss as of the beginning of the year.
Pension Benefits | |||||||||||
2015 | 2016 | 2017 | |||||||||
Service cost | $ | 22 | $ | 26 | $ | 26 | |||||
Interest cost | 34 | 35 | 35 | ||||||||
Expected return on assets | (41 | ) | (40 | ) | (41 | ) | |||||
Amortization of: | |||||||||||
Prior service cost (credit) | 1 | 1 | 1 | ||||||||
Net actuarial loss (gain) | 22 | 27 | 25 | ||||||||
Settlement loss | — | — | 1 | ||||||||
Net expense | $ | 38 | $ | 49 | $ | 47 | |||||
The prior service cost/credit, which represents the effect of plan amendments on benefit obligations, is amortized on a straight-line basis over the average remaining service period of the employees expected to receive the benefits. The net actuarial loss/gain results from experience different from that assumed or from a change in actuarial assumptions (including the difference between actual and expected return on plan assets), and is amortized over at least that same period. The estimated amount of prior service cost and net actuarial loss that will be amortized from accumulated other comprehensive loss into pension expense in 2018 is $1 and $21, respectively.
67
Other postretirement benefit expense. The following table shows the components of the postretirement medical and life insurance benefit expense that we recognized during each of the last three years.
Medical and Life Insurance Benefits | |||||||||||
2015 | 2016 | 2017 | |||||||||
Service cost | $ | 1 | $ | 1 | $ | 1 | |||||
Interest cost | 3 | 2 | 2 | ||||||||
Amortization of: | |||||||||||
Prior service cost (credit) | (2 | ) | (2 | ) | (3 | ) | |||||
Net actuarial loss (gain) | 1 | 1 | 1 | ||||||||
Net expense | $ | 3 | $ | 2 | $ | 1 | |||||
The estimated amount of prior service credit and net actuarial loss that will be amortized from accumulated other comprehensive loss into postretirement medical and life insurance benefit expense in 2018 is $3 and $1, respectively.
Other comprehensive income (loss). Prior service cost/credit and net actuarial loss/gain are recognized in other comprehensive income or loss (OCI) during the period in which they arise. These amounts are later amortized from accumulated OCI into pension and other postretirement benefit expense over future periods as described above. The following table shows the pre-tax effect of these amounts on OCI during each of the last three years.
Pension Benefits | Medical and Life Insurance Benefits | ||||||||||||||||||||||
2015 | 2016 | 2017 | 2015 | 2016 | 2017 | ||||||||||||||||||
Prior service credit (cost) | $ | — | $ | — | $ | (1 | ) | $ | 16 | $ | — | $ | 4 | ||||||||||
Net actuarial gain (loss) | (80 | ) | (46 | ) | 24 | (3 | ) | 1 | — | ||||||||||||||
Amortization reclassified to earnings: | |||||||||||||||||||||||
Prior service cost (credit) | 1 | 1 | 1 | (2 | ) | (2 | ) | (3 | ) | ||||||||||||||
Net actuarial loss (gain) | 22 | 27 | 26 | 1 | 1 | 1 | |||||||||||||||||
Net amount recognized in OCI | $ | (57 | ) | $ | (18 | ) | $ | 50 | $ | 12 | $ | — | $ | 2 | |||||||||
Assumptions and sensitivity. We use various assumptions to determine the obligations and expense related to our pension and other postretirement benefit plans. The weighted-average assumptions used in computing benefit plan obligations as of the end of the last two years were as follows:
Pension Benefits | Medical and Life Insurance Benefits | ||||||||||
2016 | 2017 | 2016 | 2017 | ||||||||
Discount rate | 4.02 | % | 4.09 | % | 3.96 | % | 4.04 | % | |||
Rate of salary increase | 4.00 | % | 4.00 | % | n/a | n/a | |||||
The weighted-average assumptions used in computing benefit plan expense during each of the last three years were as follows:
Pension Benefits | Medical and Life Insurance Benefits | ||||||||||||||||
2015 | 2016 | 2017 | 2015 | 2016 | 2017 | ||||||||||||
Discount rate | 4.46 | % | 4.09 | % | 4.02 | % | 4.67 | % | 4.09 | % | 3.96 | % | |||||
Rate of salary increase | 4.00 | % | 4.00 | % | 4.00 | % | n/a | n/a | n/a | ||||||||
Expected return on plan assets | 7.50 | % | 7.00 | % | 7.00 | % | n/a | n/a | n/a | ||||||||
The discount rate represents the interest rate used to discount the cash-flow stream of benefit payments to a net present value as of the calculation date. A lower assumed discount rate increases the present value of the benefit obligation. We determined the discount rate using a yield curve based on the interest rates of high-quality debt securities with maturities corresponding to the expected timing of our benefit payments.
The assumed rate of salary increase reflects the expected average annual increase in salaries as a result of inflation, merit increases, and promotions over the service period of the plan participants. A lower assumed rate decreases the present value of the benefit obligation.
68
The expected return on plan assets represents the long-term rate of return that we assume will be earned over the life of the pension assets. The assumption reflects expected capital market returns for each asset class, which are based on historical returns, adjusted for the expected effects of diversification and active management (net of fees).
The assumed health care cost trend rates as of the end of the last two years were as follows:
Medical and Life Insurance Benefits | |||||
2016 | 2017 | ||||
Health care cost trend rate assumed for next year | 7.25 | % | 7.25 | % | |
Rate to which the cost trend rate is assumed to decline (the ultimate trend rate) | 5.00 | % | 5.00 | % | |
Year that the rate reaches the ultimate trend rate | 2024 | 2025 | |||
A one percentage point change in the assumed health care cost trend rate would not have significantly changed the accumulated postretirement benefit obligation as of April 30, 2017, or the aggregate service and interest costs for 2017.
Savings plans. We also sponsor various defined contribution benefit plans that together cover substantially all U.S. employees. Employees can make voluntary contributions in accordance with their respective plans, which include a 401(k) tax deferral option. We match a percentage of each employee’s contributions in accordance with plan terms. We expensed $10, $11, and $11 for matching contributions during 2015, 2016, and 2017, respectively.
International plans. The information presented above for defined benefit plans and defined contribution benefit plans reflects amounts for U.S. plans only. Information about similar international plans is not presented due to immateriality.
10. STOCK-BASED COMPENSATION
The Brown-Forman 2013 Omnibus Compensation Plan is our incentive compensation plan, which is designed to reward its participants (including our eligible officers, employees, and non-employee directors) for company performance. Under the Plan, we can grant stock-based incentive awards for up to 16,600,000 shares of common stock to eligible participants until July 28, 2023. As of April 30, 2017, awards for approximately 12,710,000 shares remain available for issuance under the Plan. We try to limit the source of shares delivered to participants under the Plan to treasury shares that we purchase from time to time on the open market (at times in connection with a publicly announced share repurchase program), in private transactions, or otherwise.
The following table presents information about stock options and stock-settled stock appreciation rights (SSARs) granted under the Plan (or its predecessor plans) as of April 30, 2017, and for the year then ended.
Number of Underlying Shares (in thousands) | Weighted Average Exercise Price per Award | Weighted Average Remaining Contractual Term (years) | Aggregate Intrinsic Value | |||||||||
Outstanding at April 30, 2016 | 6,852 | $ | 28.42 | |||||||||
Granted | 779 | 49.01 | ||||||||||
Exercised | (1,005 | ) | 19.49 | |||||||||
Forfeited or expired | (11 | ) | 46.79 | |||||||||
Outstanding at April 30, 2017 | 6,615 | $ | 32.17 | 5.0 | $ | 104 | ||||||
Exercisable at April 30, 2017 | 4,390 | $ | 23.75 | 3.6 | $ | 103 | ||||||
The total intrinsic value of options and SSARs exercised during 2015, 2016, and 2017 was $35, $47, and $28, respectively.
69
We grant stock options and SSARs at an exercise price equal to the market price of the underlying stock on the grant date. Stock options and SSARs become exercisable after three years from the first day of the fiscal year of grant and expire seven years after that date. The grant-date fair values of these awards granted during 2015, 2016, and 2017 were $9.84, $9.53, and $7.16 per award, respectively. We estimated the fair values using the Black-Scholes pricing model with the following assumptions:
2015 | 2016 | 2017 | ||||||
Risk-free interest rate | 2.2 | % | 2.1 | % | 1.4 | % | ||
Expected volatility | 22.3 | % | 19.1 | % | 16.3 | % | ||
Expected dividend yield | 1.7 | % | 1.6 | % | 1.6 | % | ||
Expected term (years) | 6.75 | 6.75 | 7.00 | |||||
We have also granted restricted stock units (RSUs), deferred stock units (DSUs), and shares of performance-based restricted stock (PBRS) under the Plan (or its predecessor plans). Approximately 492,000 shares underlying these awards, with a weighted-average remaining vesting period of 1.2 years, were nonvested at April 30, 2017. The following table summarizes the changes in the number of shares underlying these awards during 2017.
Number of Underlying Shares (in thousands) | Weighted Average Fair Value at Grant Date | |||||
Nonvested at April 30, 2016 | 547 | $ | 42.61 | |||
Granted | 134 | 48.44 | ||||
Adjusted for dividends or performance | (31 | ) | 47.45 | |||
Vested | (153 | ) | 36.71 | |||
Forfeited | (5 | ) | 44.27 | |||
Nonvested at April 30, 2017 | 492 | $ | 45.71 | |||
For PBRS awards, performance is measured based on the relative ranking of the total shareholder return of our Class B common stock during the three-year performance period compared to that of the companies within the Standard & Poor’s Consumer Staples Index at the end of the performance period, with specific payout levels ranging from 50% to 150%.
The total fair value of RSUs, PBRS awards, and DSUs vested during 2015, 2016, and 2017 was $11, $10, and $8, respectively.
The accompanying consolidated statements of operations reflect compensation expense related to stock-based incentive awards on a pre-tax basis of $15 in 2015, $15 in 2016, and $14 in 2017, partially offset by deferred income tax benefits of $6 in 2015, $6 in 2016, and $5 in 2017. As of April 30, 2017, there was $10 of total unrecognized compensation cost related to non-vested stock-based compensation. That cost is expected to be recognized over a weighted-average period of 1.4 years.
11. COMMON STOCK
The following table shows the change in outstanding common shares during each of the last three years:
(Shares in thousands) | Class A | Class B | Total | |||||
Balance at April 30, 2014 | 168,924 | 257,986 | 426,910 | |||||
Acquisition of treasury stock | (171 | ) | (10,069 | ) | (10,240 | ) | ||
Stock issued under compensation plans | 173 | 557 | 730 | |||||
Balance at April 30, 2015 | 168,926 | 248,474 | 417,400 | |||||
Acquisition of treasury stock | (114 | ) | (22,714 | ) | (22,828 | ) | ||
Stock issued under compensation plans | 248 | 664 | 912 | |||||
Balance at April 30, 2016 | 169,060 | 226,424 | 395,484 | |||||
Acquisition of treasury stock | (77 | ) | (11,799 | ) | (11,876 | ) | ||
Stock issued under compensation plans | 68 | 410 | 478 | |||||
Balance at April 30, 2017 | 169,051 | 215,035 | 384,086 | |||||
70
Stock split. On May 26, 2016, our Board of Directors approved a two-for-one stock split for our Class A and Class B common stock, subject to stockholder approval of an amendment to our Restated Certificate of Incorporation. The amendment, which was approved by stockholders on July 28, 2016, increased the number of authorized shares of Class A common stock from 85,000,000 to 170,000,000. The amendment did not change the number of authorized Class B common shares, which remains at 400,000,000.
The stock split, which was effected as a stock dividend, resulted in the issuance of one new share of Class A common stock for each share of Class A common stock outstanding and one new share of Class B common stock for each share of Class B common stock outstanding. The stock split was also applied to our treasury shares. Thus, the stock split increased the number of Class A shares issued from 85,000,000 to 170,000,000, and increased the number of Class B shares issued from 142,313,000 to 284,626,000. The new shares were distributed on August 18, 2016, to shareholders of record as of August 8, 2016.
As a result of the stock split, we reclassified approximately $34 from additional paid-in capital to common stock during fiscal 2017. The $34 represents the $0.15 par value per share of the new shares issued in the stock split.
All share and per share amounts reported in these financial statements and related notes are presented on a split-adjusted basis.
12. EARNINGS PER SHARE
We calculate basic earnings per share by dividing net income available to common stockholders by the weighted average number of common shares outstanding during the period. Diluted earnings per share further includes the dilutive effect of stock-based compensation awards. We calculate that dilutive effect using the “treasury stock method” (as defined by GAAP).
The following table presents information concerning basic and diluted earnings per share:
2015 | 2016 | 2017 | |||||||||
Net income available to common stockholders | $ | 684 | $ | 1,067 | $ | 669 | |||||
Share data (in thousands): | |||||||||||
Basic average common shares outstanding | 423,185 | 405,953 | 387,708 | ||||||||
Dilutive effect of stock-based awards | 2,980 | 2,607 | 2,753 | ||||||||
Diluted average common shares outstanding | 426,165 | 408,560 | 390,461 | ||||||||
Basic earnings per share | $ | 1.62 | $ | 2.63 | $ | 1.72 | |||||
Diluted earnings per share | $ | 1.60 | $ | 2.61 | $ | 1.71 | |||||
We excluded common stock-based awards for approximately 723,000 shares, 905,000 shares, and 1,716,000 shares from the calculation of diluted earnings per share for 2015, 2016, and 2017, respectively, because they were not dilutive for those periods under the treasury stock method.
13. INCOME TAXES
We incur income taxes on the earnings of our U.S. and foreign operations. The following table, based on the locations of the taxable entities from which sales were derived (rather than the location of customers), presents the U.S. and foreign components of our income before income taxes:
2015 | 2016 | 2017 | |||||||||
United States | $ | 912 | $ | 1,184 | $ | 806 | |||||
Foreign | 90 | 305 | 127 | ||||||||
$ | 1,002 | $ | 1,489 | $ | 933 | ||||||
The income shown above was determined according to GAAP. Because those standards sometimes differ from the tax rules used to calculate taxable income, there are differences between: (a) the amount of taxable income and pretax financial income for a year; and (b) the tax bases of assets or liabilities and their amounts as recorded in our financial statements. As a result, we recognize a current tax liability for the estimated income tax payable on the current tax return, and deferred tax liabilities (income tax payable on income that will be recognized on future tax returns) and deferred tax assets (income tax refunds from deductions that will be recognized on future tax returns) for the estimated effects of the differences mentioned above.
71
Deferred tax assets and liabilities as of the end of each of the last two years were as follows:
April 30, | 2016 | 2017 | |||||
Deferred tax assets: | |||||||
Postretirement and other benefits | $ | 183 | $ | 173 | |||
Accrued liabilities and other | 10 | 17 | |||||
Inventories | 26 | 27 | |||||
Loss and credit carryforwards | 39 | 44 | |||||
Valuation allowance | (25 | ) | (30 | ) | |||
Total deferred tax assets, net | 233 | 231 | |||||
Deferred tax liabilities: | |||||||
Intangible assets | (225 | ) | (262 | ) | |||
Property, plant, and equipment | (83 | ) | (90 | ) | |||
Other | (9 | ) | (15 | ) | |||
Total deferred tax liabilities | (317 | ) | (367 | ) | |||
Net deferred tax liability | $ | (84 | ) | $ | (136 | ) | |
As of April 30, 2017, the gross amounts of loss carryforwards include a $49 net operating loss in Brazil (no expiration); a U.K. non-trading loss of $27 (no expiration); a $65 net operating loss in Finland (expires in varying amounts between 2024 and 2027); and other foreign and domestic net operating, capital, and non-trading losses of $43 ($14 that do not expire and $29 that expire in varying amounts between 2018 and 2028).
The $30 valuation allowance at April 30, 2017 ($25 at April 30, 2016), relates primarily to a $17 ($12 at April 30, 2016) net operating loss in Brazil. Although the losses in Brazil can be carried forward indefinitely, it is uncertain that we will realize sufficient taxable income to allow us to use these losses. The valuation allowance also includes $8 ($7 at April 30, 2016) related to other foreign net operating and non-trading losses,$2 that do not expire and $6 that expire between 2018 and 2028. The remaining valuation allowance relates to a $5 ($6 at April 30, 2016) non-trading loss carryforward in the United Kingdom that was generated during 2009. Although the non-trading losses can be carried forward indefinitely, we know of no significant transactions that will let us use them.
During 2014, we deferred a tax benefit of $95 that resulted primarily from the release of certain deferred tax liabilities in connection with an intercompany transfer of assets, composed primarily of an intangible asset. We are amortizing the deferred benefit to tax expense over approximately six years for financial reporting purposes, in accordance with Accounting Standard Codification (ASC) 740-10-25-3(e) (Income Taxes) and ASC 810-45-8 (Consolidation), resulting in a tax benefit of $5 in 2014, $15 in 2015, $16 in 2016, and $16 in 2017. The remaining balance of the deferred benefit, which is included in “other liabilities” on the accompanying balance sheet, was $43 as of April 30, 2017. As discussed in Note 1, revised accounting guidance issued in October 2016 will require the recognition of income tax consequences of intercompany transfers of assets other than inventory when the transfer occurs. Our adoption of this revised guidance will result in the balance of the deferred tax benefit as of the beginning of fiscal 2019 ($27) being recognized as an increase in retained earnings rather than as a reduction in income tax expense.
Deferred tax liabilities were not provided on undistributed earnings of foreign subsidiaries ($1,005 and $1,053 at April 30, 2016 and 2017, respectively) because we expect these undistributed earnings to be reinvested indefinitely outside the United States. If these amounts were not considered permanently reinvested, additional deferred tax liabilities of approximately $222 would have been provided at both April 30, 2016 and 2017.
72
Total income tax expense for a year includes the tax associated with the current tax return (“current tax expense”) and the change in the net deferred tax asset or liability (“deferred tax expense”). Our total income tax expense for each of the last three years was as follows:
2015 | 2016 | 2017 | |||||||||
Current: | |||||||||||
U.S. federal | $ | 259 | $ | 347 | $ | 226 | |||||
Foreign | 42 | 47 | 40 | ||||||||
State and local | 11 | 18 | 8 | ||||||||
312 | 412 | 274 | |||||||||
Deferred: | |||||||||||
U.S. federal | $ | 15 | $ | 24 | $ | (1 | ) | ||||
Foreign | (11 | ) | (17 | ) | (9 | ) | |||||
State and local | 2 | 3 | — | ||||||||
6 | 10 | (10 | ) | ||||||||
$ | 318 | $ | 422 | $ | 264 | ||||||
Our consolidated effective tax rate usually differs from current statutory rates due to the recognition of amounts for events or transactions with no tax consequences. The following table reconciles our effective tax rate to the federal statutory tax rate in the United States:
Percent of Income Before Taxes | ||||||||
2015 | 2016 | 2017 | ||||||
U.S. federal statutory rate | 35.0 | % | 35.0 | % | 35.0 | % | ||
State taxes, net of U.S. federal tax benefit | 1.0 | % | 1.0 | % | 0.9 | % | ||
Income taxed at other than U.S. federal statutory rate | (0.5 | %) | (2.5 | %) | (1.7 | %) | ||
Tax benefit from U.S. manufacturing | (2.5 | %) | (2.4 | %) | (2.4 | %) | ||
Tax impact of sale of business | — | % | (1.1 | %) | — | % | ||
Amortization of deferred tax benefit from intercompany transactions | (1.6 | %) | (1.6 | %) | (1.7 | %) | ||
Excess tax benefits from stock-based awards | — | % | — | % | (1.0 | %) | ||
Other, net | 0.3 | % | (0.1 | %) | (0.8 | %) | ||
Effective rate | 31.7 | % | 28.3 | % | 28.3 | % | ||
At April 30, 2017, we had $9 of gross unrecognized tax benefits, $6 of which would reduce our effective income tax rate if recognized. A reconciliation of the beginning and ending unrecognized tax benefits follows:
2015 | 2016 | 2017 | |||||||||
Unrecognized tax benefits at beginning of year | $ | 11 | $ | 13 | $ | 9 | |||||
Additions for tax positions provided in prior periods | 2 | 1 | 2 | ||||||||
Additions for tax positions provided in current period | 1 | — | — | ||||||||
Decreases for tax positions provided in prior years | (1 | ) | (4 | ) | (2 | ) | |||||
Settlements of tax positions in the current period | — | (1 | ) | — | |||||||
Unrecognized tax benefits at end of year | $ | 13 | $ | 9 | $ | 9 | |||||
We file income tax returns in the United States, including several state and local jurisdictions, as well as in several other countries in which we conduct business. The major jurisdictions and their earliest fiscal years that are currently open for tax examinations are 2011 for one state in the United States; 2015 in the United Kingdom; 2013 in Australia; 2012 in the Netherlands, Finland, and Mexico; and 2011 in Brazil, Germany, and Poland. The audit of our fiscal 2015 U.S. federal tax return was concluded in the first quarter of fiscal 2017. In addition, we are participating in the Internal Revenue Service’s Compliance Assurance Program for our fiscal 2017 tax year.
We believe there will be no material change in our gross unrecognized tax benefits in the next 12 months.
73
14. ACCUMULATED OTHER COMPREHENSIVE INCOME
The following table summarizes the change in each component of AOCI, net of tax, during 2017:
Currency Translation Adjustments | Cash Flow Hedge Adjustments | Postretirement Benefits Adjustments | Total AOCI | ||||||||||||
Balance at April 30, 2016 | $ | (131 | ) | $ | 11 | $ | (230 | ) | $ | (350 | ) | ||||
Net other comprehensive income (loss) | (73 | ) | — | 33 | (40 | ) | |||||||||
Balance at April 30, 2017 | $ | (204 | ) | $ | 11 | $ | (197 | ) | $ | (390 | ) | ||||
The following table presents the components of net other comprehensive income (loss) during each of the last three years:
Pre-Tax | Tax | Net | |||||||||
Year Ended April 30, 2015 | |||||||||||
Currency translation adjustments: | |||||||||||
Net gain (loss) on currency translation | $ | (120 | ) | $ | 6 | $ | (114 | ) | |||
Reclassification to earnings | — | — | — | ||||||||
Other comprehensive income (loss), net | (120 | ) | 6 | (114 | ) | ||||||
Cash flow hedge adjustments: | |||||||||||
Net gain (loss) on hedging instruments | 96 | (40 | ) | 56 | |||||||
Reclassification to earnings1 | (41 | ) | 17 | (24 | ) | ||||||
Other comprehensive income (loss), net | 55 | (23 | ) | 32 | |||||||
Postretirement benefits adjustments: | |||||||||||
Net actuarial gain (loss) and prior service cost | (70 | ) | 26 | (44 | ) | ||||||
Reclassification to earnings2 | 22 | (8 | ) | 14 | |||||||
Other comprehensive income (loss), net | (48 | ) | 18 | (30 | ) | ||||||
Total other comprehensive income (loss), net | $ | (113 | ) | $ | 1 | $ | (112 | ) | |||
Year Ended April 30, 2016 | |||||||||||
Currency translation adjustments: | |||||||||||
Net gain (loss) on currency translation | $ | (22 | ) | $ | (1 | ) | $ | (23 | ) | ||
Reclassification to earnings | — | — | — | ||||||||
Other comprehensive income (loss), net | (22 | ) | (1 | ) | (23 | ) | |||||
Cash flow hedge adjustments: | |||||||||||
Net gain (loss) on hedging instruments | 30 | (10 | ) | 20 | |||||||
Reclassification to earnings1 | (60 | ) | 23 | (37 | ) | ||||||
Other comprehensive income (loss), net | (30 | ) | 13 | (17 | ) | ||||||
Postretirement benefits adjustments: | |||||||||||
Net actuarial gain (loss) and prior service cost | (47 | ) | 19 | (28 | ) | ||||||
Reclassification to earnings2 | 30 | (12 | ) | 18 | |||||||
Other comprehensive income (loss), net | (17 | ) | 7 | (10 | ) | ||||||
Total other comprehensive income (loss), net | $ | (69 | ) | $ | 19 | $ | (50 | ) | |||
74
Pre-Tax | Tax | Net | |||||||||
Year Ended April 30, 2017 | |||||||||||
Currency translation adjustments: | |||||||||||
Net gain (loss) on currency translation | $ | (71 | ) | $ | (4 | ) | $ | (75 | ) | ||
Reclassification to earnings | 3 | (1 | ) | 2 | |||||||
Other comprehensive income (loss), net | (68 | ) | (5 | ) | (73 | ) | |||||
Cash flow hedge adjustments: | |||||||||||
Net gain (loss) on hedging instruments | 41 | (17 | ) | 24 | |||||||
Reclassification to earnings1 | (40 | ) | 16 | (24 | ) | ||||||
Other comprehensive income (loss), net | 1 | (1 | ) | — | |||||||
Postretirement benefits adjustments: | |||||||||||
Net actuarial gain (loss) and prior service cost | 28 | (10 | ) | 18 | |||||||
Reclassification to earnings2 | 25 | (10 | ) | 15 | |||||||
Other comprehensive income (loss), net | 53 | (20 | ) | 33 | |||||||
Total other comprehensive income (loss), net | $ | (14 | ) | $ | (26 | ) | $ | (40 | ) | ||
1Pre-tax amount is classified as net sales in the accompanying consolidated statements of operations.
2Pre-tax amount is a component of pension and other postretirement benefit expense (as shown in Note 9, except for amounts related to non-U.S. benefit plans, about which no information is presented in Note 9 due to immateriality).
15. SUPPLEMENTAL INFORMATION
The following table presents net sales by product category:
2015 | 2016 | 2017 | |||||||||
Net sales: | |||||||||||
Spirits | $ | 2,955 | $ | 2,901 | $ | 2,805 | |||||
Wine | 179 | 188 | 189 | ||||||||
$ | 3,134 | $ | 3,089 | $ | 2,994 | ||||||
The following table presents net sales by geography:
2015 | 2016 | 2017 | |||||||||
Net sales: | |||||||||||
United States | $ | 1,445 | $ | 1,491 | $ | 1,444 | |||||
Europe | 847 | 834 | 770 | ||||||||
Australia | 175 | 153 | 151 | ||||||||
Other | 667 | 611 | 629 | ||||||||
$ | 3,134 | $ | 3,089 | $ | 2,994 | ||||||
Net sales are attributed to countries based on where customers are located.
The net book value of property, plant, and equipment located outside the United States was $59 and $96 as of April 30, 2016 and 2017, respectively. Other long-lived assets located outside the United States are not significant.
We have concluded that our business constitutes a single operating segment.
16. GAIN ON SALE OF BUSINESS
On March 1, 2016, we sold our Southern Comfort and Tuaca brands to Sazerac Company, Inc. for $543 in cash. The total book value of the related business assets included in the sale was $49, and consisted of $11 in inventories, $16 in goodwill, and $22 in other intangible assets. As a result of the sale, we recognized a gain of $485 (net of transaction costs of $9) during the fourth quarter of fiscal 2016.
75
17. ACQUISITION OF BUSINESS
On June 1, 2016, we acquired The BenRiach Distillery Company Limited (BenRiach) for aggregate consideration of $407, consisting of a purchase price of $341 and $66 in assumed debt and transaction-related obligations that we have since paid. The acquisition, which brought three single malt Scotch whisky brands into our portfolio, included brand trademarks, inventories, three malt distilleries, a bottling plant, and BenRiach’s headquarters in Edinburgh, Scotland.
The purchase price of $341 included cash of $307 paid at the acquisition date for 90% of the voting interests in BenRiach and a liability of $34 related to a put and call option agreement for the remaining 10% equity shares. Under that agreement, we could choose (or be required) to purchase the remaining 10% for £24 ($34 at the exchange rate on June 1, 2016) during the one-year period ending November 14, 2017.
The purchase price of $341 was allocated based on management’s estimates and independent appraisals as follows:
June 1, 2016 | |||
Accounts receivable | $ | 11 | |
Inventories | 158 | ||
Other current assets | 1 | ||
Property, plant, and equipment | 19 | ||
Goodwill | 183 | ||
Trademarks and brand names | 65 | ||
Total assets | 437 | ||
Accounts payable and accrued expenses | 12 | ||
Short-term borrowings | 59 | ||
Deferred tax liabilities | 25 | ||
Total liabilities | 96 | ||
Net assets acquired | $ | 341 | |
Goodwill is calculated as the excess of the purchase price over the fair value of the net identifiable assets acquired. The goodwill resulting from this acquisition is primarily attributable to: (a) the value of leveraging our distribution network and brand-building expertise to grow global sales of the existing single malt Scotch whisky brands acquired, (b) the valuable opportunity to develop new products and line extensions in the especially attractive premium Scotch whisky category, and (c) the accumulated knowledge and expertise of the organized workforce employed by the acquired business. None of the goodwill amount of $183 is expected to be deductible for tax purposes.
BenRiach’s results of operations, which have been included in our financial statements since the acquisition date, were not material for fiscal 2017. Pro forma results are not presented due to immateriality.
On November 17, 2016, we purchased the remaining 10% interest in BenRiach for cash of £24 ($30 at the exchange rate on that date) by exercising the call option described above. That cash payment is classified as a financing activity in the accompanying statement of cash flows.
76
QUARTERLY FINANCIAL INFORMATION (UNAUDITED)
(Expressed in millions, except per share amounts)
Fiscal 2016 | Fiscal 2017 | |||||||||||||||||||||||||||||||||||||||
First Quarter | Second Quarter | Third Quarter | Fourth Quarter | Year | First Quarter | Second Quarter | Third Quarter | Fourth Quarter | Year | |||||||||||||||||||||||||||||||
Sales | $ | 900 | $ | 1,096 | $ | 1,083 | $ | 933 | $ | 4,011 | $ | 856 | $ | 1,055 | $ | 1,059 | $ | 887 | $ | 3,857 | ||||||||||||||||||||
Excise taxes | 201 | 242 | 274 | 204 | 922 | 195 | 225 | 251 | 193 | 863 | ||||||||||||||||||||||||||||||
Net sales | 699 | 854 | 809 | 729 | 3,089 | 661 | 830 | 808 | 694 | 2,994 | ||||||||||||||||||||||||||||||
Gross profit | 491 | 586 | 555 | 513 | 2,144 | 453 | 552 | 536 | 480 | 2,021 | ||||||||||||||||||||||||||||||
Net income | 156 | 200 | 190 | 522 | 1,067 | 144 | 197 | 182 | 144 | 669 | ||||||||||||||||||||||||||||||
Basic EPS | 0.38 | 0.49 | 0.47 | 1.31 | 2.63 | 0.37 | 0.51 | 0.47 | 0.38 | 1.72 | ||||||||||||||||||||||||||||||
Diluted EPS | 0.37 | 0.49 | 0.47 | 1.30 | 2.61 | 0.36 | 0.50 | 0.47 | 0.37 | 1.71 | ||||||||||||||||||||||||||||||
Cash dividends per share: | ||||||||||||||||||||||||||||||||||||||||
Declared | 0.3150 | — | 0.3400 | — | 0.6550 | 0.3400 | — | 0.3650 | — | 0.7050 | ||||||||||||||||||||||||||||||
Paid | 0.1575 | 0.1575 | 0.1700 | 0.1700 | 0.6550 | 0.1700 | 0.1700 | 0.1825 | 0.1825 | 0.7050 | ||||||||||||||||||||||||||||||
Market price per share: | ||||||||||||||||||||||||||||||||||||||||
Class A high | 59.75 | 61.15 | 58.77 | 56.12 | 61.15 | 54.28 | 54.45 | 49.32 | 50.05 | 54.45 | ||||||||||||||||||||||||||||||
Class A low | 46.55 | 52.94 | 49.75 | 50.20 | 46.55 | 50.78 | 47.00 | 45.62 | 46.36 | 45.62 | ||||||||||||||||||||||||||||||
Class B high | 54.21 | 55.41 | 53.44 | 51.70 | 55.41 | 50.40 | 51.06 | 47.04 | 48.95 | 51.06 | ||||||||||||||||||||||||||||||
Class B low | 45.33 | 47.61 | 45.30 | 46.63 | 45.30 | 46.95 | 44.66 | 43.96 | 45.01 | 43.96 | ||||||||||||||||||||||||||||||
Notes:
1. | Quarterly amounts may not add to amounts for the year due to rounding. Further, quarterly earnings per share (EPS) amounts may not add to amounts for the year because quarterly and annual EPS calculations are performed separately. |
2. | Results for the fourth quarter of fiscal 2016 include a gain of $485 million on the divestiture of our Southern Comfort and Tuaca brands. |
3. | Per share amounts have been adjusted for a 2-for-1 stock split that occurred in August 2016. |
77
Item 9. Changes in and Disagreements with Accountants on Accounting and Financial Disclosure
None.
Item 9A. Controls and Procedures
Evaluation of Disclosure Controls and Procedures. Our management, with the participation of our Chief Executive Officer (CEO) and Chief Financial Officer (CFO) (our principal executive and principal financial officers), has evaluated the effectiveness of our disclosure controls and procedures (as defined in Rule 13a-15(e) under the Securities Exchange Act of 1934 (the “Exchange Act”)) as of the end of fiscal 2017. Based on that evaluation, our CEO and CFO concluded that our disclosure controls and procedures: (a) are effective to ensure that information required to be disclosed by the company in our reports filed or submitted under the Exchange Act is recorded, processed, summarized, and reported within the time periods specified in the SEC’s rules and forms; (b) and include controls and procedures designed to ensure that information required to be disclosed by the company in such reports is accumulated and communicated to the company’s management, including the CEO and the CFO, as appropriate, to allow timely decisions regarding required disclosure.
Changes in Internal Control over Financial Reporting. There has been no change in our internal control over financial reporting during the quarter ended April 30, 2017, that has materially affected, or is reasonably likely to materially affect, our internal control over financial reporting.
Management’s Report on Internal Control over Financial Reporting and Report of Independent Registered Public Accounting Firm. Management’s report on our internal control over financial reporting as of April 30, 2017, and our independent registered public accounting firm’s report on our internal control over financial reporting are set forth in “Item 8. Financial Statements and Supplementary Data.”
The Company acquired The BenRiach Distillery Company Limited (BenRiach) in a purchase business combination during fiscal 2017. Based on SEC staff interpretive guidance for newly-acquired businesses, management excluded BenRiach from its assessment of our internal control over financial reporting as of April 30, 2017. BenRiach is a wholly-owned subsidiary whose total assets and total net sales represented approximately 4% and 1% respectively, of the related consolidated financial statement amounts as of and for the year ended April 30, 2017.
Item 9B. Other Information
None.
PART III
Item 10. Directors, Executive Officers, and Corporate Governance
Information on our Executive Officers is included under the caption “Employees and Executive Officers” in Part I of this report. For the other information required by this item, see the following sections of our definitive proxy statement for the Annual Meeting of Stockholders to be held July 27, 2017, which information is incorporated into this report by reference: (a) “Election of Directors” (for biographical information on directors and family relationships); (b) “Code of Conduct” (for information on our Code of Ethics); (c) “Section 16(a) Beneficial Ownership Reporting Compliance” (for information on compliance with Section 16 of the Exchange Act); (d) “Corporate Governance and Nominating Committee” (for information on the procedures by which security holders may recommend nominees to the Company’s Board of Directors); and (e) “Corporate Governance” (for information on our Audit Committee).
Item 11. Executive Compensation
For the information required by this item, refer to the following sections of our definitive proxy statement for the Annual Meeting of Stockholders to be held July 27, 2017, which information is incorporated into this report by reference: (a) “Compensation Discussion and Analysis”; (b) “Compensation Tables”; (c) “Director Compensation”; and (d) “Compensation Committee Interlocks and Insider Participation.”
Item 12. Security Ownership of Certain Beneficial Owners and Management and Related Stockholder Matters
For equity compensation plan information, refer to “Item 5. Market for the Registrant’s Common Equity, Related Stockholder Matters and Issuer Purchases of Equity Securities.” For the other information required by this item, refer to the section entitled “Stock Ownership” of our definitive proxy statement for the Annual Meeting of Stockholders to be held July 27, 2017, which information is incorporated into this report by reference.
78
Item 13. Certain Relationships and Related Transactions, and Director Independence
For the information required by this item, refer to the following sections of our definitive proxy statement for the Annual Meeting of Stockholders to be held July 27, 2017, which information is incorporated into this report by reference: (a) “Certain Relationships and Related Transactions”; and (b) “Our Independent Directors.”
Item 14. Principal Accounting Fees and Services
For the information required by this item, refer to the following sections of our definitive proxy statement for the Annual Meeting of Stockholders to be held July 27, 2017, which information is incorporated into this report by reference: (a) “Fees Paid to Independent Registered Public Accounting Firm”; and (b) “Audit Committee Pre-Approval Policies and Procedures.”
PART IV
Item 15. Exhibits and Financial Statement Schedules
Page | ||
(a)(1) | Financial Statements | |
The following documents are included in Item 8 of this report: | ||
(a)(2) | Financial Statement Schedule: | |
We have omitted all other schedules for which provision is made in the applicable accounting regulations of the Securities and Exchange Commission either because they are not required under the related instructions, because the information required is included in the consolidated financial statements and notes thereto, or because they do not apply.
(a)(3) Exhibits:
The following documents are filed with this report:
Exhibit Index | |
12 | Statement re Computation of Ratio of Earnings to Fixed Charges. |
21 | Subsidiaries of the Registrant. |
23 | Consent of PricewaterhouseCoopers LLP, independent registered public accounting firm. |
31.1 | CEO Certification pursuant to Section 302 of Sarbanes-Oxley Act of 2002. |
31.2 | CFO Certification pursuant to Section 302 of Sarbanes-Oxley Act of 2002. |
32 | CEO and CFO Certification pursuant to 18 U.S.C. Section 1350, as adopted pursuant to Section 906 of the Sarbanes-Oxley Act of 2002 (not considered to be filed). |
101 | The following materials from Brown-Forman Corporation’s Annual Report on Form 10-K for the fiscal year ended April 30, 2017, formatted in XBRL (eXtensible Business Reporting Language): (a) Consolidated Statements of Operations, (b) Consolidated Statements of Comprehensive Income, (c) Consolidated Balance Sheets, (d) Consolidated Statements of Cash Flows, (e) Consolidated Statements of Stockholders’ Equity, and (f) Notes to Consolidated Financial Statements. |
79
The following documents have been previously filed:
Exhibit Index | |
3.1 | Restated Certificate of Incorporation of registrant, incorporated into this report by reference to Exhibit 3.1 of Brown-Forman Corporation’s Quarterly Report on Form 10-Q for the quarter ended July 31, 2012, filed on September 5, 2012 (File No. 002-26821). |
3.2 | Certificate of Amendment of Restated Certificate of Incorporation of registrant, incorporated into this report by reference to Exhibit 3.1 of Brown-Forman Corporation’s Form 8-K filed on August 9, 2016 (File No. 001-00123). |
3.3 | By-laws of registrant, as amended and restated on May 21, 2014, incorporated into this report by reference to Exhibit 3.2 of Brown-Forman Corporation’s Form 8-K filed on May 22, 2014 (File No. 002-26821). |
4.1 | Indenture dated as of April 2, 2007, between Brown-Forman Corporation and U.S. Bank National Association, as Trustee, incorporated into this report by reference to Exhibit 4.1 of Brown-Forman Corporation’s Form 8‑K filed on April 3, 2007 (File No. 002-26821). |
4.2 | First Supplemental Indenture dated as of December 13, 2010, between Brown-Forman Corporation and U.S. Bank National Association, as Trustee, incorporated into this report by reference to Exhibit 4.2 of Brown-Forman Corporation’s Form S-3ASR Registration Statement filed on December 13, 2010 (File No. 333-171126). |
4.3 | Second Supplemental Indenture dated as of June 24, 2015, between Brown-Forman Corporation and U.S. Bank National Association, as Trustee, incorporated into this report by reference to Exhibit 4.4 of Brown-Forman Corporation’s Form 8-K filed on June 29, 2015 (File No. 002-26821). |
4.4 | Form of 1.00% Note due 2018, incorporated into this report by reference to Exhibit 4.4 of Brown-Forman Corporation’s Form 8-K filed on December 12, 2012 (File No. 002-26821). |
4.5 | Form of 2.25% Note due 2023, incorporated into this report by reference to Exhibit 4.5 of Brown-Forman Corporation’s Form 8-K filed on December 12, 2012 (File No. 002-26821). |
4.6 | Form of 1.200% Note due 2026, incorporated into this report by reference to Exhibit 4.5 of Brown-Forman Corporation’s Form 8-K filed on July 8, 2016 (File No. 002-26821). |
4.7 | Form of 2.600% Note due 2028, incorporated into this report by reference to Exhibit 4.6 of Brown-Forman Corporation’s Form 8-K filed on July 8, 2016 (File No. 002-26821). |
4.8 | Form of 3.75% Note due 2043, incorporated into this report by reference to Exhibit 4.6 of Brown-Forman Corporation’s Form 8-K filed on December 12, 2012 (File No. 002-26821). |
4.9 | Form of 4.500% Notes due 2045, incorporated into this report by reference to Exhibit 4.5 of Brown-Forman Corporation’s Form 8-K filed on June 29, 2015 (File No. 002-26821). |
4.1 | Officer’s Certificate dated December 12, 2012, pursuant to Sections 1.01, 2.02, and 3.01 of the Indenture dated as of April 2, 2007, as supplemented by the First Supplemental Indenture dated as of December 13, 2010, between Brown-Forman Corporation and U.S. Bank National Association, as Trustee, setting forth the terms of the 1.00% Notes due 2018, the 2.25% Notes due 2023, and the 3.75% Notes due 2043, incorporated into this report by reference to Exhibit 4.3 of Brown-Forman Corporation’s Form 8-K filed on December 12, 2012 (File No. 002-26821). |
4.11 | Officer’s Certificate dated June 29, 2015, pursuant to Sections 1.02, 2.02, 3.01 and 3.03 of the Indenture dated as of April 2, 2007, as supplemented by the First Supplemental Indenture dated as of December 13, 2010 and the Second Supplemental Indenture dated as of June 24, 2015, between Brown-Forman Corporation and U.S. Bank National Association, as Trustee, setting forth the terms of the 4.500% Notes due 2045, incorporated into this report by reference to Exhibit 4.3 of Brown-Forman Corporation’s Form S-3ASR Registration Statement filed on June 24, 2015 (File No. 333-205183). |
4.12 | Officer’s Certificate dated July 7, 2016, pursuant to Sections 1.01, 2.02, and 3.01 of the Indenture dated as of April 2, 2007, as supplemented by the First Supplemental Indenture dated as of December 13, 2010 and the Second Supplemental Indenture dated as of June 24, 2015, between Brown-Forman Corporation and U.S. Bank National Association, as Trustee, setting forth the terms of the 1.200% Notes due 2026 and the 2.600% Notes due 2028, incorporated into this report by reference to Exhibit 4.4 of Brown-Forman Corporation’s Form 8-K filed on July 8, 2016 (File No. 002-26821). |
10.1 | A description of the Brown-Forman Savings Plan, incorporated into this report by reference to page 10 of Brown-Forman Corporation’s definitive proxy statement filed on June 27, 1996, in connection with its 1996 Annual Meeting of Stockholders (File No. 001-00123).* |
10.2 | A description of the Brown-Forman Corporation Nonqualified Savings Plan, incorporated into this report by reference to Exhibit 4.1 of Brown-Forman Corporation’s Form S-8 Registration Statement filed on September 24, 2010 (File No. 333-169564).* |
10.3 | Brown-Forman Corporation 2004 Omnibus Compensation Plan, as amended, incorporated into this report by reference to Exhibit A of Brown-Forman Corporation’s proxy statement filed on June 26, 2009, in connection with its 2009 Annual Meeting of Stockholders (File No. 002-26821).* |
10.4 | Form of Employee Stock Appreciation Right Award Agreement, incorporated into this report by reference to Exhibit 10(g) of Brown-Forman Corporation’s Form 8-K filed on August 2, 2006 (File No. 002-26821).* |
80
Exhibit Index | |
10.5 | Form of Non-Employee Director Stock Appreciation Right Award Agreement, incorporated into this report by reference to Exhibit 10(i) of Brown-Forman Corporation’s Form 8-K filed on August 2, 2006 (File No. 002-26821).* |
10.6 | 2010 Form of Employee Stock-Settled Stock Appreciation Right Award Agreement, incorporated into this report by reference to Exhibit 10.1 of Brown-Forman Corporation’s Form 8-K filed on July 23, 2010 (File No. 002-26821).* |
10.7 | 2010 Form of Non-Employee Director Stock-Settled Stock Appreciation Right Award Agreement, incorporated into this report by reference to Exhibit 10.2 of Brown-Forman Corporation’s Form 8-K filed on July 23, 2010 (File No. 002-26821).* |
10.8 | 2010 Form of Restricted Stock Award Agreement, incorporated into this report by reference to Exhibit 10.3 of Brown-Forman Corporation’s Form 8-K filed on July 23, 2010 (File No. 002-26821).* |
10.9 | 2010 Form of Restricted Stock Unit Award Agreement, incorporated into this report by reference to Exhibit 10.4 of Brown-Forman Corporation’s Form 8-K filed on July 23, 2010 (File No. 002-26821).* |
10.10 | Brown-Forman Corporation Amended and Restated Supplemental Executive Retirement Plan and First Amendment thereto, incorporated into this report by reference to Exhibit 10(a) of Brown-Forman Corporation’s Annual Report on Form 10-K for the year ended April 30, 2010, filed on June 25, 2010 (File No. 002-26821).* |
10.11 | Second Amendment to the Brown-Forman Corporation Amended and Restated Supplemental Executive Retirement Plan, incorporated into this report by reference to Exhibit 10(a) of Brown-Forman Corporation’s Quarterly Report on Form 10-Q for the quarter ended January 31, 2011, filed on March 9, 2011 (File No. 002-26821).* |
10.12 | Five-Year Credit Agreement, dated as of November 18, 2011, among Brown-Forman Corporation, certain borrowing subsidiaries and certain lenders party thereto, Barclays Capital as Syndication Agent, Bank of America, N.A. and Citibank, N.A., as Co-Documentation Agents, U.S. Bank National Association, as Administrative Agent, and U.S. Bank National Association, Barclays Capital, Merrill Lynch, Pierce, Fenner & Smith Incorporated and Citigroup Global Markets Inc. as Joint Lead Arrangers and Joint Bookrunners, incorporated into this report by reference to Exhibit 10.1 of Brown-Forman Corporation’s Form 8-K filed on November 21, 2011 (File No. 002-26821). |
10.13 | Amendment No. 1 to Five-Year Credit Agreement, dated as of September 27, 2013, among Brown-Forman Corporation, the Lenders party to the Credit Agreement, and U.S. Bank National Association, as Administrative Agent, incorporated into this report by reference to Exhibit 10 of Brown-Forman Corporation’s Quarterly Report on Form 10-Q for the quarter ended October 31, 2013, filed on December 4, 2013 (File No. 002-26821). |
10.14 | 364-Day Credit Agreement, dated as of May 6, 2016, among Brown-Forman Corporation, certain lenders party thereto, Barclays Capital, as Syndication Agent, Bank of America, N.A. and Citibank, N.A. as Co-Documentation Agents, U.S. Bank National Association, as Administrative Agent, and U.S. Bank National Association, Barclays Capital, Merrill Lynch, Pierce, Fenner & Smith Incorporated and Citigroup Global Markets, Inc., as Joint Lead Arrangers and Joint Bookrunners, incorporated into this report by reference to Exhibit 10.1 of Brown-Forman Corporation’s Form 8-K filed on May 6, 2016 (File No. 002-26821). |
10.15 | Brown-Forman Corporation Amended and Restated Non-Employee Director Deferred Stock Unit Program, incorporated into this report by reference to Exhibit 10.2 of Brown-Forman Corporation’s Form 8-K filed on July 26, 2013 (File No. 002-26821).* |
10.16 | Brown-Forman Corporation 2013 Omnibus Compensation Plan, incorporated into this report by reference to Exhibit 10.1 of Brown-Forman Corporation’s Form 8-K filed on July 26, 2013 (File No. 002-26821).* |
10.17 | Form of Employee Stock-Settled Stock Appreciation Right Award Agreement, incorporated into this report by reference to Exhibit 10.3 of Brown-Forman Corporation’s Form 8-K filed on July 26, 2013 (File No. 002-26821).* |
10.18 | Form of Restricted Stock Unit Award Agreement, incorporated into this report by reference to Exhibit 10.4 of Brown-Forman Corporation’s Form 8-K filed on July 26, 2013 (File No. 002-26821).* |
10.19 | Form of Restricted Stock Award Agreement, incorporated into this report by reference to Exhibit 10.5 of Brown-Forman Corporation’s Form 8-K filed on July 26, 2013 (File No. 002-26821).* |
10.20 | Paul C. Varga July 25, 2013 Special Restricted Stock Award Agreement, incorporated into this report by reference to Exhibit 10.1 of Brown-Forman Corporation’s Form 8-K filed on July 30, 2014 (File No. 002-26821).* |
10.21 | Form of Employee Stock-Settled Stock Appreciation Right Award Agreement, incorporated into this report by reference to Exhibit 10.1 of Brown-Forman Corporation’s Form 8-K filed on August 1, 2016 (File No. 001-00123).* |
10.22 | Form of Performance-Based Restricted Stock Unit Award Agreement (Class A), incorporated into this report by reference to Exhibit 10.2 of Brown-Forman Corporation’s Form 8-K filed on August 1, 2016 (File No. 001-00123).* |
10.23 | Form of Performance-Based Restricted Stock Unit Award Agreement (Class B), incorporated into this report by reference to Exhibit 10.3 of Brown-Forman Corporation’s Form 8-K filed on August 1, 2016 (File No. 001-00123).* |
* | Indicates management contract, compensatory plan, or arrangement. |
81
Item 16. Form 10-K Summary
None.
SIGNATURES
Pursuant to the requirements of Section 13 or 15(d) of the Securities Exchange Act of 1934, the registrant has duly caused this report to be signed on its behalf by the undersigned, thereunto duly authorized.
BROWN-FORMAN CORPORATION (Registrant) | ||
/s/ Paul C. Varga | ||
By: | Paul C. Varga | |
Chief Executive Officer and Chairman of the Company | ||
Date: June 14, 2017
Pursuant to the requirements of the Securities Exchange Act of 1934, this report has been signed below by the following persons on behalf of the registrant and in the capacities on June 14, 2017, as indicated:
/s/ Geo. Garvin Brown IV | ||
By: | Geo. Garvin Brown IV | |
Director, Chairman of the Board | ||
/s/ Paul C. Varga | ||
By: | Paul C. Varga | |
Director, Chief Executive Officer, and Chairman of the Company | ||
/s/ Patrick Bousquet-Chavanne | ||
By: | Patrick Bousquet-Chavanne | |
Director | ||
/s/ Campbell P. Brown | ||
By: | Campbell P. Brown | |
Director | ||
82
/s/ Stuart R. Brown | ||
By: | Stuart R. Brown | |
Director | ||
/s/ Bruce L. Byrnes | ||
By: | Bruce L. Byrnes | |
Director | ||
/s/ John D. Cook | ||
By: | John D. Cook | |
Director | ||
/s/ Marshall B. Farrer | ||
By: | Marshall B. Farrer | |
Director | ||
/s/ Laura L. Frazier | ||
By: | Laura L. Frazier | |
Director | ||
/s/ Kathleen M. Gutmann | ||
By: | Kathleen M. Gutmann | |
Director | ||
/s/ Augusta Brown Holland | ||
By: | Augusta Brown Holland | |
Director | ||
/s/ Michael J. Roney | ||
By: | Michael J. Roney | |
Director | ||
83
/s/ Michael A. Todman | ||
By: | Michael A. Todman | |
Director | ||
/s/ Jane C. Morreau | ||
By: | Jane C. Morreau | |
Executive Vice President and Chief Financial Officer (Principal Financial Officer) | ||
/s/ Brian P. Fitzgerald | ||
By: | Brian P. Fitzgerald | |
Senior Vice President and Chief Accounting Officer (Principal Accounting Officer) | ||
84
BROWN-FORMAN CORPORATION AND SUBSIDIARIES
SCHEDULE II – VALUATION AND QUALIFYING ACCOUNTS
For the Years Ended April 30, 2015, 2016, and 2017
(Expressed in millions)
Col. A | Col. B | Col. C(1) | Col. C(2) | Col. D | Col. E | ||||||||||||||
Description | Balance at Beginning of Period | Additions Charged to Costs and Expenses | Additions Charged to Other Accounts | Deductions | Balance at End of Period | ||||||||||||||
2015 | |||||||||||||||||||
Allowance for doubtful accounts | $ | 9 | $ | 2 | $ | — | $ | 1 | $ | 10 | |||||||||
Deferred tax valuation allowance | $ | 34 | $ | 2 | $ | — | $ | 9 | $ | 27 | |||||||||
2016 | |||||||||||||||||||
Allowance for doubtful accounts | $ | 10 | $ | 1 | $ | — | $ | 2 | (1) | $ | 9 | ||||||||
Deferred tax valuation allowance | $ | 27 | $ | 3 | $ | — | $ | 5 | $ | 25 | |||||||||
2017 | |||||||||||||||||||
Allowance for doubtful accounts | $ | 9 | $ | — | $ | — | $ | 2 | (1) | $ | 7 | ||||||||
Deferred tax valuation allowance | $ | 25 | $ | 5 | $ | 2 | $ | 2 | $ | 30 | |||||||||
(1) | Doubtful accounts written off, net of recoveries. |
85