Attached files
| file | filename |
|---|---|
| 8-K - 8-K - TIPTREE INC. | a8k6517.htm |

COMPANY OVERVIEW
June 2017
NASDAQ: TIPT
DISCLAIMERS
1
LIMITATIONS ON THE USE OF INFORMATION
This presentation has been prepared by Tiptree Inc. and its consolidated subsidiaries (“Tiptree", "the Company" or "we”) solely for informational purposes, and not for the
purpose of updating any information or forecast with respect to Tiptree, its subsidiaries or any of its affiliates or any other purpose. Tiptree reports a non-controlling interest
in TFP that is not owned by Tiptree and certain other operating subsidiaries that are not wholly owned. Unless otherwise noted, all information is of Tiptree on a consolidated
basis before non-controlling interest. Neither Tiptree nor any of its affiliates makes any representation or warranty, express or implied, as to the accuracy or completeness of
the information contained herein and no such party shall have any liability for such information. These materials and any related oral statements are not all-inclusive and
shall not be construed as legal, tax, investment or any other advice. You should consult your own counsel, accountant or business advisors. Performance information is
historical and is not indicative of, nor does it guarantee future results. There can be no assurance that similar performance may be experienced in the future.
SPECIAL NOTE REGARDING FORWARD-LOOKING STATEMENTS
This document contains "forward-looking statements" which involve risks, uncertainties and contingencies, many of which are beyond Tiptree's control, which may cause
actual results, performance, or achievements to differ materially from anticipated results, performance, or achievements. All statements contained herein that are not clearly
historical in nature are forward-looking, and the words "anticipate," "believe," "estimate," "expect,“ “intend,” “may,” “might,” "plan," “project,” “should,” "target,“ “will,” or
similar expressions are intended to identify forward-looking statements. Such forward-looking statements include, but are not limited to, statements about Tiptree's plans,
objectives, expectations and intentions. The forward-looking statements are not guarantees of future performance and are subject to risks, uncertainties and other factors,
many of which are beyond our control, are difficult to predict and could cause actual results to differ materially from those expressed or forecast in the forward-looking
statements. Our actual results could differ materially from those anticipated in these forward-looking statements as a result of various factors, including, but not limited to
those described in the section entitled “Risk Factors” in Tiptree’s Annual Report on Form 10-K, and as described in the Tiptree’s other filings with the SEC. Readers are
cautioned not to place undue reliance on these forward-looking statements, which speak only as to the date of this release. The factors described therein are not necessarily
all of the important factors that could cause actual results or developments to differ materially from those expressed in any of our forward-looking statements. Other
unknown or unpredictable factors also could affect our forward-looking statements. Consequently, our actual performance could be materially different from the results
described or anticipated by our forward-looking statements. Given these uncertainties, you should not place undue reliance on these forward-looking statements. Except as
required by the federal securities laws, we undertake no obligation to update any forward-looking statements.
MARKET AND INDUSTRY DATA
Certain market data and industry data used in this presentation were obtained from reports of governmental agencies and industry publications and surveys. We believe the
data from third-party sources to be reliable based upon our management’s knowledge of the industry, but have not independently verified such data and as such, make no
guarantees as to its accuracy, completeness or timeliness.
NOT AN OFFER OR A SOLICIATION
This document does not constitute an offer or invitation for the sale or purchase of securities or to engage in any other transaction with Tiptree, its subsidiaries or its
affiliates. The information in this document is not targeted at the residents of any particular country or jurisdiction and is not intended for distribution to, or use by, any
person in any jurisdiction or country where such distribution or use would be contrary to local law or regulation.
NON-GAAP MEASURES
In this document, we sometimes use financial measures derived from consolidated financial data but not presented in our financial statements prepared in accordance with
U.S. generally accepted accounting principles (GAAP). Certain of these data are considered “non-GAAP financial measures” under the SEC rules. These non-GAAP financial
measures supplement our GAAP disclosures and should not be considered an alternative to the GAAP measure. Management's reasons for using these non-GAAP financial
measures and the reconciliations to their most directly comparable GAAP financial measures are posted in the Appendix.
rofitable Insurer
OUR STRATEGY
2
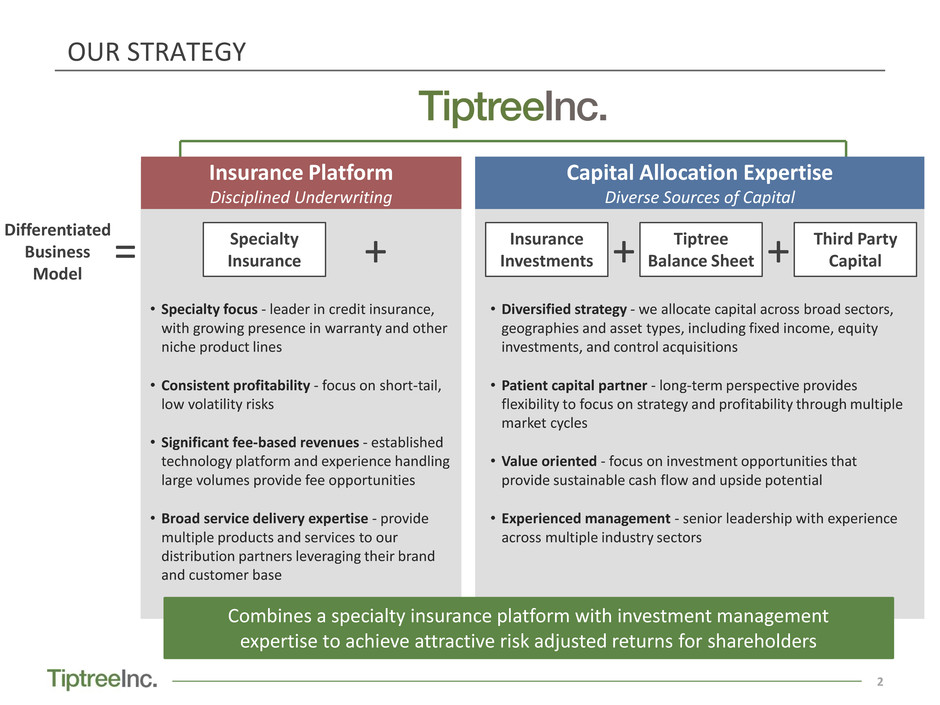
• Specialty focus - leader in credit insurance,
with growing presence in warranty and other
niche product lines
• Consistent profitability - focus on short-tail,
low volatility risks
• Significant fee-based revenues - established
technology platform and experience handling
large volumes provide fee opportunities
• Broad service delivery expertise - provide
multiple products and services to our
distribution partners leveraging their brand
and customer base
Specialty
Insurance +
Differentiated
Business
Model
= InsuranceInvestments + Tiptree Balance Sheet
Combines a specialty insurance platform with investment management
expertise to achieve attractive risk adjusted returns for shareholders
• Diversified strategy - we allocate capital across broad sectors,
geographies and asset types, including fixed income, equity
investments, and control acquisitions
• Patient capital partner - long-term perspective provides
flexibility to focus on strategy and profitability through multiple
market cycles
• Value oriented - focus on investment opportunities that
provide sustainable cash flow and upside potential
• Experienced management - senior leadership with experience
across multiple industry sectors
Third Party
Capital+
Insurance Platform
Disciplined Underwriting
Capital Allocation Expertise
Diverse Sources of Capital
TIPTREE TODAY
3
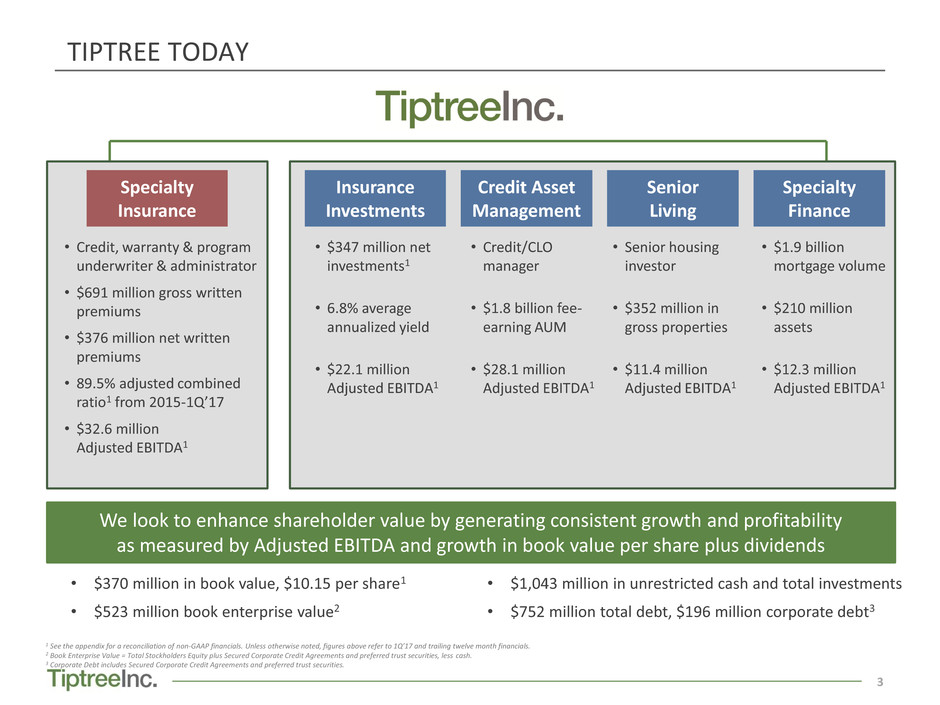
• $370 million in book value, $10.15 per share1
• $523 million book enterprise value2
• $1,043 million in unrestricted cash and total investments
• $752 million total debt, $196 million corporate debt3
• Credit, warranty & program
underwriter & administrator
• $691 million gross written
premiums
• $376 million net written
premiums
• 89.5% adjusted combined
ratio1 from 2015-1Q’17
• $32.6 million
Adjusted EBITDA1
• Senior housing
investor
• $352 million in
gross properties
• $11.4 million
Adjusted EBITDA1
• $1.9 billion
mortgage volume
• $210 million
assets
• $12.3 million
Adjusted EBITDA1
• Credit/CLO
manager
• $1.8 billion fee-
earning AUM
• $28.1 million
Adjusted EBITDA1
• $347 million net
investments1
• 6.8% average
annualized yield
• $22.1 million
Adjusted EBITDA1
Specialty
Insurance
Insurance
Investments
Credit Asset
Management
Senior
Living
Specialty
Finance
1 See the appendix for a reconciliation of non-GAAP financials. Unless otherwise noted, figures above refer to 1Q’17 and trailing twelve month financials.
2 Book Enterprise Value = Total Stockholders Equity plus Secured Corporate Credit Agreements and preferred trust securities, less cash.
3 Corporate Debt includes Secured Corporate Credit Agreements and preferred trust securities.
We look to enhance shareholder value by generating consistent growth and profitability
as measured by Adjusted EBITDA and growth in book value per share plus dividends
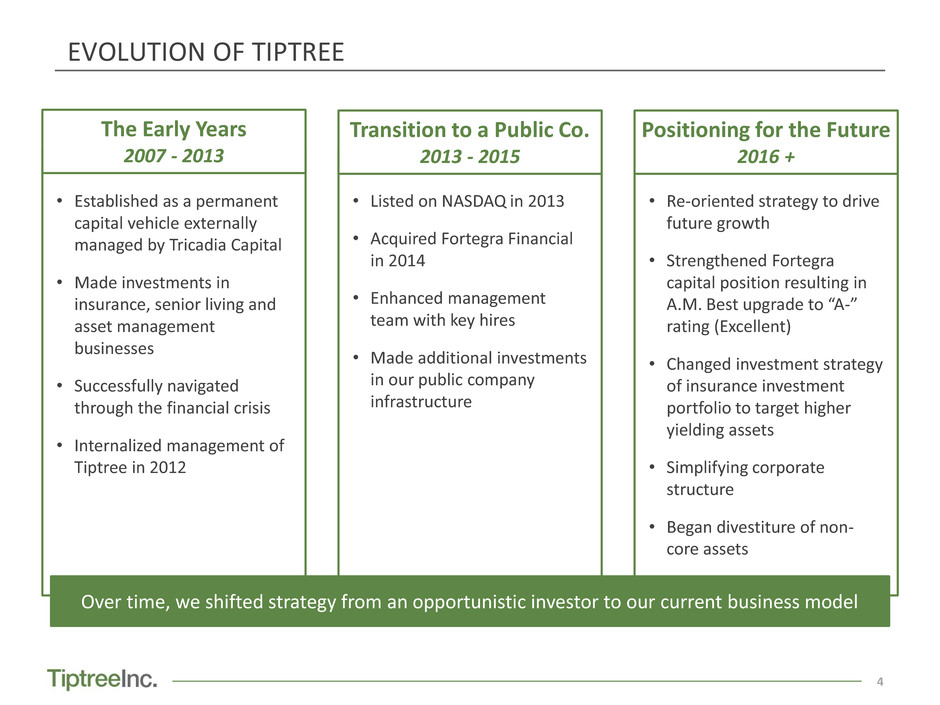
• Listed on NASDAQ in 2013
• Acquired Fortegra Financial
in 2014
• Enhanced management
team with key hires
• Made additional investments
in our public company
infrastructure
• Re-oriented strategy to drive
future growth
• Strengthened Fortegra
capital position resulting in
A.M. Best upgrade to “A-”
rating (Excellent)
• Changed investment strategy
of insurance investment
portfolio to target higher
yielding assets
• Simplifying corporate
structure
• Began divestiture of non-
core assets
EVOLUTION OF TIPTREE
4
• Established as a permanent
capital vehicle externally
managed by Tricadia Capital
• Made investments in
insurance, senior living and
asset management
businesses
• Successfully navigated
through the financial crisis
• Internalized management of
Tiptree in 2012
The Early Years
2007 - 2013
Transition to a Public Co.
2013 - 2015
Over time, we shifted strategy from an opportunistic investor to our current business model
Positioning for the Future
2016 +
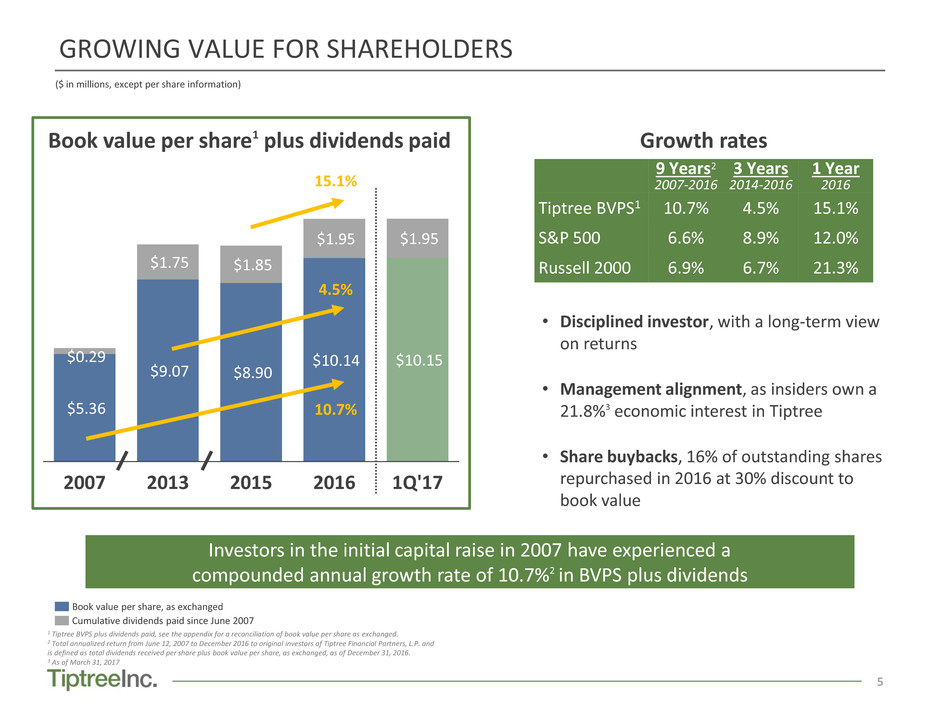
GROWING VALUE FOR SHAREHOLDERS
5
($ in millions, except per share information)
1 Tiptree BVPS plus dividends paid, see the appendix for a reconciliation of book value per share as exchanged.
2 Total annualized return from June 12, 2007 to December 2016 to original investors of Tiptree Financial Partners, L.P. and
is defined as total dividends received per share plus book value per share, as exchanged, as of December 31, 2016.
3 As of March 31, 2017
Investors in the initial capital raise in 2007 have experienced a
compounded annual growth rate of 10.7%2 in BVPS plus dividends
$5.36
$9.07 $8.90
$10.14 $10.15 $0.29
$1.75 $1.85
$1.95 $1.95
2007 2013 2015 2016 1Q'17
Book value per share1 plus dividends paid
Book value per share, as exchanged
Cumulative dividends paid since June 2007
• Disciplined investor, with a long-term view
on returns
• Management alignment, as insiders own a
21.8%3 economic interest in Tiptree
• Share buybacks, 16% of outstanding shares
repurchased in 2016 at 30% discount to
book value
9 Years2
2007-2016
3 Years
2014-2016
1 Year
2016
Tiptree BVPS1 10.7% 4.5% 15.1%
S&P 500 6.6% 8.9% 12.0%
Russell 2000 6.9% 6.7% 21.3%
Growth rates
10.7%
4.5%
15.1%
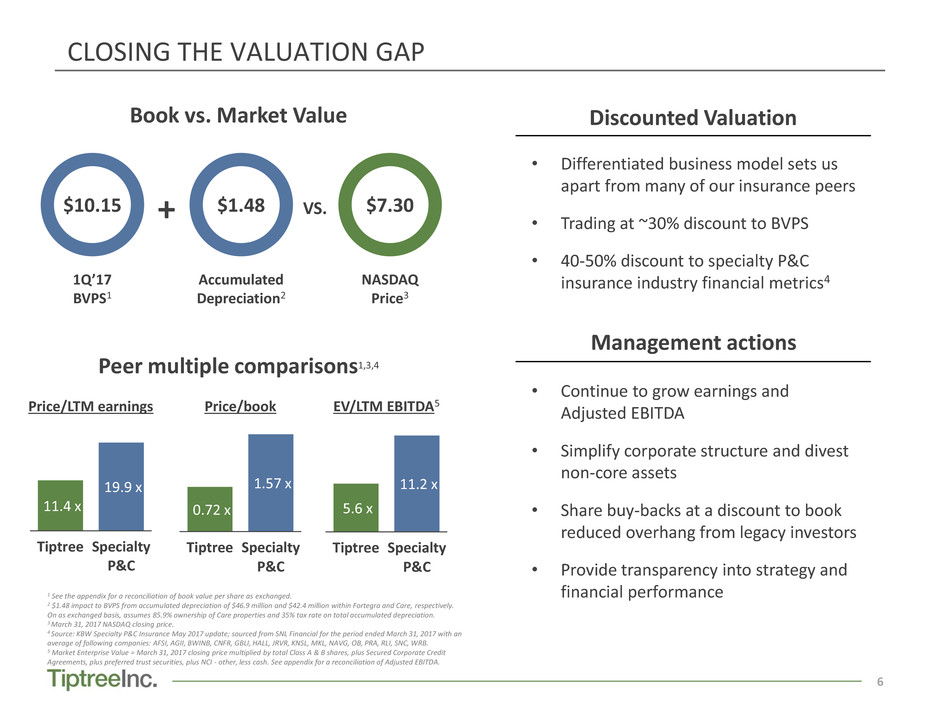
CLOSING THE VALUATION GAP
6
• Differentiated business model sets us
apart from many of our insurance peers
• Trading at ~30% discount to BVPS
• 40-50% discount to specialty P&C
insurance industry financial metrics4
Discounted ValuationBook vs. Market Value
1 See the appendix for a reconciliation of book value per share as exchanged.
2 $1.48 impact to BVPS from accumulated depreciation of $46.9 million and $42.4 million within Fortegra and Care, respectively.
On as exchanged basis, assumes 85.9% ownership of Care properties and 35% tax rate on total accumulated depreciation.
3 March 31, 2017 NASDAQ closing price.
4 Source: KBW Specialty P&C Insurance May 2017 update; sourced from SNL Financial for the period ended March 31, 2017 with an
average of following companies: AFSI, AGII, BWINB, CNFR, GBLI, HALL, JRVR, KNSL, MKL, NAVG, OB, PRA, RLI, SNC, WRB.
5 Market Enterprise Value = March 31, 2017 closing price multiplied by total Class A & B shares, plus Secured Corporate Credit
Agreements, plus preferred trust securities, plus NCI - other, less cash. See appendix for a reconciliation of Adjusted EBITDA.
Peer multiple comparisons1,3,4
11.4 x
19.9 x
Tiptree Specialty
P&C
0.72 x
1.57 x
Tiptree Specialty
P&C
5.6 x
11.2 x
Tiptree Specialty
P&C
Price/LTM earnings Price/book EV/LTM EBITDA5
NASDAQ
Price3
Management actions
• Continue to grow earnings and
Adjusted EBITDA
• Simplify corporate structure and divest
non-core assets
• Share buy-backs at a discount to book
reduced overhang from legacy investors
• Provide transparency into strategy and
financial performance
$10.15
1Q’17
BVPS1
Accumulated
Depreciation2
VS.+ $1.48 $7.30

7
OUR BUSINESS
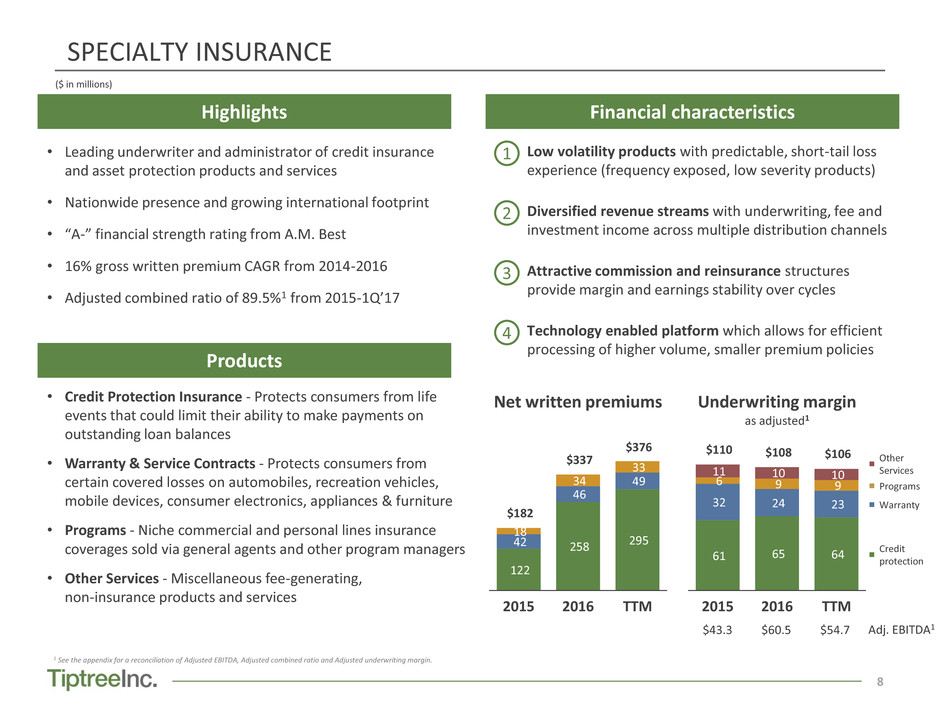
SPECIALTY INSURANCE
8
Highlights
• Leading underwriter and administrator of credit insurance
and asset protection products and services
• Nationwide presence and growing international footprint
• “A-” financial strength rating from A.M. Best
• 16% gross written premium CAGR from 2014-2016
• Adjusted combined ratio of 89.5%1 from 2015-1Q’17
• Credit Protection Insurance - Protects consumers from life
events that could limit their ability to make payments on
outstanding loan balances
• Warranty & Service Contracts - Protects consumers from
certain covered losses on automobiles, recreation vehicles,
mobile devices, consumer electronics, appliances & furniture
• Programs - Niche commercial and personal lines insurance
coverages sold via general agents and other program managers
• Other Services - Miscellaneous fee-generating,
non-insurance products and services
Products
122
258 295 42
46
49
18
34
33
$182
$337
$376
2015 2016 TTM
Net written premiums Underwriting margin
as adjusted1
61 65 64
32 24 23
6 9 9
11 10 10
$110 $108 $106
2015 2016 TTM
Credit
protection
Warranty
Programs
Other
Services
1 See the appendix for a reconciliation of Adjusted EBITDA, Adjusted combined ratio and Adjusted underwriting margin.
Financial characteristics
1 Low volatility products with predictable, short-tail loss
experience (frequency exposed, low severity products)
2 Diversified revenue streams with underwriting, fee and
investment income across multiple distribution channels
3 Attractive commission and reinsurance structures
provide margin and earnings stability over cycles
4 Technology enabled platform which allows for efficient
processing of higher volume, smaller premium policies
$43.3 $60.5 $54.7 Adj. EBITDA1
($ in millions)
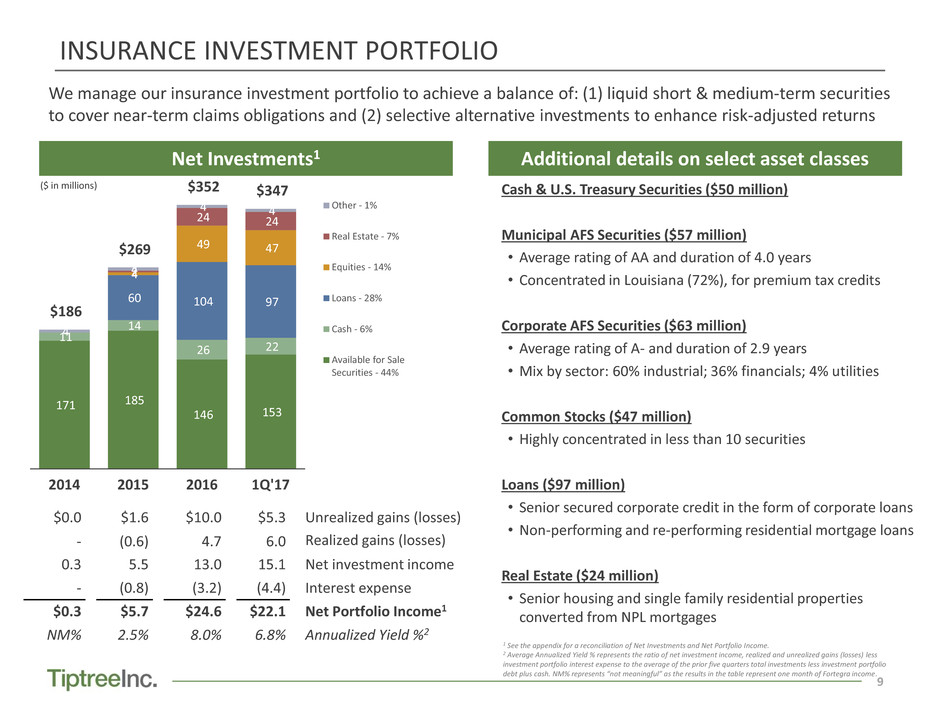
INSURANCE INVESTMENT PORTFOLIO
9
Net Investments1
171 185
146 153
11
14
26 22
-
60 104 97
4
49 47
2
24 24
4
4
4 4
$186
$269
$352 $347
2014 2015 2016 1Q'17
Other - 1%
Real Estate - 7%
Equities - 14%
Loans - 28%
Cash - 6%
Available for Sale
Securities - 44%
$0.0 $1.6 $10.0 $5.3 Unrealized gains (losses)
- (0.6) 4.7 6.0 Realized gains (losses)
0.3 5.5 13.0 15.1 Net investment income
- (0.8) (3.2) (4.4) Interest expense
$0.3 $5.7 $24.6 $22.1 Net Portfolio Income1
NM% 2.5% 8.0% 6.8% Annualized Yield %2
Additional details on select asset classes
Cash & U.S. Treasury Securities ($50 million)
Municipal AFS Securities ($57 million)
• Average rating of AA and duration of 4.0 years
• Concentrated in Louisiana (72%), for premium tax credits
Corporate AFS Securities ($63 million)
• Average rating of A- and duration of 2.9 years
• Mix by sector: 60% industrial; 36% financials; 4% utilities
Common Stocks ($47 million)
• Highly concentrated in less than 10 securities
Loans ($97 million)
• Senior secured corporate credit in the form of corporate loans
• Non-performing and re-performing residential mortgage loans
Real Estate ($24 million)
• Senior housing and single family residential properties
converted from NPL mortgages
1 See the appendix for a reconciliation of Net Investments and Net Portfolio Income.
2 Average Annualized Yield % represents the ratio of net investment income, realized and unrealized gains (losses) less
investment portfolio interest expense to the average of the prior five quarters total investments less investment portfolio
debt plus cash. NM% represents “not meaningful” as the results in the table represent one month of Fortegra income.
We manage our insurance investment portfolio to achieve a balance of: (1) liquid short & medium-term securities
to cover near-term claims obligations and (2) selective alternative investments to enhance risk-adjusted returns
($ in millions)
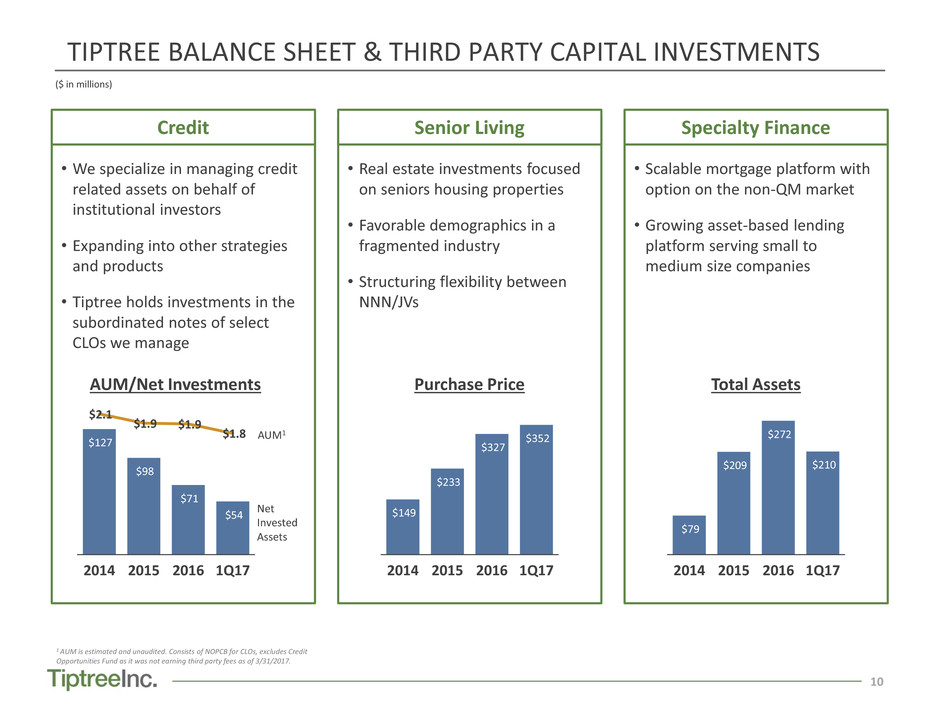
TIPTREE BALANCE SHEET & THIRD PARTY CAPITAL INVESTMENTS
10
• We specialize in managing credit
related assets on behalf of
institutional investors
• Expanding into other strategies
and products
• Tiptree holds investments in the
subordinated notes of select
CLOs we manage
• Real estate investments focused
on seniors housing properties
• Favorable demographics in a
fragmented industry
• Structuring flexibility between
NNN/JVs
• Scalable mortgage platform with
option on the non-QM market
• Growing asset-based lending
platform serving small to
medium size companies
$127
$98
$71
$54
$2.1
$1.9 $1.9
$1.8
2014 2015 2016 1Q17
$79
$209
$272
$210
2014 2015 2016 1Q17
Total AssetsPurchase PriceAUM/Net Investments
$149
$233
$327
$352
2014 2015 2016 1Q17
Credit Senior Living Specialty Finance
Net
Invested
Assets
AUM1
1 AUM is estimated and unaudited. Consists of NOPCB for CLOs, excludes Credit
Opportunities Fund as it was not earning third party fees as of 3/31/2017.
($ in millions)
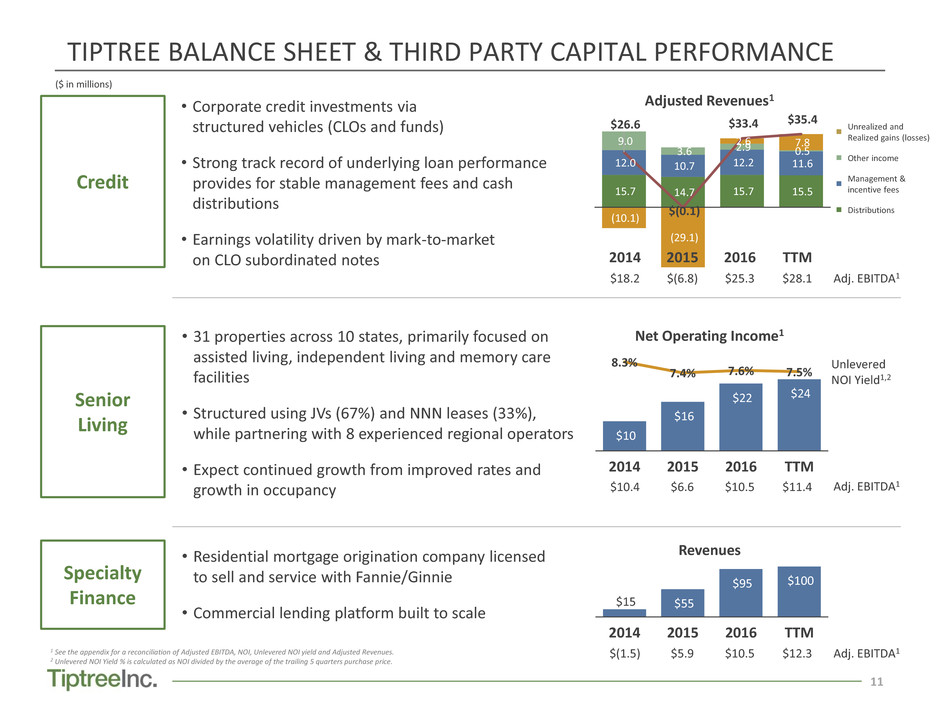
TIPTREE BALANCE SHEET & THIRD PARTY CAPITAL PERFORMANCE
11
Credit
Senior
Living
Specialty
Finance
• Corporate credit investments via
structured vehicles (CLOs and funds)
• Strong track record of underlying loan performance
provides for stable management fees and cash
distributions
• Earnings volatility driven by mark-to-market
on CLO subordinated notes
• 31 properties across 10 states, primarily focused on
assisted living, independent living and memory care
facilities
• Structured using JVs (67%) and NNN leases (33%),
while partnering with 8 experienced regional operators
• Expect continued growth from improved rates and
growth in occupancy
• Residential mortgage origination company licensed
to sell and service with Fannie/Ginnie
• Commercial lending platform built to scale
Adjusted Revenues1
Net Operating Income1
$10.4 $6.6 $10.5 $11.4
$15 $55
$95 $100
2014 2015 2016 TTM
Revenues
$(1.5) $5.9 $10.5 $12.3
Adj. EBITDA1
$10
$16
$22 $24
8.3%
7.4% 7.6% 7.5%
2014 2015 2016 TTM
Adj. EBITDA11 See the appendix for a reconciliation of Adjusted EBITDA, NOI, Unlevered NOI yield and Adjusted Revenues.
2 Unlevered NOI Yield % is calculated as NOI divided by the average of the trailing 5 quarters purchase price.
Unlevered
NOI Yield1,2
15.7 14.7 15.7 15.5
12.0 10.7 12.2 11.6
9.0
3.6 2.9 0.5
(10.1)
(29.1)
2.6 7.8
$26.6
$(0.1)
$33.4 $35.4
Adj. EBITDA1
2014
$18.2
2015
$(6.8)
2016
$25.3
TTM
$28.1
Unrealized and
Realized gains (losses)
Other income
Management &
incentive fees
Distributions
($ in millions)
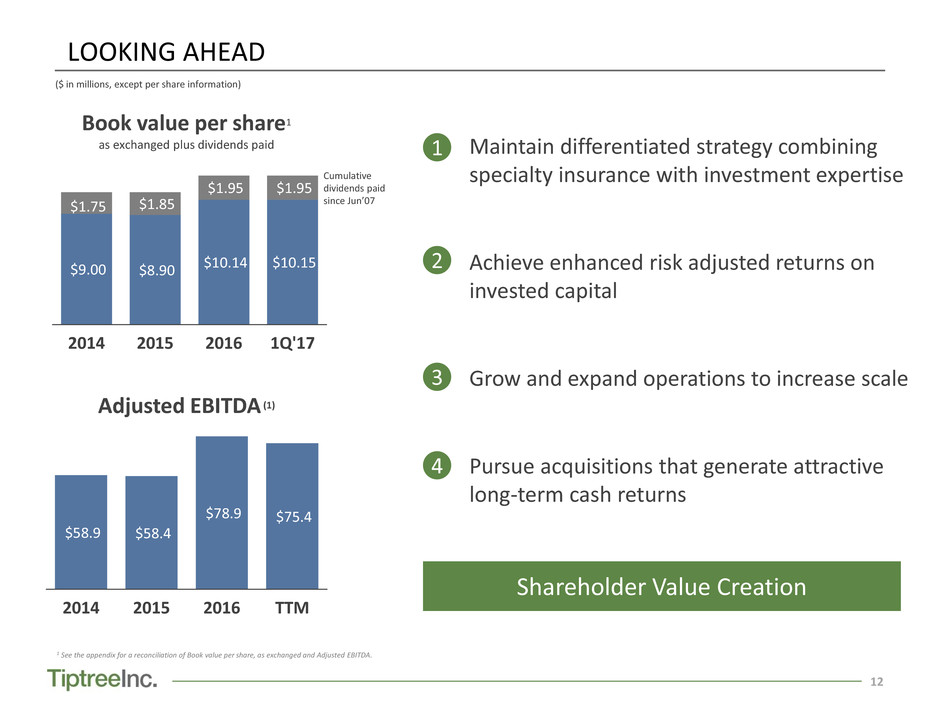
LOOKING AHEAD
12
1 See the appendix for a reconciliation of Book value per share, as exchanged and Adjusted EBITDA.
Book value per share1
as exchanged plus dividends paid
Adjusted EBITDA (1)
$58.9 $58.4
$78.9 $75.4
2014 2015 2016 TTM
1
4
$9.00 $8.90 $10.14 $10.15
$1.75 $1.85
$1.95 $1.95
2014 2015 2016 1Q'17
Cumulative
dividends paid
since Jun’07
Maintain differentiated strategy combining
specialty insurance with investment expertise
Achieve enhanced risk adjusted returns on
invested capital
Grow and expand operations to increase scale
Pursue acquisitions that generate attractive
long-term cash returns
2
3
Shareholder Value Creation
($ in millions, except per share information)
APPENDIX
13
NON-GAAP RECONCILIATIONS
14
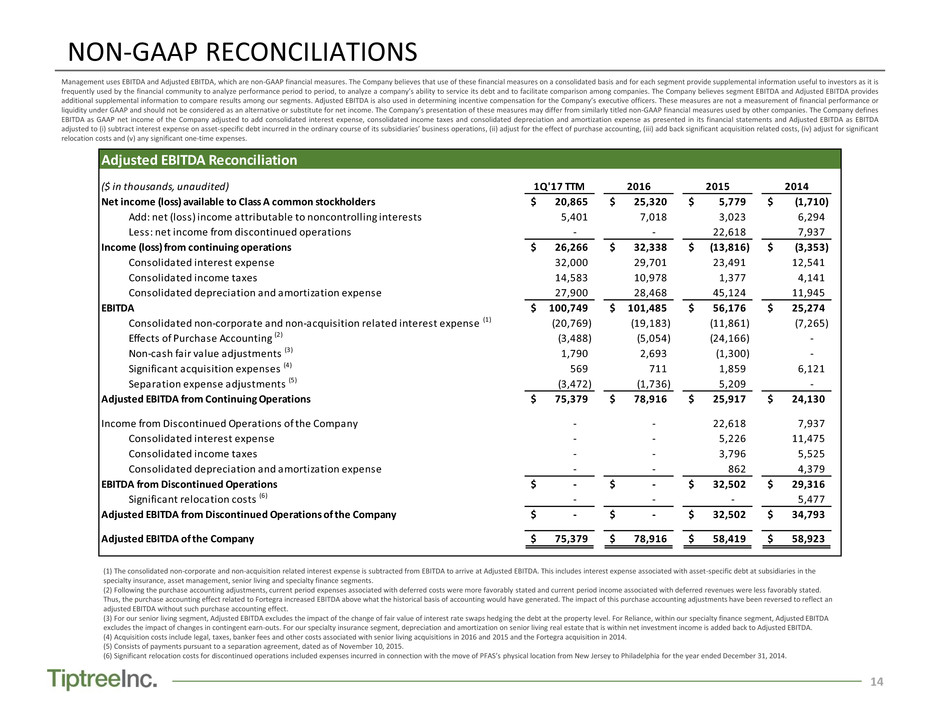
Management uses EBITDA and Adjusted EBITDA, which are non-GAAP financial measures. The Company believes that use of these financial measures on a consolidated basis and for each segment provide supplemental information useful to investors as it is
frequently used by the financial community to analyze performance period to period, to analyze a company’s ability to service its debt and to facilitate comparison among companies. The Company believes segment EBITDA and Adjusted EBITDA provides
additional supplemental information to compare results among our segments. Adjusted EBITDA is also used in determining incentive compensation for the Company’s executive officers. These measures are not a measurement of financial performance or
liquidity under GAAP and should not be considered as an alternative or substitute for net income. The Company’s presentation of these measures may differ from similarly titled non-GAAP financial measures used by other companies. The Company defines
EBITDA as GAAP net income of the Company adjusted to add consolidated interest expense, consolidated income taxes and consolidated depreciation and amortization expense as presented in its financial statements and Adjusted EBITDA as EBITDA
adjusted to (i) subtract interest expense on asset-specific debt incurred in the ordinary course of its subsidiaries’ business operations, (ii) adjust for the effect of purchase accounting, (iii) add back significant acquisition related costs, (iv) adjust for significant
relocation costs and (v) any significant one-time expenses.
(1) The consolidated non-corporate and non-acquisition related interest expense is subtracted from EBITDA to arrive at Adjusted EBITDA. This includes interest expense associated with asset-specific debt at subsidiaries in the
specialty insurance, asset management, senior living and specialty finance segments.
(2) Following the purchase accounting adjustments, current period expenses associated with deferred costs were more favorably stated and current period income associated with deferred revenues were less favorably stated.
Thus, the purchase accounting effect related to Fortegra increased EBITDA above what the historical basis of accounting would have generated. The impact of this purchase accounting adjustments have been reversed to reflect an
adjusted EBITDA without such purchase accounting effect.
(3) For our senior living segment, Adjusted EBITDA excludes the impact of the change of fair value of interest rate swaps hedging the debt at the property level. For Reliance, within our specialty finance segment, Adjusted EBITDA
excludes the impact of changes in contingent earn-outs. For our specialty insurance segment, depreciation and amortization on senior living real estate that is within net investment income is added back to Adjusted EBITDA.
(4) Acquisition costs include legal, taxes, banker fees and other costs associated with senior living acquisitions in 2016 and 2015 and the Fortegra acquisition in 2014.
(5) Consists of payments pursuant to a separation agreement, dated as of November 10, 2015.
(6) Significant relocation costs for discontinued operations included expenses incurred in connection with the move of PFAS’s physical location from New Jersey to Philadelphia for the year ended December 31, 2014.
Adjusted EBITDA Reconciliation
($ in thousands, unaudited) 1Q'17 TTM 2016 2015 2014
Net income (loss) available to Class A common stockholders 20,865$ 25,320$ 5,779$ (1,710)$
Add: net (loss) income attributable to noncontrolling interests 5,401 7,018 3,023 6,294
Less: net income from discontinued operations - - 22,618 7,937
Income (loss) from continuing operations 26,266$ 32,338$ (13,816)$ (3,353)$
Consolidated interest expense 32,000 29,701 23,491 12,541
Consolidated income taxes 14,583 10,978 1,377 4,141
Consolidated depreciation and amortization expense 27,900 28,468 45,124 11,945
EBITDA 100,749$ 101,485$ 56,176$ 25,274$
Consolidated non-corporate and non-acquisition related interest expense (1) (20,769) (19,183) (11,861) (7,265)
Effects of Purchase Accounting (2) (3,488) (5,054) (24,166) -
Non-cash fair value adjustments (3) 1,790 2,693 (1,300) -
Significant acquisition expenses (4) 569 711 1,859 6,121
Separation expense adjustments (5) (3,472) (1,736) 5,209 -
Adjusted EBITDA from Continuing Operations 75,379$ 78,916$ 25,917$ 24,130$
Income from Discontinued Operations of the Company - - 22,618 7,937
C n oli ted interest expense - - 5,226 11,475
C s lid te i come taxes - - 3,796 5,525
Consolidated depreciation and amortization expense - - 862 4,379
EBITDA from Discontinued Operations -$ -$ 32,502$ 29,316$
Significant relocation costs (6) - - - 5,477
Adjusted EBITDA from Discontinued Operations of the Company -$ -$ 32,502$ 34,793$
Adjusted EBITDA of the Company 75,379$ 78,916$ 58,419$ 58,923$
NON-GAAP RECONCILIATIONS
15
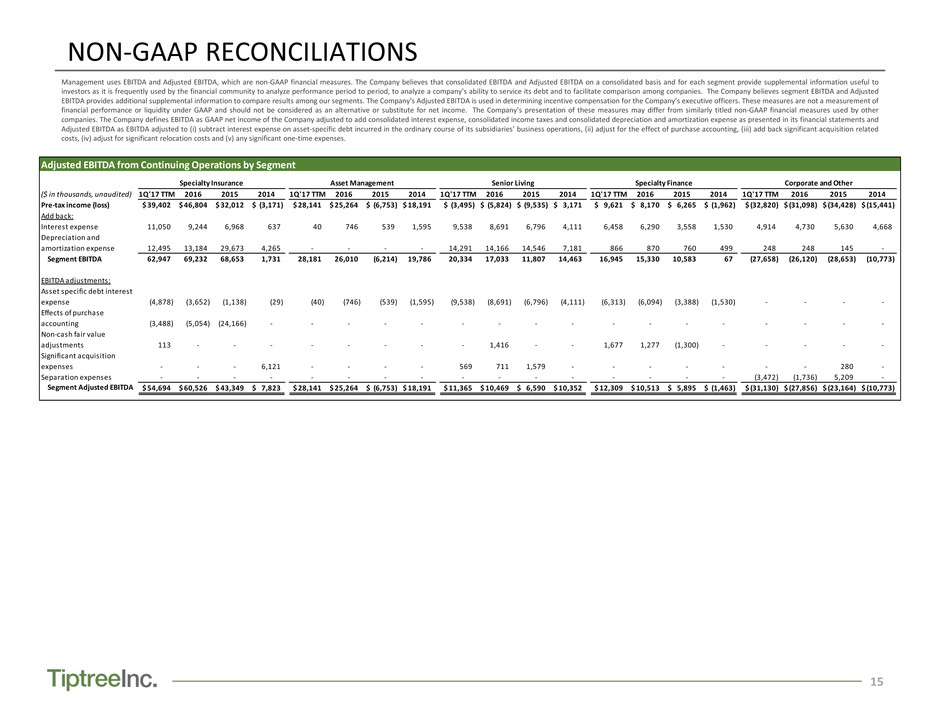
Management uses EBITDA and Adjusted EBITDA, which are non-GAAP financial measures. The Company believes that consolidated EBITDA and Adjusted EBITDA on a consolidated basis and for each segment provide supplemental information useful to
investors as it is frequently used by the financial community to analyze performance period to period, to analyze a company’s ability to service its debt and to facilitate comparison among companies. The Company believes segment EBITDA and Adjusted
EBITDA provides additional supplemental information to compare results among our segments. The Company's Adjusted EBITDA is used in determining incentive compensation for the Company’s executive officers. These measures are not a measurement of
financial performance or liquidity under GAAP and should not be considered as an alternative or substitute for net income. The Company’s presentation of these measures may differ from similarly titled non-GAAP financial measures used by other
companies. The Company defines EBITDA as GAAP net income of the Company adjusted to add consolidated interest expense, consolidated income taxes and consolidated depreciation and amortization expense as presented in its financial statements and
Adjusted EBITDA as EBITDA adjusted to (i) subtract interest expense on asset-specific debt incurred in the ordinary course of its subsidiaries’ business operations, (ii) adjust for the effect of purchase accounting, (iii) add back significant acquisition related
costs, (iv) adjust for significant relocation costs and (v) any significant one-time expenses.
Adjusted EBITDA from Continuing Operations by Segment
($ in thousands, unaudited) 1Q'17 TTM 2016 2015 2014 1Q'17 TTM 2016 2015 2014 1Q'17 TTM 2016 2015 2014 1Q'17 TTM 2016 2015 2014 1Q'17 TTM 2016 2015 2014
Pre-tax income (loss) 39,402$ 46,804$ 32,012$ (3,171)$ 28,141$ 25,264$ (6,753)$ 18,191$ (3,495)$ (5,824)$ (9,535)$ 3,171$ 9,621$ 8,170$ 6,265$ (1,962)$ (32,820)$ (31,098)$ (34,428)$ (15,441)$
Add back:
Interest expense 11,050 9,244 6,968 637 40 746 539 1,595 9,538 8,691 6,796 4,111 6,458 6,290 3,558 1,530 4,914 4,730 5,630 4,668
Depreciation and
amortization expense 12,495 13,184 29,673 4,265 - - - - 14,291 14,166 14,546 7,181 866 870 760 499 248 248 145 -
Segment EBITDA 62,947 69,232 68,653 1,731 28,181 26,010 (6,214) 19,786 20,334 17,033 11,807 14,463 16,945 15,330 10,583 67 (27,658) (26,120) (28,653) (10,773)
EBITDA adjustments:
Asset specific debt interest
expense (4,878) (3,652) (1,138) (29) (40) (746) (539) (1,595) (9,538) (8,691) (6,796) (4,111) (6,313) (6,094) (3,388) (1,530) - - - -
f f pur
c u ti g (3,488) (5,054) (24,166) - - - - - - - - - - - - - - - - -
Non-cash fair value
adjustments 113 - - - - - - - - 1,416 - - 1,677 1,277 (1,300) - - - - -
Significant acquisition
expenses - - - 6,121 - - - - 569 711 1,579 - - - - - - - 280 -
Separation expenses - - - - - - - - - - - - - - - - (3,472) (1,736) 5,209 -
Segment Adjusted EBITDA 54,694$ 60,526$ 43,349$ 7,823$ 28,141$ 25,264$ (6,753)$ 18,191$ 11,365$ 10,469$ 6,590$ 10,352$ 12,309$ 10,513$ 5,895$ (1,463)$ (31,130)$ (27,856)$ (23,164)$ (10,773)$
Specialty Insurance Asset Management Senior Living Specialty Finance Corporate and Other
NON-GAAP RECONCILIATIONS
16
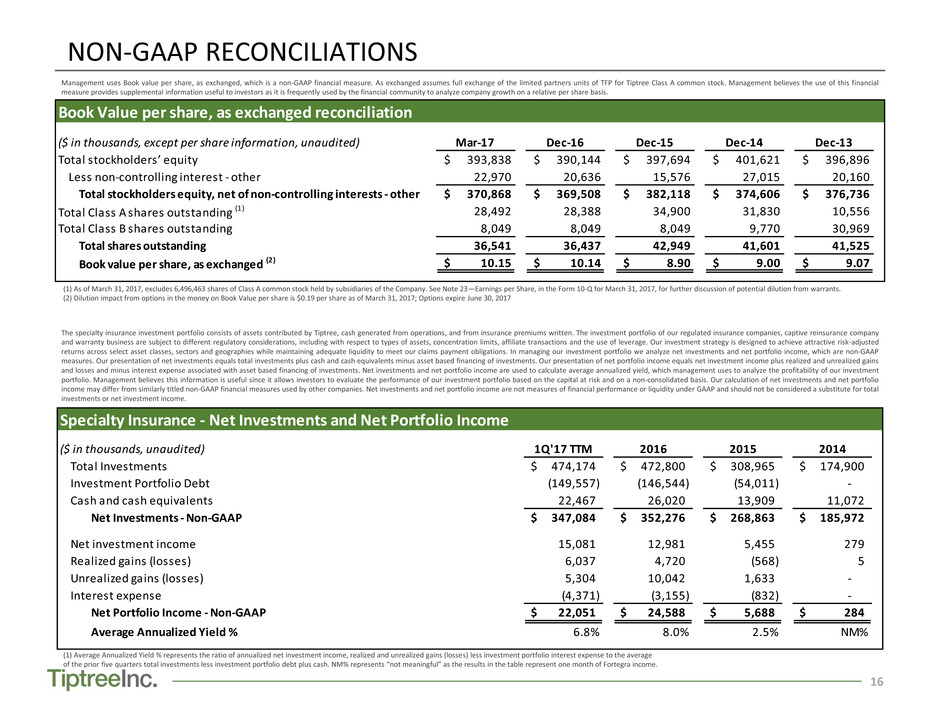
Management uses Book value per share, as exchanged, which is a non-GAAP financial measure. As exchanged assumes full exchange of the limited partners units of TFP for Tiptree Class A common stock. Management believes the use of this financial
measure provides supplemental information useful to investors as it is frequently used by the financial community to analyze company growth on a relative per share basis.
(1) As of March 31, 2017, excludes 6,496,463 shares of Class A common stock held by subsidiaries of the Company. See Note 23—Earnings per Share, in the Form 10-Q for March 31, 2017, for further discussion of potential dilution from warrants.
(2) Dilution impact from options in the money on Book Value per share is $0.19 per share as of March 31, 2017; Options expire June 30, 2017
The specialty insurance investment portfolio consists of assets contributed by Tiptree, cash generated from operations, and from insurance premiums written. The investment portfolio of our regulated insurance companies, captive reinsurance company
and warranty business are subject to different regulatory considerations, including with respect to types of assets, concentration limits, affiliate transactions and the use of leverage. Our investment strategy is designed to achieve attractive risk-adjusted
returns across select asset classes, sectors and geographies while maintaining adequate liquidity to meet our claims payment obligations. In managing our investment portfolio we analyze net investments and net portfolio income, which are non-GAAP
measures. Our presentation of net investments equals total investments plus cash and cash equivalents minus asset based financing of investments. Our presentation of net portfolio income equals net investment income plus realized and unrealized gains
and losses and minus interest expense associated with asset based financing of investments. Net investments and net portfolio income are used to calculate average annualized yield, which management uses to analyze the profitability of our investment
portfolio. Management believes this information is useful since it allows investors to evaluate the performance of our investment portfolio based on the capital at risk and on a non-consolidated basis. Our calculation of net investments and net portfolio
income may differ from similarly titled non-GAAP financial measures used by other companies. Net investments and net portfolio income are not measures of financial performance or liquidity under GAAP and should not be considered a substitute for total
investments or net investment income.
(1) Average Annualized Yield % represents the ratio of annualized net investment income, realized and unrealized gains (losses) less investment portfolio interest expense to the average
of the prior five quarters total investments less investment portfolio debt plus cash. NM% represents “not meaningful” as the results in the table represent one month of Fortegra income.
Specialty Insurance - Net Investments and Net Portfolio Income
($ in thousands, unaudited) 1Q'17 TTM 2016 2015 2014
Total Investments 474,174$ 472,800$ 308,965$ 174,900$
I v t Por folio Debt (149,557) (146,544) (54,011) -
Ca h d cash quivalents 22,467 26,020 13,909 11,072
N I v stm ts - Non-GAAP 347,084$ 352,276$ 268,863$ 185,972$
Net investment income 15,081 12,981 5,455 279
Realized gains (losses) 6,037 4,720 (568) 5
Unrealized gains (losses) 5,304 10,042 1,633 -
Interest expense (4,371) (3,155) (832) -
Net Portfolio Income - Non-GAAP 22,051$ 24,588$ 5,688$ 284$
Average Annualized Yield % 6.8% 8.0% 2.5% NM%
Book Value per share, as exchanged reconciliation
($ in thousands, except per share information, unaudited) Mar-17 Dec-16 Dec-15 Dec-14 Dec-13
T t l s ck older ’ equity $ 393,838 $ 390,144 $ 397,694 $ 401,621 $ 396,896
Less non-controlling interest - other 22,970 20,636 15,576 27,015 20,160
Tot l stockholders equity, net of non-controlling interests - other $ 370,868 $ 369,508 $ 382,118 $ 374,606 $ 376,736
Total Class A shares outstanding (1) 28,492 28,388 34,900 31,830 10,556
Total Class B shares outstanding 8,049 8,049 8,049 9,770 30,969
Total shares outstanding 36,541 36,437 42,949 41,601 41,525
Book alue per hare, as exchanged (2) $ 10.15 $ 0.14 $ 8.90 $ 9.00 $ 9.07
NON-GAAP RECONCILIATIONS
17
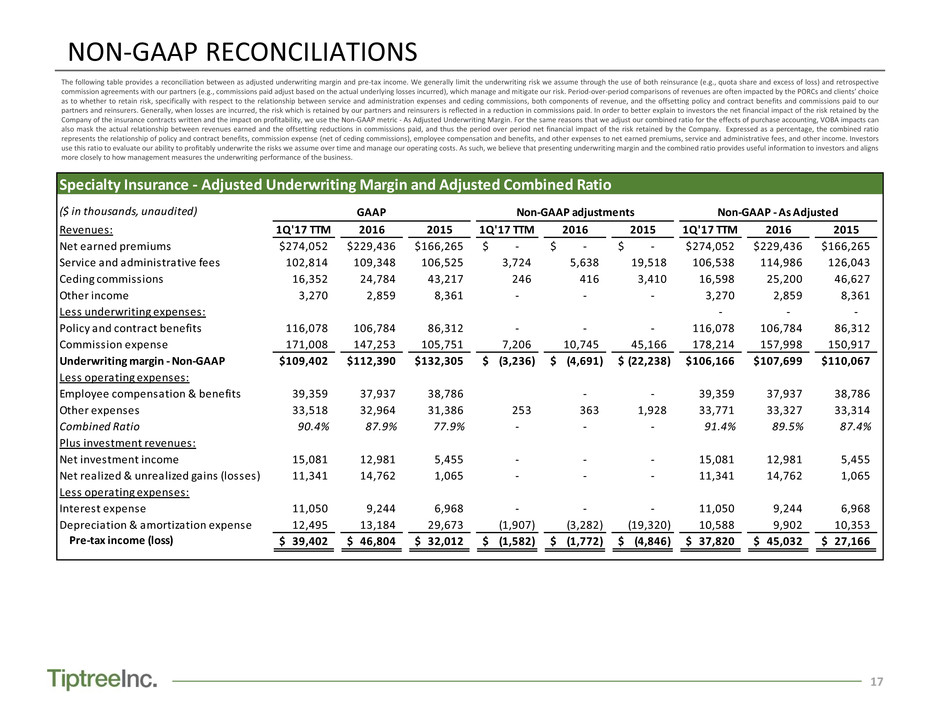
The following table provides a reconciliation between as adjusted underwriting margin and pre-tax income. We generally limit the underwriting risk we assume through the use of both reinsurance (e.g., quota share and excess of loss) and retrospective
commission agreements with our partners (e.g., commissions paid adjust based on the actual underlying losses incurred), which manage and mitigate our risk. Period-over-period comparisons of revenues are often impacted by the PORCs and clients’ choice
as to whether to retain risk, specifically with respect to the relationship between service and administration expenses and ceding commissions, both components of revenue, and the offsetting policy and contract benefits and commissions paid to our
partners and reinsurers. Generally, when losses are incurred, the risk which is retained by our partners and reinsurers is reflected in a reduction in commissions paid. In order to better explain to investors the net financial impact of the risk retained by the
Company of the insurance contracts written and the impact on profitability, we use the Non-GAAP metric - As Adjusted Underwriting Margin. For the same reasons that we adjust our combined ratio for the effects of purchase accounting, VOBA impacts can
also mask the actual relationship between revenues earned and the offsetting reductions in commissions paid, and thus the period over period net financial impact of the risk retained by the Company. Expressed as a percentage, the combined ratio
represents the relationship of policy and contract benefits, commission expense (net of ceding commissions), employee compensation and benefits, and other expenses to net earned premiums, service and administrative fees, and other income. Investors
use this ratio to evaluate our ability to profitably underwrite the risks we assume over time and manage our operating costs. As such, we believe that presenting underwriting margin and the combined ratio provides useful information to investors and aligns
more closely to how management measures the underwriting performance of the business.
Specialty Insurance - Adjusted Underwriting Margin and Adjusted Combined Ratio
($ in thousands, unaudited)
Revenues: 1Q'17 TTM 2016 2015 1Q'17 TTM 2016 2015 1Q'17 TTM 2016 2015
Net earned premiums 274,052$ 229,436$ 166,265$ -$ -$ -$ 274,052$ 229,436$ 166,265$
Service and administrative fees 102,814 109,348 106,525 3,724 5,638 19,518 106,538 114,986 126,043
Ceding commissions 16,352 24,784 43,217 246 416 3,410 16,598 25,200 46,627
Other income 3,270 2,859 8,361 - - - 3,270 2,859 8,361
Less underwriting expenses: - - -
Policy and contract benefits 116,078 106,784 86,312 - - - 116,078 106,784 86,312
Commission expense 171,008 147,253 105,751 7,206 10,745 45,166 178,214 157,998 150,917
Underwriting margin - Non-GAAP 109,402$ 112,390$ 132,305$ (3,236)$ (4,691)$ (22,238)$ 106,166$ 107,699$ 110,067$
Less operating expenses:
Employee compensation & benefits 39,359 37,937 38,786 - - 39,359 37,937 38,786
Other expenses 33,518 32,964 31,386 253 363 1,928 33,771 33,327 33,314
C mbi R i 90.4% 87.9% 77.9% - - - 91.4% 89.5% 87.4%
P s v m t venues:
Net investment income 15,081 12,981 5,455 - - - 15,081 12,981 5,455
Net realized & unrealized gains (losses) 11,341 14,762 1,065 - - - 11,341 14,762 1,065
Less operating expenses:
Interest expense 11,050 9,244 6,968 - - - 11,050 9,244 6,968
Depreciation & amortization expense 12,495 13,184 29,673 (1,907) (3,282) (19,320) 10,588 9,902 10,353
Pre-tax income (loss) 39,402$ 46,804$ 32,012$ (1,582)$ (1,772)$ (4,846)$ 37,820$ 45,032$ 27,166$
GAAP Non-GAAP adjustments Non-GAAP - As Adjusted
NON-GAAP RECONCILIATIONS
18
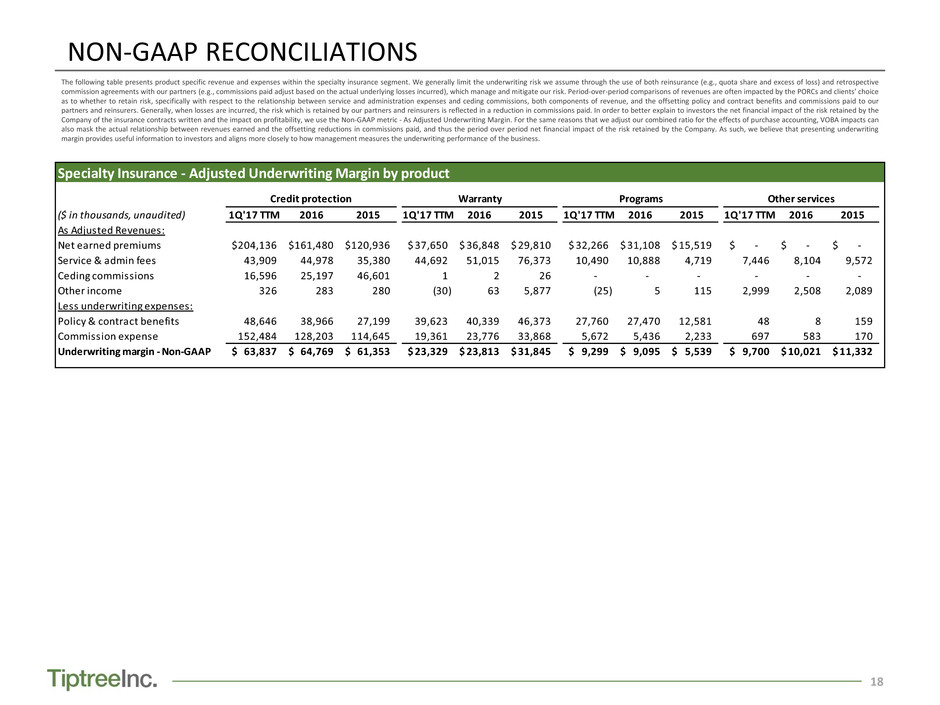
The following table presents product specific revenue and expenses within the specialty insurance segment. We generally limit the underwriting risk we assume through the use of both reinsurance (e.g., quota share and excess of loss) and retrospective
commission agreements with our partners (e.g., commissions paid adjust based on the actual underlying losses incurred), which manage and mitigate our risk. Period-over-period comparisons of revenues are often impacted by the PORCs and clients’ choice
as to whether to retain risk, specifically with respect to the relationship between service and administration expenses and ceding commissions, both components of revenue, and the offsetting policy and contract benefits and commissions paid to our
partners and reinsurers. Generally, when losses are incurred, the risk which is retained by our partners and reinsurers is reflected in a reduction in commissions paid. In order to better explain to investors the net financial impact of the risk retained by the
Company of the insurance contracts written and the impact on profitability, we use the Non-GAAP metric - As Adjusted Underwriting Margin. For the same reasons that we adjust our combined ratio for the effects of purchase accounting, VOBA impacts can
also mask the actual relationship between revenues earned and the offsetting reductions in commissions paid, and thus the period over period net financial impact of the risk retained by the Company. As such, we believe that presenting underwriting
margin provides useful information to investors and aligns more closely to how management measures the underwriting performance of the business.
Specialty Insurance - Adjusted Underwriting Margin by product
($ in thousands, unaudited) 1Q'17 TTM 2016 2015 1Q'17 TTM 2016 2015 1Q'17 TTM 2016 2015 1Q'17 TTM 2016 2015
A A ju t R u s:
N a s 204,136$ 161,480$ 120,936$ 37,650$ 36,848$ 29,810$ 32,266$ 31,108$ 15,519$ -$ -$ -$
S r i & a in f es 43,909 44,978 35,380 44,692 51,015 76,373 10,490 10,888 4,719 7,446 8,104 9,572
Ceding commissions 16,596 25,197 46,601 1 2 26 - - - - - -
Other income 326 283 280 (30) 63 5,877 (25) 5 115 2,999 2,508 2,089
Less underwriting expenses:
Policy & contract benefits 48,646 38,966 27,199 39,623 40,339 46,373 27,760 27,470 12,581 48 8 159
Commission expense 152,484 128,203 114,645 19,361 23,776 33,868 5,672 5,436 2,233 697 583 170
Underwriting margin - Non-GAAP 63,837$ 64,769$ 61,353$ 23,329$ 23,813$ 31,845$ 9,299$ 9,095$ 5,539$ 9,700$ 10,021$ 11,332$
Credit protection Warranty Programs Other services
NON-GAAP RECONCILIATIONS
19
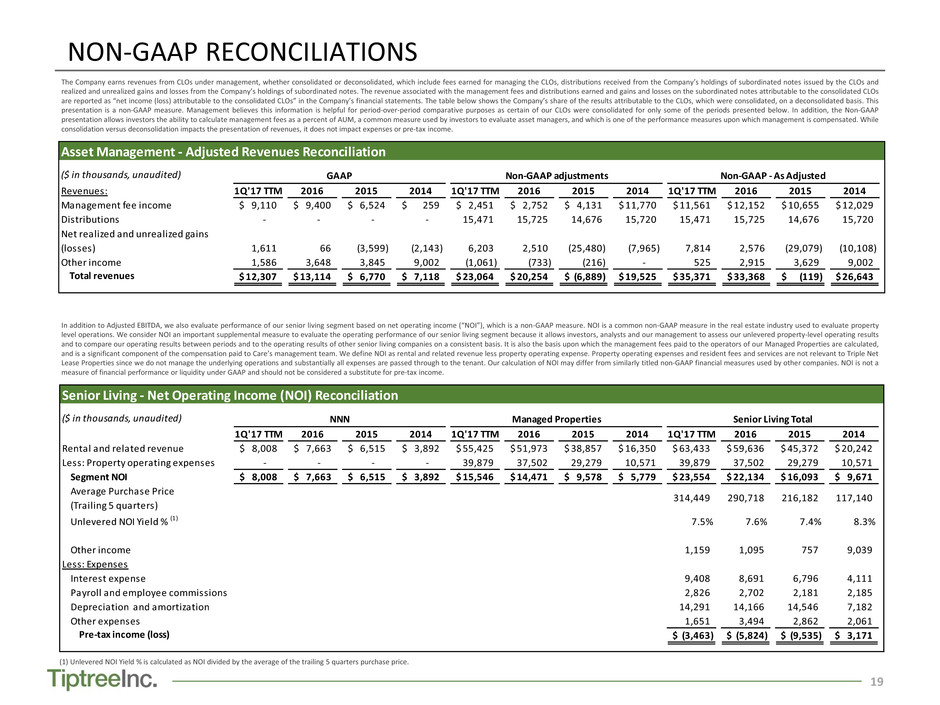
The Company earns revenues from CLOs under management, whether consolidated or deconsolidated, which include fees earned for managing the CLOs, distributions received from the Company’s holdings of subordinated notes issued by the CLOs and
realized and unrealized gains and losses from the Company’s holdings of subordinated notes. The revenue associated with the management fees and distributions earned and gains and losses on the subordinated notes attributable to the consolidated CLOs
are reported as “net income (loss) attributable to the consolidated CLOs” in the Company’s financial statements. The table below shows the Company’s share of the results attributable to the CLOs, which were consolidated, on a deconsolidated basis. This
presentation is a non-GAAP measure. Management believes this information is helpful for period-over-period comparative purposes as certain of our CLOs were consolidated for only some of the periods presented below. In addition, the Non-GAAP
presentation allows investors the ability to calculate management fees as a percent of AUM, a common measure used by investors to evaluate asset managers, and which is one of the performance measures upon which management is compensated. While
consolidation versus deconsolidation impacts the presentation of revenues, it does not impact expenses or pre-tax income.
In addition to Adjusted EBITDA, we also evaluate performance of our senior living segment based on net operating income (“NOI”), which is a non-GAAP measure. NOI is a common non-GAAP measure in the real estate industry used to evaluate property
level operations. We consider NOI an important supplemental measure to evaluate the operating performance of our senior living segment because it allows investors, analysts and our management to assess our unlevered property-level operating results
and to compare our operating results between periods and to the operating results of other senior living companies on a consistent basis. It is also the basis upon which the management fees paid to the operators of our Managed Properties are calculated,
and is a significant component of the compensation paid to Care’s management team. We define NOI as rental and related revenue less property operating expense. Property operating expenses and resident fees and services are not relevant to Triple Net
Lease Properties since we do not manage the underlying operations and substantially all expenses are passed through to the tenant. Our calculation of NOI may differ from similarly titled non-GAAP financial measures used by other companies. NOI is not a
measure of financial performance or liquidity under GAAP and should not be considered a substitute for pre-tax income.
Ass t M ag ment - Adjusted Revenues Reconciliation
($ us udited)
R v : 1Q'17 TTM 2016 2015 2014 1Q'17 TTM 2016 2015 2014 1Q'17 TTM 2016 2015 2014
Management fee income 9,110$ 9,400$ 6,524$ 259$ 2,451$ 2,752$ 4,131$ 11,770$ 11,561$ 12,152$ 10,655$ 12,029$
Distributions - - - - 15,471 15,725 14,676 15,720 15,471 15,725 14,676 15,720
Net realized and unrealized gains
(losses) 1,611 66 (3,599) (2,143) 6,203 2,510 (25,480) (7,965) 7,814 2,576 (29,079) (10,108)
Other income 1,586 3,648 3,845 9,002 (1,061) (733) (216) - 525 2,915 3,629 9,002
Total revenues 12,307$ 13,114$ 6,770$ 7,118$ 23,064$ 20,254$ (6,889)$ 19,525$ 35,371$ 33,368$ (119)$ 26,643$
GAAP Non-GAAP adjustments Non-GAAP - As Adjusted
Senior Living - Net Operating Income (NOI) Reconciliation
($ in thousands, unaudited)
1Q'17 TTM 2016 2015 2014 1Q'17 TTM 2016 2015 2014 1Q'17 TTM 2016 2015 2014
Rental and rel ted revenue 8,008$ 7,663$ 6,515$ 3,892$ 55,425$ 51,973$ 38,857$ 16,350$ 63,433$ 59,636$ 45,372$ 20,242$
L s: P y rating expenses - - - - 39,879 37,502 29,279 10,571 39,879 37,502 29,279 10,571
S gm t NOI 8 008 7 663 15 3,892 15 546 14,471 9,578 5, 9 23, 54 2 , 34 6,093 9,671
Aver ge Purchase Price
(Trailing 5 quarters)
102,928 99,052 86,281 4 ,700 211,521 191,666 1 9,901 74,440 314,449 290,718 216,182 1 7, 40
Unlevered NOI Yield % (1) 7.8% 7.7% 7.6% 9. % 7.3% 7.6% 7.4% 7.8% 7.5% 7. % 7.4% 8.3%
O r i 1,159 1,095 757 9,039
Less: Expenses
Interest expense 9,408 8,691 6,796 4,111
Payroll and employee commissions 2,826 2,702 2,181 2,185
Depreciation and amortization 14,291 14,166 14,546 7,182
Other expenses 1,651 3,494 2,862 2,061
Pre-tax income (loss) (3,463)$ (5,824)$ (9,535)$ 3,171$
NNN Managed Properties Senior Living Total
(1) Unlevered NOI Yield % is calculated as NOI divided by the average of the trailing 5 quarters purchase price.
