Attached files
| file | filename |
|---|---|
| 8-K - 8-K - CorEnergy Infrastructure Trust, Inc. | form8k.htm |
Exhibit 99.1
REITWeek 2017Rick Green, Executive ChairmanJune 7, 2017 LISTED CORR NYSE
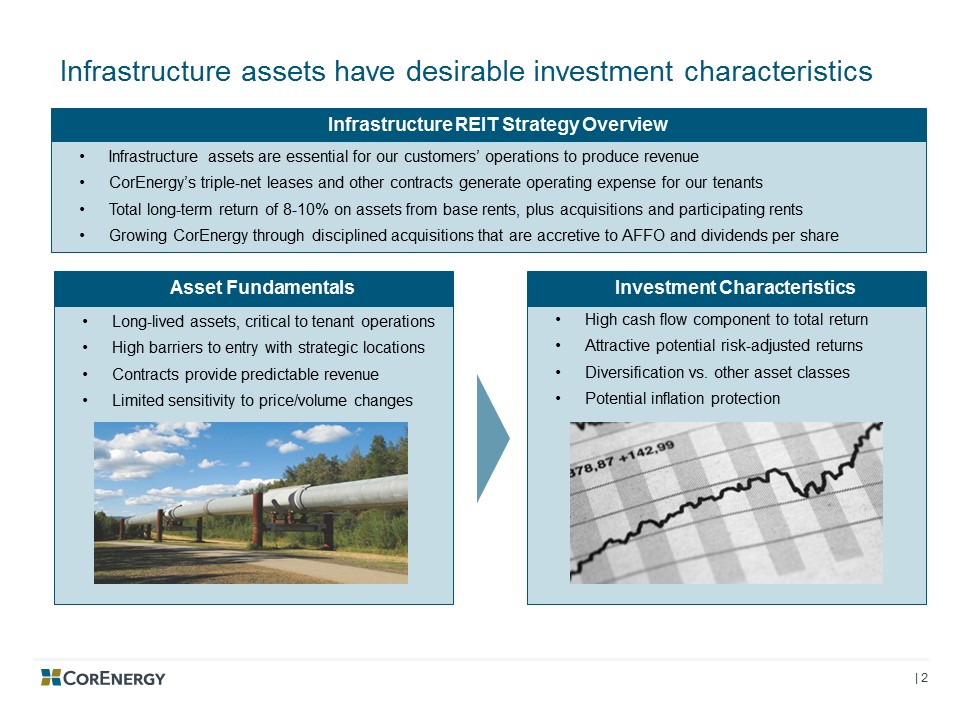
Infrastructure assets have desirable investment characteristics Long-lived assets, critical to tenant operationsHigh barriers to entry with strategic locationsContracts provide predictable revenueLimited sensitivity to price/volume changes Asset Fundamentals High cash flow component to total returnAttractive potential risk-adjusted returnsDiversification vs. other asset classesPotential inflation protection Investment Characteristics Infrastructure assets are essential for our customers’ operations to produce revenueCorEnergy’s triple-net leases and other contracts generate operating expense for our tenantsTotal long-term return of 8-10% on assets from base rents, plus acquisitions and participating rentsGrowing CorEnergy through disciplined acquisitions that are accretive to AFFO and dividends per share Infrastructure REIT Strategy Overview
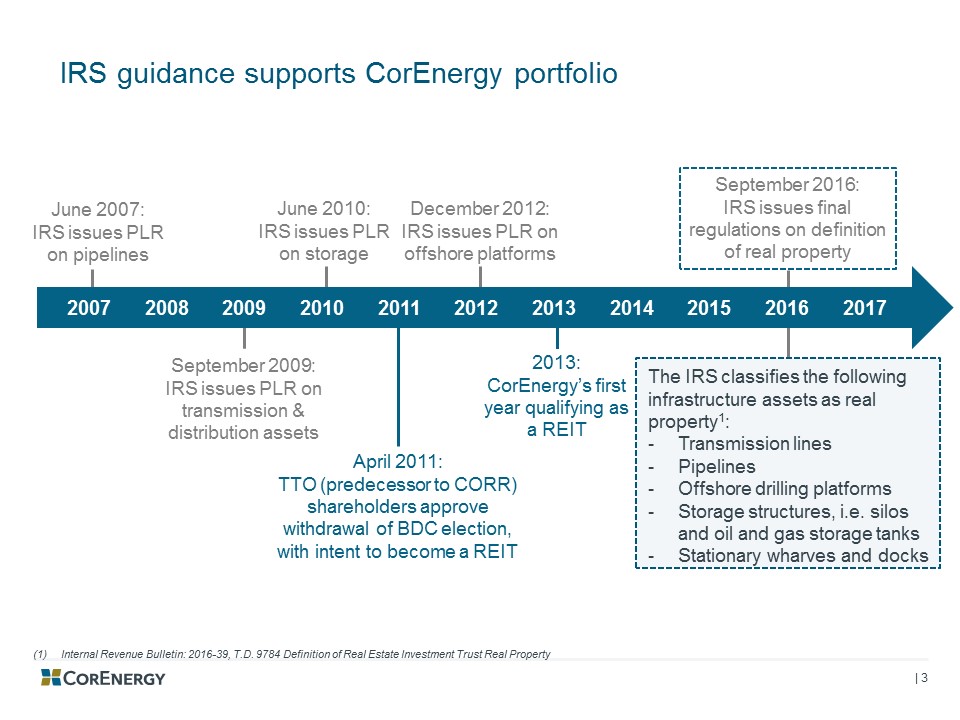
Key Gating Items IRS guidance supports CorEnergy portfolio September 2009:IRS issues PLR on transmission & distribution assets September 2016:IRS issues final regulations on definition of real property June 2007:IRS issues PLR on pipelines June 2010:IRS issues PLR on storage December 2012:IRS issues PLR on offshore platforms 2013:CorEnergy’s first year qualifying as a REIT 2007 2008 2009 2010 2011 2012 2013 2014 2015 2016 2017 The IRS classifies the following infrastructure assets as real property1:Transmission linesPipelinesOffshore drilling platformsStorage structures, i.e. silos and oil and gas storage tanksStationary wharves and docks (1) Internal Revenue Bulletin: 2016-39, T.D. 9784 Definition of Real Estate Investment Trust Real Property April 2011:TTO (predecessor to CORR) shareholders approve withdrawal of BDC election, with intent to become a REIT
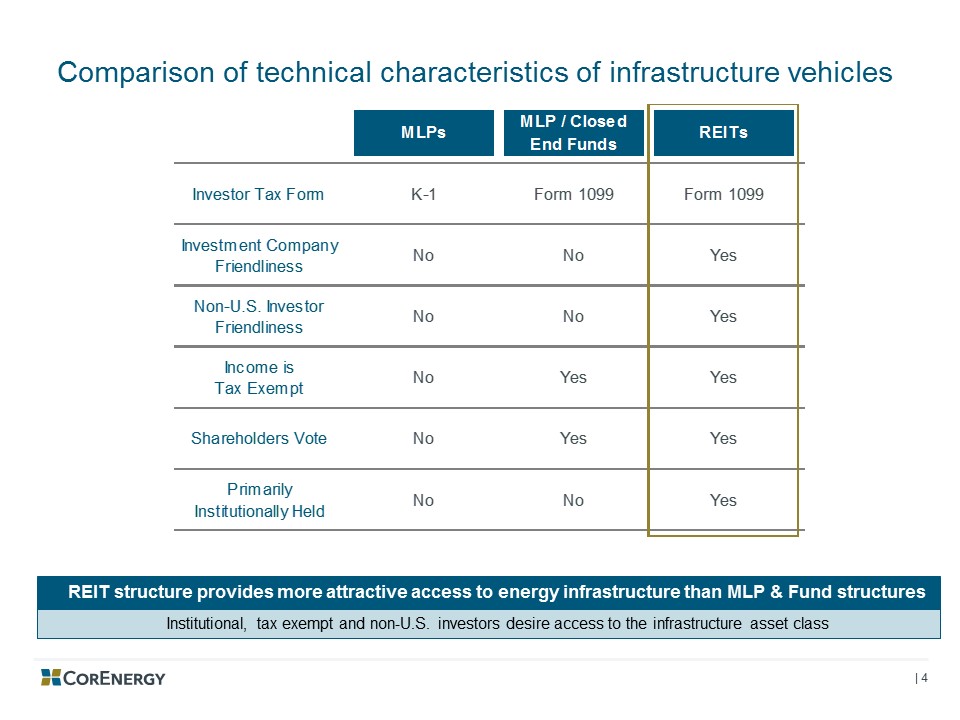
Key Gating Items Comparison of technical characteristics of infrastructure vehicles Institutional, tax exempt and non-U.S. investors desire access to the infrastructure asset class REIT structure provides more attractive access to energy infrastructure than MLP & Fund structures
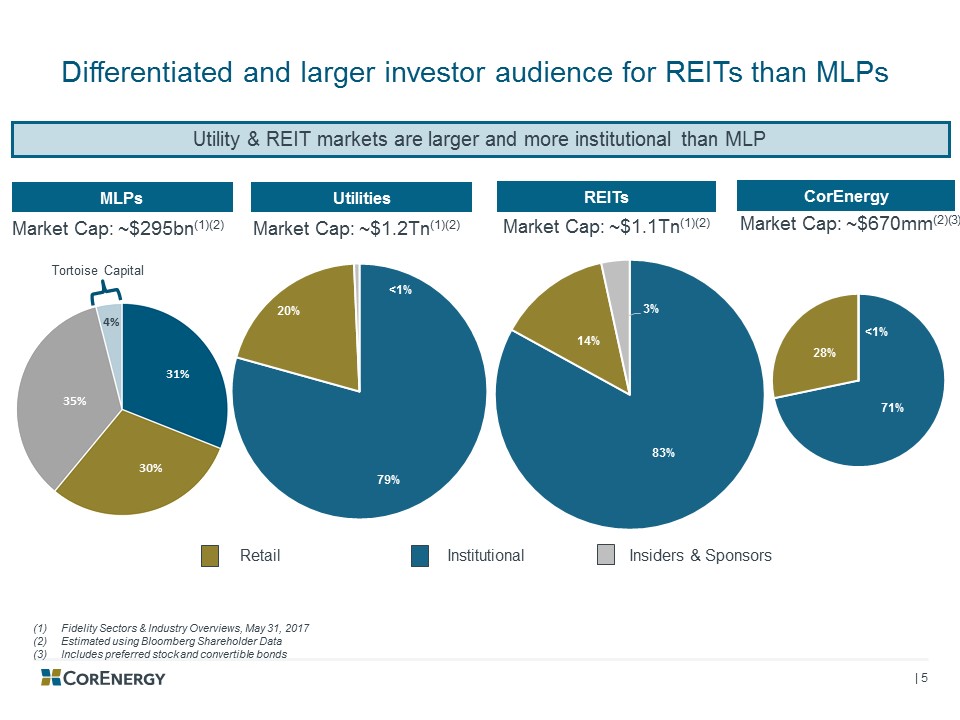
Differentiated and larger investor audience for REITs than MLPs (1) Fidelity Sectors & Industry Overviews, May 31, 2017(2) Estimated using Bloomberg Shareholder Data(3) Includes preferred stock and convertible bonds Utility & REIT markets are larger and more institutional than MLP Market Cap: ~$1.1Tn(1)(2) Market Cap: ~$1.2Tn(1)(2) REITs Market Cap: ~$295bn(1)(2) MLPs Utilities Retail Institutional Insiders & Sponsors Market Cap: ~$670mm(2)(3) CorEnergy Tortoise Capital <1% 30% 31% 35% 4% <1% <1%
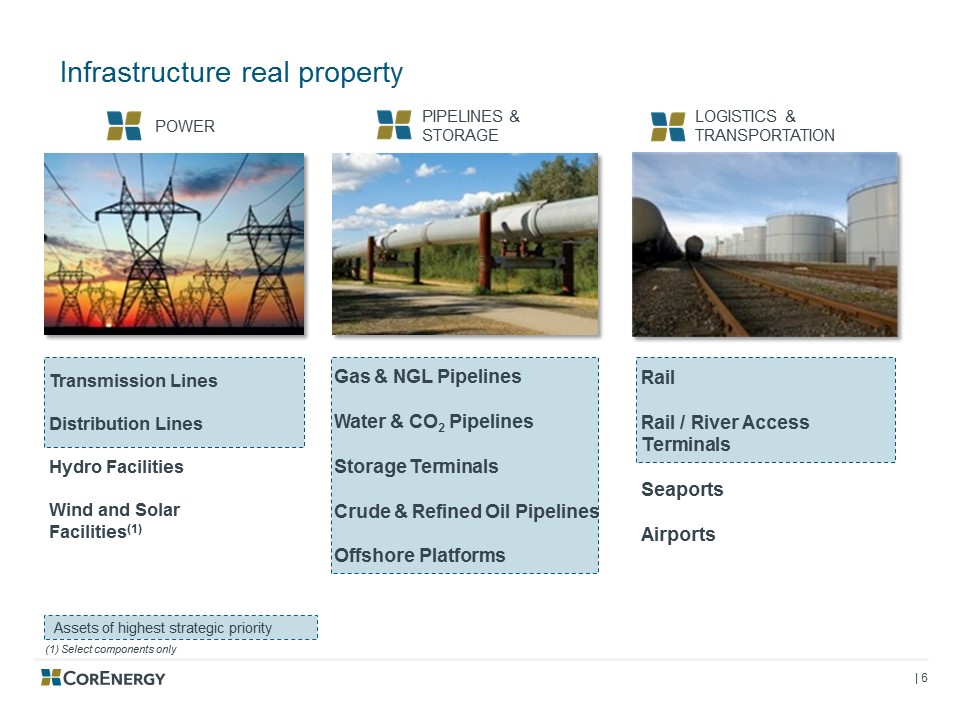
Infrastructure real property Assets of highest strategic priority LOGISTICS & TRANSPORTATION (1) Select components only PIPELINES & STORAGE Gas & NGL PipelinesWater & CO2 PipelinesStorage TerminalsCrude & Refined Oil PipelinesOffshore Platforms RailRail / River Access TerminalsSeaportsAirports Transmission LinesDistribution LinesHydro FacilitiesWind and Solar Facilities(1) POWER
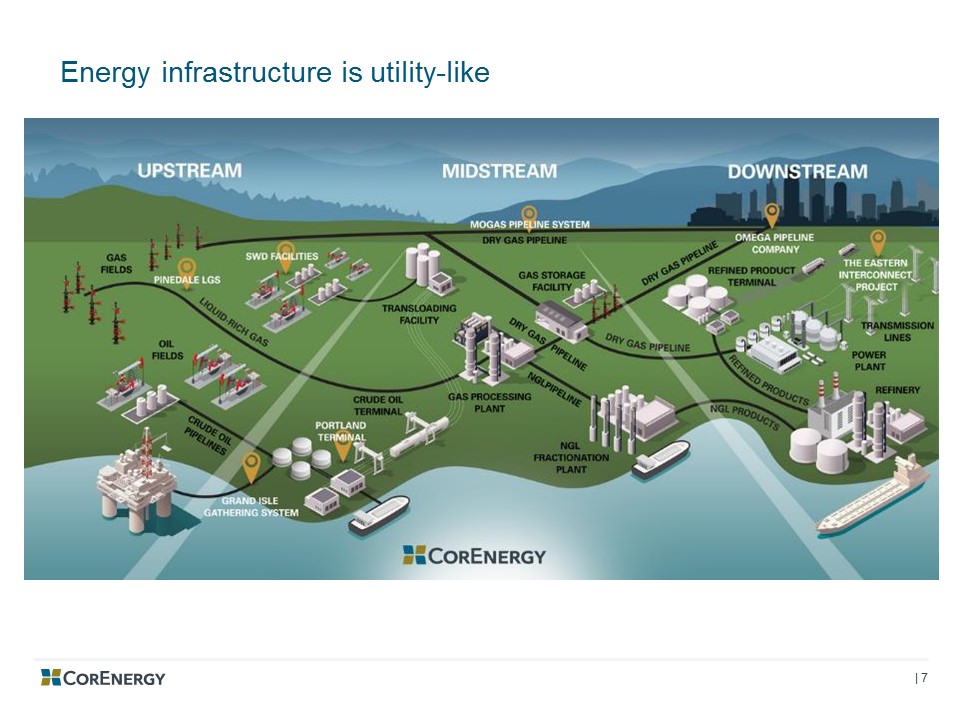
Energy infrastructure is utility-like
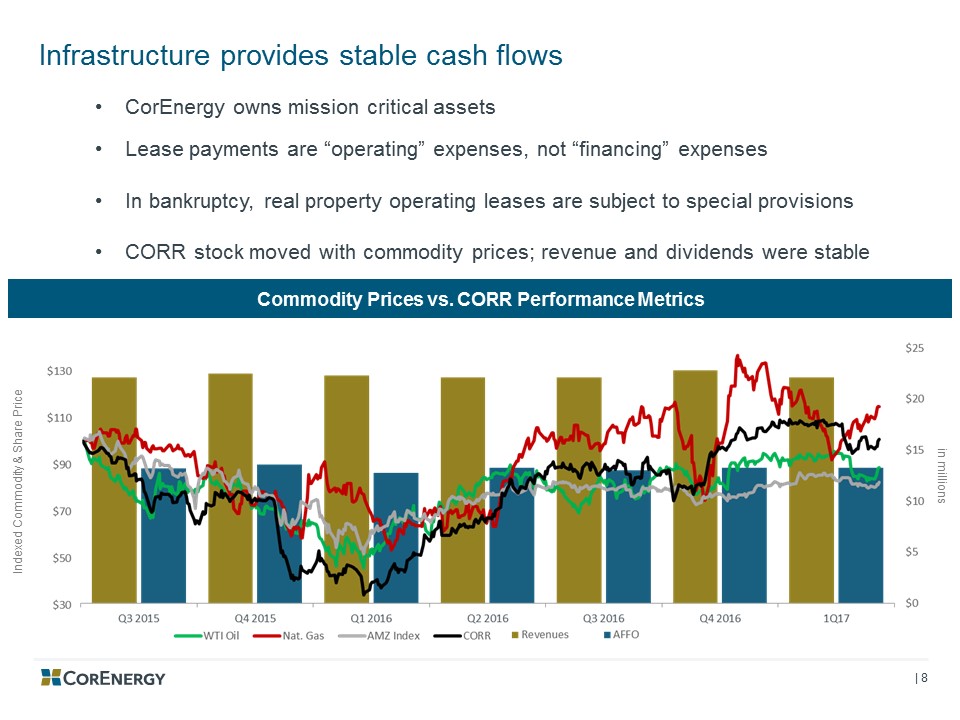
Infrastructure provides stable cash flows CorEnergy owns mission critical assetsLease payments are “operating” expenses, not “financing” expensesIn bankruptcy, real property operating leases are subject to special provisionsCORR stock moved with commodity prices; revenue and dividends were stable Commodity Prices vs. CORR Performance Metrics in millions Indexed Commodity & Share Price
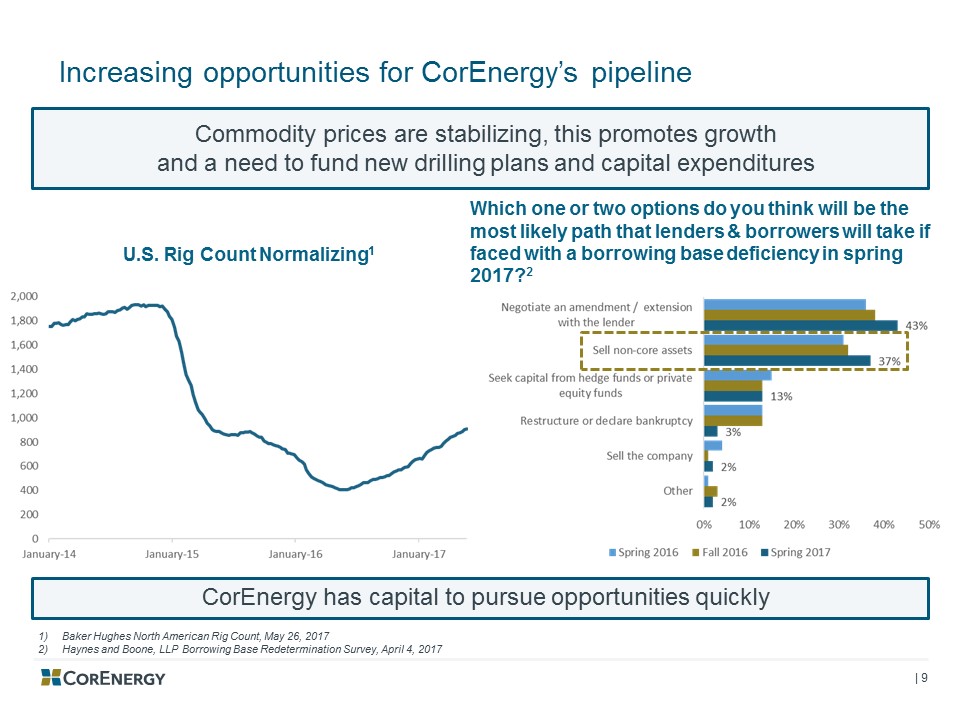
Increasing opportunities for CorEnergy’s pipeline Which one or two options do you think will be the most likely path that lenders & borrowers will take if faced with a borrowing base deficiency in spring 2017?2 U.S. Rig Count Normalizing1 Commodity prices are stabilizing, this promotes growthand a need to fund new drilling plans and capital expenditures CorEnergy has capital to pursue opportunities quickly Baker Hughes North American Rig Count, May 26, 2017Haynes and Boone, LLP Borrowing Base Redetermination Survey, April 4, 2017
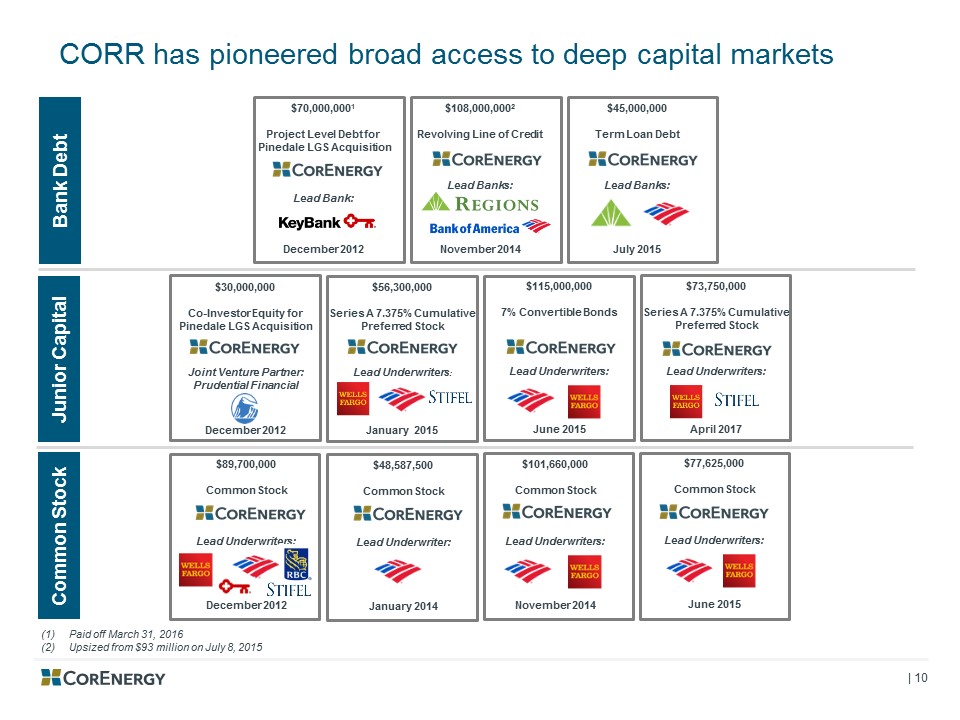
(1) Paid off March 31, 2016(2) Upsized from $93 million on July 8, 2015 CORR has pioneered broad access to deep capital markets Common Stock Bank Debt $30,000,000Co-Investor Equity for Pinedale LGS AcquisitionJoint Venture Partner:Prudential FinancialDecember 2012 $70,000,0001Project Level Debt for Pinedale LGS AcquisitionLead Bank:December 2012 Junior Capital $101,660,000Common StockLead Underwriters:November 2014 $108,000,0002Revolving Line of CreditLead Banks:November 2014 $45,000,000Term Loan DebtLead Banks:July 2015 $115,000,0007% Convertible BondsLead Underwriters:June 2015 $89,700,000Common StockLead Underwriters:December 2012 $77,625,000Common StockLead Underwriters:June 2015 $48,587,500Common Stock Lead Underwriter:January 2014 $56,300,000Series A 7.375% Cumulative Preferred StockLead Underwriters:January 2015 $73,750,000Series A 7.375% Cumulative Preferred StockLead Underwriters:April 2017
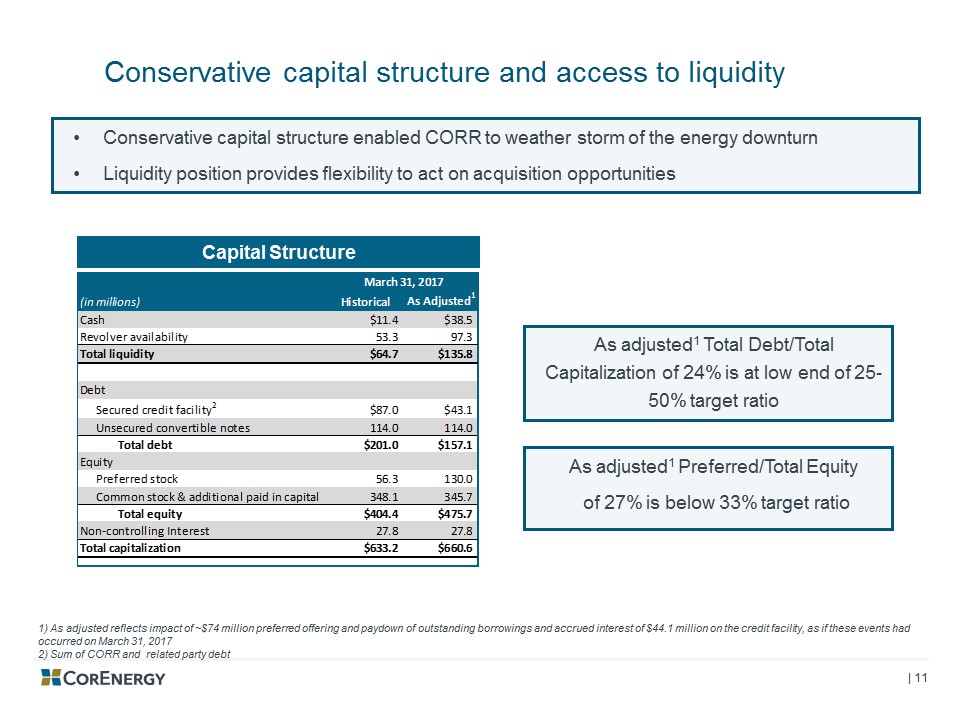
Conservative capital structure and access to liquidity Conservative capital structure enabled CORR to weather storm of the energy downturnLiquidity position provides flexibility to act on acquisition opportunities 1) As adjusted reflects impact of ~$74 million preferred offering and paydown of outstanding borrowings and accrued interest of $44.1 million on the credit facility, as if these events had occurred on March 31, 20172) Sum of CORR and related party debt As adjusted1 Total Debt/Total Capitalization of 24% is at low end of 25-50% target ratio As adjusted1 Preferred/Total Equity of 27% is below 33% target ratio Capital Structure
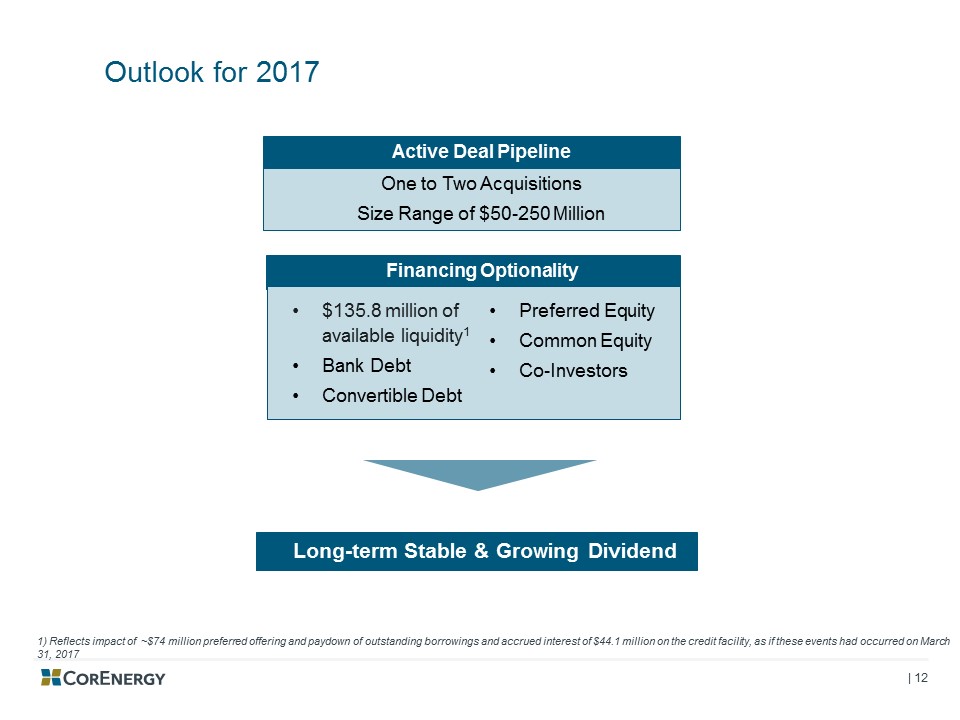
Financing Optionality Outlook for 2017 One to Two AcquisitionsSize Range of $50-250 Million Active Deal Pipeline 1) Reflects impact of ~$74 million preferred offering and paydown of outstanding borrowings and accrued interest of $44.1 million on the credit facility, as if these events had occurred on March 31, 2017 Long-term Stable & Growing Dividend $135.8 million of available liquidity1Bank DebtConvertible DebtPreferred EquityCommon EquityCo-Investors
APPENDIX

Becky SandringSenior Vice President, Secretary & TreasurerMs. Sandring has over 20 years of experience in the energy industry. Prior to CorEnergy, Ms. Sandring was a Vice President with The Calvin Group. From 1993-2008, Ms. Sandring held various roles at Aquila Inc., formerly UtiliCorp United. CorEnergy Senior Management Dave SchulteCo-Founder, CEO & PresidentMr. Schulte has 27 years of investment experience, including 18 years in the energy industry. Previously, Mr. Schulte was a co-founder and Managing Director of Tortoise Capital Advisors, an investment advisor with $16 billion under management. and a Managing Director at Kansas City Equity Partners (KCEP). Before joining KCEP, he spent five years as an investment banker at the predecessor of Oppenheimer & Co. Rick GreenCo-Founder, Executive ChairmanMr. Green has spent more than 30 years in the energy industry, with 20 years as CEO of Aquila, Inc., an international electric and gas utility business and national energy marketing and trading business. During his tenure, Mr. Green led the strategy and successful business expansion of Aquila, Inc. to a Fortune 30 company. Jeff FulmerSenior Vice PresidentMr. Fulmer is a petroleum engineer and professional geologist with more than 30 years of energy industry experience. Prior to joining CorEnergy, Mr. Fulmer spent six years as a Senior Advisor with Tortoise Capital Advisors, led a post 9/11 critical infrastructure team for the U.S. Department of Defense, and held leadership and technical positions with Statoil Energy, ARCO Oil and Tenneco Oil Exploration and Production. Rick KreulPresident, MoGas, LLC & MoWood, LLCMr. Kreul, a mechanical engineer with more than 35 years of energy industry experience, serves as President of CorEnergy’s wholly-owned subsidiaries, Mowood LLC and MoGas Pipeline LLC. Previously, Mr. Kreul served as Vice President of Energy Delivery for Aquila, Inc., Vice President for Inergy, L.P., and various engineering and management roles with Mobil Oil. Nate PoundstoneChief Accounting OfficerMr. Poundstone has 18 years of experience in the accounting profession. Prior to joining CorEnergy, Mr. Poundstone was Vice President and Chief Accounting officer with CVR Energy, a diversified holding company primarily engaged in the petroleum refining and nitrogen fertilizer manufacturing industries. Prior to CVR Energy, he held various audit and professional practice roles as a senior manager with KPMG LLP. Jeff TeevenVice President, FinanceMr. Teeven has more than 20 years of experience in private equity management and mergers and acquisitions in multiple sectors including energy. He served as a founding partner of Consumer Growth Partners, a private equity firm focused on the specialty retail and branded consumer products sectors, as well as 10 years with Kansas City Equity Partners (KCEP). Wesley BrownSenior Manager, Business DevelopmentMr. Brown oversees financial modeling and financial forecasting for potential acquisitions and assists with due diligence. Prior to CorEnergy, Mr. Brown worked for Regency Energy Partners; and Orix USA, a leveraged finance firm focused on lending to private-equity sponsored middle-market companies.
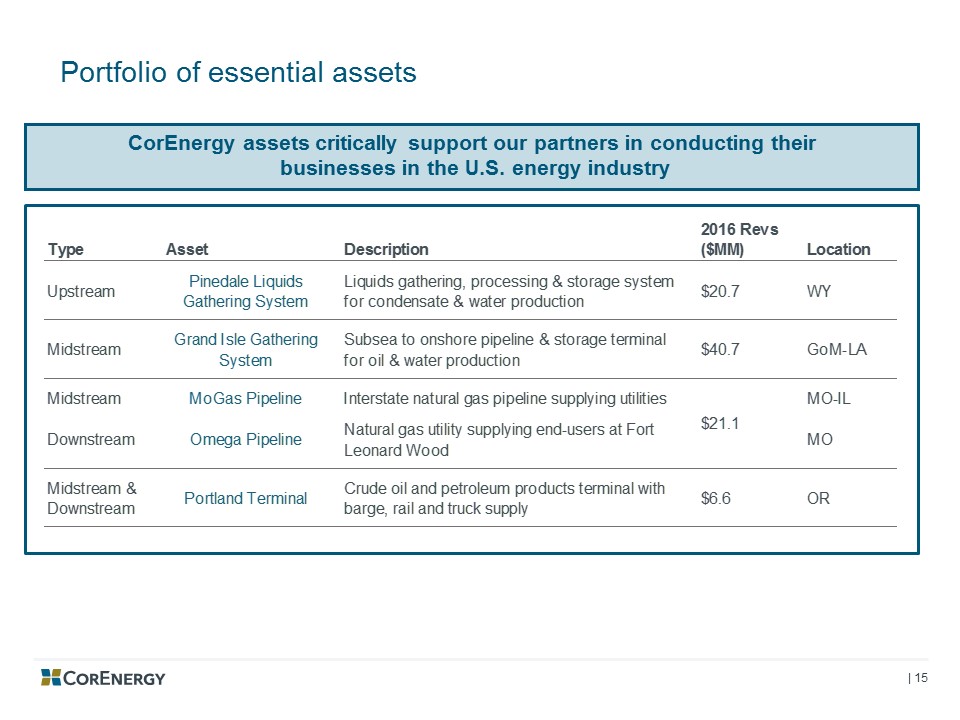
Portfolio of essential assets CorEnergy assets critically support our partners in conducting their businesses in the U.S. energy industry
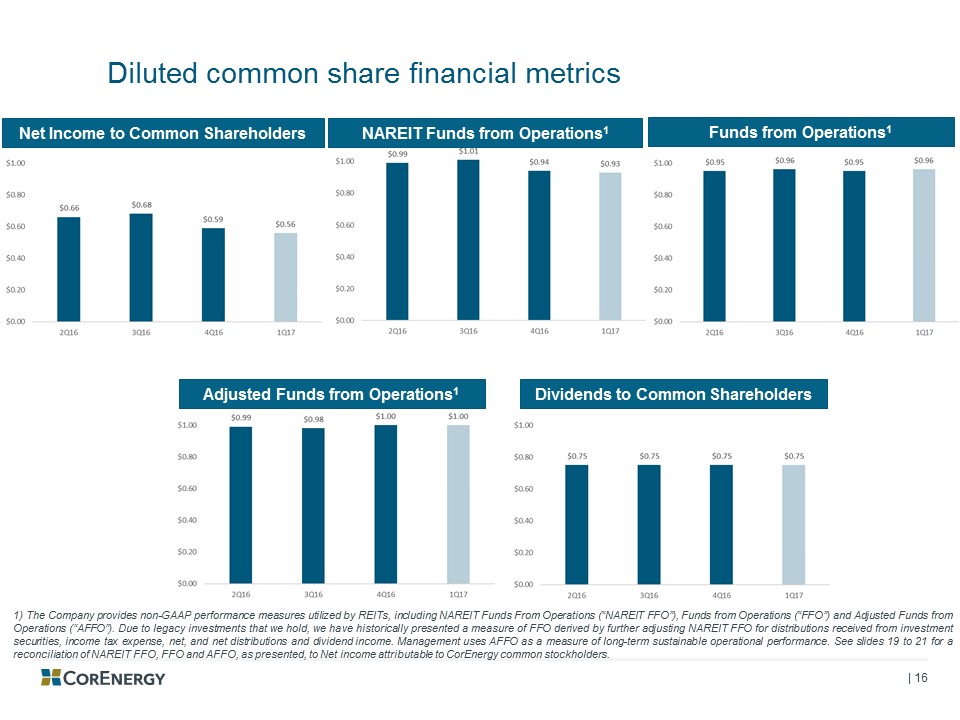
Diluted common share financial metrics 1) The Company provides non-GAAP performance measures utilized by REITs, including NAREIT Funds From Operations (“NAREIT FFO”), Funds from Operations (“FFO”) and Adjusted Funds from Operations (“AFFO”). Due to legacy investments that we hold, we have historically presented a measure of FFO derived by further adjusting NAREIT FFO for distributions received from investment securities, income tax expense, net, and net distributions and dividend income. Management uses AFFO as a measure of long-term sustainable operational performance. See slides 19 to 21 for a reconciliation of NAREIT FFO, FFO and AFFO, as presented, to Net income attributable to CorEnergy common stockholders. NAREIT Funds from Operations1 Funds from Operations1 Net Income to Common Shareholders Adjusted Funds from Operations1 Dividends to Common Shareholders
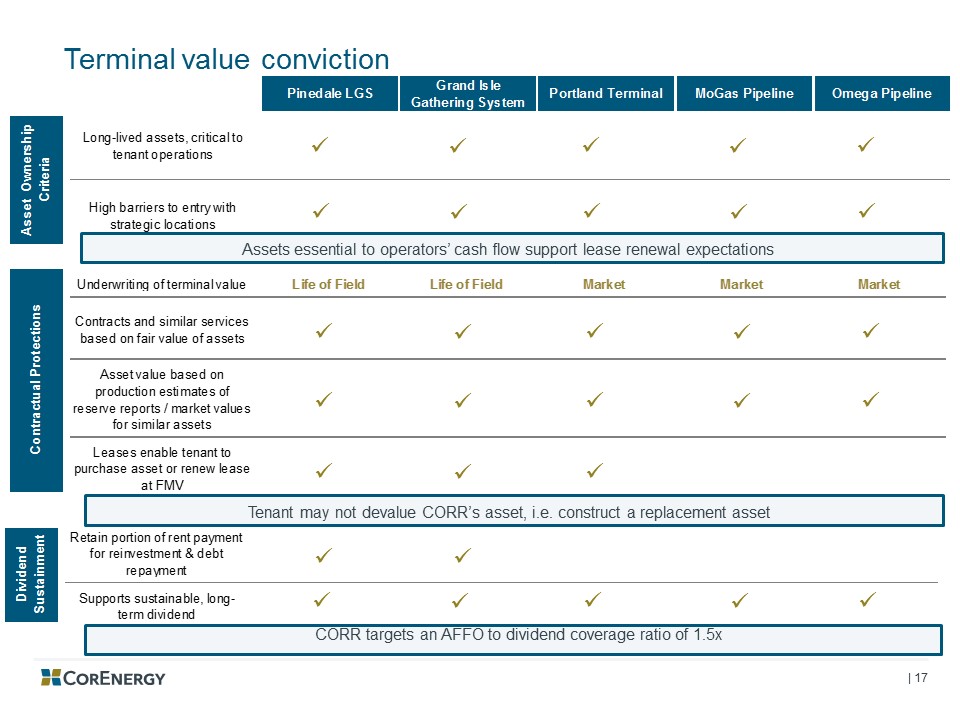
Terminal value conviction Assets essential to operators’ cash flow support lease renewal expectations Tenant may not devalue CORR’s asset, i.e. construct a replacement asset CORR targets an AFFO to dividend coverage ratio of 1.5x
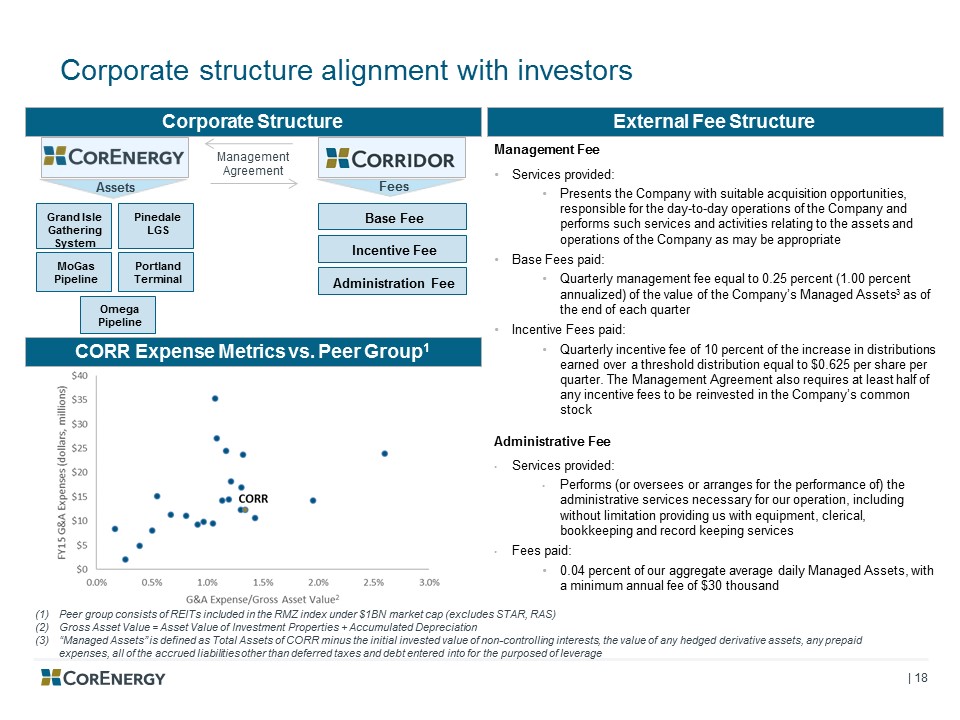
Corporate structure alignment with investors CORR Expense Metrics vs. Peer Group1 Base Fee Incentive Fee Administration Fee Grand Isle Gathering System PinedaleLGS MoGasPipeline PortlandTerminal OmegaPipeline Assets Fees Management FeeServices provided:Presents the Company with suitable acquisition opportunities, responsible for the day-to-day operations of the Company and performs such services and activities relating to the assets and operations of the Company as may be appropriateBase Fees paid: Quarterly management fee equal to 0.25 percent (1.00 percent annualized) of the value of the Company’s Managed Assets3 as of the end of each quarterIncentive Fees paid: Quarterly incentive fee of 10 percent of the increase in distributions earned over a threshold distribution equal to $0.625 per share per quarter. The Management Agreement also requires at least half of any incentive fees to be reinvested in the Company’s common stockAdministrative FeeServices provided:Performs (or oversees or arranges for the performance of) the administrative services necessary for our operation, including without limitation providing us with equipment, clerical, bookkeeping and record keeping servicesFees paid: 0.04 percent of our aggregate average daily Managed Assets, with a minimum annual fee of $30 thousand External Fee Structure Corporate Structure Peer group consists of REITs included in the RMZ index under $1BN market cap (excludes STAR, RAS)Gross Asset Value = Asset Value of Investment Properties + Accumulated Depreciation“Managed Assets” is defined as Total Assets of CORR minus the initial invested value of non-controlling interests, the value of any hedged derivative assets, any prepaid expenses, all of the accrued liabilities other than deferred taxes and debt entered into for the purposed of leverage Management Agreement
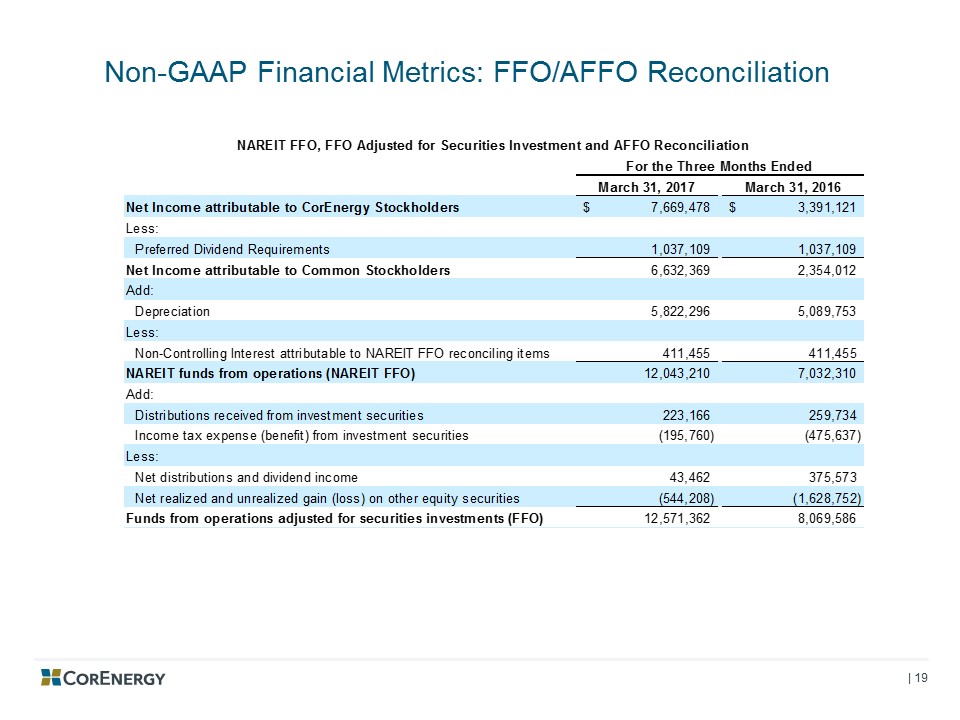
Non-GAAP Financial Metrics: FFO/AFFO Reconciliation
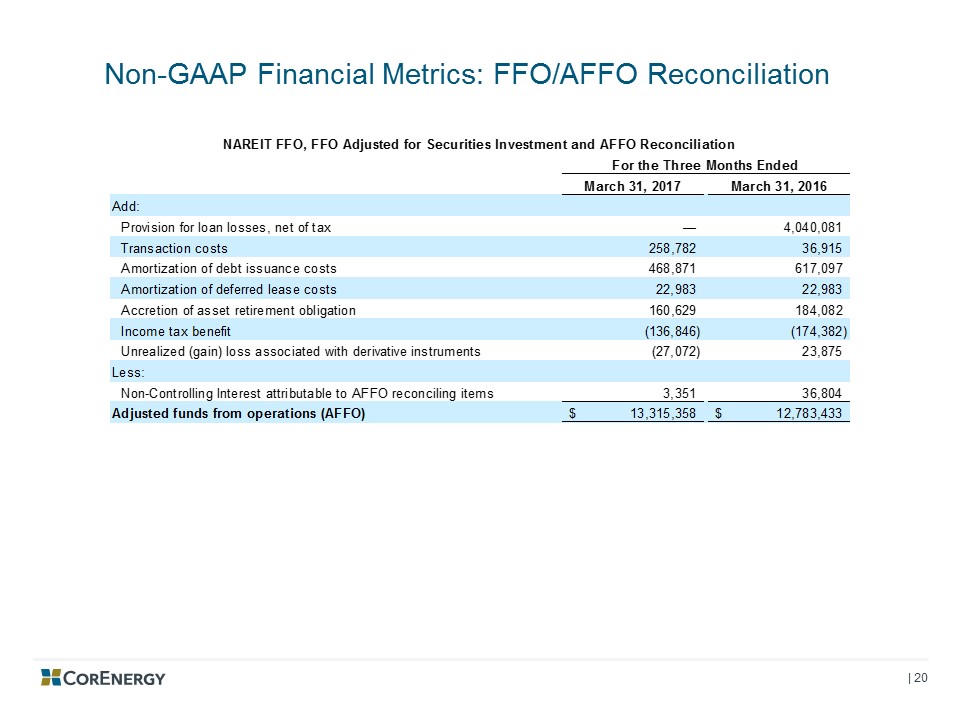
Non-GAAP Financial Metrics: FFO/AFFO Reconciliation
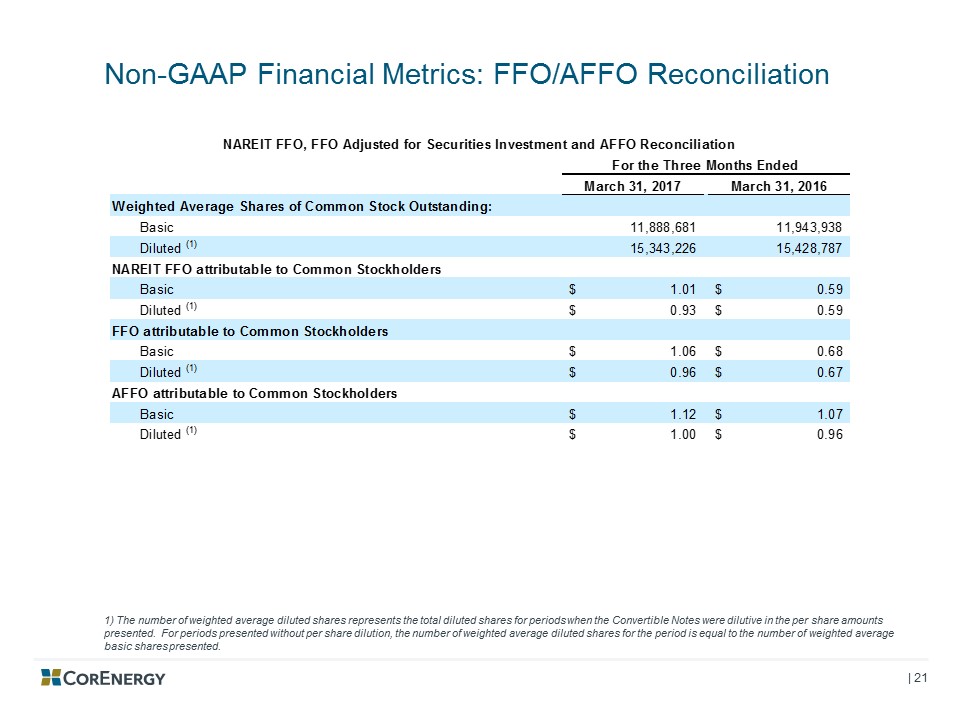
Non-GAAP Financial Metrics: FFO/AFFO Reconciliation 1) The number of weighted average diluted shares represents the total diluted shares for periods when the Convertible Notes were dilutive in the per share amounts presented. For periods presented without per share dilution, the number of weighted average diluted shares for the period is equal to the number of weighted average basic shares presented.
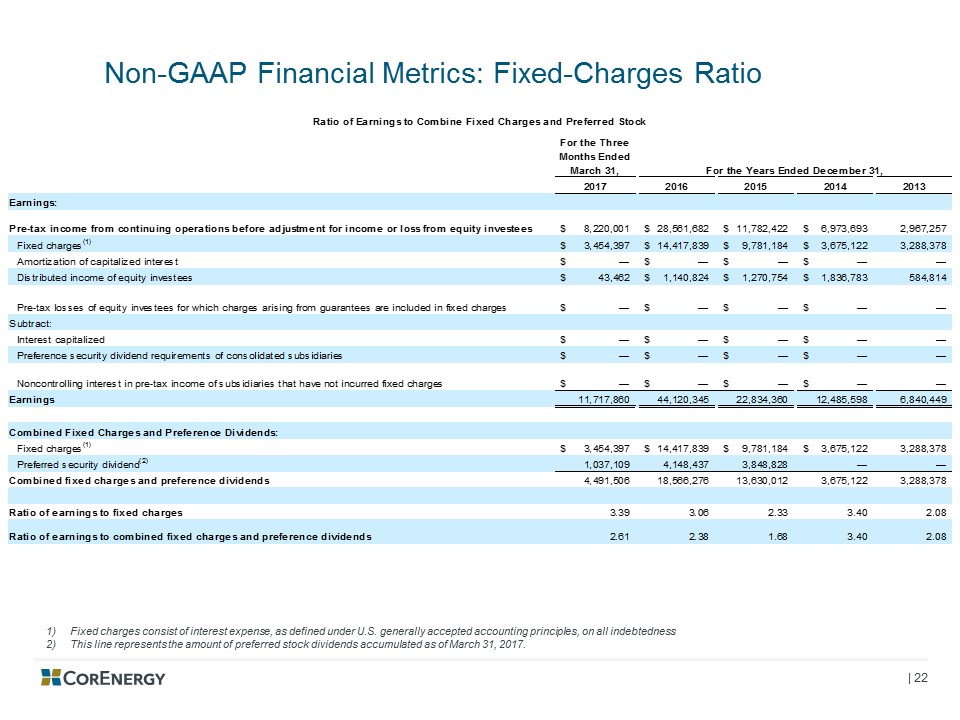
Non-GAAP Financial Metrics: Fixed-Charges Ratio Fixed charges consist of interest expense, as defined under U.S. generally accepted accounting principles, on all indebtednessThis line represents the amount of preferred stock dividends accumulated as of March 31, 2017.