Attached files
| file | filename |
|---|---|
| 8-K - FORM 8-K - Jernigan Capital, Inc. | v468340_8k.htm |
1 Investor Presentation June 2017 Exhibit 99.1
2 Safe Harbor Disclosure Regarding Forward - Looking Statements This presentation includes "forward - looking statements" within the meaning of Section 27A of the Securities Act of 1933 and Section 21E of the Securities Exchange Act of 1934 and other federal securities laws, including statements regarding our futu re performance, future book value, rates of return, ability to obtain future financing, including debt financing, exit capitaliz ati on rates, our use of capital, the timing of our investment cycle, the expected timing of certificates of occupancy, future profits from investments, our future stock price, our dividends to our common stockholders and the holders of our Series A Preferred Stock , o ur loan pipeline, our anticipated loan closings and future funding of existing loan commitments. The ultimate occurrence of even ts and results referenced in these forward - looking statements is subject to known and unknown risks and uncertainties, many of which are beyond our control. Such risks include our ability to obtain additional liquidity to fund our loan pipeline, our ab ili ty to make distributions at expected levels, the potential impact of interest rate fluctuations, the uncertainty as to the value of ou r investments, the lack of liquidity in our investments and whether we can realize expected gains from our equity participation interests. These forward - looking statements are based upon our present intentions and expectations, but the events and results referenced in these statements are not guaranteed to occur. Investors should not place undue reliance upon forward - looking statements. There can be no assurance that our expectations of the future performance of our investments will be achieved. Th is information provided herein is as of this date and we undertake no duty to update any forward - looking statements contained herei n. For a discussion of these and other risks facing our business, see the information under the heading “Risk Factors” in our Annual Report on Form 10 - K for the year ended December 31, 2016 and in other filings we make with the Securities and Exchange Commission (“SEC”) from time to time, which are accessible on the SEC’s website at www.sec.gov . This presentation contains statistics and other data that has been obtained from or compiled from information made available by third parties. We have not independently verified such statistics or data. Contact: Jernigan Capital, Inc. Investor Relations (901) 567 - 9580 investorrelations@jernigancapital.com
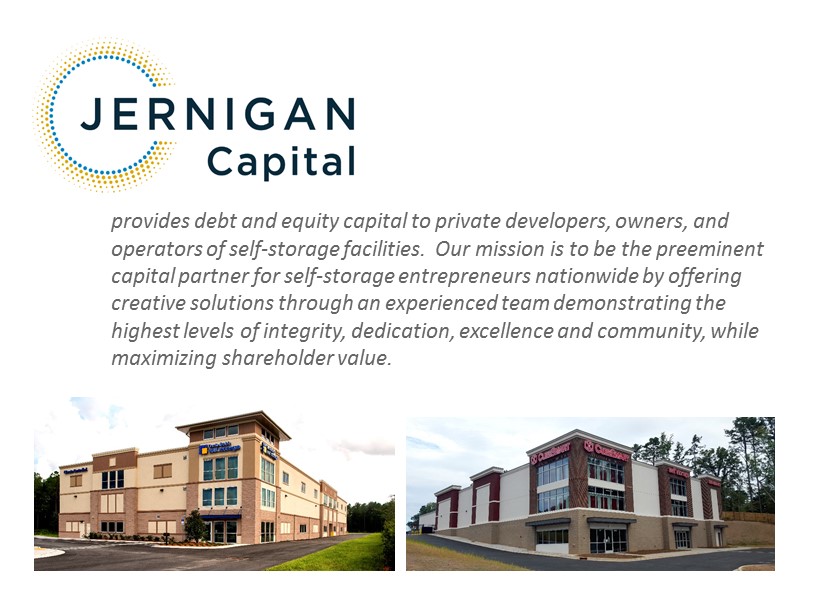
3 March 2017 provides debt and equity capital to private developers, owners, and operators of self - storage facilities. Our mission is to be the preeminent capital partner for self - storage entrepreneurs nationwide by offering creative solutions through an experienced team demonstrating the highest levels of integrity, dedication, excellence and community, while maximizing shareholder value.
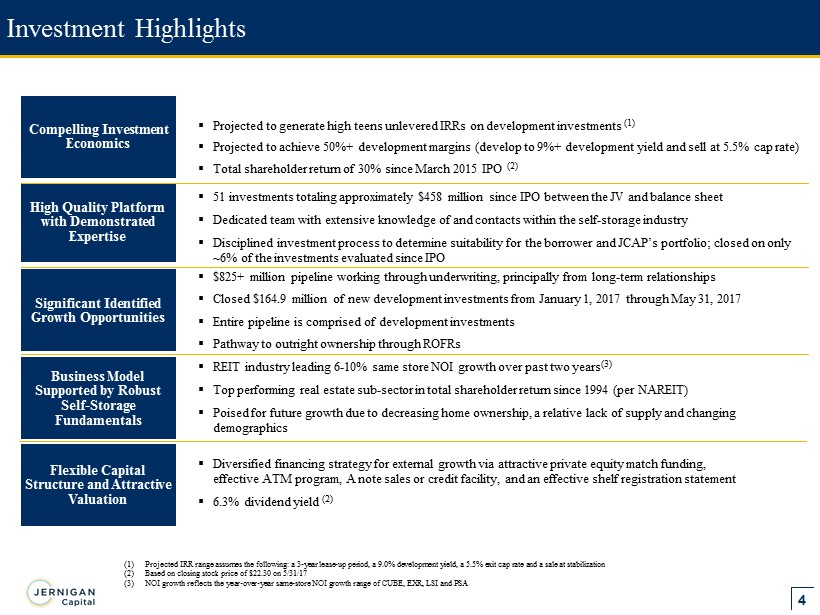
4 ▪ $825+ million pipeline working through underwriting, principally from long - term relationships ▪ Closed $164.9 million of new development investments f rom January 1, 2017 through May 31, 2017 ▪ Entire pipeline is comprised of development investments ▪ Pathway to outright ownership through ROFRs Significant Identified Growth Opportunities Investment Highlights Business Model Supported by Robust Self - Storage Fundamentals ▪ REIT industry leading 6 - 10% same store NOI growth over past two years (3) ▪ Top performing real estate sub - sector in total shareholder return since 1994 (per NAREIT) ▪ Poised for future growth due to decreasing home ownership, a relative lack of supply and changing demographics Compelling Investment Economics ▪ Projected to generate high teens unlevered IRRs on development investments (1) ▪ Projected to achieve 50%+ development margins (develop to 9%+ development yield and sell at 5.5% cap rate) ▪ Total shareholder return of 30% since March 2015 IPO (2) Flexible Capital Structure and Attractive Valuation ▪ Diversified financing strategy for external growth via attractive private equity match funding, effective ATM program, A note sales or credit facility, and an effective shelf registration statement ▪ 6.3% dividend yield (2) (1) Projected IRR range assumes the following: a 3 - year lease - up period, a 9.0% development yield, a 5.5% exit cap rate and a sale a t stabilization (2) Based on closing stock price of $ 22.30 on 5/31/17 (3) NOI growth reflects the year - over - year same - store NOI growth range of CUBE, EXR, LSI and PSA High Quality Platform with Demonstrated Expertise ▪ 51 investments totaling approximately $ 458 million since IPO between the JV and balance sheet ▪ Dedicated team with extensive knowledge of and contacts within the self - storage industry ▪ Disciplined investment process to determine suitability for the borrower and JCAP’s portfolio; closed on only ~6% of the investments evaluated since IPO
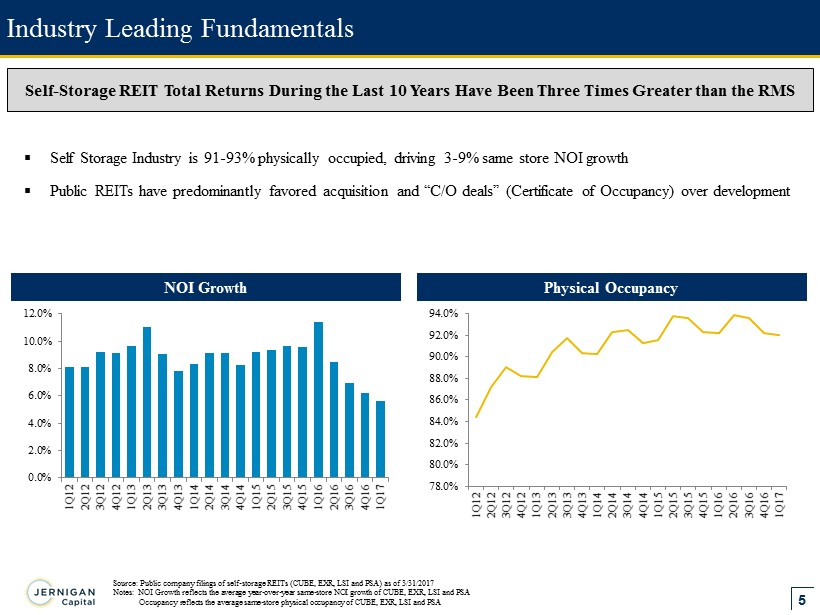
5 78.0% 80.0% 82.0% 84.0% 86.0% 88.0% 90.0% 92.0% 94.0% 1Q12 2Q12 3Q12 4Q12 1Q13 2Q13 3Q13 4Q13 1Q14 2Q14 3Q14 4Q14 1Q15 2Q15 3Q15 4Q15 1Q16 2Q16 3Q16 4Q16 1Q17 0.0% 2.0% 4.0% 6.0% 8.0% 10.0% 12.0% 1Q12 2Q12 3Q12 4Q12 1Q13 2Q13 3Q13 4Q13 1Q14 2Q14 3Q14 4Q14 1Q15 2Q15 3Q15 4Q15 1Q16 2Q16 3Q16 4Q16 1Q17 Self - Storage REIT Total Returns During the Last 10 Years Have Been Three Times Greater than the RMS Industry Leading Fundamentals NOI Growth Physical Occupancy ▪ Self Storage Industry is 91 - 93% physically occupied, driving 3 - 9% same store NOI growth ▪ Public REITs have predominantly favored acquisition and “C/O deals” (Certificate of Occupancy) over development Source: Public company filings of self - storage REITs (CUBE, EXR, LSI and PSA) as of 3/31/2017 Notes: NOI Growth reflects the average year - over - year same - store NOI growth of CUBE, EXR, LSI and PSA Occupancy reflects the average same - store physical occupancy of CUBE, EXR, LSI and PSA
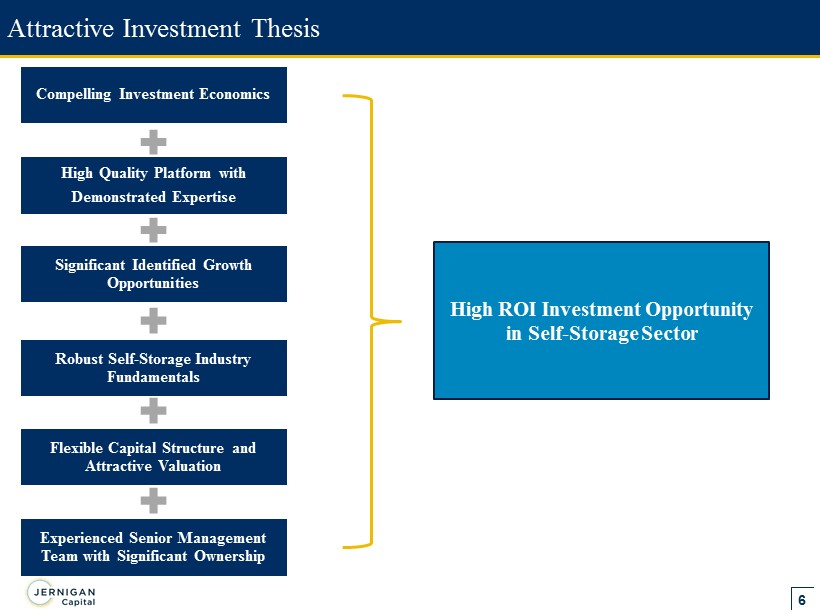
6 Experienced Senior Management Team with Significant Ownership Significant Identified Growth Opportunities Robust Self - Storage Industry Fundamentals Compelling Investment Economics Flexible Capital Structure and Attractive Valuation High Quality Platform with Demonstrated Expertise Attractive Investment Thesis High ROI Investment Opportunity in Self - Storage Sector
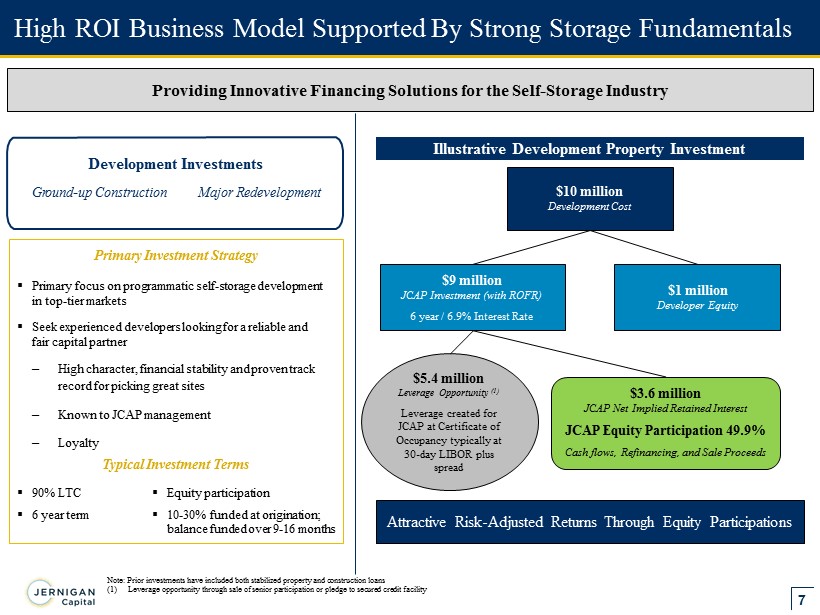
7 ▪ Primary focus on programmatic self - storage development in top - tier markets ▪ Seek experienced developers looking for a reliable and fair capital partner – High character, financial stability and proven track record for picking great sites – Known to JCAP management – Loyalty High ROI Business Model Supported By Strong Storage Fundamentals Providing Innovative Financing Solutions for the Self - Storage Industry Illustrative Development Property Investment Deve l op m ent Investments G r ound - up C onstruction Major R e d eve lopm e nt Attractive Risk - Adjusted Returns Through Equity Participations Note: Prior investments have included both stabilized property and construction loans (1) Leverage opportunity through sale of senior participation or pledge to secured credit facility $10 million Development Cost $9 million JCAP Investment (with ROFR) 6 year / 6.9% Interest Rate $1 million Developer Equity $ 5.4 million Leverage Opportunity (1) Leverage created for JCAP at Certificate of Occupancy typically at 30 - day LIBOR plus spread $ 3.6 million JCAP Net Implied Retained Interest JCAP Equity Participation 49.9% Cash flows, Refinancing, and Sale Proceeds ▪ 90% LTC ▪ 6 year term ▪ Equity participation ▪ 10 - 30% fund e d a t o r i g ination; b a l a n c e funded ov e r 9 - 16 months Primary Investment Strategy Typical Investment Terms
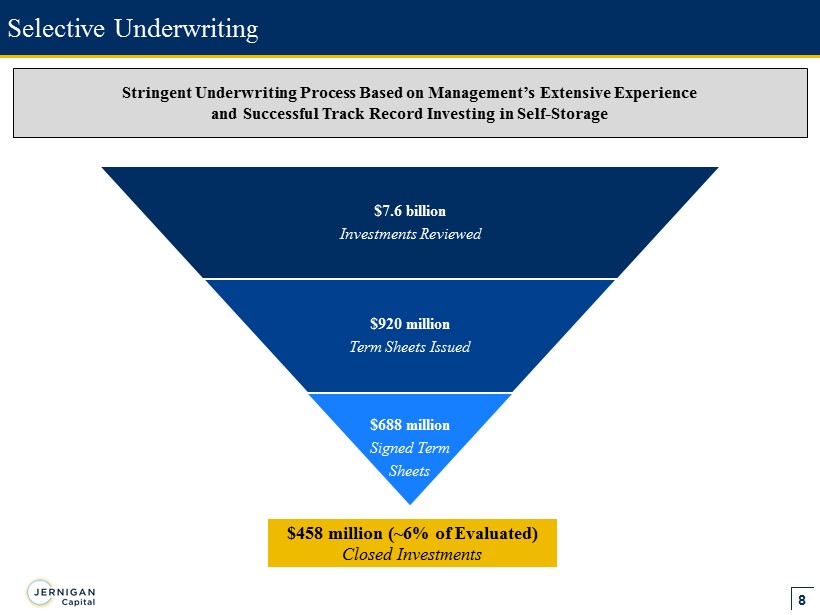
8 Selective Underwriting $7.6 billion Investments Reviewed $920 million Term Sheets Issued $688 million Signed Term Sheets $ 458 million (~6% of Evaluated) Closed Investments Stringent Underwriting Process Based on Management’s Extensive Experience and Successful Track Record Investing in Self - Storage
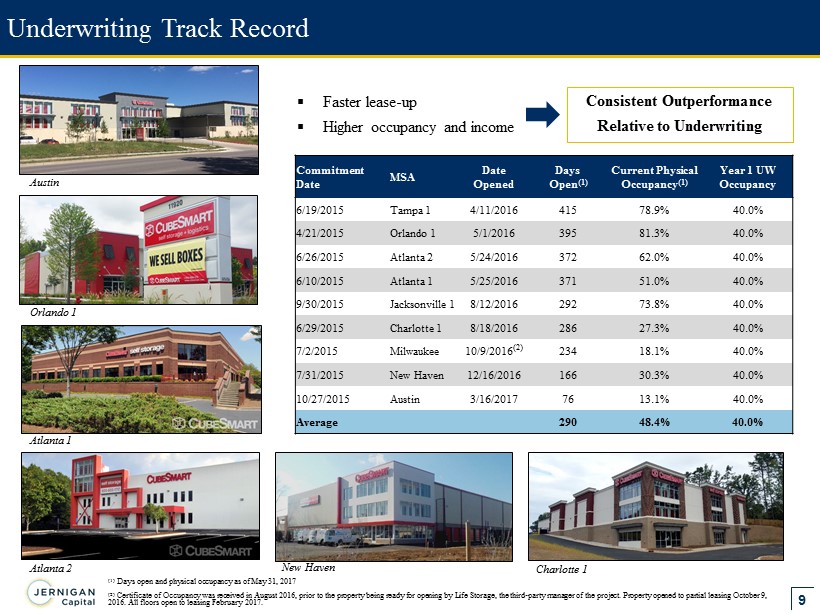
9 Underwriting Track Record Austin Orlando 1 Atlanta 1 Atlanta 2 ▪ Faster lease - up ▪ Higher occupancy and income Consistent Outperformance Relative to Underwriting Commitment Date MSA Date Opened Days Open (1) Current Physical Occupancy (1) Year 1 UW Occupancy 6/19/2015 Tampa 1 4/11/2016 415 78.9% 40.0% 4/21/2015 Orlando 1 5/1/2016 395 81.3% 40.0% 6/26/2015 Atlanta 2 5/24/2016 372 62.0% 40.0% 6/10/2015 Atlanta 1 5/25/2016 371 51.0% 40.0% 9/30/2015 Jacksonville 1 8/12/2016 292 73.8% 40.0% 6/29/2015 Charlotte 1 8/18/2016 286 27.3% 40.0% 7/2/2015 Milwaukee 10/9/2016 (2) 234 18.1% 40.0% 7/31/2015 New Haven 12/16/2016 166 30.3% 40.0% 10/27/2015 Austin 3/16/2017 76 13.1% 40.0% Average 290 48.4% 40.0% New Haven (1) Days open and physical occupancy as of May 31, 2017 (2) Certificate of Occupancy was received in August 2016, prior to the property being ready for opening by Life Storage, the thir d - p arty manager of the project. Property opened to partial leasing October 9, 2016. All floors open to leasing February 2017. Charlotte 1
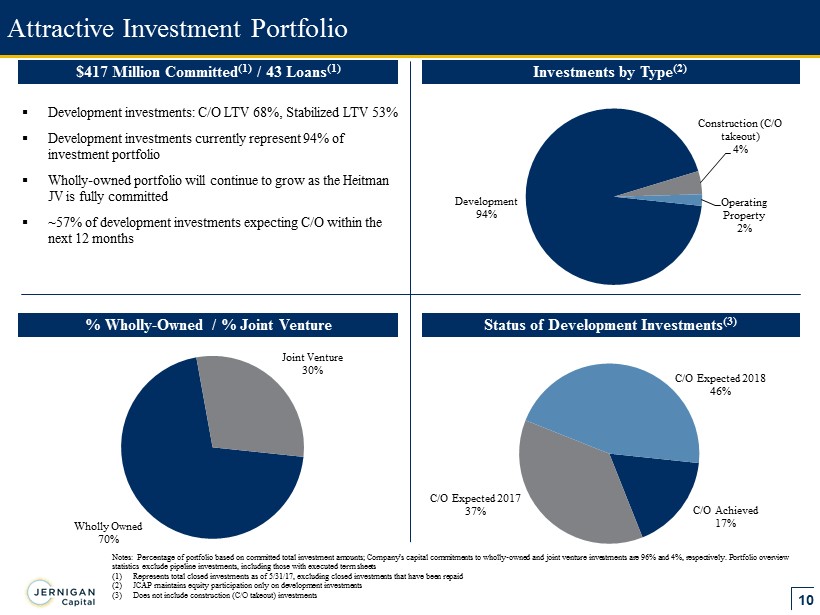
10 Attractive Investment Portfolio % Wholly - Owned / % Joint Venture Status of Development Investments (3) ▪ Development investments: C/O LTV 68%, Stabilized LTV 53% ▪ Development investments currently represent 94% of investment portfolio ▪ Wholly - owned portfolio will continue to grow as the Heitman JV is fully committed ▪ ~57% of development investments expecting C/O within the next 12 months Notes: Percentage of portfolio based on committed total investment amounts; Company’s capital commitments to wholly - owned and j oint venture investments are 96% and 4%, respectively. Portfolio overview statistics exclude pipeline investments, including those with executed term sheets (1) Represents total closed investments as of 5/31/17, excluding closed investments that have been repaid (2) JCAP maintains equity participation only on development investments (3) Does not include construction (C/O takeout) investments Wholly Owned 70% Joint Venture 30% C/O Achieved 17% C/O Expected 2017 37% C/O Expected 2018 46% Development 94% Construction (C/O takeout) 4% Operating Property 2% $417 Million Committed (1) / 43 Loans (1) Investments by Type (2)
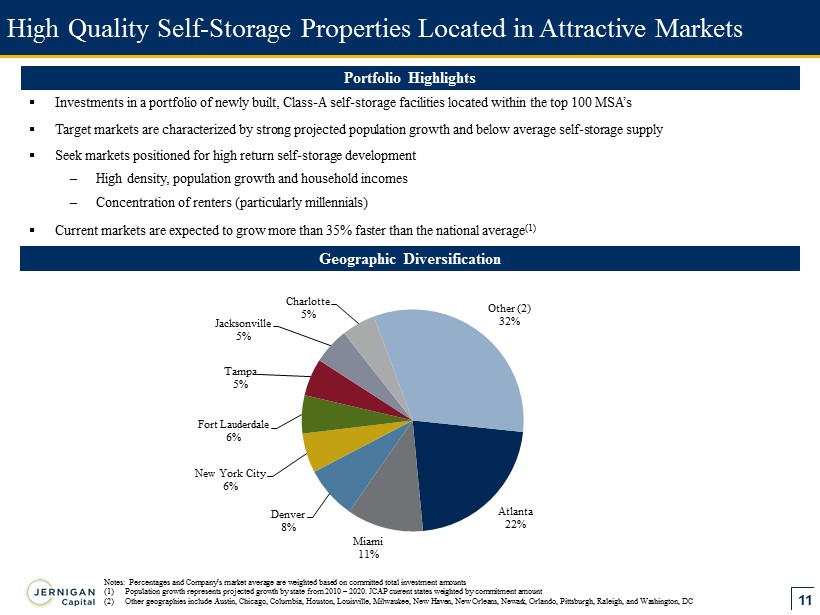
11 High Quality Self - Storage Properties Located in Attractive Markets Geographic Diversification Notes: Percentages and Company’s market average are weighted based on committed total investment amounts (1) Population growth represents projected growth by state from 2010 – 2020. JCAP current states weighted by commitment amount (2) Other geographies include Austin, Chicago, Columbia, Houston, Louisville, Milwaukee, New Haven, New Orleans, Newark, Orlando, Pittsburgh, Raleigh, and Washington, DC ▪ Investments in a portfolio of newly built, Class - A self - storage facilities located within the top 100 MSA’s ▪ Target markets are characterized by strong projected population growth and below average self - storage supply ▪ Seek markets positioned for high return self - storage development – High density, population growth and household incomes – Concentration of renters (particularly millennials) ▪ Current markets are expected to grow more than 35% faster than the national average (1) Portfolio Highlights Atlanta 22% Miami 11% Denver 8% New York City 6% Fort Lauderdale 6% Tampa 5% Jacksonville 5% Charlotte 5% Other (2) 32%
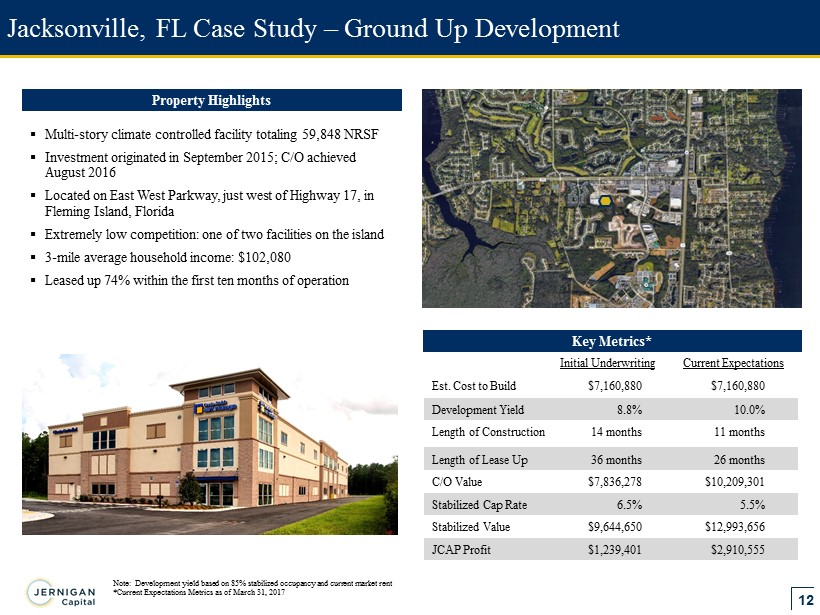
12 Jacksonville, FL Case Study – Ground Up Development Initial Underwriting Current Expectations Est. Cost to Build $7,160,880 $7,160,880 Development Yield 8.8% 10.0% Length of Construction 14 months 11 months Length of Lease Up 36 months 26 months C/O Value $7,836,278 $10,209,301 Stabilized Cap Rate 6.5% 5.5% Stabilized Value $9,644,650 $12,993,656 JCAP Profit $1,239,401 $2,910,555 Key Metrics* Property Highlights ▪ Multi - story climate controlled facility totaling 59,848 NRSF ▪ Investment originated in September 2015; C/O achieved August 2016 ▪ Located on East West Parkway, just west of Highway 17, in Fleming Island, Florida ▪ Extremely low competition: one of two facilities on the island ▪ 3 - mile average household income: $102,080 ▪ Leased up 74% within the first ten months of operation Note: Development yield based on 85% stabilized occupancy and current market rent *Current Expectations Metrics as of March 31, 2017
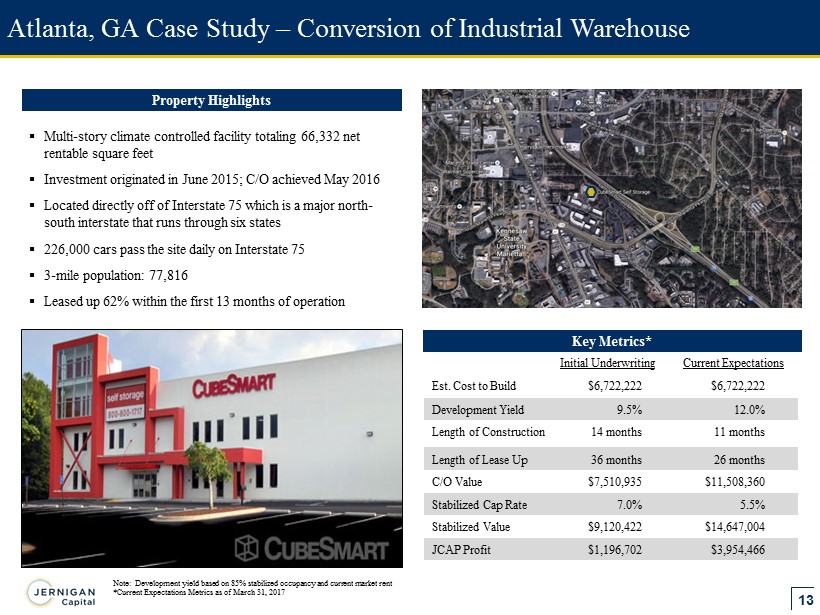
13 ▪ Multi - story climate controlled facility totaling 66,332 net rentable square feet ▪ Investment originated in June 2015; C/O achieved May 2016 ▪ Located directly off of Interstate 75 which is a major north - south interstate that runs through six states ▪ 226,000 cars pass the site daily on Interstate 75 ▪ 3 - mile population: 77,816 ▪ Leased up 62% within the first 13 months of operation Atlanta, GA Case Study – Conversion of Industrial Warehouse Key Metrics* Property Highlights Initial Underwriting Current Expectations Est. Cost to Build $6,722,222 $6,722,222 Development Yield 9.5% 12.0% Length of Construction 14 months 11 months Length of Lease Up 36 months 26 months C/O Value $7,510,935 $11,508,360 Stabilized Cap Rate 7.0% 5.5% Stabilized Value $9,120,422 $14,647,004 JCAP Profit $1,196,702 $3,954,466 Note: Development yield based on 85% stabilized occupancy and current market rent *Current Expectations Metrics as of March 31, 2017
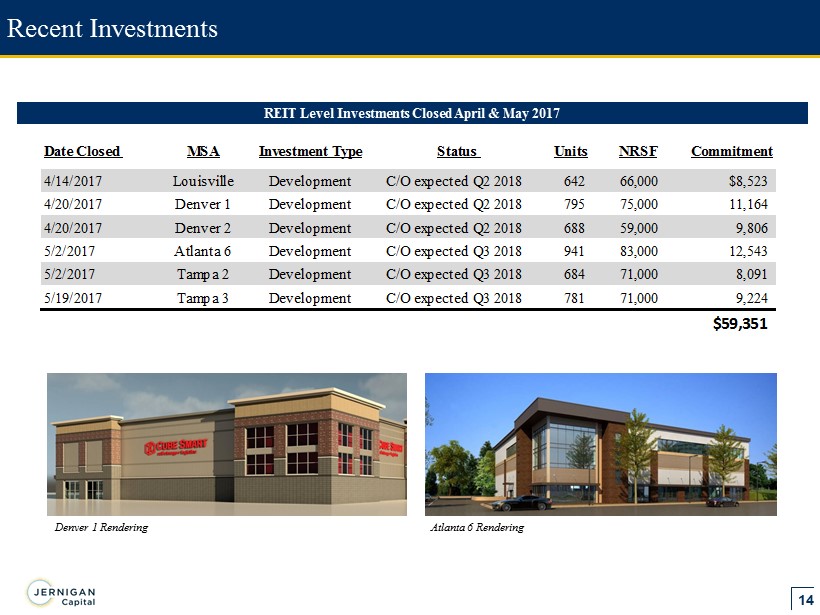
14 Recent Investments REIT Level Investments Closed April & May 2017 Atlanta 6 Rendering Denver 1 Rendering Date Closed MSA Investment Type Units NRSF Commitment 4/14/2017 Louisville Development C/O expected Q2 2018 642 66,000 $8,523 4/20/2017 Denver 1 Development C/O expected Q2 2018 795 75,000 11,164 4/20/2017 Denver 2 Development C/O expected Q2 2018 688 59,000 9,806 5/2/2017 Atlanta 6 Development C/O expected Q3 2018 941 83,000 12,543 5/2/2017 Tampa 2 Development C/O expected Q3 2018 684 71,000 8,091 5/19/2017 Tampa 3 Development C/O expected Q3 2018 781 71,000 9,224 $59,351 Status
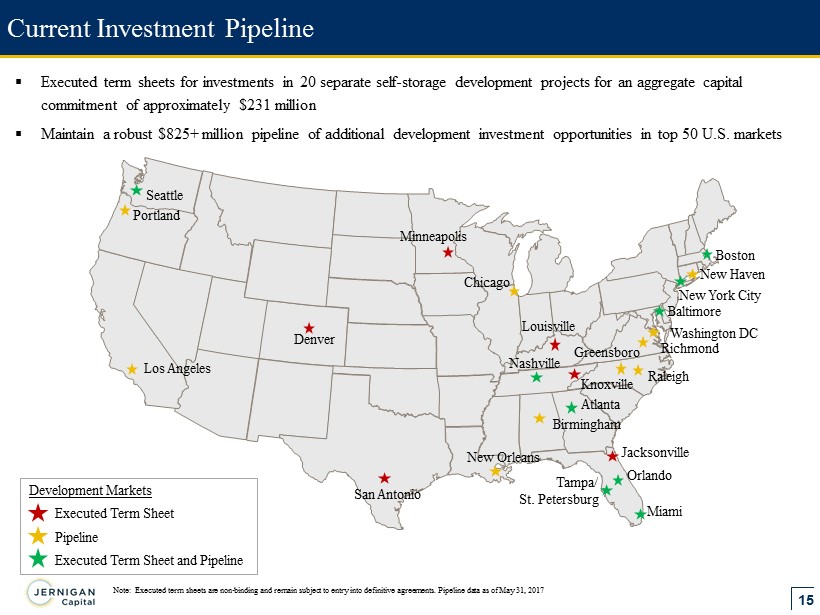
15 ▪ Executed term sheets for investments in 20 separate self - storage development projects for an aggregate capital commitment of approximately $231 million ▪ Maintain a robust $825+ million pipeline of additional development investment opportunities in top 50 U.S. markets Current Investment Pipeline Note: Executed term sheets are non - binding and remain subject to entry into definitive agreements. Pipeline data as of May 31, 2017 Atlanta Denver Jacksonville Boston Louisville Miami Nashville New Orleans New York City Orlando Seattle Baltimore San Antonio Los Angeles Richmond Tampa/ St. Petersburg Development Markets Executed Term Sheet Pipeline Executed Term Sheet and Pipeline Chicago Greensboro New Haven Washington DC Birmingham Knoxville Minneapolis Portland Raleigh
16 Recent Financial Highlights ▪ Reported Q1 2017 EPS of $0.14 per share and reaffirmed full year 2017 EPS guidance between $1.62 per share and $2.02 per share ▪ Reported Q1 2017 Adjusted EPS of $0.21 per share and reaffirmed full year 2017 Adjusted EPS guidance between $1.80 per share and $2.30 per share ▪ Launched $50.0 million ATM program on April 5, 2017 and subsequently has sold 1,051,402 shares of common stock at a weighted average price of $22.71 per share through May 31, 2017 ▪ Reported 2016 Adjusted EPS of $3.11 ~ Increase of $3.51 per common share over 2015 ▪ Closed on $ 164.9 million of new development investments comprising eight projects between January 1, 2017 and May 31, 2017 ▪ Established relationships with six new development partners thus far in 2017, bringing total development partner relationships to 23 ▪ Projected advances on the investment portfolio of $145 million to $160 million in 2017 ▪ Projected closings of $350 million to $375 million of new development property investments with a profits interest in 2017
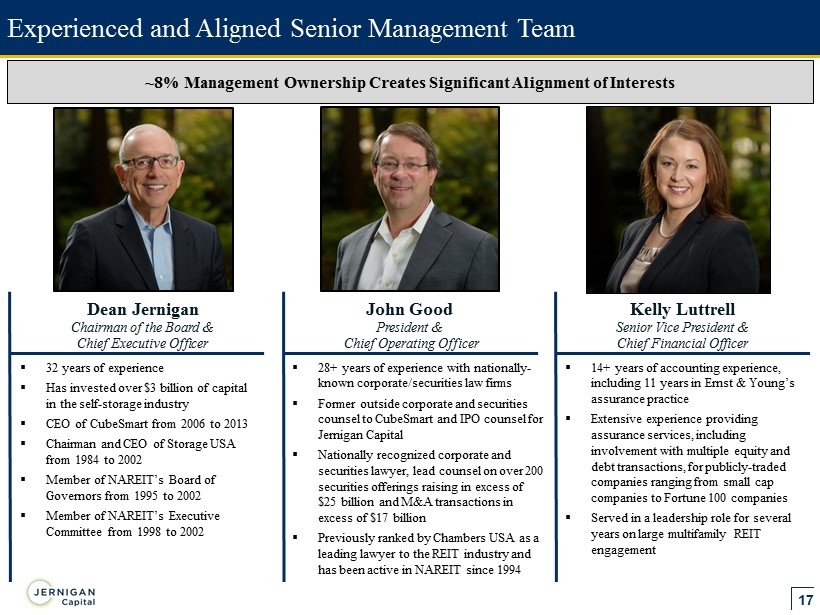
17 Experienced and Aligned Senior Management Team ~8% Management Ownership Creates Significant Alignment of Interests Dean Jernigan Chairman of the Board & Chief Executive Officer John Good President & Chief Operating Officer Kelly Luttrell Senior Vice President & Chief Financial Officer ▪ 32 years of experience ▪ Has invested over $3 billion of capital in the self - storage industry ▪ CEO of CubeSmart from 2006 to 2013 ▪ Chairman and CEO of Storage USA from 1984 to 2002 ▪ Member of NAREIT’s Board of Governors from 1995 to 2002 ▪ Member of NAREIT’s Executive Committee from 1998 to 2002 ▪ 28+ years of experience with nationally - known corporate/securities law firms ▪ Former outside corporate and securities counsel to CubeSmart and IPO counsel for Jernigan Capital ▪ Nationally recognized corporate and securities lawyer, lead counsel on over 200 securities offerings raising in excess of $25 billion and M&A transactions in excess of $17 billion ▪ Previously ranked by Chambers USA as a leading lawyer to the REIT industry and has been active in NAREIT since 1994 ▪ 14+ years of accounting experience, including 11 years in Ernst & Young’s assurance practice ▪ Extensive experience providing assurance services, including involvement with multiple equity and debt transactions, for publicly - traded companies ranging from small cap companies to Fortune 100 companies ▪ Served in a leadership role for several years on large multifamily REIT engagement
18 Significant Identified Growth Opportunities Investment Highlights Business Model Supported by Robust Self - Storage Fundamentals Compelling Investment Economics Flexible Capital Structure and Attractive Valuation High Quality Platform with Demonstrated Expertise
19 Appendix
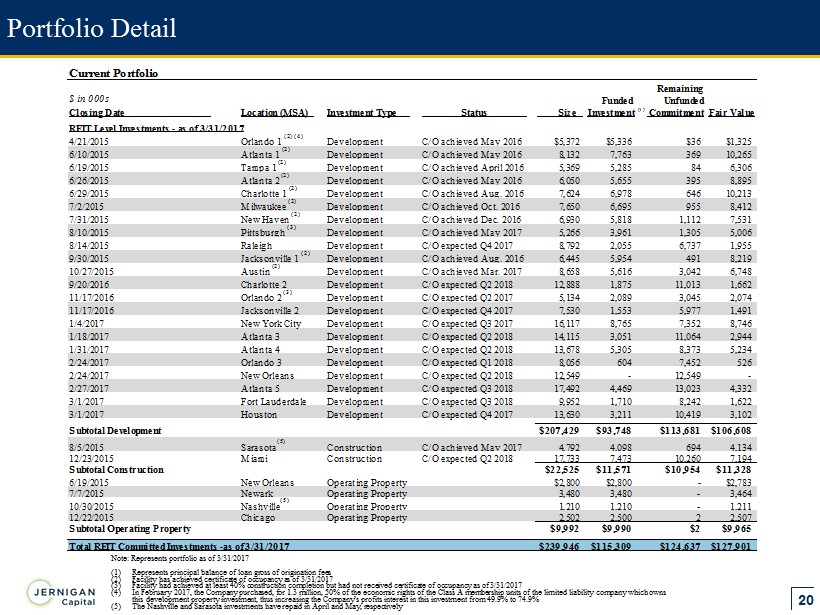
20 Portfolio Detail Note: Represents portfolio as of 3/31/2017 (1) Represents principal balance of loan gross of origination fees (2) Facility has achieved certificate of occupancy as of 3/31/2017 (3) Facility had achieved at least 40% construction completion but had not received certificate of occupancy as of 3/31/2017 (4) In February 2017, the Company purchased, for 1.3 million, 50% of the economic rights of the Class A membership units of the l imi ted liability company which owns this development property investment, thus increasing the Company’s profits interest in this investment from 49.9% to 74.9% (5) The Nashville and Sarasota investments have repaid in April and May, respectively (1) Current Portfolio Remaining $ in 000s Funded Unfunded Closing Date Location (MSA) Investment Type Status Size Investment (1) Commitment Fair Value REIT Level Investments - as of 3/31/2017 4/21/2015 Orlando 1 (2) (4) Development C/O achieved May 2016 $5,372 $5,336 $36 $1,325 6/10/2015 Atlanta 1 (2) Development C/O achieved May 2016 8,132 7,763 369 10,265 6/19/2015 Tampa 1 (2) Development C/O achieved April 2016 5,369 5,285 84 6,306 6/26/2015 Atlanta 2 (2) Development C/O achieved May 2016 6,050 5,655 395 8,895 6/29/2015 Charlotte 1 (2) Development C/O achieved Aug. 2016 7,624 6,978 646 10,213 7/2/2015 Milwaukee (2) Development C/O achieved Oct. 2016 7,650 6,695 955 8,412 7/31/2015 New Haven (2) Development C/O achieved Dec. 2016 6,930 5,818 1,112 7,531 8/10/2015 Pittsburgh (3) Development C/O achieved May 2017 5,266 3,961 1,305 5,006 8/14/2015 Raleigh Development C/O expected Q4 2017 8,792 2,055 6,737 1,955 9/30/2015 Jacksonville 1 (2) Development C/O achieved Aug. 2016 6,445 5,954 491 8,219 10/27/2015 Austin (2) Development C/O achieved Mar. 2017 8,658 5,616 3,042 6,748 9/20/2016 Charlotte 2 Development C/O expected Q2 2018 12,888 1,875 11,013 1,662 11/17/2016 Orlando 2 (3) Development C/O expected Q2 2017 5,134 2,089 3,045 2,074 11/17/2016 Jacksonville 2 Development C/O expected Q4 2017 7,530 1,553 5,977 1,491 1/4/2017 New York City Development C/O expected Q3 2017 16,117 8,765 7,352 8,746 1/18/2017 Atlanta 3 Development C/O expected Q2 2018 14,115 3,051 11,064 2,944 1/31/2017 Atlanta 4 Development C/O expected Q2 2018 13,678 5,305 8,373 5,234 2/24/2017 Orlando 3 Development C/O expected Q1 2018 8,056 604 7,452 526 2/24/2017 New Orleans Development C/O expected Q2 2018 12,549 - 12,549 - 2/27/2017 Atlanta 5 Development C/O expected Q3 2018 17,492 4,469 13,023 4,332 3/1/2017 Fort Lauderdale Development C/O expected Q3 2018 9,952 1,710 8,242 1,622 3/1/2017 Houston Development C/O expected Q4 2017 13,630 3,211 10,419 3,102 Subtotal Development $207,429 $93,748 $113,681 $106,608 8/5/2015 Sarasota (5) Construction C/O achieved May 2017 4,792 4,098 694 4,134 12/23/2015 Miami Construction C/O expected Q2 2018 17,733 7,473 10,260 7,194 Subtotal Construction $22,525 $11,571 $10,954 $11,328 6/19/2015 New Orleans Operating Property $2,800 $2,800 - $2,783 7/7/2015 Newark Operating Property 3,480 3,480 - 3,464 10/30/2015 Nashville (5) Operating Property 1,210 1,210 - 1,211 12/22/2015 Chicago Operating Property 2,502 2,500 2 2,507 Subtotal Operating Property $9,992 $9,990 $2 $9,965 Total REIT Committed Investments -as of 3/31/2017 $239,946 $115,309 $124,637 $127,901
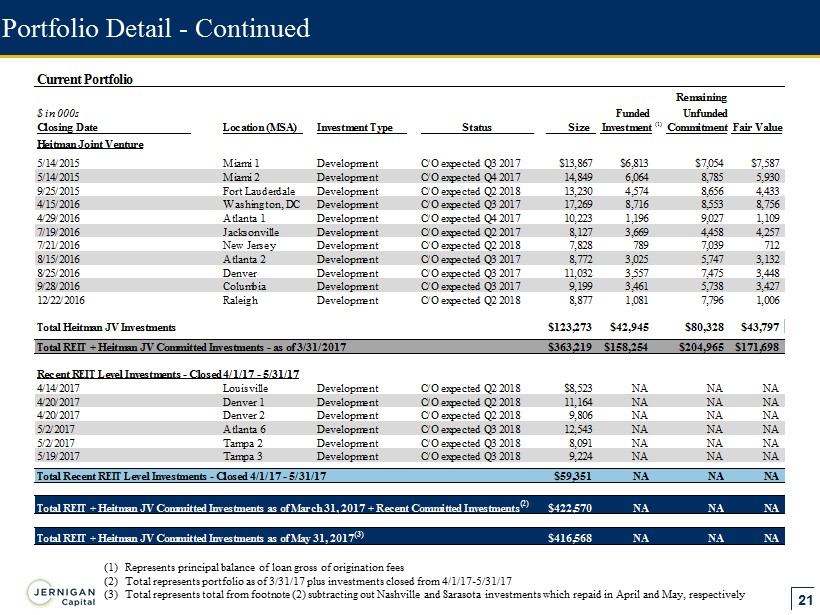
21 Portfolio Detail - Continued (1) Represents principal balance of loan gross of origination fees (2) Total represents portfolio as of 3/31/17 plus investments closed from 4/1/17 - 5/31/17 (3) Total represents total from footnote (2) subtracting out Nashville and Sarasota investments which repaid in April and May, respectively Current Portfolio Remaining $ in 000s Funded Unfunded Closing Date Location (MSA) Investment Type Status Size Investment (1) Commitment Fair Value Heitman Joint Venture 5/14/2015 Miami 1 Development C/O expected Q3 2017 $13,867 $6,813 $7,054 $7,587 5/14/2015 Miami 2 Development C/O expected Q4 2017 14,849 6,064 8,785 5,930 9/25/2015 Fort Lauderdale Development C/O expected Q2 2018 13,230 4,574 8,656 4,433 4/15/2016 Washington, DC Development C/O expected Q3 2017 17,269 8,716 8,553 8,756 4/29/2016 Atlanta 1 Development C/O expected Q4 2017 10,223 1,196 9,027 1,109 7/19/2016 Jacksonville Development C/O expected Q2 2017 8,127 3,669 4,458 4,257 7/21/2016 New Jersey Development C/O expected Q2 2018 7,828 789 7,039 712 8/15/2016 Atlanta 2 Development C/O expected Q3 2017 8,772 3,025 5,747 3,132 8/25/2016 Denver Development C/O expected Q3 2017 11,032 3,557 7,475 3,448 9/28/2016 Columbia Development C/O expected Q3 2017 9,199 3,461 5,738 3,427 12/22/2016 Raleigh Development C/O expected Q2 2018 8,877 1,081 7,796 1,006 Total Heitman JV Investments $123,273 $42,945 $80,328 $43,797 Total REIT + Heitman JV Committed Investments - as of 3/31/2017 $363,219 $158,254 $204,965 $171,698 Recent REIT Level Investments - Closed 4/1/17 - 5/31/17 4/14/2017 Louisville Development C/O expected Q2 2018 $8,523 NA NA NA 4/20/2017 Denver 1 Development C/O expected Q2 2018 11,164 NA NA NA 4/20/2017 Denver 2 Development C/O expected Q2 2018 9,806 NA NA NA 5/2/2017 Atlanta 6 Development C/O expected Q3 2018 12,543 NA NA NA 5/2/2017 Tampa 2 Development C/O expected Q3 2018 8,091 NA NA NA 5/19/2017 Tampa 3 Development C/O expected Q3 2018 9,224 NA NA NA Total Recent REIT Level Investments - Closed 4/1/17 - 5/31/17 $59,351 NA NA NA Total REIT + Heitman JV Committed Investments as of March 31, 2017 + Recent Committed Investments (2) $422,570 NA NA NA Total REIT + Heitman JV Committed Investments as of May 31, 2017 (3) $416,568 NA NA NA
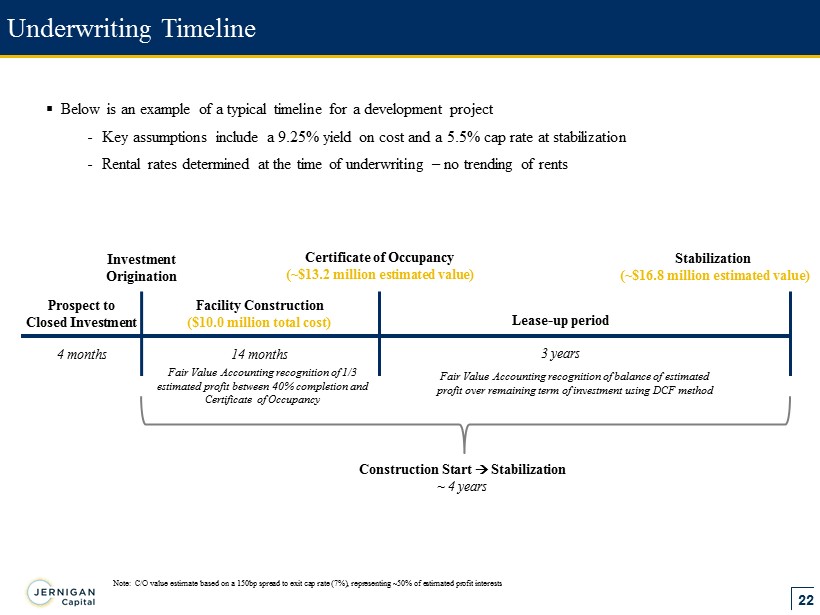
22 Underwriting Timeline Prospect to Closed Investment 4 months Facility Construction ($10.0 million total cost) 14 months Lease - up period 3 years Certificate of Occupancy (~$13.2 million estimated value) Investment Origination Stabilization (~$16.8 million estimated value) Construction Start Stabilization ~ 4 years ▪ Below is an example of a typical timeline for a development project - Key assumptions include a 9.25% yield on cost and a 5.5% cap rate at stabilization - Rental rates determined at the time of underwriting – no trending of rents Fair Value Accounting recognition of 1/3 estimated profit between 40% completion and Certificate of Occupancy Fair Value Accounting recognition of balance of estimated profit over remaining term of investment using DCF method Note: C/O value estimate based on a 150bp spread to exit cap rate (7%), representing ~50% of estimated profit interests
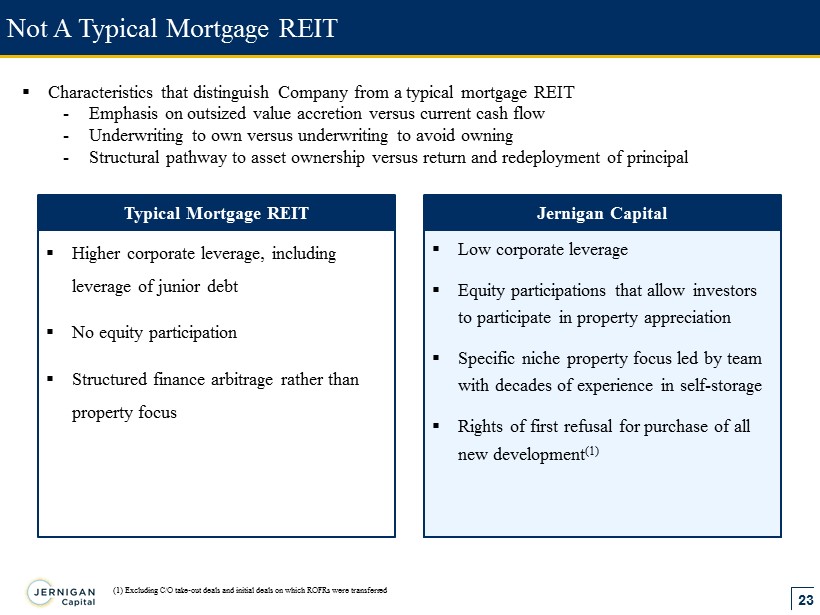
23 Not A Typical Mortgage REIT Typical Mortgage REIT ▪ Higher corporate leverage, including leverage of junior debt ▪ No equity participation ▪ Structured finance arbitrage rather than property focus Jernigan Capital ▪ Low corporate leverage ▪ Equity participations that allow investors to participate in property appreciation ▪ Specific niche property focus led by team with decades of experience in self - storage ▪ Rights of first refusal for purchase of all new development (1) ▪ Characteristics that distinguish Company from a typical mortgage REIT - Emphasis on outsized value accretion versus current cash flow - Underwriting to own versus underwriting to avoid owning - Structural pathway to asset ownership versus return and redeployment of principal (1) Excluding C/O take - out deals and initial deals on which ROFRs were transferred
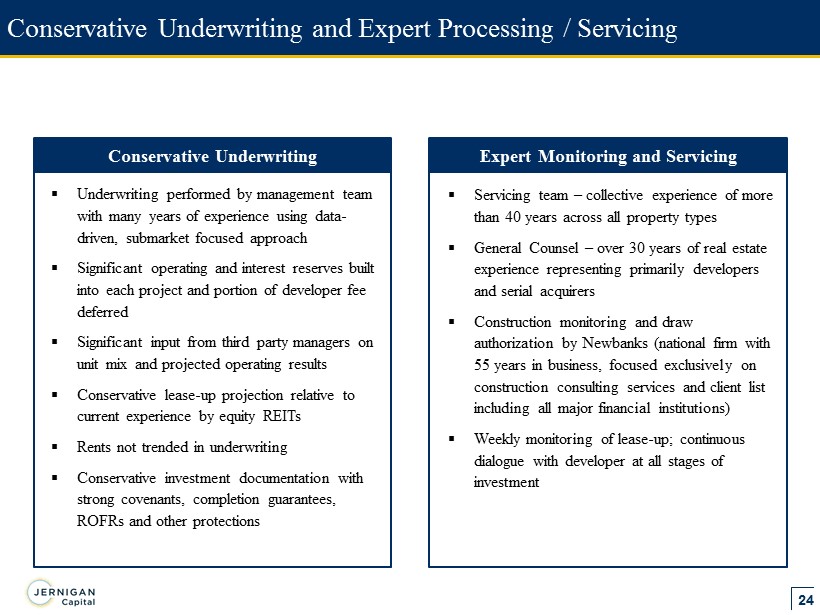
24 ▪ Underwriting performed by management team with many years of experience using data - driven, submarket focused approach ▪ Significant operating and interest reserves built into each project and portion of developer fee deferred ▪ Significant input from third party managers on unit mix and projected operating results ▪ Conservative lease - up projection relative to current experience by equity REITs ▪ Rents not trended in underwriting ▪ Conservative investment documentation with strong covenants, completion guarantees, ROFRs and other protections Conservative Underwriting and Expert Processing / Servicing Conservative Underwriting ▪ Servicing team – collective experience of more than 40 years across all property types ▪ General Counsel – over 30 years of real estate experience representing primarily developers and serial acquirers ▪ Construction monitoring and draw authorization by Newbanks (national firm with 55 years in business, focused exclusively on construction consulting services and client list including all major financial institutions) ▪ Weekly monitoring of lease - up; continuous dialogue with developer at all stages of investment Expert Monitoring and Servicing
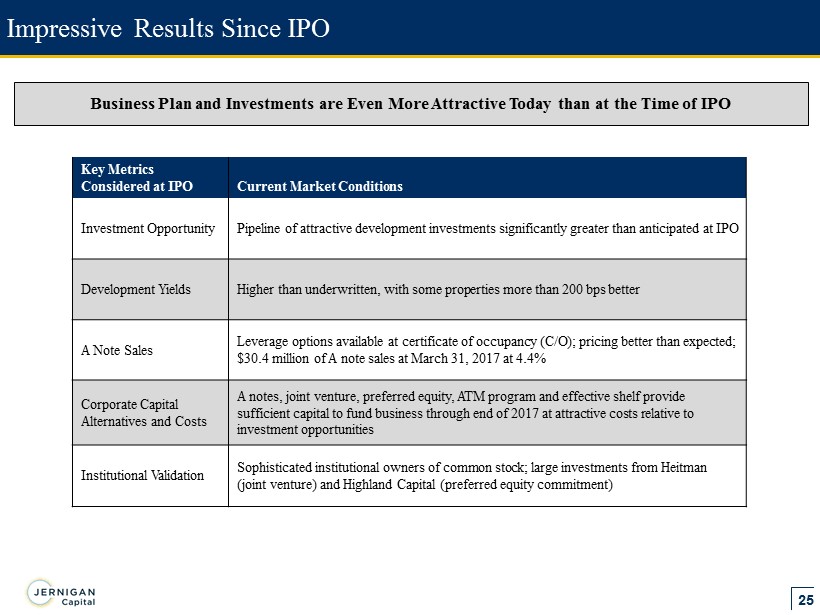
25 Business Plan and Investments are Even More Attractive Today than at the Time of IPO Impressive Results Since IPO Key Metrics Considered at IPO Current Market Conditions Investment Opportunity Pipeline of attractive development investments s ignificantly greater than anticipated at IPO Development Yields Higher than underwritten, with some properties more than 200 bps better A Note Sales Leverage options available at certificate of occupancy (C/O); pricing better than expected; $ 30.4 million of A note sales at March 31, 2017 at 4.4% Corporate Capital Alternatives and Costs A notes, joint venture, preferred equity, ATM program and effective shelf provide sufficient capital to fund business through end of 2017 at attractive costs relative to investment opportunities Institutional Validation Sophisticated institutional owners of common stock; large investments from Heitman (joint venture) and Highland Capital (preferred equity commitment)
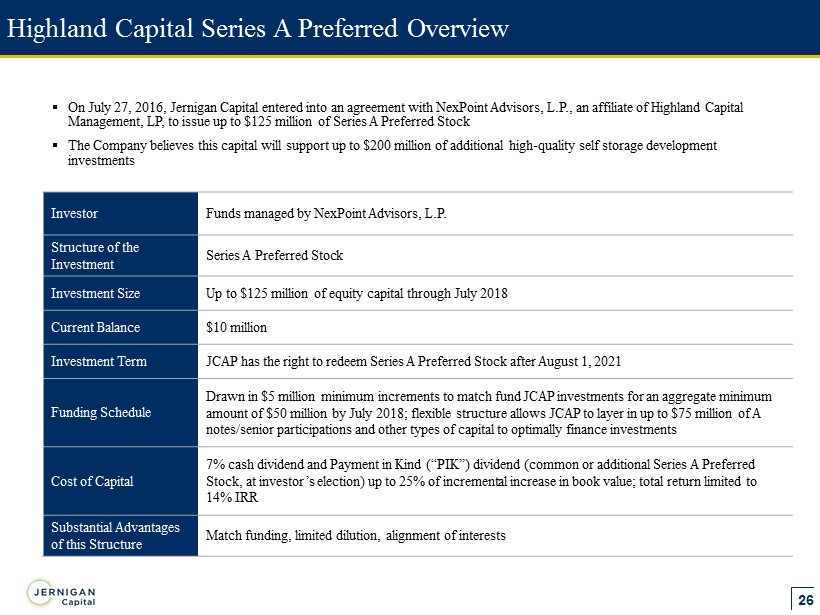
26 Highland Capital Series A Preferred Overview ▪ On July 27, 2016, Jernigan Capital entered into an agreement with NexPoint Advisors, L.P., an affiliate of Highland Capital Management, LP, to issue up to $125 million of Series A Preferred Stock ▪ The Company believes this capital will support up to $200 million of additional high - quality self storage development investments Investor Funds managed by NexPoint Advisors, L.P. Structure of the Investment Series A Preferred Stock Investment Size Up to $125 million of equity capital through July 2018 Current Balance $10 million Investment Term JCAP has the right to redeem Series A Preferred Stock after August 1, 2021 Funding Schedule Drawn in $5 million minimum increments to match fund JCAP investments for an aggregate minimum amount of $50 million by July 2018 ; flexible structure allows JCAP to layer in up to $75 million of A notes/senior participations and other types of capital to optimally finance investments Cost of Capital 7% cash dividend and Payment in Kind (“PIK”) dividend (common or additional Series A P referred Stock, at investor’s election) up to 25% of incremental increase in book value; total return limited to 14% IRR Substantial Advantages of this Structure Match funding, limited dilution, alignment of interests
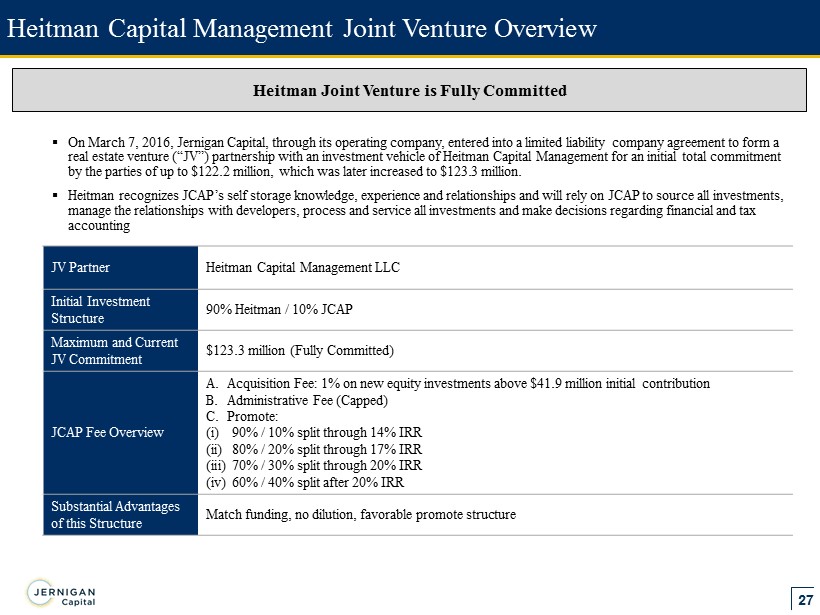
27 Heitman Capital Management Joint Venture Overview ▪ On March 7, 2016, Jernigan Capital, through its operating company, entered into a limited liability company agreement to form a real estate venture (“JV”) partnership with an investment vehicle of Heitman Capital Management for an initial total commitment by the parties of up to $122.2 million, which was later increased to $ 123.3 million. ▪ Heitman recognizes JCAP’s self storage knowledge, experience and relationships and will rely on JCAP to source all investment s, manage the relationships with developers, process and service all investments and make decisions regarding financial and tax accounting JV Partner Heitman Capital Management LLC Initial Investment Structure 90% Heitman / 10% JCAP Maximum and Current JV Commitment $123.3 million (Fully Committed) JCAP Fee Overview A. Acquisition Fee: 1% on new equity investments above $41.9 million initial contribution B. Administrative Fee (Capped) C. Promote: (i) 90% / 10% split through 14% IRR (ii) 80% / 20% split through 17% IRR (iii) 70% / 30% split through 20% IRR (iv) 60% / 40% split after 20% IRR Substantial Advantages of this Structure Match funding, no dilution, favorable promote structure Heitman Joint Venture is Fully Committed