Attached files
| file | filename |
|---|---|
| 8-K - FORM 8-K - 3D SYSTEMS CORP | f8k_060517.htm |
EXHIBIT 99.1
1 Vyomesh Joshi, President & CEO Corporate Presentation - June 2017
2 Forward - Looking Statements Certain statements made in this release that are not statements of historical or current facts are forward - looking statements within the meaning of the Private Securities Litigation Reform Act of 1995. Forward - looking statements involve known and unknown risks, uncertainties and other factors that may cause the actual results, performance or achievements of the company to be materially different from historical results or from any future results or projections expressed or implied by such forward - looking statements. In many cases, forward looking statements can be identified by terms such as “believes,” “belief,” “expects,” “may,” “will,” “estimates,” “intends,” “anticipates” or “plans” or the negative of these terms or other comparable terminology. Forward - looking statements are based upon management’s beliefs, assumptions and current expectations and may include comments as to the company’s beliefs and expectations as to future events and trends affecting its business and are necessarily subject to uncertainties, many of which are outside the control of the company. The factors described under the headings “Forward - Looking Statements” and “Risk Factors” in the company’s periodic filings with the Securities and Exchange Commission, as well as other factors, could cause actual results to differ materially from those reflected or predicted in forward - looking statements. Although management believes that the expectations reflected in the forward - looking statements are reasonable, forward - looking statements are not, and should not be relied upon as a guarantee of future performance or results, nor will they necessarily prove to be accurate indications of the times at which such performance or results will be achieved. The forward - looking statements included are made only as the date of the statement. 3D Systems undertakes no obligation to update or review any forward - looking statements made by management or on its behalf, whether as a result of future developments, subsequent events or circumstances or otherwise. 3D Systems

3 Focused Execution • Customer centric, market based strategy to make 3D production real • Targeted verticals and focused innovation • Quality as company - wide priority • Committed to continuous innovation • Leverage partnerships to enhance our end - to - end solutions • Implement an operating structure to support the strategy 3D Systems
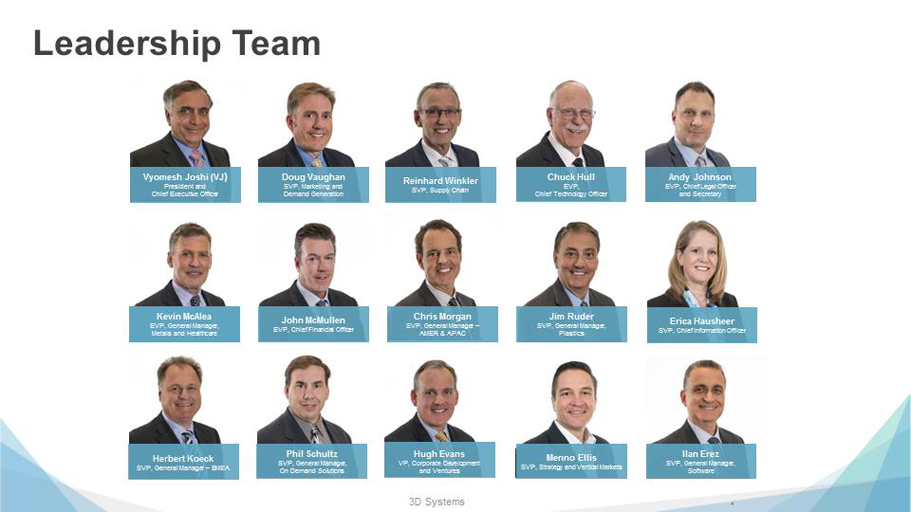
4 Chuck Hull EVP, Chief Technology Officer Andy Johnson EVP, Chief Legal Officer and Secretary Doug Vaughan SVP , Marketing and Demand Generation Herbert Koeck SVP, General Manager – EMEA Vyomesh Joshi (VJ ) President and Chief Executive Officer Reinhard Winkler SVP, Supply Chain Kevin McAlea EVP , General Manager, Metals and Healthcare Hugh Evans VP, Corporate Development and Ventures Ilan Erez SVP, General Manager, Software Jim Ruder SVP , General Manager , Plastics Phil Schultz SVP, General Manager, On Demand Solutions Chris Morgan SVP, General Manager – AMER & APAC John McMullen EVP, Chief Financial Officer Erica Hausheer SVP, Chief Information Officer Menno Ellis SVP , Strategy and Vertical Markets Leadership Team 3D Systems
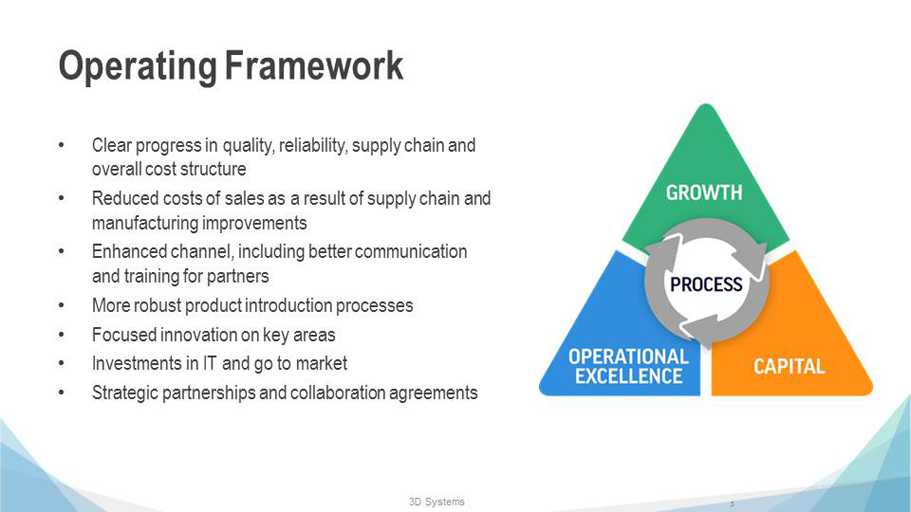
5 Operating Framework • Clear progress in quality, reliability, supply chain and overall cost structure • Reduced costs of sales as a result of supply chain and manufacturing improvements • Enhanced channel, including better communication and training for partners • More robust product introduction processes • Focused innovation on key areas • Investments in IT and go to market • Strategic partnerships and collaboration agreements 3D Systems

6 • Go seamlessly from p hysical to digital to physical with 3D Systems’ unmatched portfolio of digitization, design and production solutions Industry - Leading Capabilities with Global Scale • Industry - leading industrial 3D printing technologies • Widest range of technology and materials • Comprehensive on demand manufacturing services • Complete solutions with hardware, software and service • Partnerships with other leading companies in software, vertical applications and materials development 3D Systems

7 Plastics Portfolio $1M $300k $200k $100k $50k Software Key Competition Stratasys, BinderJet , FDM Stratasys, Keyence EOS, HP Stratasys, UnionTech Value Proposition 5 – 10 X faster full color printing. 3D Systems most affordable platform with lowest TCO and full color Up t o 2 X faster printing with superior part quality and easier post processing. Gold standard for wax printing Greater versatility with more materials (4) and lower TCO Gold Standard in quality with throughput up to 10x higher and broad range of materials TCO 25% lower (Need comparison) 35% lower 21% lower than HP 85% lower CJP MJP SLS SLA MJP 2500 Family MJP 3600 (Dental, Wax) MJP 5600x 6000 / 7000 ProX ® 800 ProX ® 950 ProX ® SLS 500 sPro ™ 140/230 sPro 60 CJP 860Pro CJP 660Pro CJP 460Pro CJP 360 CJP 260C - Figures in table (except pricing) are estimates based on the results of 3D Systems tests conducted in a laboratory setting.

8 Revolutionary Plastics Production with Figure 4 3D Systems Print Engines Imaging Material Containers Print Trays Print Plates Automation Material Delivery Materials 1 Liter 55 gallon 5 gallon Small Pump Hand Pour Industrial Pump Large Format Standard Tray Non - perforated Standard Plate Linear Robot 6 - Axis Robot Customize and Scale Across Industrial and Healthcare Applications
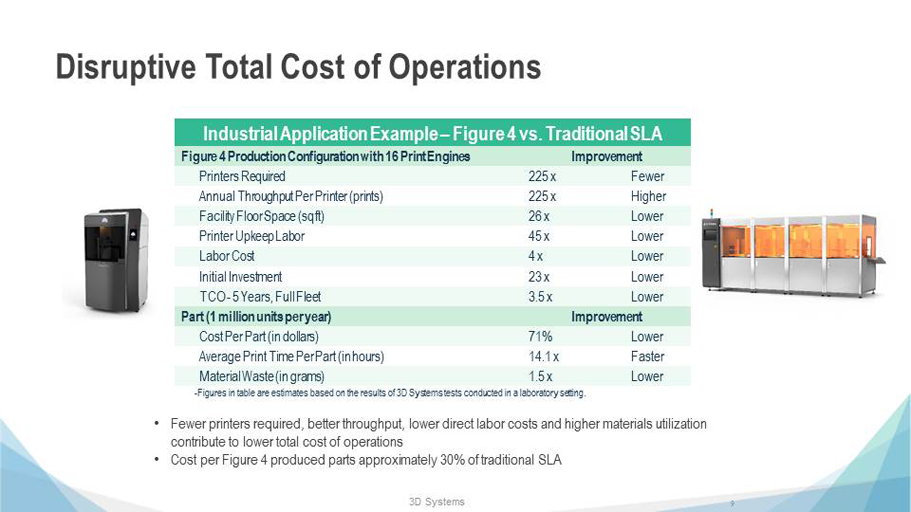
9 Disruptive Total Cost of Operations • Fewer printers required, better throughput, lower direct labor costs and higher materials utilization contribute to lower total cost of operations • Cost per Figure 4 produced parts approximately 30% of traditional SLA Industrial Application Example – Figure 4 vs. Traditional SLA Figure 4 Production Configuration with 16 Print Engines Improvement Printers Required 225 x Fewer Annual Throughput Per Printer (prints) 225 x Higher Facility Floor Space ( sq ft ) 26 x Lower Printer Upkeep Labor 45 x Lower Labor Cost 4 x Lower Initial Investment 23 x Lower TCO - 5 Years, Full Fleet 3.5 x Lower Part (1 million units per year) Improvement Cost Per Part (in dollars) 71% Lower Average Print Time Per Part (in hours) 14.1 x Faster Material Waste (in grams) 1.5 x Lower - Figures in table are estimates based on the results of 3D Systems tests conducted in a laboratory setting. 3D Systems

10 Precision Metal Printing Solutions ProX DMP 320 + Range of Materials + 3DXpert • Full Metals Solution • CAD - based Environment • Precise Print Strategies • Repeatability and Reliability • Integrated Post - Processing • Integrated Material Databases • Certified and Qualified Production Facilities • Address Healthcare, Aerospace, Automotive and more 3D Systems
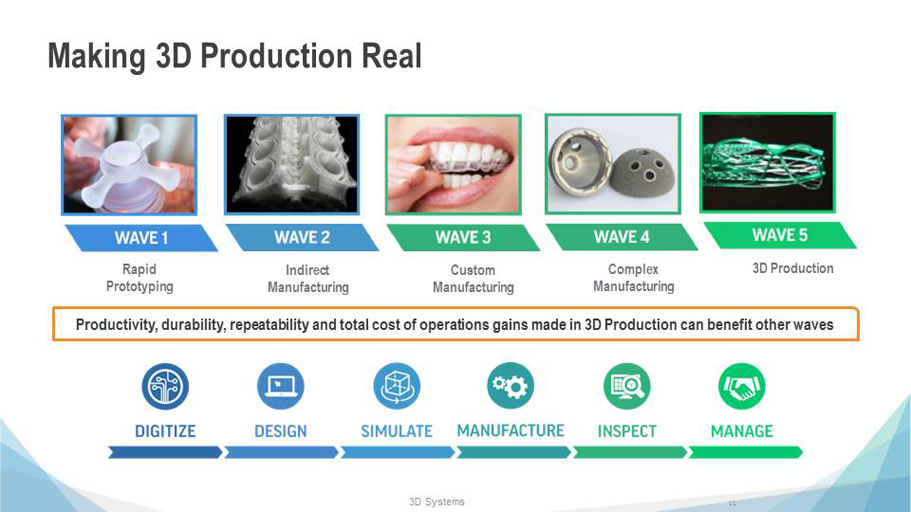
11 Rapid Prototyping Indirect Manufacturing Custom Manufacturing Complex Manufacturing Productivity, durability, repeatability and total cost of operations gains made in 3D Production can benefit other waves Making 3D Production Real 3D Systems 3D Production

12 What 3D Production Delivers • Weight reduction • Assembly consolidation • Custom geometries • Improved fluid dynamics • Optimized designs • Multi - material and multi - color parts • Personalized devices • Repeatability DIGITALLY MANUFACTURED PART • Reduction of tooling • Decentralized/more agile manufacturing • Supply chain consolidation and lower inventory • Mass customization • Low volume production • Faster time to market • Rapid prototyping • Increased productivity ECONOMICS 3D Systems

13 Healthcare TODAY’S CHALLENGES • Enable doctors to drive down costs and reduce operating time • Device development and manufacturing in validated production environment • Enhanced surgeon confidence through planning and simulation • Accelerate product introductions to market • Time to develop expertise • Operating room costs • Patient - specific anatomies • Complex and unique diagnoses HOW 3D SYSTEMS ADDRESSES THOSE CHALLENGES Anatomical Heart Model

14 Precision Healthcare Focus Surgical Simulation Surgical Planning Device Design & Manufacturing Bioprinting • Over 500,000 medical devices printed • Over 10,000 surgeons trained • ISO certified facilities and processes • FDA approved services and products • Over 75,000 surgical cases planned • Over 2,800 simulators installed • 90 surgical procedures in simulation • 45 patents granted/applied 3D Systems
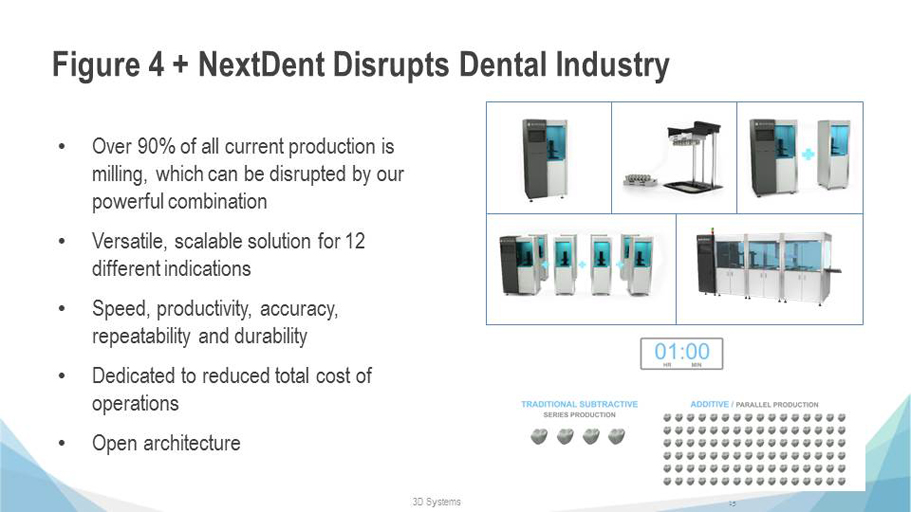
15 Figure 4 + NextDent Disrupts Dental Industry 3D Systems • Over 90% of all current production is milling, which can be disrupted by our powerful combination • Versatile, scalable solution for 12 different indications • Speed , productivity, accuracy, repeatability and durability • Dedicated to reduced total cost of operations • Open architecture

16 Automotive TODAY’S TACTICAL CHALLENGES • Drive down costs of vehicle manufacturing through light - weighting parts • Innovation in more complex, integrated parts produced on - demand • Very rapid iteration of designs • Weight + fuel = emissions • Faster time - to - market • Supply chain inefficiencies HOW 3D SYSTEMS ADDRESSES THOSE CHALLENGES

17 3D Production for Automotive • Highly functional, very fast prototypes • Rapid shell investment casting processes • Tool - free parts production for bridge manufacturing • Short - run production parts in metal Significantly improved time - to - market On - demand production of current and obsolete parts Light - weight parts to deliver fuel economies • Weight - optimized parts while maintaining strength - to - weight ratios • Single parts consolidated from an assembly • Fast reverse engineering and manufacture of out - of - production parts • Immediate production of more complex parts without waiting for tooling 3D Systems
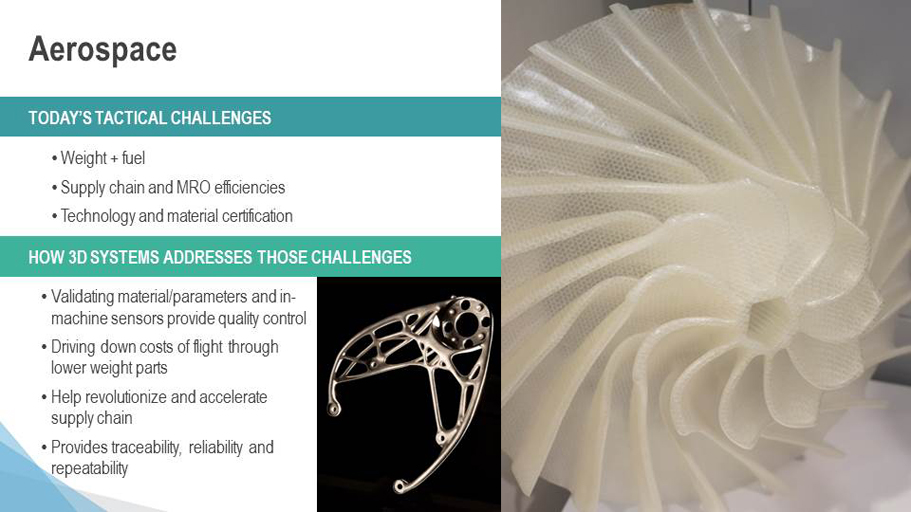
18 Aerospace TODAY’S TACTICAL CHALLENGES • Validating material/parameters and in - machine sensors provide q uality c ontrol • Driving down costs of flight through lower weight parts • Help revolutionize and accelerate supply chain • Provides traceability, reliability and repeatability • Weight + fuel • Supply chain and MRO efficiencies • Technology and material certification HOW 3D SYSTEMS ADDRESSES THOSE CHALLENGES
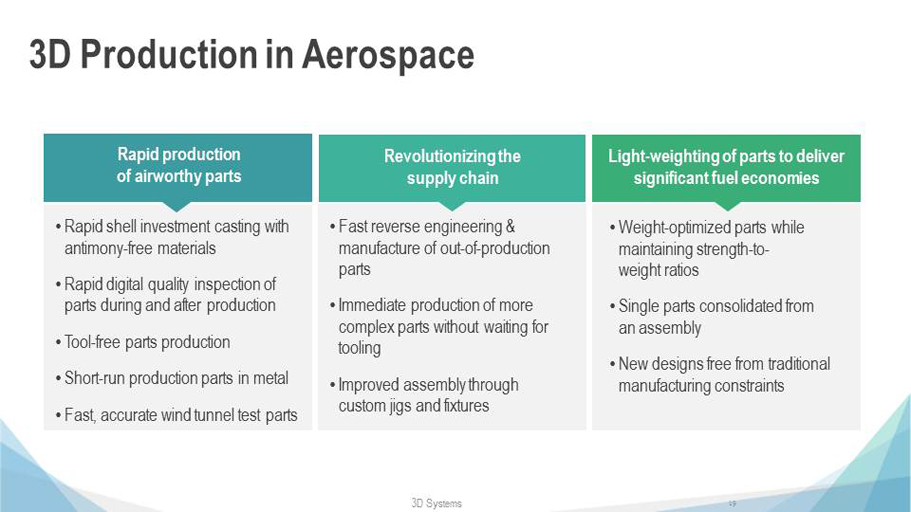
19 3D Production in Aerospace Rapid production of airworthy parts Light - weighting of parts to deliver significant fuel economies Revolutionizing the supply chain • Rapid shell investment casting with antimony - free materials • Rapid digital quality inspection of parts during and after production • Tool - free parts production • Short - run production parts in metal • Fast, accurate wind tunnel test parts • Fast reverse engineering & manufacture of out - of - production parts • Immediate production of more complex parts without waiting for tooling • Improved assembly through custom jigs and fixtures • Weight - optimized parts while maintaining strength - to - weight ratios • Single parts consolidated from an assembly • New designs free from traditional manufacturing constraints 3D Systems

20 3D PRINTER U SE CASE VALUE PROPOSITION ProX ® SLS 500 Full packed build of small functional parts o Average 20% lower part cost than Multi - Jet Fusion ProJet ® SLA 6000 Full packed build of small prototypes o Up to 66% lower part cost & 91% higher throughput than FORTUS 450mc o 11% lower part cost than Connex 350 & 500 ProJet ® SLA 7000 Full packed build of small prototypes o 56% lower part cost & 85% higher throughput than FORTUS 450mc o 5% lower part cost than Connex 350 & 500 ProJet ® MJP 2500W Small to large, mixed sized castable patterns o 2.8x lower part cost than Solidscape Max2 o 17x higher throughput than Solidscape Max2 ProJet ® MJP 2500+ Small to large, mixed sized prototypes o 11% lower part cost than Objet30 Pro o 48% lower part cost than Keyence InkJet 3200 ProJet ® MJP 5600 Single large durable part o 35% lower part cost and up to 2X throughput than Objet 350 o 45% lower part cost and up to 2X throughput than Objet 500 3D Systems’ Value Proposition Productivity | R epeatability | Durability | Throughput | Total Cost of Operations (TCO) All are estimates based on the results of 3D Systems tests with real part examples used for benchmarking
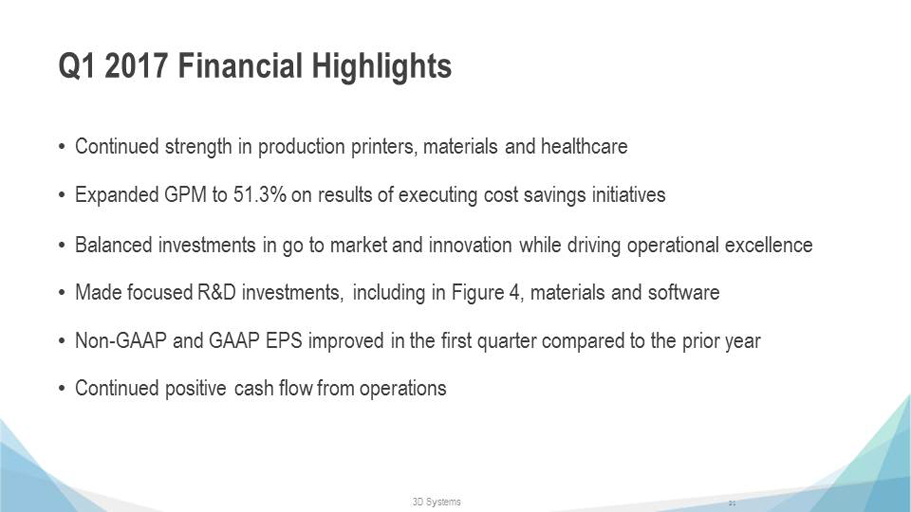
21 Q1 2017 Financial Highlights • Continued strength in production printers, materials and healthcare • Expanded GPM to 51.3% on results of executing cost savings initiatives • Balanced investments in go to market and innovation while driving operational excellence • Made focused R&D investments, including in Figure 4, materials and software • Non - GAAP and GAAP EPS improved in the first quarter compared to the prior year • Continued positive cash flow from operations 3D Systems
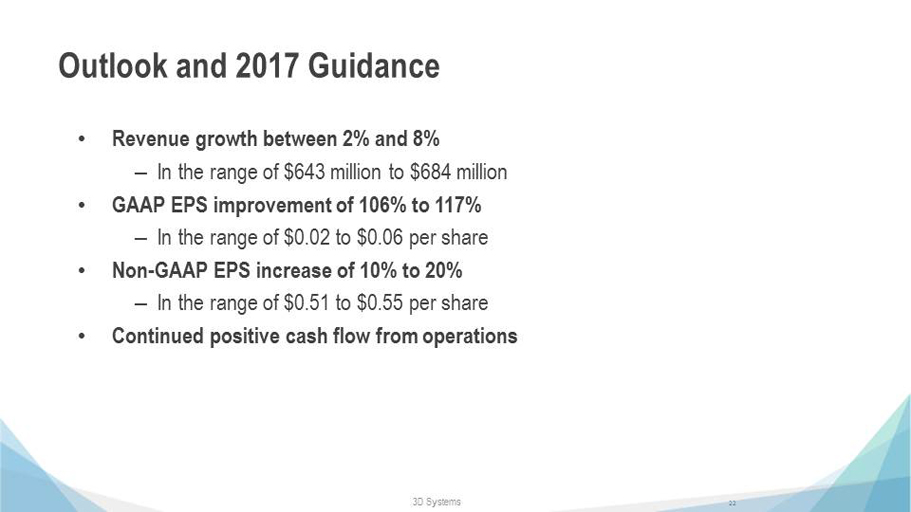
22 Outlook and 2017 Guidance • Revenue growth between 2% and 8% – In the range of $643 million to $684 million • GAAP EPS improvement of 106% to 117% – In the range of $0.02 to $0.06 per share • Non - GAAP EPS increase of 10% to 20% – In the range of $0.51 to $0.55 per share • Continued positive cash flow from operations 3D Systems
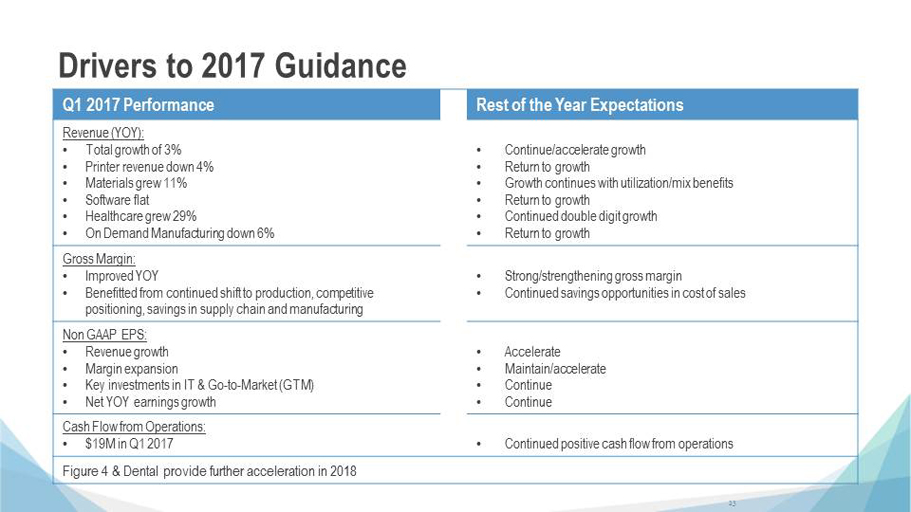
23 Drivers to 2017 Guidance Q1 2017 Performance Rest of the Year Expectations Revenue (YOY): • Total growth of 3% • Printer revenue down 4% • Materials grew 11% • Software flat • Healthcare grew 29% • On Demand Manufacturing down 6% • Continue/accelerate growth • Return to growth • Growth continues with utilization/mix benefits • Return to growth • Continued double digit growth • Return to growth Gross Margin : • Improved YOY • Benefitted from continued shift to production, competitive positioning, savings in supply chain and manufacturing • Strong/strengthening gross margin • Continued savings opportunities in cost of sales Non GAAP EPS: • Revenue growth • Margin expansion • Key investments in IT & Go - to - Market (GTM) • Net YOY earnings growth • Accelerate • Maintain/accelerate • Continue • Continue Cash Flow from Operations: • $19M in Q1 2017 • Continued positive cash flow from operations Figure 4 & Dental provide further acceleration in 2018
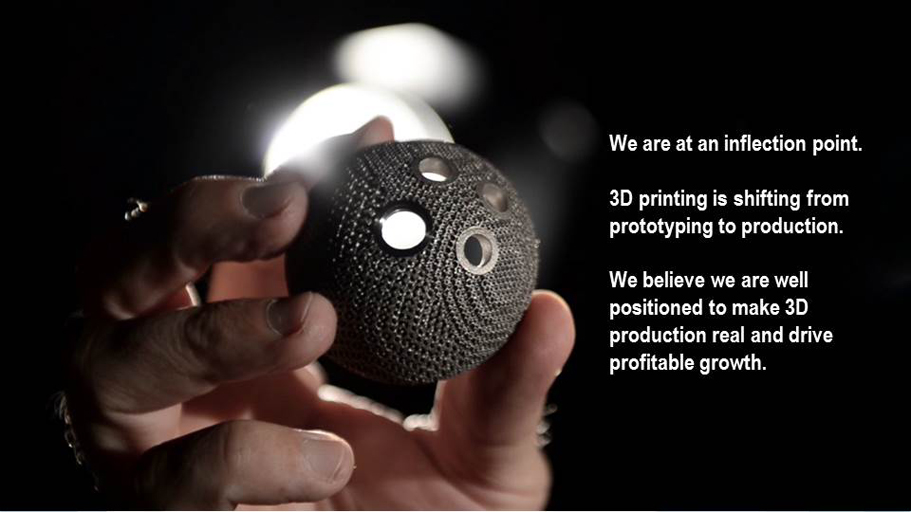
24 We are at an inflection point. 3D printing is shifting from prototyping to production. We believe we are well positioned to make 3D production real and drive profitable growth.

25 Thank you.
26 Supplemental Information

27 GAAP to Non - GAAP Reconciliation – Q1 2017 (a) Tax effect for the quarter ended March 31, 2016 and earlier periods was calculated quarterly, based on the Company’s overall ta x rate for each quarter. Tax effect for the quarters ended after March 31, 2016 was calculated based on the Company’s quarterly U.S. tax rate, which was 0% as a result of the valuation al lowance that was recorded in the fourth quarter of 2015, in connection with GAAP net losses . (in thousands, except per share amounts) GAAP Amortization, Stock-Based Compensatio n & Other Legal and Acquisition- Related Portfolio Restructuring Non-GAAP GAAP Amortization, Stock-Based Compensatio n & Other Legal and Acquisition- Related Portfolio Restructuring Non-GAAP Revenue $ 156,431 $ — $ — $ — $ 156,431 $ 152,555 $ — $ — $ — $ 152,555 Cost of sales 76,245 (89) — — 76,156 75,042 (84) — — 74,958 Gross profit 80,186 89 — — 80,275 77,513 84 — — 77,597 Gross profit margin 51.3% 51.3% 50.8% 50.9% Operating expenses: Selling, general and administrative 66,405 (15,874) (1,063) — 49,468 73,967 (20,401) (939) — 52,627 Research and development 22,852 — — — 22,852 20,305 — — — 20,305 Income (loss) from operations (9,071) 15,963 1,063 — 7,955 (16,759) 20,485 939 — 4,665 Interest and other expense, net (201) — — — (201) (126) — — — (126) Income (loss) before income taxes (8,870) 15,963 1,063 — 8,156 (16,633) 20,485 939 — 4,791 Benefit for income taxes (a) 1,041 — — — 1,041 1,179 (1,452) (67) — (340) Net income (loss) (9,911) 15,963 1,063 — 7,115 (17,812) 21,937 1,006 — 5,131 Less: net loss attributable to noncontrolling interests 60 — — — 60 (24) — — — (24) Net income (loss) attributable to 3D Systems Corporation $ (9,971) $ 15,963 $ 1,063 $ — $ 7,055 $ (17,788) $ 21,937 $ 1,006 $ — $ 5,155 Net income (loss) per share available to 3D Systems Corporation common stockholders — basic and diluted $ (0.09) $ 0.06 $ (0.16) $ 0.05 Quarter Ended March 31, 2017 Quarter Ended March 31, 2016

28 Q1 2017 Financial Results 3D Systems (in thousands, except per share amounts) GAAP Amortization, Stock-Based Compensatio n & Other Legal and Acquisition- Related Portfolio Restructuring Non-GAAP GAAP Amortization, Stock-Based Compensatio n & Other Legal and Acquisition- Related Portfolio Restructuring Non-GAAP Revenue $ 156,431 $ — $ — $ — $ 156,431 $ 152,555 $ — $ — $ — $ 152,555 Cost of sales 76,245 (89) — — 76,156 75,042 (84) — — 74,958 Gross profit 80,186 89 — — 80,275 77,513 84 — — 77,597 Gross profit margin 51.3% 51.3% 50.8% 50.9% Operating expenses: Selling, general and administrative 66,405 (15,874) (1,063) — 49,468 73,967 (20,401) (939) — 52,627 Research and development 22,852 — — — 22,852 20,305 — — — 20,305 Income (loss) from operations (9,071) 15,963 1,063 — 7,955 (16,759) 20,485 939 — 4,665 Interest and other expense, net (201) — — — (201) (126) — — — (126) Income (loss) before income taxes (8,870) 15,963 1,063 — 8,156 (16,633) 20,485 939 — 4,791 Benefit for income taxes (a) 1,041 — — — 1,041 1,179 (1,452) (67) — (340) Net income (loss) (9,911) 15,963 1,063 — 7,115 (17,812) 21,937 1,006 — 5,131 Less: net loss attributable to noncontrolling interests 60 — — — 60 (24) — — — (24) Net income (loss) attributable to 3D Systems Corporation $ (9,971) $ 15,963 $ 1,063 $ — $ 7,055 $ (17,788) $ 21,937 $ 1,006 $ — $ 5,155 Net income (loss) per share available to 3D Systems Corporation common stockholders — basic and diluted $ (0.09) $ 0.06 $ (0.16) $ 0.05 Quarter Ended March 31, 2017 Quarter Ended March 31, 2016 (a) Tax effect for the quarter ended March 31, 2016 and earlier periods was calculated quarterly, based on the Company’s overall ta x rate for each quarter. Tax effect for the quarters ended after March 31, 2016 was calculated based on the Company’s quarterly U.S. tax rate, which was 0% as a result of the valuation allowance that was recor ded in the fourth quarter of 2015, in connection with GAAP net losses . The company uses non - GAAP measures to supplement our financial statements presented on a GAAP basis because management believes non - GAAP financia l measures are useful to investors in evaluating operating performance and to facilitate a better understanding of the impact that strategic acquisitions, non - recurring charges and certai n non - cash expenses had on financial results.

29 GAAP to Non - GAAP Reconciliation – 2017 Guidance 3D Systems (in millions, except per share amounts) Low High Revenue $ 643 $ 684 GAAP Earnings per Share $ 0.02 $ 0.06 Estimated adjustments to arrive at non-GAAP EPS: Amortization 0.30 0.30 Stock Based Compensation 0.14 0.14 Acquisition, severance and settlements 0.05 0.05 Total Adjustments $ 0.49 $ 0.49 Non-GAAP Earnings per Share $ 0.51 $ 0.55 Full Year Ended December 31, 2017
