Attached files
| file | filename |
|---|---|
| 8-K - FORM 8-K - Four Corners Property Trust, Inc. | d369972d8k.htm |
Exhibit 99.1
|
|
F O U R C O R N E R S P R O P E R T Y T R U S T N Y S E : F C P T I NV E S TOR P RE S E NTATI ON | JUNE 2017 w w w. fcpt. com
|
|
F O R W AR D L O O K I N G S T AT E M E N T S AN D D I S C L AI M E R S Cautionary Note Regarding Forward-Looking Statements: This presentation contains forward-looking statements within the meaning of the federal securities laws. Forward-looking statements include all statements that are not historical statements of fact and those regarding the Company’s intent, belief or expectations, including, but not limited to, statements regarding: operating and financial performance; and expectations regarding the making of distributions and the payment of dividends. Words such as “anticipate(s),” “expect(s),” “intend(s),” “plan(s),” “believe(s),” “may,” “will,” “would,” “could,” “should,” “seek(s)” and similar expressions, or the negative of these terms, are intended to identify such forward-looking statements. Forward-looking statements speak only as of the date on which such statements are made and, except in the normal course of the Company’s public disclosure obligations, the Company expressly disclaims any obligation to publicly release any updates or revisions to any forward-looking statements to reflect any change in the Company’s expectations or any change in events, conditions or circumstances on which any statement is based. Forward-looking statements are based on management’s current expectations and beliefs and the Company can give no assurance that its expectations or the events described will occur as described. Forward-looking statements are subject to a number of risks and uncertainties that could cause actual results to differ materially from those set forth in or implied by such forward-looking statements. Factors that could have a material adverse effect on the Company’s operations and future prospects or that could cause actual results to differ materially from the Company’s expectations are included in the sections entitled “Business,” “Risk Factors” and “Management’s Discussion and Analysis of Financial Condition and Results of Operations” of the Company’s Annual Report on Form 10-K filed with the Securities and Exchange Commission on February 27, 2017. Notice Regarding Non-GAAP Financial Measures: The information in this communication contains and refer to certain non-GAAP financial measures, including FFO and AFFO. These non-GAAP financial measures are in addition to, not a substitute for or superior to, measures of financial performance prepared in accordance with GAAP. These non-GAAP financial measures should not be considered replacements for, and should be read together with, the most comparable GAAP financial measures. Reconciliations to the most directly comparable GAAP financial measures and statements of why management believes these measures are useful to investors are included in the supplemental financial and operating report, which can be found in the investor relations section of our website at www.fcpt.com. 2 | F C P T | J U N E 2 0 1 7
|
|
AG E N D A Company Overview and Update Page 3 Key Investment Highlights Page 10 Diversification and Acquisition Strategy Page 15 Financial Update & Key Credit Strengths Page 22 3 | F C P T | J U N E 2 0 1 7
|
|
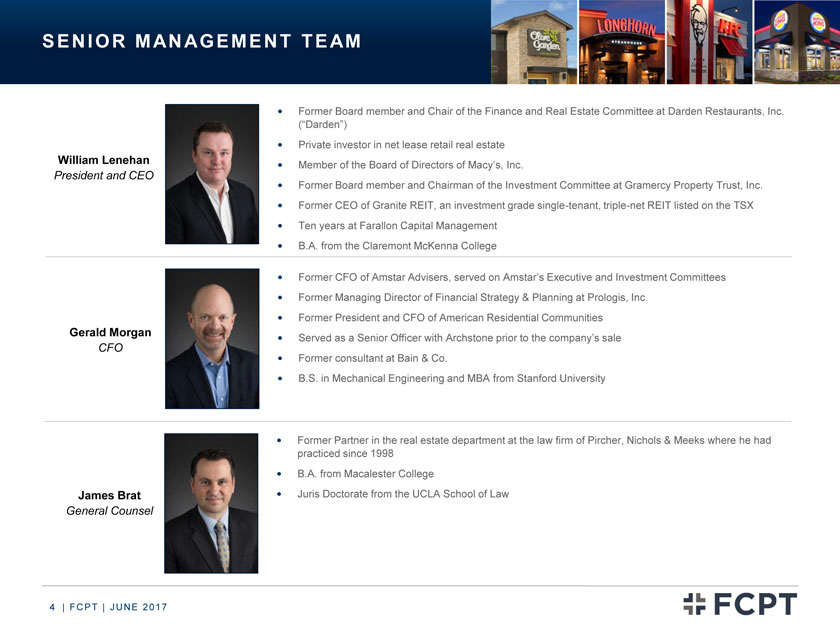
S E N I O R M AN AG E M E N T T E AM William Lenehan President and CEO Former Board member and Chair of the Finance and Real Estate Committee at Darden Restaurants, Inc. (“Darden”) Private investor in net lease retail real estate Member of the Board of Directors of Macy’s, Inc. Former Board member and Chairman of the Investment Committee at Gramercy Property Trust, Inc. Former CEO of Granite REIT, an investment grade single-tenant, triple-net REIT listed on the TSX Ten years at Farallon Capital Management B.A. from the Claremont McKenna College Gerald Morgan CFO Former CFO of Amstar Advisers, served on Amstar’s Executive and Investment Committees Former Managing Director of Financial Strategy & Planning at Prologis, Inc. Former President and CFO of American Residential Communities Served as a Senior Officer with Archstone prior to the company’s sale Former consultant at Bain & Co. B.S. in Mechanical Engineering and MBA from Stanford University James Brat General Counsel Former Partner in the real estate department at the law firm of Pircher, Nichols & Meeks where he had practiced since 1998 B.A. from Macalester College Juris Doctorate from the UCLA School of Law 4 | F C P T | J U N E 2 0 1 7
|
|
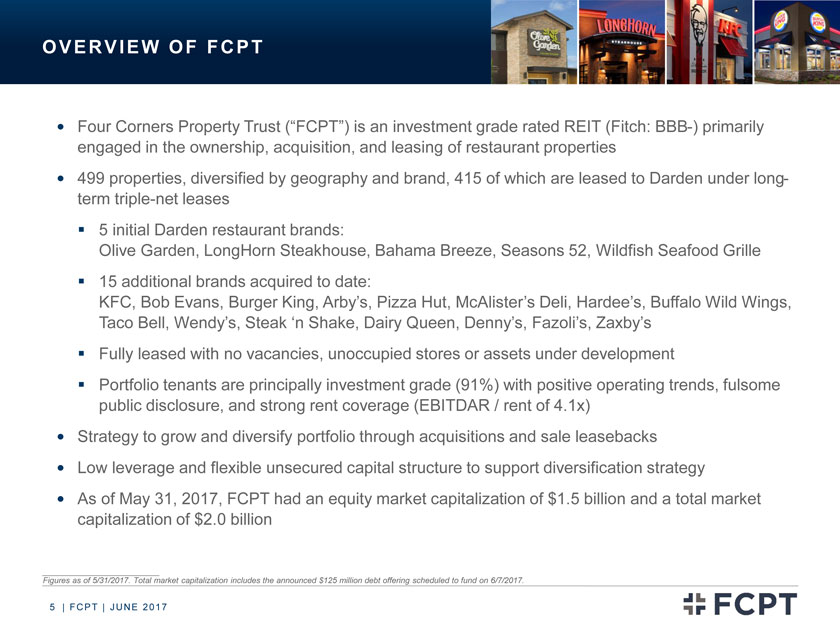
O V E R V I E W O F F C P T ? Four Corners Property Trust (“FCPT”) is an investment grade rated REIT (Fitch: BBB-) primarily engaged in the ownership, acquisition, and leasing of restaurant properties? 499 properties, diversified by geography and brand, 415 of which are leased to Darden under long-term triple-net leases ? 5 initial Darden restaurant brands: Olive Garden, LongHorn Steakhouse, Bahama Breeze, Seasons 52, Wildfish Seafood Grille ? 15 additional brands acquired to date: KFC, Bob Evans, Burger King, Arby’s, Pizza Hut, McAlister’s Deli, Hardee’s, Buffalo Wild Wings, Taco Bell, Wendy’s, Steak ‘n Shake, Dairy Queen, Denny’s, Fazoli’s, Zaxby’s ? Fully leased with no vacancies, unoccupied stores or assets under development ? Portfolio tenants are principally investment grade (91%) with positive operating trends, fulsome public disclosure, and strong rent coverage (EBITDAR / rent of 4.1x) ? Strategy to grow and diversify portfolio through acquisitions and sale leasebacks? Low leverage and flexible unsecured capital structure to support diversification strategy? As of May 31, 2017, FCPT had an equity market capitalization of $1.5 billion and a total market capitalization of $2.0 billion Figures as of 5/31/2017. Total market capitalization includes the announced $125 million debt offering scheduled to fund on 6/7/2017. 5 | F C P T | J U N E 2 0 1 7
|
|
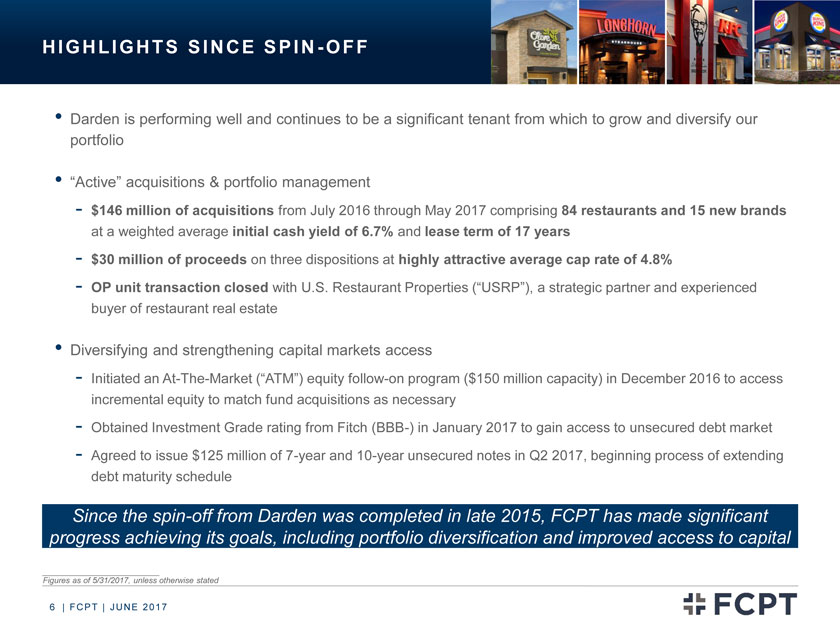
H I G H L I G H T S S I N C E S P I N—O F F • Darden is performing well and continues to be a significant tenant from which to grow and diversify our portfolio • “Active” acquisitions & portfolio management—$146 million of acquisitions from July 2016 through May 2017 comprising 84 restaurants and 15 new brands at a weighted average initial cash yield of 6.7% and lease term of 17 years—$30 million of proceeds on three dispositions at highly attractive average cap rate of 4.8%—OP unit transaction closed with U.S. Restaurant Properties (“USRP”), a strategic partner and experienced buyer of restaurant real estate • Diversifying and strengthening capital markets access—Initiated an At-The-Market (“ATM”) equity follow-on program ($150 million capacity) in December 2016 to access incremental equity to match fund acquisitions as necessary—Obtained Investment Grade rating from Fitch (BBB-) in January 2017 to gain access to unsecured debt market—Agreed to issue $125 million of 7-year and 10-year unsecured notes in Q2 2017, beginning process of extending debt maturity schedule Since the spin-off from Darden was completed in late 2015, FCPT has made significant progress achieving its goals, including portfolio diversification and improved access to capital Figures as of 5/31/2017, unless otherwise stated 6 | F C P T | J U N E 2 0 1 7
|
|
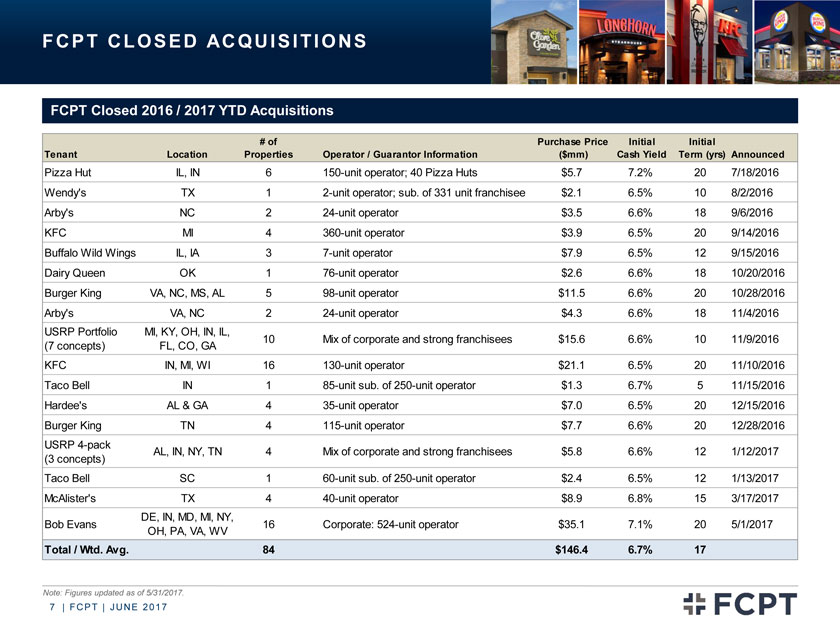
F C P T C L O S E D AC Q U I S I T I O N S FCPT Closed 2016 / 2017 YTD Acquisitions # of Purchase Price Initial Initial Tenant Location Properties Operator / Guarantor Information($mm) Cash Yield Term (yrs) Announced Pizza Hut IL, IN 6 150-unit operator; 40 Pizza Huts $5.7 7.2% 20 7/18/2016 Wendy’s TX 1 2-unit operator; sub. of 331 unit franchisee $2.1 6.5% 10 8/2/2016 Arby’s NC 2 24-unit operator $3.5 6.6% 18 9/6/2016 KFC MI 4 360-unit operator $3.9 6.5% 20 9/14/2016 Buffalo Wild Wings IL, IA 3 7-unit operator $7.9 6.5% 12 9/15/2016 Dairy Queen OK 1 76-unit operator $2.6 6.6% 18 10/20/2016 Burger King VA, NC, MS, AL 5 98-unit operator $11.5 6.6% 20 10/28/2016 Arby’s VA, NC 2 24-unit operator $4.3 6.6% 18 11/4/2016 USRP Portfolio MI, KY, OH, IN, IL, (7 concepts) FL, CO, GA 10 Mix of corporate and strong franchisees $15.6 6.6% 10 11/9/2016 KFC IN, MI, WI 16 130-unit operator $21.1 6.5% 20 11/10/2016 Taco Bell IN 1 85-unit sub. of 250-unit operator $1.3 6.7% 5 11/15/2016 Hardee’s AL & GA 4 35-unit operator $7.0 6.5% 20 12/15/2016 Burger King TN 4 115-unit operator $7.7 6.6% 20 12/28/2016 USRP 4-pack AL, IN, NY, TN 4 Mix of corporate and strong franchisees $5.8 6.6% 12 1/12/2017 (3 concepts) Taco Bell SC 1 60-unit sub. of 250-unit operator $2.4 6.5% 12 1/13/2017 McAlister’s TX 4 40-unit operator $8.9 6.8% 15 3/17/2017 DE, IN, MD, MI, NY, Bob Evans 16 Corporate: 524-unit operator $35.1 7.1% 20 5/1/2017 OH, PA, VA, WV Total / Wtd. Avg. 84 $146.4 6.7% 17 Note: Figures updated as of 5/31/2017. 7 | F C P T | J U N E 2 0 1 7
|
|
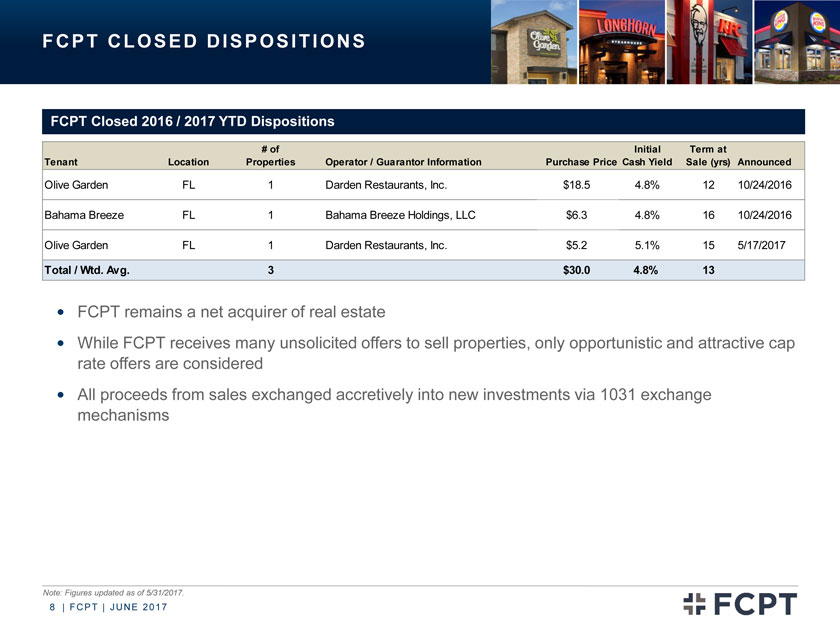
F C P T C L O S E D D I S P O S I T I O N S FCPT Closed 2016 / 2017 YTD Dispositions # of Initial Term at Tenant Location Properties Operator / Guarantor Information Purchase Price Cash Yield Sale (yrs) Announced Olive Garden FL 1 Darden Restaurants, Inc. $18.5 4.8% 12 10/24/2016 Bahama Breeze FL 1 Bahama Breeze Holdings, LLC $6.3 4.8% 16 10/24/2016 Olive Garden FL 1 Darden Restaurants, Inc. $5.2 5.1% 15 5/17/2017 Total / Wtd. Avg. 3 $30.0 4.8% 13 ? FCPT remains a net acquirer of real estate ? While FCPT receives many unsolicited offers to sell properties, only opportunistic and attractive cap rate offers are considered? All proceeds from sales exchanged accretively into new investments via 1031 exchange mechanisms Note: Figures updated as of 5/31/2017. 8 | F C P T | J U N E 2 0 1 7
|
|
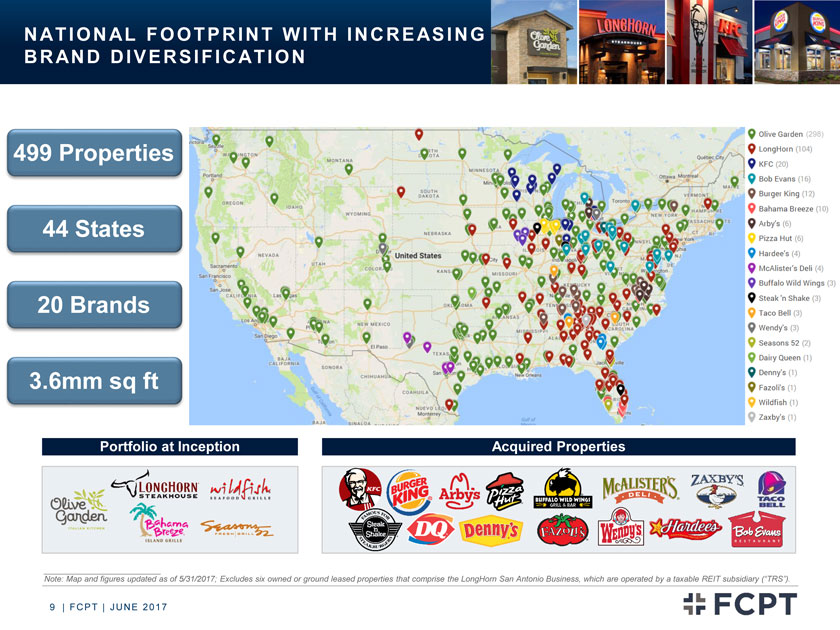
N AT I O N AL F O O T P R I N T W I T H I N C R E AS I N G B R AN D D I V E R S I F I C AT I O N 499 Properties 44 States 20 Brands 3.6mm sq ft (298) Portfolio at Inception Acquired Properties Note: Map and figures updated as of 5/31/2017; Excludes six owned or ground leased properties that comprise the LongHorn San Antonio Business, which are operated by a taxable REIT subsidiary (“TRS”). 9 | F C P T | J U N E 2 0 1 7
|
|
AG E N D A Company Overview and Update Page 3 Key Investment Highlights Page 10 Diversification and Acquisition Strategy Page 15 Financial Update & Key Credit Strengths Page 22 10 | F C P T | J U N E 2 0 1 7
|
|
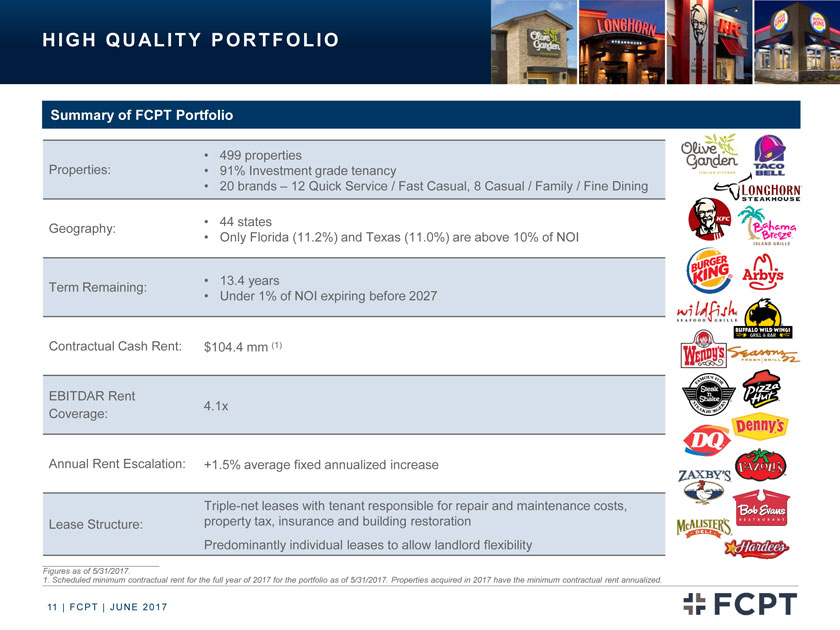
H I G H Q U AL I T Y P O R T F O L I O Summary of FCPT Portfolio Properties: 499 properties 91% Investment grade tenancy 20 brands – 12 Quick Service / Fast Casual, 8 Casual / Family / Fine Dining Geography: 44 states Only Florida (11.2%) and Texas (11.0%) are above 10% of NOI Term Remaining: 13.4 years Under 1% of NOI expiring before 2027 Contractual Cash Rent: $104.4 mm (1) EBITDAR Rent Coverage: 4.1x Annual Rent Escalation: +1.5% average fixed annualized increase Lease Structure: Triple-net leases with tenant responsible for repair and maintenance costs, property tax, insurance and building restoration Predominantly individual leases to allow landlord flexibility Figures as of 5/31/2017. 1. Scheduled minimum contractual rent for the full year of 2017 for the portfolio as of 5/31/2017. Properties acquired in 2017 have the minimum contractual rent annualized. 11 | F C P T | J U N E 2 0 1 7
|
|
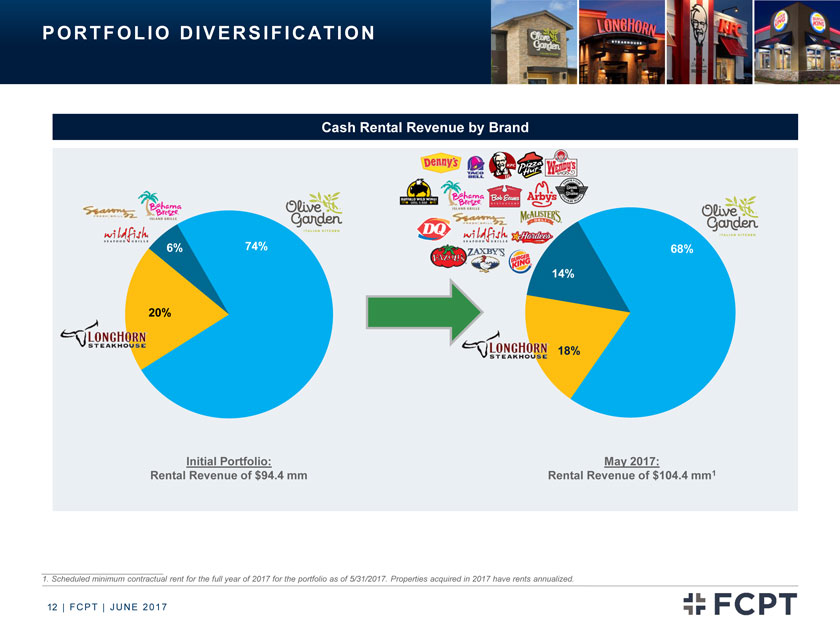
P O R T F O L I O D I V E R S I F I C AT I O N Cash Rental Revenue by Brand 6% 74% 68% 14% 20% 18% Initial Portfolio: May 2017: Rental Revenue of $94.4 mm Rental Revenue of $104.4 mm1 1. Scheduled minimum contractual rent for the full year of 2017 for the portfolio as of 5/31/2017. Properties acquired in 2017 have rents annualized. 12 | F C P T | J U N E 2 0 1 7
|
|
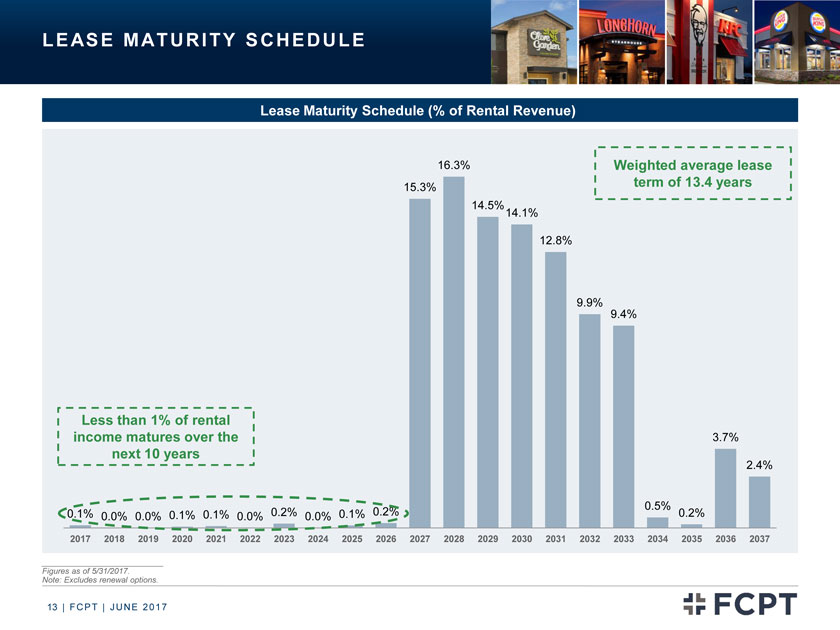
L E AS E M AT U R I T Y S C H E D U L E Lease Maturity Schedule (% of Rental Revenue) 16.3% Weighted average lease 15.3% term of 13.4 years 14.5% 14.1% 12.8% 9.9% 9.4% Less than 1% of rental income matures over the 3.7% next 10 years 2.4% 0.5% 0.1% 0.0% 0.0% 0.1% 0.1% 0.0% 0.2% 0.0% 0.1% 0.2% 0.2% 2017 2018 2019 2020 2021 2022 2023 2024 2025 2026 2027 2028 2029 2030 2031 2032 2033 2034 2035 2036 2037 Figures as of 5/31/2017. Note: Excludes renewal options. 13 | F C P T | J U N E 2 0 1 7
|
|
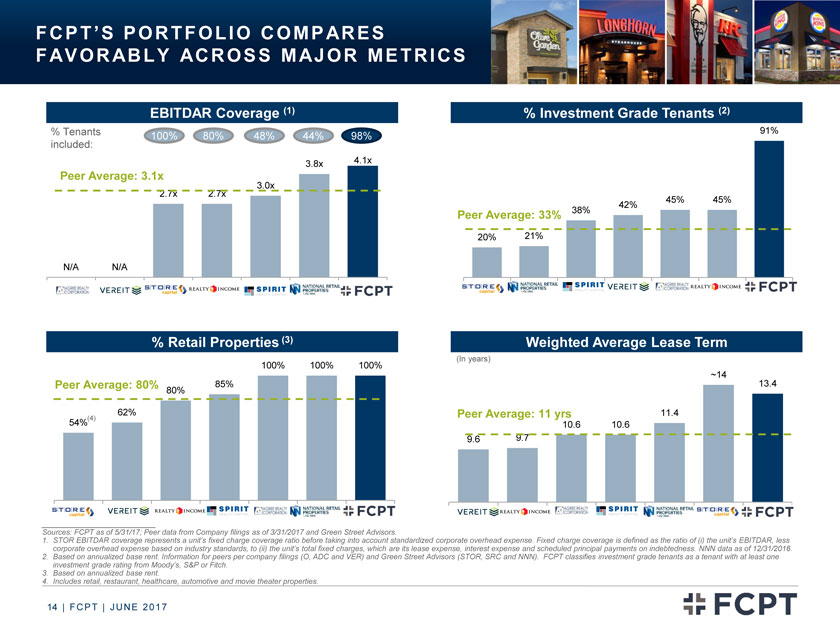
F C P T ’ S P O R T F O L I O C O M P AR E S F AV O R AB L Y AC R O S S M AJ O R M E T R I C S EBITDAR Coverage (1) % Tenants 100% 80% 48% 44% 98% included: 3.8x 4.1x Peer Average: 3.1x 2.7x 2.7x 3.0x N/A N/A VEREIT STORE Realty Spirit N % Investment Grade Tenants (2) 91% 45% 45% 42% Peer Average: 33% 38% 20% 21% STOR SRC VER O % Retail Properties (3) 100% 100% 100% Peer Average: 80% 85% 80% 62% (4) 54% STOR VER O SRC Weighted Average Lease Term (In years) ~14 13.4 Peer Average: 11 yrs 11.4 10.6 10.6 9.6 9.7 VER O ADC SRC STOR Sources: FCPT as of 5/31/17; Peer data from Company filings as of 3/31/2017 and Green Street 1. STOR EBITDAR coverage represents a unit’s fixed charge coverage ratio before taking i corporate overhead expense. Fixed charge coverage is defined as the ratio of (i) the unit’s EBITDAR, less corporate overhead expense based on industry standards, to (ii) the unit’s total fixed charges, pense, interest expense and scheduled principal payments on indebtedness. NNN data as of 12/31/2016. 2. Based on annualized base rent. Information for peers per company filings (O, ADC and sors (STOR, SRC and NNN). FCPT classifies investment grade tenants as a tenant with at least one investment grade rating from Moody’s, S&P or Fitch. 3. Based on annualized base rent. 4. Includes retail, restaurant, healthcare, automotive and movie theater properties. 14 | F C P T | J U N E 2 0 1 7
|
|
AG E N D A Company Overview and Update Page 3 Key Investment Highlights Page 10 Diversification and Acquisition Strategy Page 15 Financial Update & Key Credit Strengths Page 22 15 | F C P T | J U N E 2 0 1 7
|
|
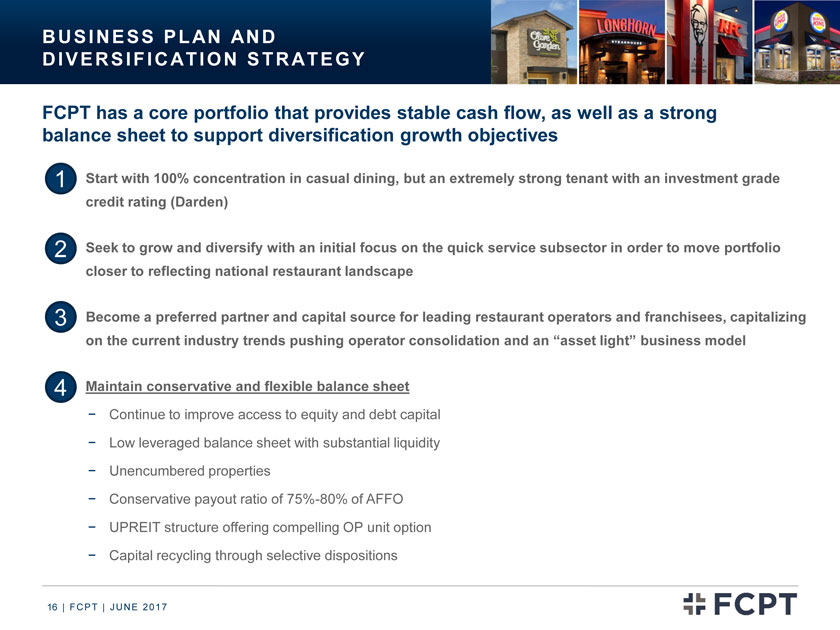
B U S I N E S S P L AN AN D D I V E R S I F I C AT I O N S T R AT E G Y FCPT has a core portfolio that provides stable cash flow, as well as a strong balance sheet to support diversification growth objectives 1? Start with 100% concentration in casual dining, but an extremely strong tenant with an investment grade credit rating (Darden) 2? Seek to grow and diversify with an initial focus on the quick service subsector in order to move portfolio closer to reflecting national restaurant landscape 3? Become a preferred partner and capital source for leading restaurant operators and franchisees, capitalizing on the current industry trends pushing operator consolidation and an “asset light” business model 4? Maintain conservative and flexible balance sheet—Continue to improve access to equity and debt capital—Low leveraged balance sheet with substantial liquidity—Unencumbered properties—Conservative payout ratio of 75%-80% of AFFO—UPREIT structure offering compelling OP unit option—Capital recycling through selective dispositions 16 | F C P T | J U N E 2 0 1 7
|
|
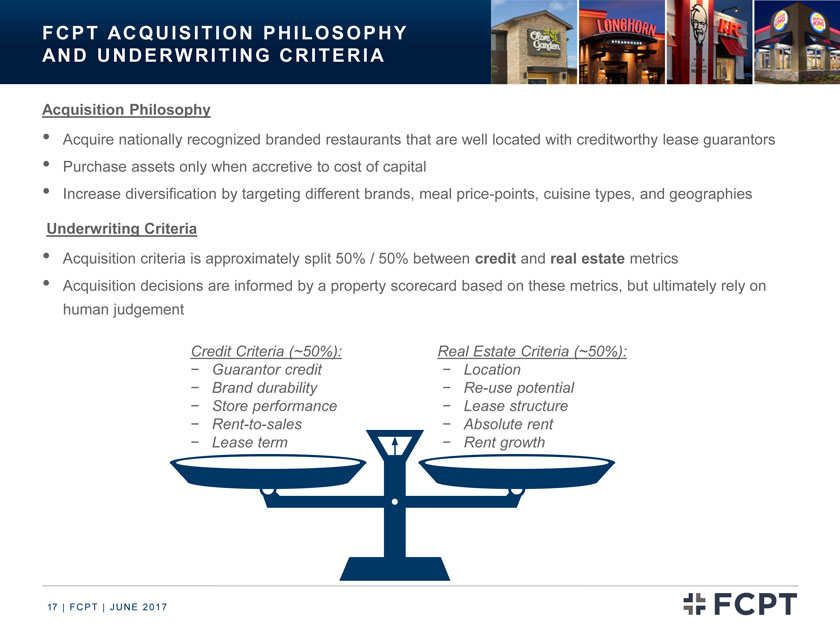
F C P T AC Q U I S I T I O N P H I L O S O P H Y AN D U N D E R W RI T I N G C R I T E R I A Acquisition Philosophy • Acquire nationally recognized branded restaurants that are well located with creditworthy lease guarantors • Purchase assets only when accretive to cost of capital • Increase diversification by targeting different brands, meal price-points, cuisine types, and geographies Underwriting Criteria • Acquisition criteria is approximately split 50% / 50% between credit and real estate metrics • Acquisition decisions are informed by a property scorecard based on these metrics, but ultimately rely on human judgement Credit Criteria (~50%): Real Estate Criteria (~50%):—Guarantor credit—Location—Brand durability—Re-use potential—Store performance—Lease structure—Rent-to-sales—Absolute rent—Lease term—Rent growth 17 | F C P T | J U N E 2 0 1 7
|
|
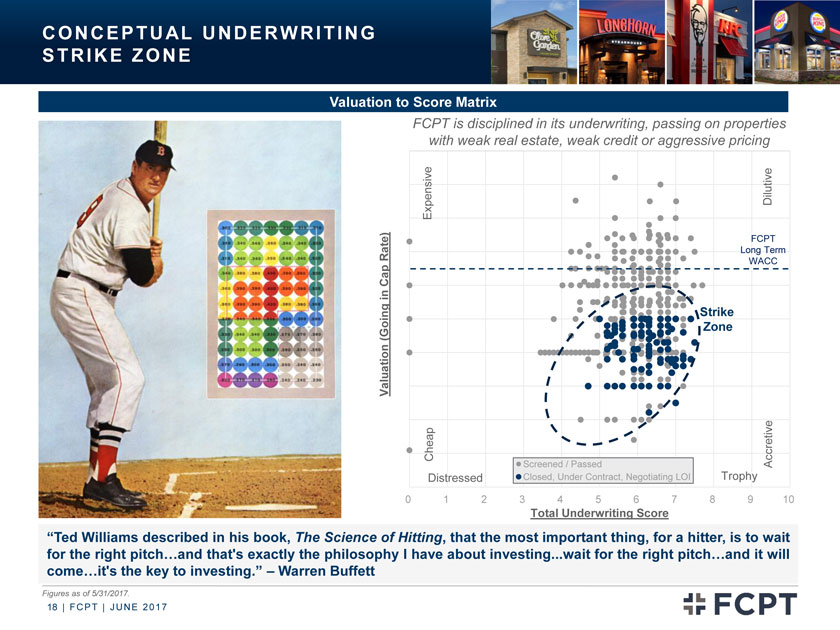
C O N C E P T U AL U N D E R W RI T I N G S T R I K E Z O N E Valuation to Score Matrix FCPT is disciplined in its underwriting, passing on properties with weak real estate, weak credit or aggressive pricing Expensive Dilutive FCPT Rate) Long Term Cap WACC in Strike (Going Zone Valuation Cheap Screened / Passed Accretive Distressed Closed, Under Contract, Negotiating LOI Trophy 0 1 2 3 4 5 6 7 8 9 10 Total Underwriting Score “Ted Williams described in his book, The Science of Hitting, that the most important thing, for a hitter, is to wait for the right pitch…and that’s exactly the philosophy I have about investing.wait for the right pitch…and it will come…it’s the key to investing.” – Warren Buffett Figures as of 5/31/2017. 18 | F C P T | J U N E 2 0 1 7
|
|
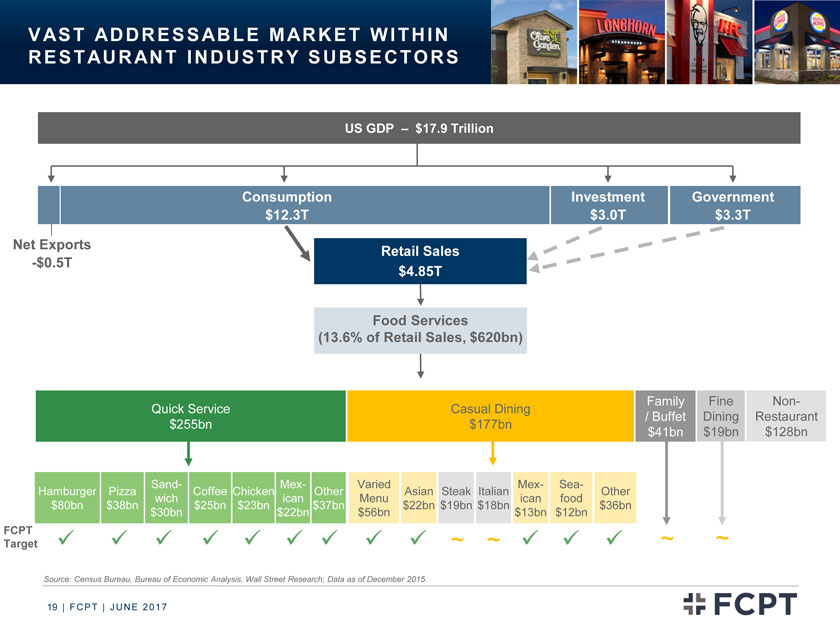
V AS T AD D R E S S AB L E M AR K E T W I T H I N R E S T AU R AN T I N D U S T R Y S U B S E CT O R S US GDP – $17.9 Trillion Consumption Investment Government $12.3T $3.0T $3.3T Net Exports Retail Sales -$0.5T $4.85T Food Services (13.6% of Retail Sales, $620bn) Family Fine Non-Quick Service Casual Dining / Buffet Dining Restaurant $255bn $177bn $41bn $19bn $128bn Sand- Mex- Varied Mex- Sea- Hamburger Pizza Coffee Chicken Other Asian Steak Italian Other wich ican Menu ican food $80bn $38bn $25bn $23bn $37bn $22bn $19bn $18bn $36bn $30bn $22bn $56bn $13bn $12bn FCPT ~ ~ Target ? ? ? ? ? ? ? ? ? ~ ~ ? ? ? Source: Census Bureau, Bureau of Economic Analysis, Wall Street Research; Data as of December 2015. 19 | F C P T | J U N E 2 0 1 7
|
|
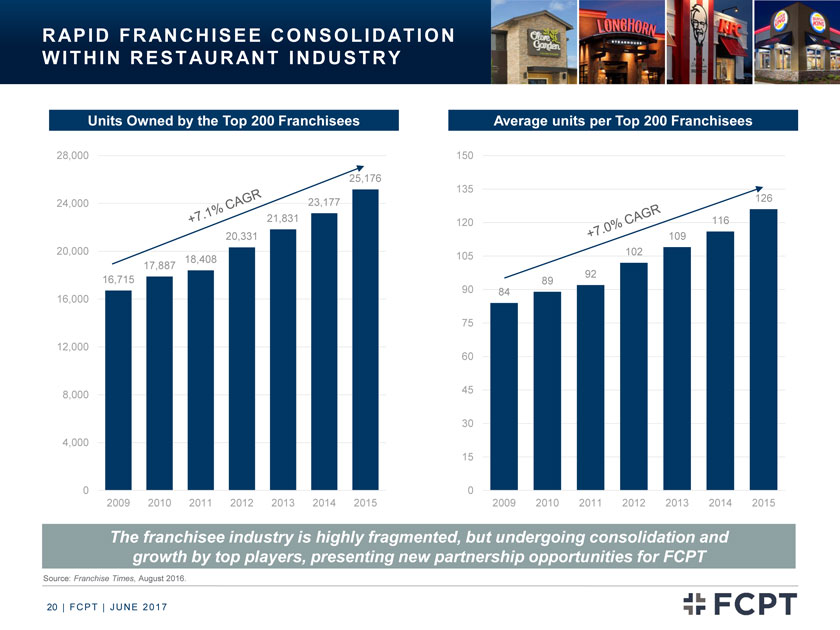
R AP I D F R AN C H I S E E C O N S O L I D AT I O N W I T H I N R E S T AU R AN T I N D U S T R Y Units Owned by the Top 200 Franchisees 28,000 25,176 24,000 23,177 21,831 20,331 20,000 18,408 17,887 16,715 16,000 12,000 8,000 4,000 0 2009 2010 2011 2012 2013 2014 2015 Average units per Top 200 Franchisees 150 135 126 120 116 109 105 102 92 90 89 84 75 60 45 30 15 0 2009 2010 2011 2012 2013 2014 2015 The franchisee industry is highly fragmented, but undergoing consolidation and growth by top players, presenting new partnership opportunities for FCPT Source: Franchise Times, August 2016. 20 | F C P T | J U N E 2 0 1 7
|
|
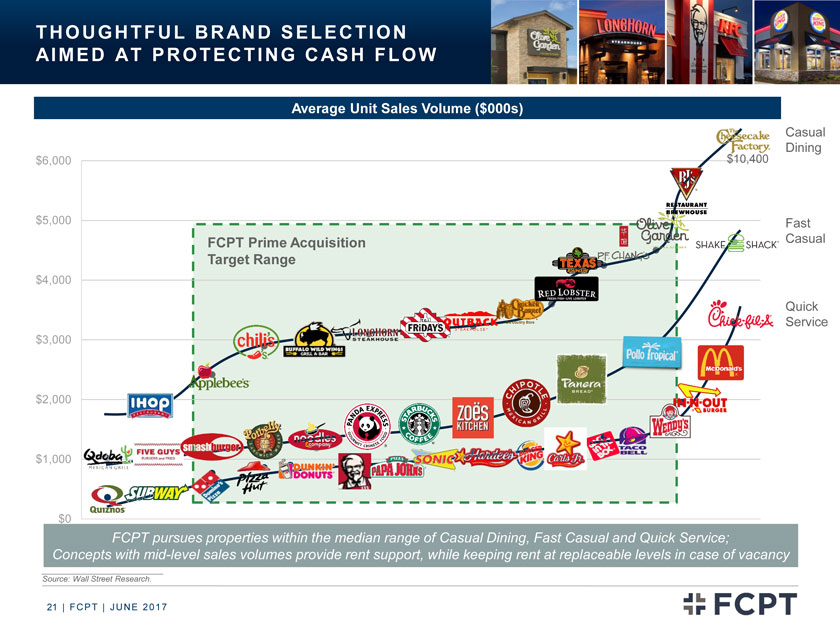
T H O U G H T F U L B R AN D S E L E C T I O N AI M E D AT P R O T E C T I N G C AS H F L O W Average Unit Sales Volume ($000s) Casual Dining $6,000 $10,400 $5,000 Fast FCPT Prime Acquisition Casual Target Range $4,000 Quick Service $3,000 $2,000 $1,000 $0 FCPT pursues properties within the median range of Casual Dining, Fast Casual and Quick Service; Concepts with mid-level sales volumes provide rent support, while keeping rent at replaceable levels in case of vacancy Source: Wall Street Research. 21 | F C P T | J U N E 2 0 1 7
|
|
AG E N D A Company Overview and Update Page 3 Key Investment Highlights Page 10 Diversification and Acquisition Strategy Page 15 Financial Update & Key Credit Strengths Page 22 22 | F C P T | J U N E 2 0 1 7
|
|
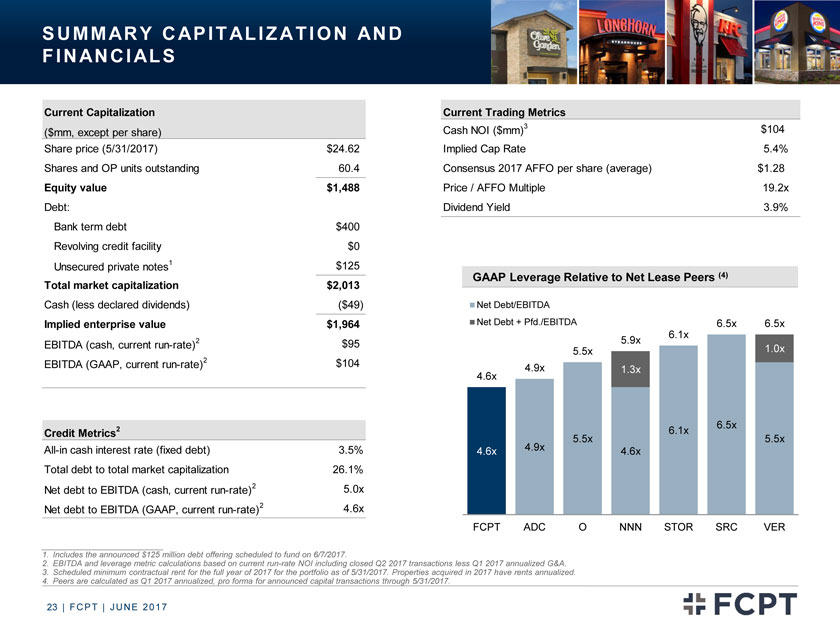
S U M M AR Y C AP I T AL I Z AT I O N AN D F I N AN C I AL S Current Capitalization ($mm, except per share) Share price (5/31/2017) $24.62 Shares and OP units outstanding 60.4 Equity value $1,488 Debt: Bank term debt $400 Revolving credit facility $0 Unsecured private notes1 $125 Total market capitalization $2,013 Cash (less declared dividends)($49) Implied enterprise value $1,964 EBITDA (cash, current run-rate)2 $95 EBITDA (GAAP, current run-rate)2 $104 Credit Metrics2 All-in cash interest rate (fixed debt) 3.5% Total debt to total market capitalization 26.1% Net debt to EBITDA (cash, current run-rate)2 5.0x Net debt to EBITDA (GAAP, current run-rate)2 4.6x Current Trading Metrics Cash NOI ($mm)3 $104 Implied Cap Rate 5.4% Consensus 2017 AFFO per share (average) $1.28 Price / AFFO Multiple 19.2x Dividend Yield 3.9% GAAP Leverage Relative to Net Lease Peers (4) Net Debt/EBITDA Net Debt + Pfd./EBITDA 6.5x 6.5x 6.1x 5.9x 5.5x 1.0x 4.9x 1.3x 4.6x 6.5x 6.1x 5.5x 5.5x 4.6x 4.9x 4.6x FCPT ADC O NNN STOR SRC VER 1. Includes the announced $125 million debt offering scheduled to fund on 6/7/2017. 2. EBITDA and leverage metric calculations based on current run-rate NOI including closed Q2 2017 transactions less Q1 2017 annualized G&A. 3. Scheduled minimum contractual rent for the full year of 2017 for the portfolio as of 5/31/2017. Properties acquired in 2017 have rents annualized. 4. Peers are calculated as Q1 2017 annualized, pro forma for announced capital transactions through 5/31/2017. 23 | F C P T | J U N E 2 0 1 7
|
|
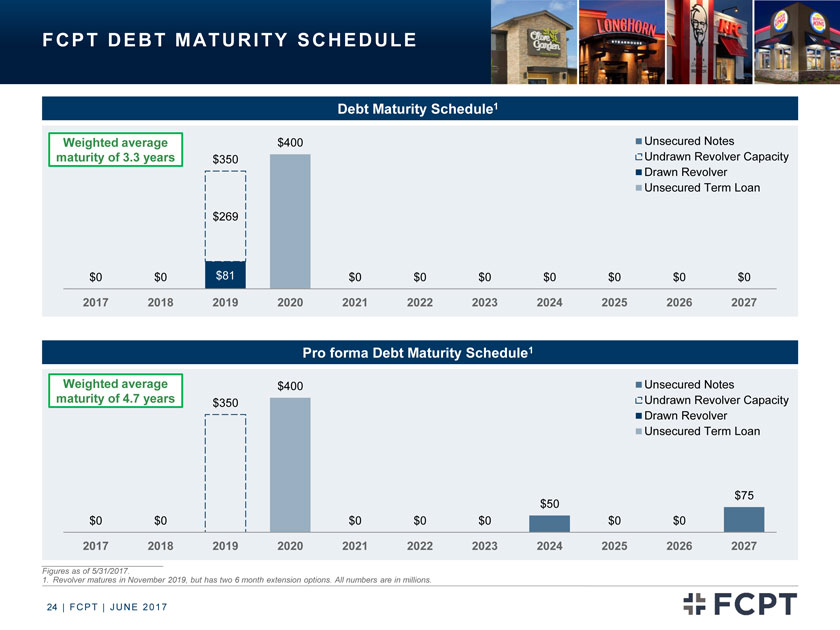
F C P T D E B T M AT U R I T Y S C H E D UL E Weighted average $400 Unsecured Notes maturity of 3.3 years $350 Undrawn Revolver Capacity Drawn Revolver Unsecured Term Loan $269 $0 $0 $81 $0 $0 $0 $0 $0 $0 $0 2017 2018 2019 2020 2021 2022 2023 2024 2025 2026 2027 Pro forma Debt Maturity Schedule1 Weighted average $400 Unsecured Notes maturity of 4.7 years $350 Undrawn Revolver Capacity Drawn Revolver Unsecured Term Loan $75 $50 $0 $0 $0 $0 $0 $0 $0 2017 2018 2019 2020 2021 2022 2023 2024 2025 2026 2027 Figures as of 5/31/2017. 1. Revolver matures in November 2019, but has two 6 month extension options. All numbers are in millions. 24 | F C P T | J U N E 2 0 1 7
|
|
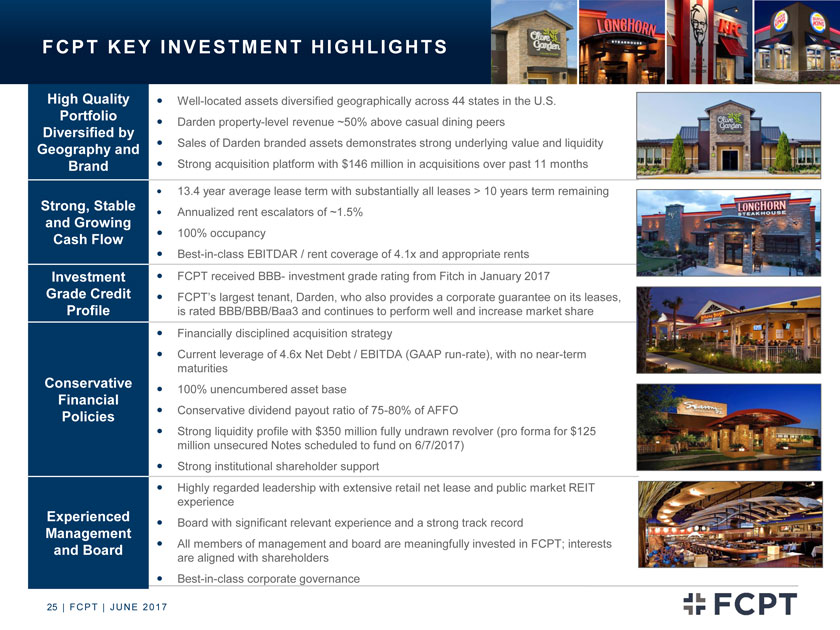
F C P T K E Y I N V E S T M EN T H I G H L I G H T S F C P T K E Y I N V E S T M EN T H I G H L I G H T S High Quality Portfolio Diversified by Geography and Brand Well-located assets diversified geographically across 44 states in the U.S. Darden property-level revenue ~50% above casual dining peers Sales of Darden branded assets demonstrates strong underlying value and liquidity Strong acquisition platform with $146 million in acquisitions over past 11 months Strong, Stable and Growing Cash Flow 13.4 year average lease term with substantially all leases > 10 years term remaining Annualized rent escalators of ~1.5% 100% occupancy Best-in-class EBITDAR / rent coverage of 4.1x and appropriate rents Investment Grade Credit Profile FCPT received BBB- investment grade rating from Fitch in January 2017 FCPT’s largest tenant, Darden, who also provides a corporate guarantee on its leases, is rated BBB/BBB/Baa3 and continues to perform well and increase market share Conservative Financial Policies Financially disciplined acquisition strategy Current leverage of 4.6x Net Debt / EBITDA (GAAP run-rate), with no near-term maturities 100% unencumbered asset base Conservative dividend payout ratio of 75-80% of AFFO Strong liquidity profile with $350 million fully undrawn revolver (pro forma for $125 million unsecured Notes scheduled to fund on 6/7/2017) Strong institutional shareholder support Experienced Management and Board Highly regarded leadership with extensive retail net lease and public market REIT experience Board with significant relevant experience and a strong track record All members of management and board are meaningfully invested in FCPT; interests are aligned with shareholders Best-in-class corporate governance 25 | F C P T | J U N E 2 0 1 7
|
|
F O U R C O R N E R S P R O P E R T Y T R U S T N Y S E : F C P T