Attached files
| file | filename |
|---|---|
| 8-K - FORM 8-K 5-31-2017 - Sprague Resources LP | f8-kmlpa.htm |

1
Sprague Resources LP
MLPA Conference
May 31, 2017
Exhibit 99.1
2
Safe Harbor
This presentation contains unaudited quarterly results which should not be taken as an indication of the results of operations to be reported for
any subsequent period or for the full fiscal year.
Forward-Looking Statements: Some of the statements in this presentation may contain forward-looking statements within the meaning of the
safe harbor provisions of the U.S. Private Securities Litigation Reform Act of 1995. Forward-looking statements can be identified by words such
as “may,” “assume,” “forecast,” “position,” “predict,” “strategy,” “expect,” “intend,” “plan,” “estimate,” “anticipate,” “believe,” “will,” “project,” “budget,”
“potential,” or “continue,” and similar references to future periods. However, the absence of these words does not mean that a statement is not
forward looking. Descriptions of our objectives, goals, plans, projections, estimates, anticipated capital expenditures, cost savings, strategy for
customer retention and strategy for risk management and other statements of future events or conditions are also forward looking statements.
Forward-looking statements are neither historical facts nor assurances of future performance. Instead, they are based only on our current beliefs,
expectations and assumptions regarding the future of our business, future plans and strategies, projections, anticipated events and trends, the
economy and other future conditions. Our actual future results and financial condition may differ materially from those indicated in the forward-
looking statements. These forward-looking statements involve risks and uncertainties and other factors that are difficult to predict and many of
which are beyond management’s control. Therefore, you should not rely on any of these forward-looking statements. Important factors that could
cause our actual results and financial condition to differ materially from those indicated in the forward-looking statements include, but are not
limited to, increased competition for our products or services; changes in supply or demand for our products; changes in operating conditions and
costs; challenges in integrating acquired assets; changes in the level of environmental remediation spending; potential equipment malfunction;
potential labor issues; the legislative or regulatory environment; terminal construction repair/delays; nonperformance by major customers or
suppliers; litigation, and political, economic and capital market conditions, including the impact of potential terrorist acts and international
hostilities. For a more detailed description of these and other risks and uncertainties, please see the “Risk Factors” section in our most recent
Annual Report on Form 10-K and/or most recent Form10-Q, Form 8-K and other items filed with the U.S. Securities and Exchange Commission
“SEC” and also available in the “Investor Relations” section of our website www.spragueenergy.com.
Any forward-looking statement made by us in this presentation is based only on information currently available to us and speaks only as of the
date of this presentation. We undertake no obligation to publicly update any forward-looking statement, whether written or oral, that may be made
from time to time, whether as a result of new information, future developments or otherwise.
Non-GAAP Measures: In this presentation, and in statements we make in connection with this presentation, we refer to certain historical and
forward looking financial measures not prepared in accordance with U.S. generally accepted accounting principles, or GAAP. Non-GAAP
measures include adjusted gross margin, EBITDA, adjusted EBITDA, distributable cash flow, coverage ratio, permanent leverage ratio, and
liquidity. For more information on the non-GAAP measures used in this presentation, including reconciliations with comparable GAAP financial
measures, please refer to the Non-GAAP Measures in the Appendix at the end of this presentation.
3
Sprague Overview
(1)
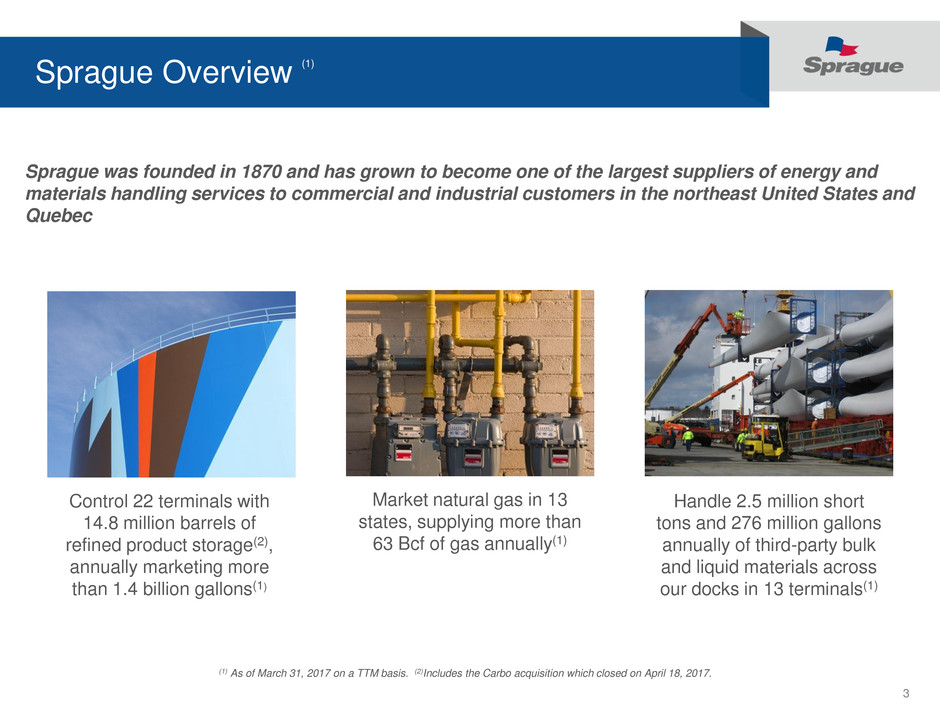
Sprague was founded in 1870 and has grown to become one of the largest suppliers of energy and
materials handling services to commercial and industrial customers in the northeast United States and
Quebec
Control 22 terminals with
14.8 million barrels of
refined product storage(2),
annually marketing more
than 1.4 billion gallons(1)
(1) As of March 31, 2017 on a TTM basis. (2)Includes the Carbo acquisition which closed on April 18, 2017.
Market natural gas in 13
states, supplying more than
63 Bcf of gas annually(1)
Handle 2.5 million short
tons and 276 million gallons
annually of third-party bulk
and liquid materials across
our docks in 13 terminals(1)
4
Sprague Overview
Since going public in October 2013, we’ve:
− Grown distributions for 12 consecutive quarters at a double-digit annual pace
− Closed on 9 acquisitions across 3 business lines, representing over $400
million in committed capital
o No external equity raise
o While maintaining permanent leverage(1) below 3x
− Maintained a TTM Distribution Coverage Ratio(1) above 1.5x
− Outperformed the Alerian MLP index in all 14 quarters
(1) Permanent Leverage and Distribution Coverage Ratio are a Non-GAAP financial measure. Please see Appendix for presentation of the most comparable GAAP financial measure and Non-GAAP reconciliations.
5
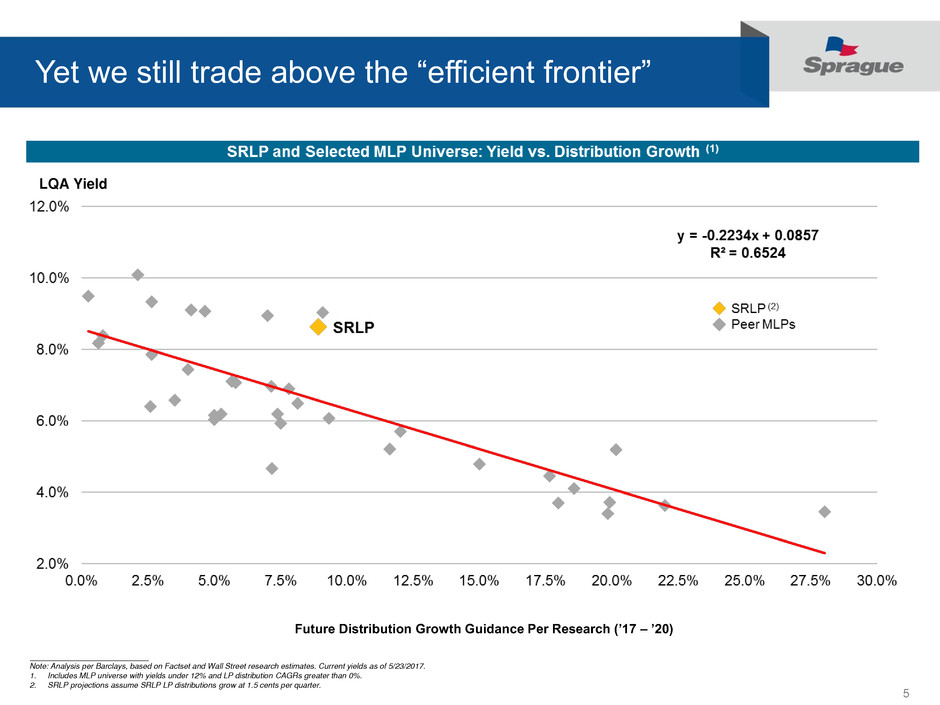
Yet we still trade above the “efficient frontier”
LQA Yield
___________________________
Note: Analysis per Barclays, based on Factset and Wall Street research estimates. Current yields as of 5/23/2017.
1. Includes MLP universe with yields under 12% and LP distribution CAGRs greater than 0%.
2. SRLP projections assume SRLP LP distributions grow at 1.5 cents per quarter.
Future Distribution Growth Guidance Per Research (’17 – ’20)

6
Our distribution coverage is healthy…
(1) Source: BAML / Wall Street estimates of Expected Distribution Coverage for 2017.. Market data as of March 31, 2017. Refined Products includes ARCX, BKEP, BPL, DKL, GEL, HEP, MMLP, MPLX, NS, PBFX, PSXP, RRMS, TLLP, TLP, VLP,
VTTI, WNRL, and WPT; Wholesale Distribution includes CAPL, GLP, SRLP and SUN; Propane includes APU, SPH and FGP. Based on annualized latest announced quarterly distribution.
(2) Distribution Coverage is a Non-GAAP financial measure. Please see Appendix for presentation of the most comparable GAAP financial measure and Non-GAAP reconciliations.
(3) GLP excludes non-recurring charges related to lease exist and early termination, and impairment of goodwill and long-lived assets.
1.2x 1.2x
0.8x
1.6x
0.0
0.2
0.4
0.6
0.8
1.0
1.2
1.4
1.6
1.8
Refined Products
MLPs
Wholesale
Distribution MLPs
Propane MLPs SRLP
TTM Distribution Coverage(1)(2)
vs. MLP Sectors
1.9x(3)
0.9x
1.2x
1.1x
0.6x
1.4x
1.6x
0.0
0.2
0.4
0.6
0.8
1.0
1.2
1.4
1.6
1.8
2.0
GLP CAPL ARCX BPL SPH TLP SRLP
TTM Distribution Coverage(1)(2) vs. Direct Peers

7
…and our Leverage remains low
(1) Source: BAML. Company disclosures and FactSet as March 31, 2017. Refined Products includes ARCX, BKEP, BPL, DKL, GEL, HEP, MMLP, MPLX, NS, PBFX, PSXP, RRMS, TLLP, TLP, VLP, VTTI, WNRL, and WPT; Wholesale Distribution
includes CAPL, GLP, SRLP and SUN; Propane includes APU, SPH and FGP. Excludes working capital revolving credit facility balances for GLP and SLRP.
3.8x
4.2x
4.9x
2.6x
0.0
1.0
2.0
3.0
4.0
5.0
6.0
Refined Products
MLPs
Wholesale
Distribution MLPs
Propane MLPs SRLP
Leverage(1) vs. MLP Sectors
4.2x 4.1x 4.0x
4.2x
4.9x
2.7x 2.6x
0.0
1.0
2.0
3.0
4.0
5.0
6.0
GLP CAPL ARCX BPL SPH TLP SRLP
Leverage(1) vs. Direct Peers
8
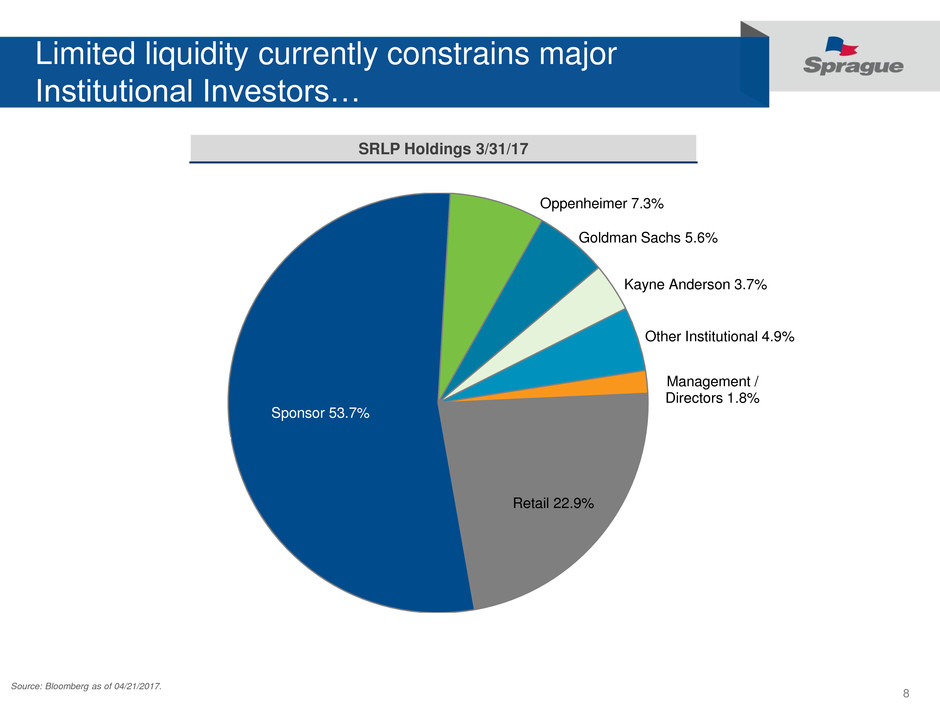
Sponsor 53.7%
Oppenheimer 7.3%
Goldman Sachs 5.6%
Kayne Anderson 3.7%
Other Institutional 4.9%
Management /
Directors 1.8%
Retail 22.9%
Limited liquidity currently constrains major
Institutional Investors…
Source: Bloomberg as of 04/21/2017.
SRLP Holdings 3/31/17

9
…though SRLP continues to demonstrate a
compelling Total Return outlook
(1) Source: BAML. Market data as of March 31, 2017. Total Return is based on Current Yield and 3-Year Expected Growth CAGR. Yield based on annualized latest announced quarterly distribution. CAGR calculated based on LQA - Q4 2019E
distributions. Refined Products includes ARCX, BKEP, BPL, DKL, GEL, HEP, MMLP, MPLX, NS, PBFX, PSXP, RRMS, TLLP, TLP, VLP, VTTI, WNRL, and WPT; Wholesale Distribution includes CAPL, GLP, SRLP and SUN; Propane includes APU, SPH
and FGP.
11.7%
10.1%
8.6%
16.9%
7.3%
9.5%
8.6% 8.7%
4.4%
0.6%
0.0%
8.2%
0%
3%
6%
9%
12%
15%
18%
Refined Products
MLPs
Wholesale
Distribution MLPs
Propane MLPs SRLP
Total Return(1) vs. MLP Sectors
10.5%
9.7%
14.5%
10.6%
15.0%
12.1%
16.9%
9.3% 9.7%
12.3%
7.5%
15.0%
6.8%
8.7%
1.2%
0.0%
2.2%
3.1%
0.0%
5.3%
8.2%
0%
5%
10%
15%
GLP CAPL ARCX BPL SPH TLP SRLP
Total Return(1) vs. Direct Peers
Yield
3-Year Expected
Growth CAGR
Total Return
10
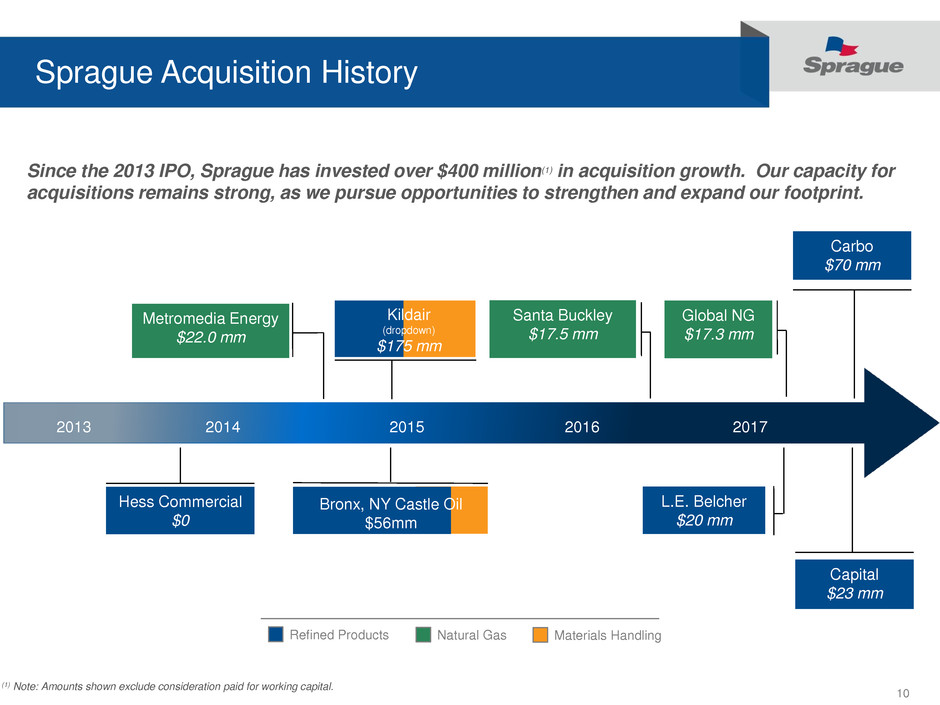
Sprague Acquisition History
2013 2014 2015 2016 2017
Since the 2013 IPO, Sprague has invested over $400 million(1) in acquisition growth. Our capacity for
acquisitions remains strong, as we pursue opportunities to strengthen and expand our footprint.
Refined Products Natural Gas Materials Handling
Metromedia Energy
$22.0 mm
Hess Commercial
$0
Kildair
(dropdown)
$175 mm
(1) Note: Amounts shown exclude consideration paid for working capital.
Santa Buckley
$17.5 mm
Global NG
$17.3 mm
L.E. Belcher
$20 mm
Carbo
$70 mm
Capital
$23 mm
Bronx, NY Castle Oil
$56mm
11
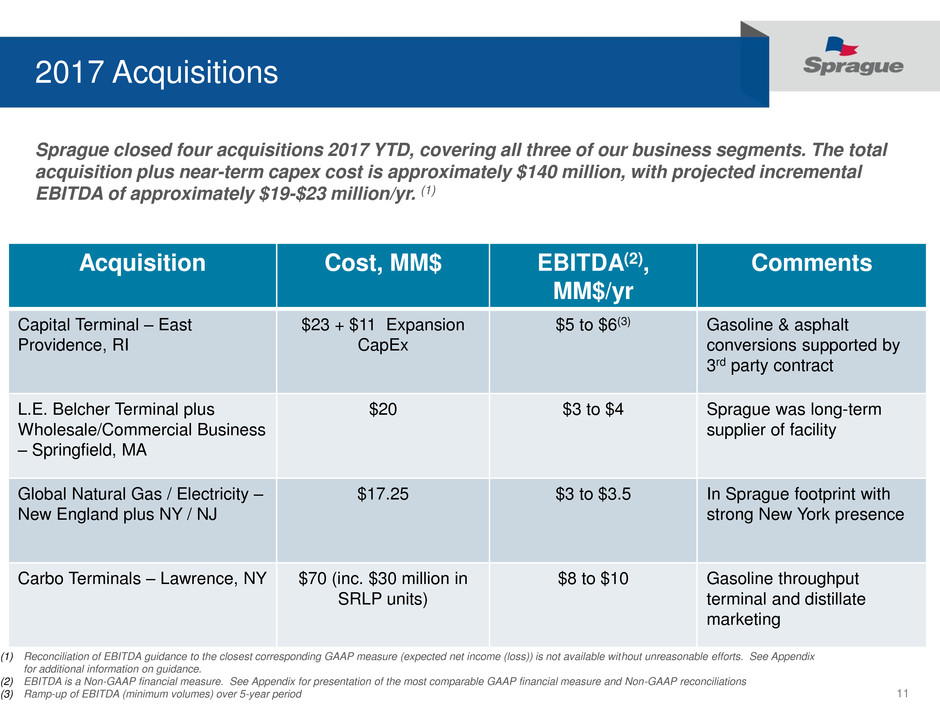
2017 Acquisitions
Sprague closed four acquisitions 2017 YTD, covering all three of our business segments. The total
acquisition plus near-term capex cost is approximately $140 million, with projected incremental
EBITDA of approximately $19-$23 million/yr. (1)
Acquisition Cost, MM$ EBITDA(2),
MM$/yr
Comments
Capital Terminal – East
Providence, RI
$23 + $11 Expansion
CapEx
$5 to $6(3) Gasoline & asphalt
conversions supported by
3rd party contract
L.E. Belcher Terminal plus
Wholesale/Commercial Business
– Springfield, MA
$20 $3 to $4 Sprague was long-term
supplier of facility
Global Natural Gas / Electricity –
New England plus NY / NJ
$17.25 $3 to $3.5 In Sprague footprint with
strong New York presence
Carbo Terminals – Lawrence, NY $70 (inc. $30 million in
SRLP units)
$8 to $10 Gasoline throughput
terminal and distillate
marketing
(1) Reconciliation of EBITDA guidance to the closest corresponding GAAP measure (expected net income (loss)) is not available without unreasonable efforts. See Appendix
for additional information on guidance.
(2) EBITDA is a Non-GAAP financial measure. See Appendix for presentation of the most comparable GAAP financial measure and Non-GAAP reconciliations
(3) Ramp-up of EBITDA (minimum volumes) over 5-year period
12
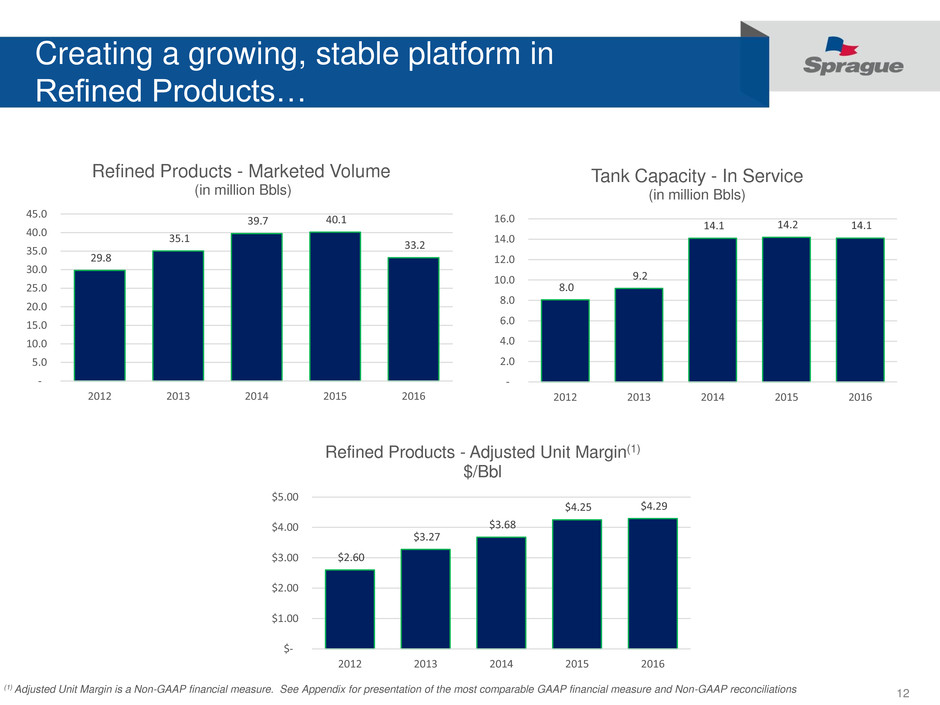
Creating a growing, stable platform in
Refined Products…
29.8
35.1
39.7 40.1
33.2
-
5.0
10.0
15.0
20.0
25.0
30.0
35.0
40.0
45.0
2012 2013 2014 2015 2016
Refined Products - Marketed Volume
(in million Bbls)
$2.60
$3.27
$3.68
$4.25 $4.29
$-
$1.00
$2.00
$3.00
$4.00
$5.00
2012 2013 2014 2015 2016
Refined Products - Adjusted Unit Margin(1)
$/Bbl
8.0
9.2
14.1 14.2 14.1
-
2.0
4.0
6.0
8.0
10.0
12.0
14.0
16.0
2012 2013 2014 2015 2016
Tank Capacity - In Service
(in million Bbls)
(1) Adjusted Unit Margin is a Non-GAAP financial measure. See Appendix for presentation of the most comparable GAAP financial measure and Non-GAAP reconciliations
13
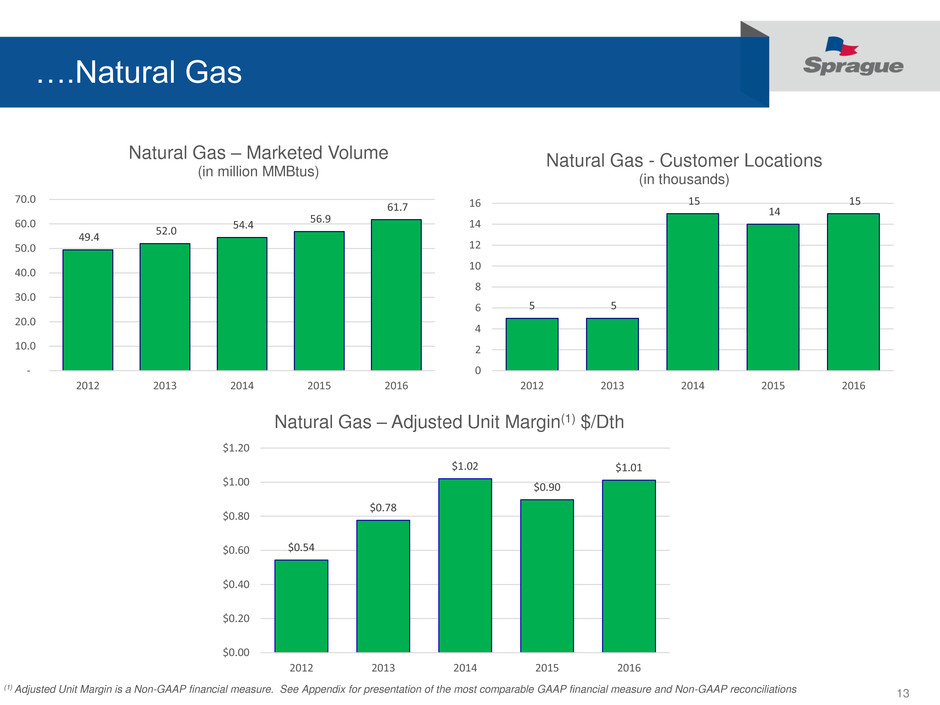
….Natural Gas
49.4
52.0
54.4
56.9
61.7
-
10.0
20.0
30.0
40.0
50.0
60.0
70.0
2012 2013 2014 2015 2016
Natural Gas – Marketed Volume
(in million MMBtus)
5 5
15
14
15
0
2
4
6
8
10
12
14
16
2012 2013 2014 2015 2016
Natural Gas - Customer Locations
(in thousands)
$0.54
$0.78
$1.02
$0.90
$1.01
$0.00
$0.20
$0.40
$0.60
$0.80
$1.00
$1.20
2012 2013 2014 2015 2016
Natural Gas – Adjusted Unit Margin(1) $/Dth
(1) Adjusted Unit Margin is a Non-GAAP financial measure. See Appendix for presentation of the most comparable GAAP financial measure and Non-GAAP reconciliations
14
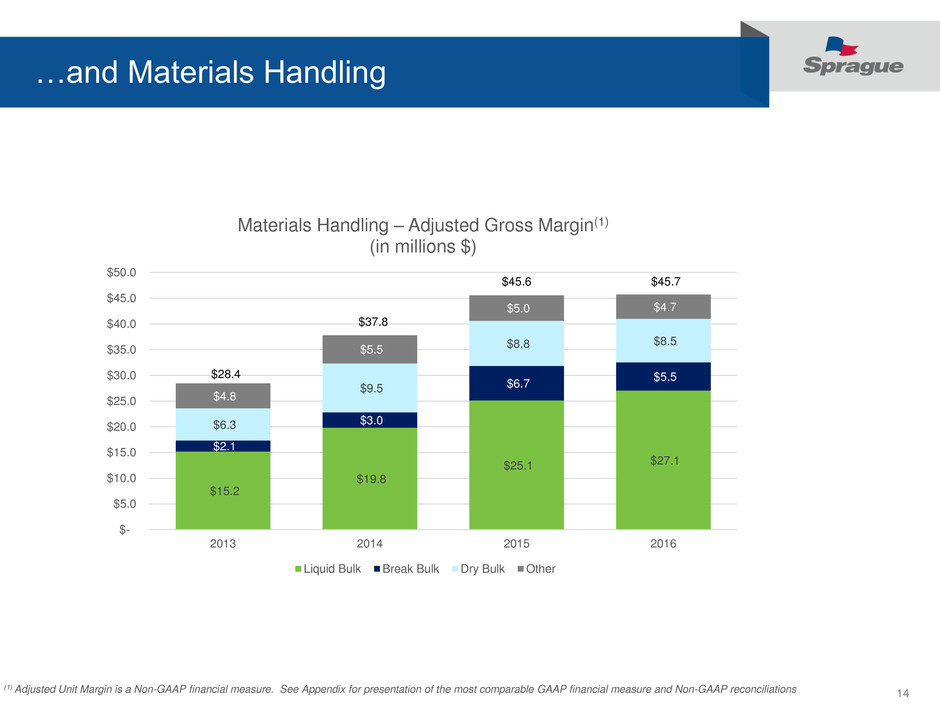
…and Materials Handling
(1) Adjusted Unit Margin is a Non-GAAP financial measure. See Appendix for presentation of the most comparable GAAP financial measure and Non-GAAP reconciliations
$15.2
$19.8
$25.1 $27.1
$2.1
$3.0
$6.7
$5.5
$6.3
$9.5
$8.8 $8.5
$4.8
$5.5
$5.0 $4.7
$-
$5.0
$10.0
$15.0
$20.0
$25.0
$30.0
$35.0
$40.0
$45.0
$50.0
2013 2014 2015 2016
Materials Handling – Adjusted Gross Margin(1)
(in millions $)
Liquid Bulk Break Bulk Dry Bulk Other
$45.7
$28.4
$37.8
$45.6
15
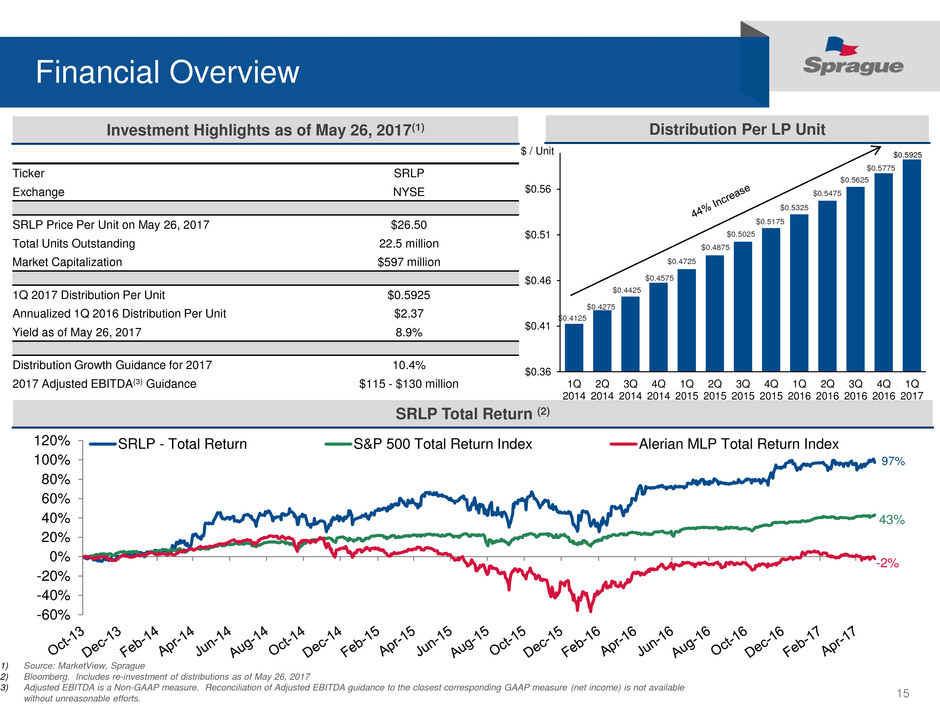
Financial Overview
Distribution Per LP UnitInvestment Highlights as of May 26, 2017(1)
SRLP Total Return (2)
Ticker SRLP
Exchange NYSE
SRLP Price Per Unit on May 26, 2017 $26.50
Total Units Outstanding 22.5 million
Market Capitalization $597 million
1Q 2017 Distribution Per Unit $0.5925
Annualized 1Q 2016 Distribution Per Unit $2.37
Yield as of May 26, 2017 8.9%
Distribution Growth Guidance for 2017 10.4%
2017 Adjusted EBITDA(3) Guidance $115 - $130 million
1) Source: MarketView, Sprague
2) Bloomberg. Includes re-investment of distributions as of May 26, 2017
3) Adjusted EBITDA is a Non-GAAP measure. Reconciliation of Adjusted EBITDA guidance to the closest corresponding GAAP measure (net income) is not available
without unreasonable efforts.
$0.5925
$0.36
$0.41
$0.46
$0.51
$0.56
1Q
2014
2Q
2014
3Q
2014
4Q
2014
1Q
2015
2Q
2015
3Q
2015
4Q
2015
1Q
2016
2Q
2016
3Q
2016
4Q
2016
1Q
2017
$ / Unit
$0.4275
$0.4425
$0.4575
$0.4725
$0.4875
$0.5025
$0.4125
$0.5175
$0.5325
$0.5475
$0.5625
$0.5775
-60%
-40%
-20%
0%
20%
40%
60%
80%
100%
120% SRLP - Total Return S&P 500 Total Return Index Alerian MLP Total Return Index
97%
43%
-2%
16
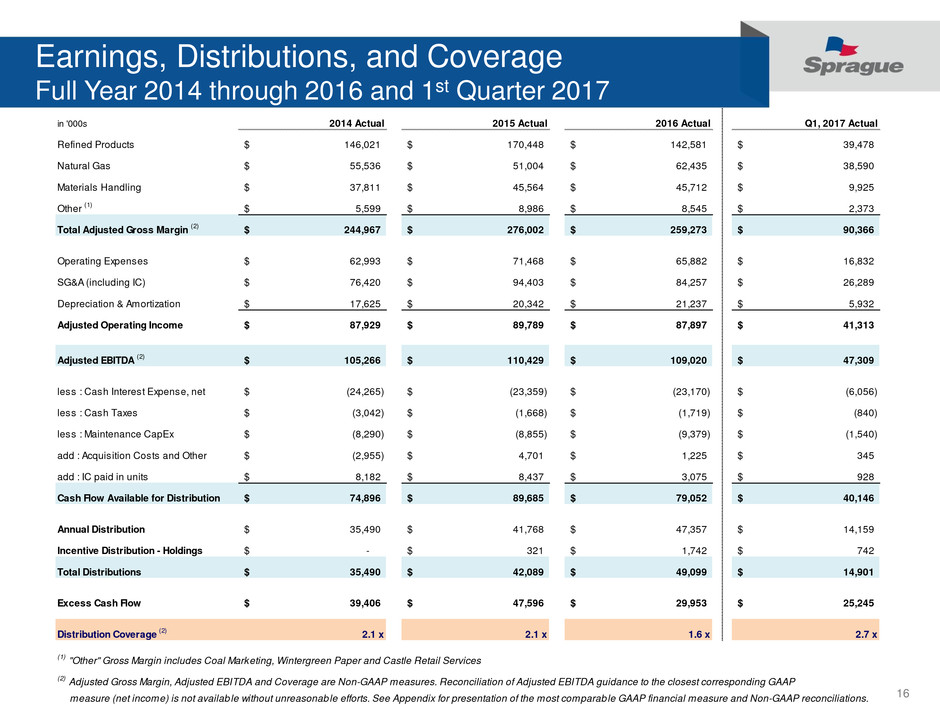
Earnings, Distributions, and Coverage
Full Year 2014 through 2016 and 1st Quarter 2017
in '000s 2014 Actual 2015 Actual 2016 Actual Q1, 2017 Actual
Refined Products 146,021$ 170,448$ 142,581$ 39,478$
Natural Gas 55,536$ 51,004$ 62,435$ 38,590$
Materials Handling 37,811$ 45,564$ 45,712$ 9,925$
Other
(1)
5,599$ 8,986$ 8,545$ 2,373$
Total Adjusted Gross Margin
(2)
244,967$ 276,002$ 259,273$ 90,366$
Operating Expenses 62,993$ 71,468$ 65,882$ 16,832$
SG&A (including IC) 76,420$ 94,403$ 84,257$ 26,289$
Depreciation & Amortization 17,625$ 20,342$ 21,237$ 5,932$
Adjusted Operating Income 87,929$ 89,789$ 87,897$ 41,313$
Adjusted EBITDA
(2)
105,266$ 110,429$ 109,020$ 47,309$
less : Cash Interest Expense, net (24,265)$ (23,359)$ (23,170)$ (6,056)$
less : Cash Taxes (3,042)$ (1,668)$ (1,719)$ (840)$
less : Maintenance CapEx (8,290)$ (8,855)$ (9,379)$ (1,540)$
add : Acquisition Costs and Other (2,955)$ 4,701$ 1,225$ 345$
add : IC paid in units 8,182$ 8,437$ 3,075$ 928$
Cash Flow Available for Distribution 74,896$ 89,685$ 79,052$ 40,146$
Annual Distribution 35,490$ 41,768$ 47,357$ 14,159$
Incentive Distribution - Holdings -$ 321$ 1,742$ 742$
Total Distributions 35,490$ 42,089$ 49,099$ 14,901$
Excess Cash Flow 39,406$ 47,596$ 29,953$ 25,245$
Distribution Coverage
(2)
2.1 x 2.1 x 1.6 x 2.7 x
(1)
"Other" Gross Margin includes Coal Marketing, Wintergreen Paper and Castle Retail Services
(2)
Adjusted Gross Margin, Adjusted EBITDA and Coverage are Non-GAAP measures. Reconciliation of Adjusted EBITDA guidance to the closest corresponding GAAP
measure (net income) is not availab le without unreasonable efforts. See Appendix for presentation of the most comparable GAAP financial measure and Non-GAAP reconciliations.
17
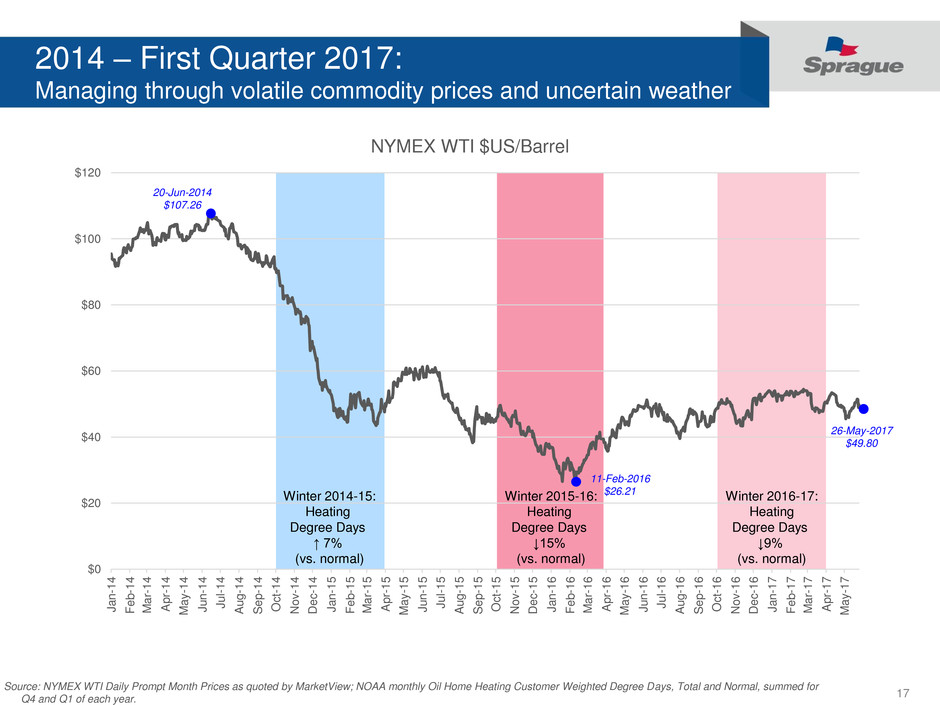
2014 – First Quarter 2017:
Managing through volatile commodity prices and uncertain weather
Winter 2014-15:
Heating
Degree Days
↑ 7%
(vs. normal)
Winter 2015-16:
Heating
Degree Days
↓15%
(vs. normal)
Winter 2016-17:
Heating
Degree Days
↓9%
(vs. normal)
Source: NYMEX WTI Daily Prompt Month Prices as quoted by MarketView; NOAA monthly Oil Home Heating Customer Weighted Degree Days, Total and Normal, summed for
Q4 and Q1 of each year.
$0
$20
$40
$60
$80
$100
$120
J
a
n
-1
4
F
e
b
-1
4
M
a
r-
1
4
A
p
r-
1
4
M
a
y
-1
4
J
u
n
-1
4
J
u
l-
1
4
A
u
g
-1
4
S
e
p
-1
4
O
c
t-
1
4
No
v
-1
4
De
c
-1
4
J
a
n
-1
5
F
e
b
-1
5
M
a
r-
1
5
A
p
r-
1
5
M
a
y
-1
5
J
u
n
-1
5
J
u
l-
1
5
A
u
g
-1
5
S
e
p
-1
5
O
c
t-
1
5
No
v
-1
5
De
c
-1
5
J
a
n
-1
6
F
e
b
-1
6
M
a
r-
1
6
A
p
r-
1
6
M
a
y
-1
6
J
u
n
-1
6
J
u
l-
1
6
A
u
g
-1
6
S
e
p
-1
6
O
c
t-
1
6
No
v
-1
6
De
c
-1
6
J
a
n
-1
7
F
e
b
-1
7
M
a
r-
1
7
A
p
r-
1
7
M
a
y
-1
7
NYMEX WTI $US/Barrel
20-Jun-2014
$107.26
11-Feb-2016
$26.21
26-May-2017
$49.80
18
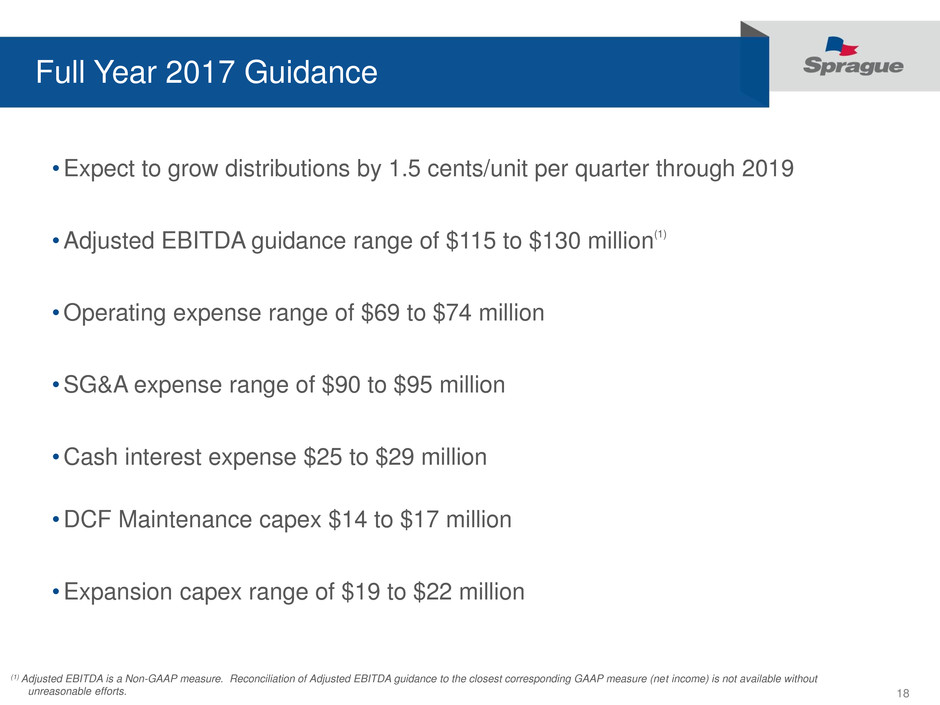
Full Year 2017 Guidance
•Expect to grow distributions by 1.5 cents/unit per quarter through 2019
•Adjusted EBITDA guidance range of $115 to $130 million(1)
•Operating expense range of $69 to $74 million
•SG&A expense range of $90 to $95 million
•Cash interest expense $25 to $29 million
•DCF Maintenance capex $14 to $17 million
•Expansion capex range of $19 to $22 million
(1) Adjusted EBITDA is a Non-GAAP measure. Reconciliation of Adjusted EBITDA guidance to the closest corresponding GAAP measure (net income) is not available without
unreasonable efforts.
19
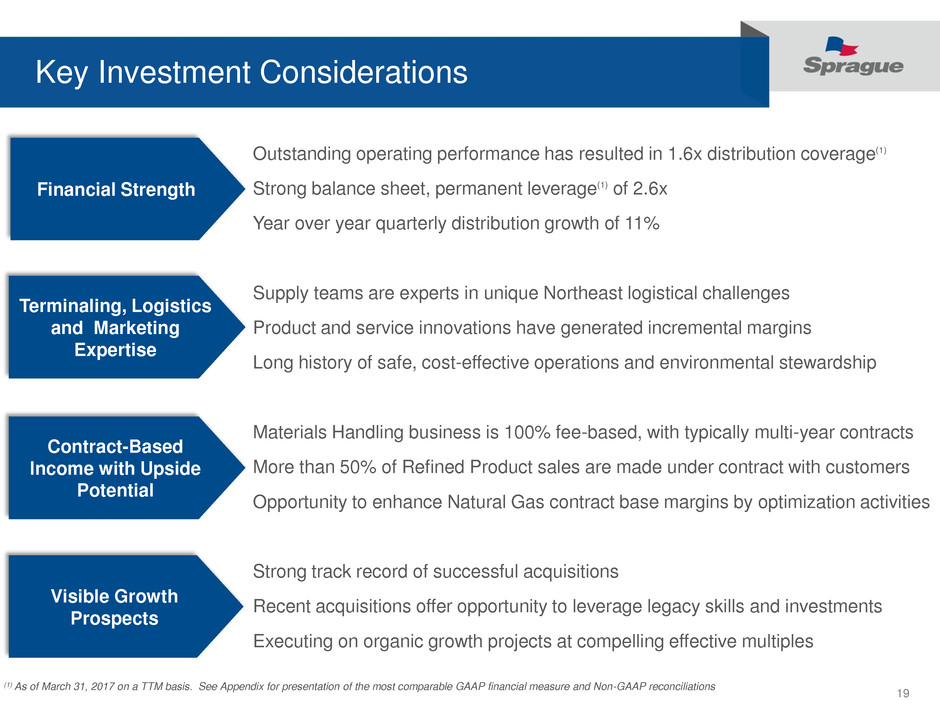
Key Investment Considerations
Outstanding operating performance has resulted in 1.6x distribution coverage(1)
Strong balance sheet, permanent leverage(1) of 2.6x
Year over year quarterly distribution growth of 11%
Supply teams are experts in unique Northeast logistical challenges
Product and service innovations have generated incremental margins
Long history of safe, cost-effective operations and environmental stewardship
Materials Handling business is 100% fee-based, with typically multi-year contracts
More than 50% of Refined Product sales are made under contract with customers
Opportunity to enhance Natural Gas contract base margins by optimization activities
Strong track record of successful acquisitions
Recent acquisitions offer opportunity to leverage legacy skills and investments
Executing on organic growth projects at compelling effective multiples
Terminaling, Logistics
and Marketing
Expertise
Contract-Based
Income with Upside
Potential
Financial Strength
Visible Growth
Prospects
(1) As of March 31, 2017 on a TTM basis. See Appendix for presentation of the most comparable GAAP financial measure and Non-GAAP reconciliations

20
Appendix
21
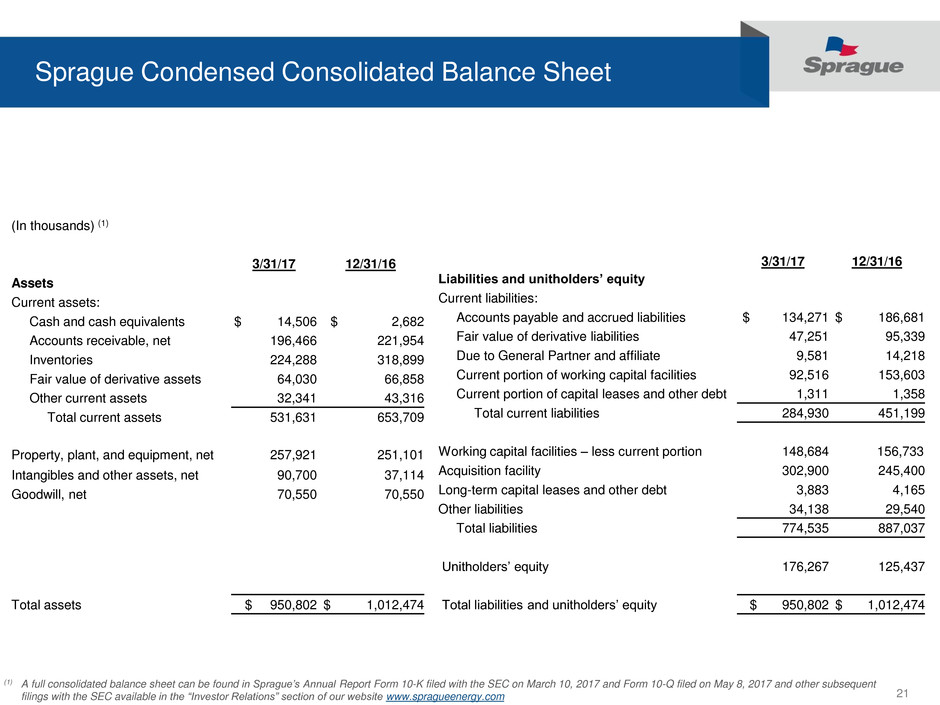
Sprague Condensed Consolidated Balance Sheet
(In thousands) (1)
3/31/17 12/31/16
Assets
Current assets:
Cash and cash equivalents $ 14,506 $ 2,682
Accounts receivable, net 196,466 221,954
Inventories 224,288 318,899
Fair value of derivative assets 64,030 66,858
Other current assets 32,341 43,316
Total current assets 531,631 653,709
Property, plant, and equipment, net 257,921 251,101
Intangibles and other assets, net 90,700 37,114
Goodwill, net 70,550 70,550
Total assets $ 950,802 $ 1,012,474
3/31/17 12/31/16
Liabilities and unitholders’ equity
Current liabilities:
Accounts payable and accrued liabilities $ 134,271 $ 186,681
Fair value of derivative liabilities 47,251 95,339
Due to General Partner and affiliate 9,581 14,218
Current portion of working capital facilities 92,516 153,603
Current portion of capital leases and other debt 1,311 1,358
Total current liabilities 284,930 451,199
Working capital facilities – less current portion 148,684 156,733
Acquisition facility 302,900 245,400
Long-term capital leases and other debt 3,883 4,165
Other liabilities 34,138 29,540
Total liabilities 774,535 887,037
Unitholders’ equity 176,267 125,437
Total liabilities and unitholders’ equity $ 950,802 $ 1,012,474
(1) A full consolidated balance sheet can be found in Sprague’s Annual Report Form 10-K filed with the SEC on March 10, 2017 and Form 10-Q filed on May 8, 2017 and other subsequent
filings with the SEC available in the “Investor Relations” section of our website www.spragueenergy.com
22
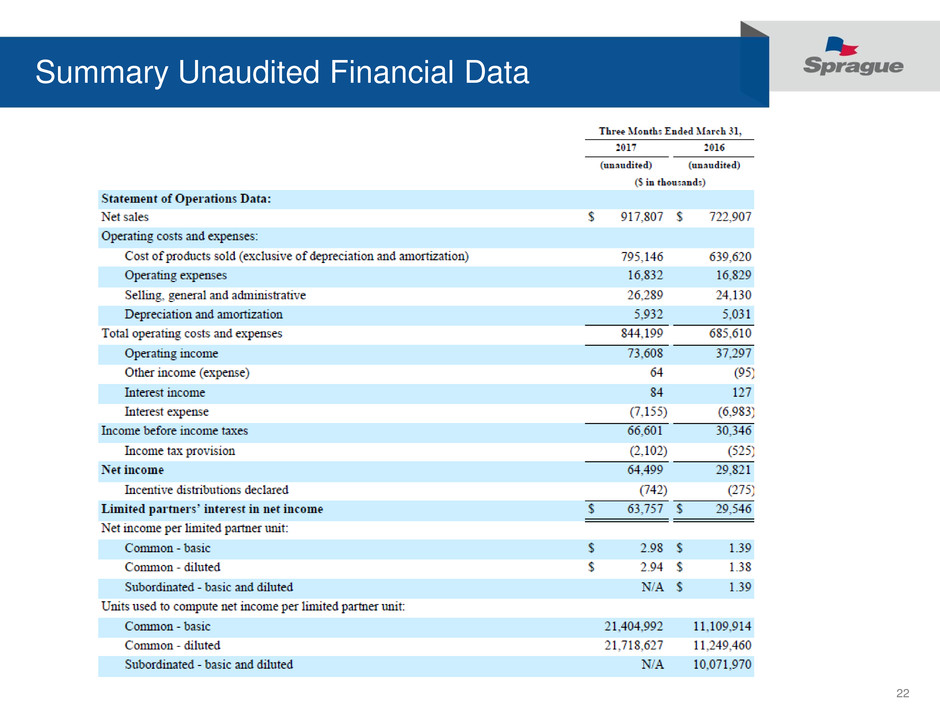
Summary Unaudited Financial Data
23
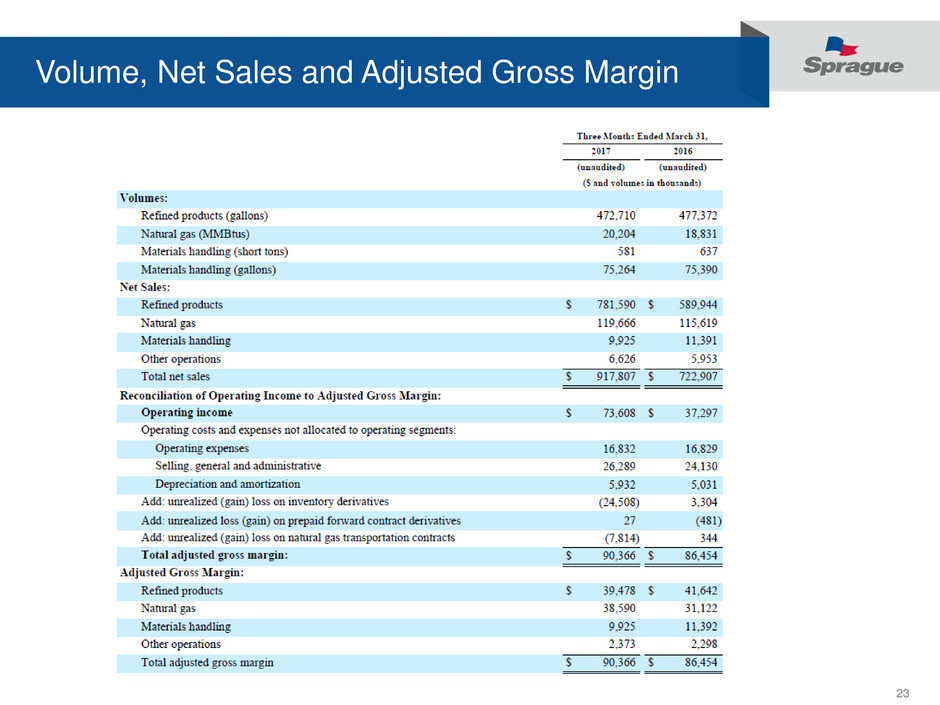
Volume, Net Sales and Adjusted Gross Margin
24
25
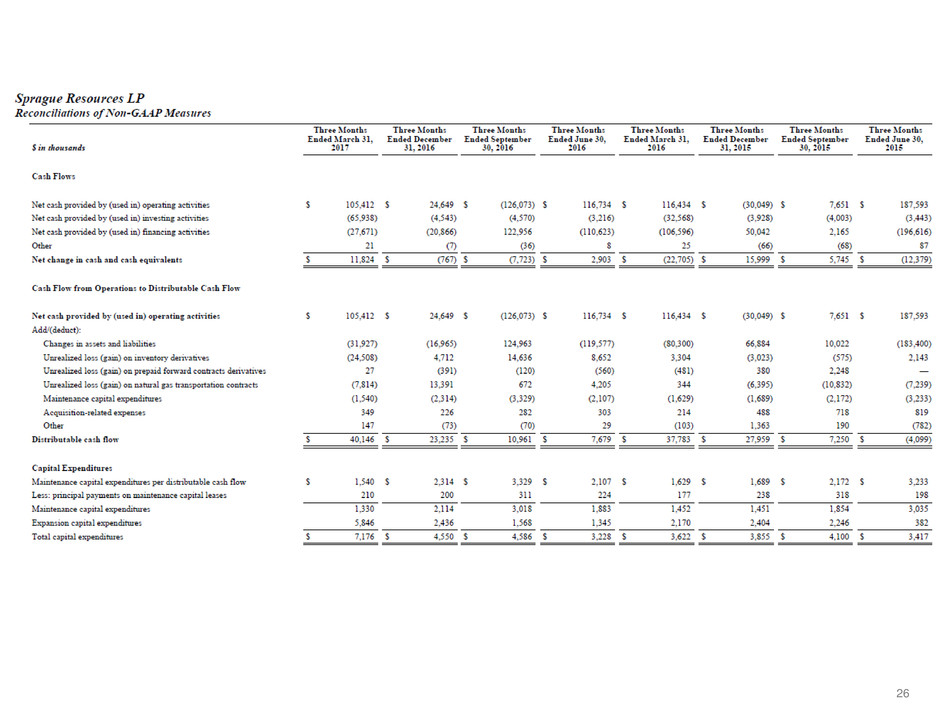
26
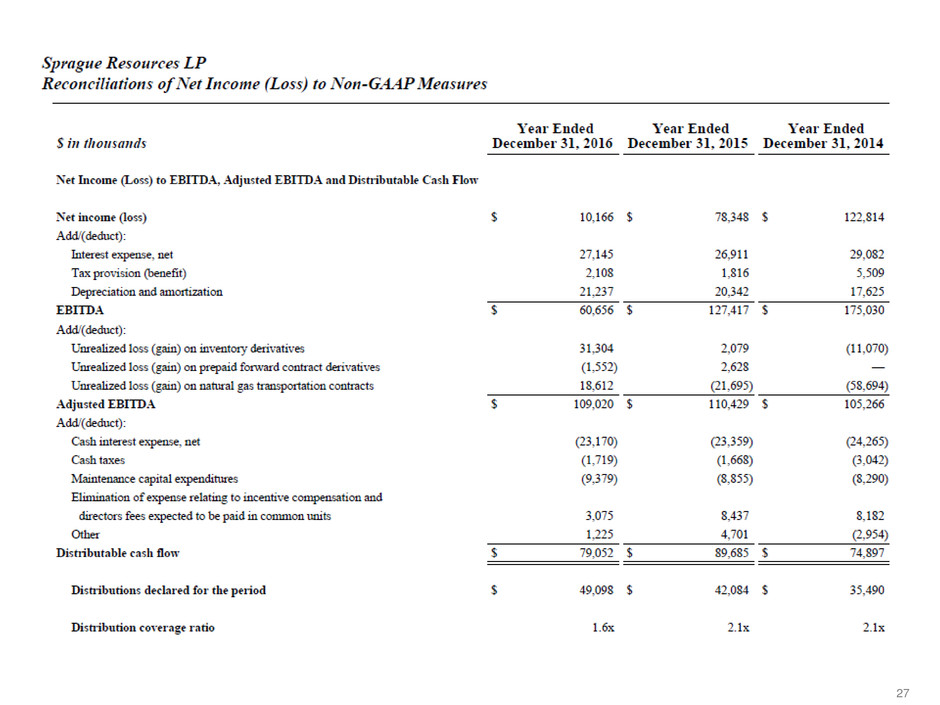
27
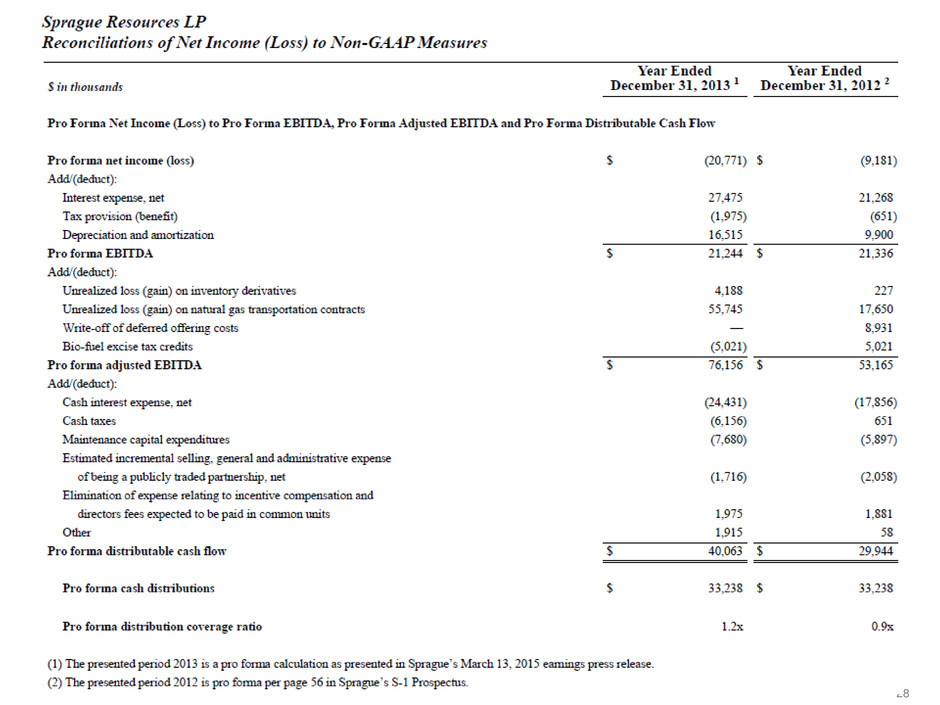
28
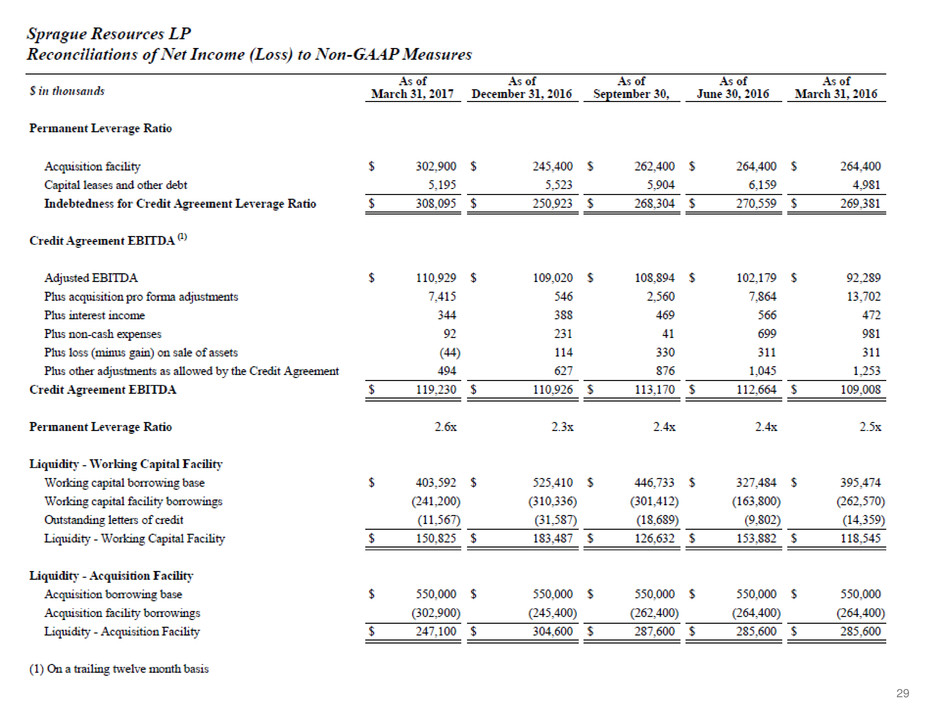
29
