Attached files
| file | filename |
|---|---|
| 8-K - FORM 8-K - M&T BANK CORP | d514348d8k.htm |
 Deutsche
Bank Global Financial
Services Conference May 31, 2017 Exhibit 99.1 |
| 2 Disclaimer This presentation contains forward- looking statements within the meaning of the Private Securities Litigation Reform Act of
1995 giving M&T Bank Corporation’s (“M&T”) expectations or
predictions of future financial or business performance or conditions.
Forward-looking statements are typically identified by words such as “believe,” “expect,” “anticipate,” “intend,” “target,” “estimate,” “continue,” “positions,” “prospects”, or “potential,” by future
conditional verbs such as “will,” “would,”
“should,” “could”, or “may”, or by variations of such
words or by similar expressions. These forward-looking statements are subject to numerous assumptions, risks and uncertainties which change over time.
Forward-looking statements speak only as of the date they are made and we assume no
duty to update forward-looking statements. Actual results may
differ materially from current projections. Forward-looking statements involve known and unknown risks and uncertainties. A number of factors, many of which are beyond M&T’s control, could cause our actual
results, events or developments, or industry results to be materially different from
any future results, events or developments expressed, implied or
anticipated by such forward-looking statements and so our business and financial condition and results of operations could be materially and adversely affected. In addition to factors previously disclosed in M&T’s reports
filed with
the U.S. Securities and Exchange Commission (the “SEC”) and those identified
elsewhere in this document, the following factors, among others, could
cause actual results to differ materially from forward-looking statements or historical performance: changes in asset quality and credit risk; the inability to sustain revenue and earnings growth; changes in interest rates and
capital markets; inflation; customer acceptance of M&T products and services;
customer borrowing, repayment, investment and deposit practices; customer
disintermediation; the introduction, withdrawal, success and timing of business initiatives; competitive pressures; the inability to realize cost savings, revenues or other benefits, or to implement integration plans and
other consequences associated with mergers, acquisitions and divestitures; general
economic conditions and weakening in the economy; deteriorating credit
quality; political developments, wars or other hostilities may disrupt or increase volatility in securities markets or other economic conditions; changes in accounting policies or procedures; significant litigation; and the
impact, extent and timing of technological changes, capital management activities, and
other actions of the Federal Reserve Board and other legislative and
regulatory actions and reforms. Annualized, pro forma, projected and
estimated numbers are used for illustrative purposes only, are not forecasts and may not reflect actual results. |
 3 Introduction |
 4 Who is M&T Bank Corporation? Top 20 US-based commercial bank holding company Substantial growth from $2 billion in assets in 1983 to $123 billion at March 31, 2017
16,791 employees across 799 domestic branches in eight states and Washington
DC 3.7 million customers representing 5.9 million accounts
$80 billion of assets under management
(1) Lowest percentage credit losses among the large money-center / superregional banks
through the financial crisis
1 of only 2 commercial banks (out of 20) in S&P 500 not to reduce
dividend M&T
has not posted a loss going back to 1976 – 163 quarters All data as of March 31, 2017. (1) – Includes affiliated manager. |
 5 Key Ratios 1 – The Efficiency Ratio and Pre-provision Net Revenue are non-GAAP financial measures. A reconciliation of GAAP to non-GAAP
financial measures is available in the appendix. The Efficiency
Ratio reflects non-interest expense (excluding amortization expense associated with intangible assets and merger-related expenses) as a percentage of fully taxable equivalent net interest income and non-interest revenues (excluding gains or losses from securities transactions and merger-related
gains). 2 –
Excludes merger-related gains and expenses and amortization expense associated with
intangible assets. 3 –
Annual and quarterly PPNR to Risk Weighted Assets calculated using average of quarterly
reported RWA balances. 2011
2012 2013 2014 2015 2016 1Q'16 4Q'16 1Q'17 Superior Pre-Credit Earnings Net Interest Margin 3.73% 3.73% 3.65% 3.31% 3.14% 3.11% 3.18% 3.08% 3.34% Efficiency Ratio – Tangible (1) 59.49% 55.28% 55.98% 59.29% 57.98% 56.10% 57.00% 56.42% 56.93% PPNR (1) 1,531 1,796 1,951 1,766 1,845 2,248 517 572 573 PPNR to RWA (1)(3) 2.26% 2.43% 2.61% 2.35% 2.14% 2.29% 2.19% 2.29% 2.32% Strong Credit Metrics Allowance to Loans (As At) 1.51% 1.39% 1.43% 1.38% 1.09% 1.09% 1.10% 1.09% 1.12% Net Charge-Offs to Loans 0.47% 0.30% 0.28% 0.19% 0.19% 0.18% 0.19% 0.22% 0.19% Focused on Returns Net Operating Return on: Tangible Assets (1)(2) 1.26% 1.40% 1.47% 1.23% 1.18% 1.14% 1.09% 1.10% 1.21% Tangible Common Equity (1)(2) 17.96% 19.42% 17.79% 13.76% 13.00% 12.25% 11.62% 11.93% 13.05% Consistent Capital Generation Tangible Common Equity to Tangible Assets 6.40% 7.20% 8.39% 8.11% 8.69% 8.92% 8.71% 8.92% 8.71% Tier 1 Common Capital Ratio 6.86% 7.57% 9.22% 9.83% NA NA NA NA NA Common Equity Tier 1 Ratio NA NA NA NA 11.08% 10.70% 11.06% 10.70% 10.67% Tier 1 Capital Ratio 9.67% 10.22% 12.00% 12.47% 12.68% 11.92% 12.35% 11.92% 11.91% Balance Sheet (As At) Loans to Deposits 101.18% 101.46% 95.46% 90.60% 95.14% 95.14% 93.27% 95.14% 92.03% Securities to Assets 9.85% 7.32% 10.33% 13.44% 12.75% 13.16% 12.41% 13.16% 12.96% |
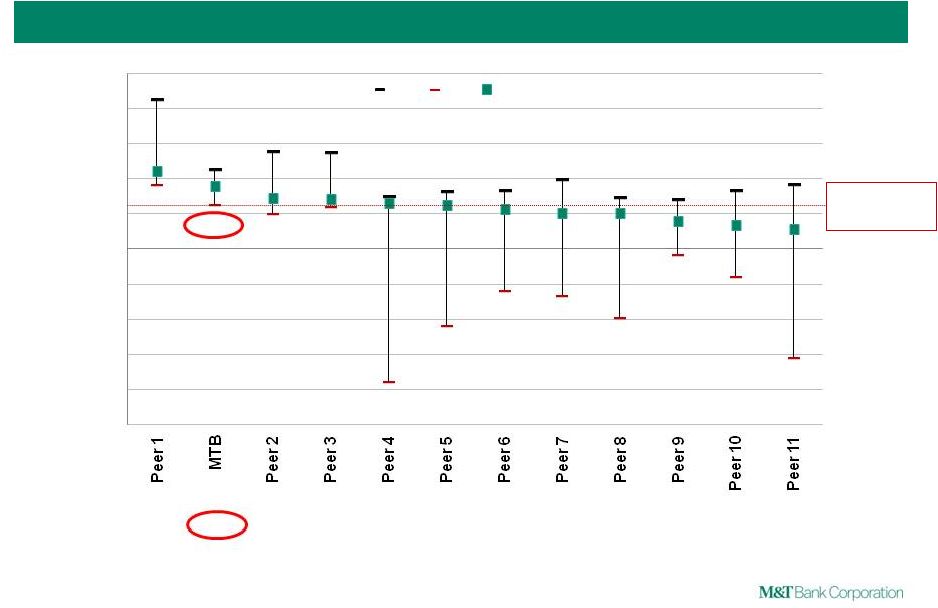 6 18.0% 12.3% 9.6% 11.6% -37.8% -21.8% -11.9% -13.4% -19.5% -2.0% -8.1% -31.2% -50% -40% -30% -20% -10% 0% 10% 20% 30% 40% 50% Max Min Median Notes: ROTCE range is from 2007-2016 annuals and Q1 2017. Volatility is calculated as standard deviation of ROTCE.
Source: SNL Financial. Operating Return on Tangible Common Equity: 2007 – Q1 2017 ROTCE Volatility 7.1% 3.5% 5.4% 5.3% 15.7% 10.7% 8.0% 10.7% 11.8% 4.1% 6.9% 13.0% M&T’s minimum ROTCE second highest among peers Low Volatility: Consistently Profitable Throughout the Cycle |
 7 Focus on Returns Supports Outperformance Notes: Years prior to 2011 not restated for LIHTC. Refer to appendix for peer group list and GAAP reconciliation.
Source: SNL Financial. |
 8 Earning Asset Trends Interest-Earning Assets (Average Balances) ($ in billions) Q1 2017 Balance Q/Q Growth (%)¹ Y/Y Growth (%) Loans: M&T Industry³ M&T Industry³ Commercial & Industrial $22.3 7% (7%) 8% 3% Commercial Real Estate $33.2 4% 6% 13% 9% Residential Real Estate $22.2 (16%) (3%) (14%) 4% Auto $3.0 (2) 14% (1%) 17% 4% HELOC $5.6 (7%) (10%) (6%) (7%) Other Consumer $3.6 4% (18%) 15% 6% Total Loans $89.8 (1%) (4%) 3% 4% Investment Securities $16.0 15% 4% Fed Deposits & Other $6.2 (122%) (25%) Total Earning Assets $112.0 (8%) 1% Notes: Totals may not appear to foot due to rounding. 1 – Annualized 2 – Includes $130 million of auto loans brought on balance sheet during the first quarter of 2017 following wind-up of
securitization. 3 –
Industry uses Federal Reserve H8 data (Domestically chartered commercial banks,
NSA) Commercial loan growth
supported by Hudson City
transformation Partially offset by runoff of Hudson City mortgages Results in low single-digit annual loan growth Variability of cash on deposit at Fed affects earning assets and NIM, with limited NII impact > < < > > > > > < > > > |
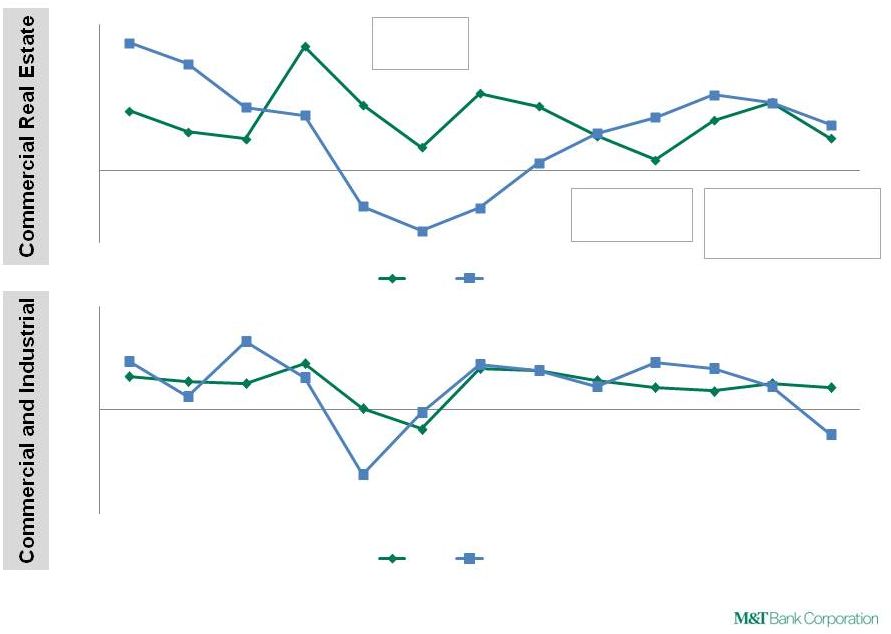 9 8.1% 5.3% 4.3% 17.0% 9.0% 3.1% 10.6% 8.8% 4.7% 1.4% 6.9% 9.3% 4.4% 17.5% 14.6% 8.6% 7.5% (5.0%) (8.3%) (5.2%) 1.0% 5.1% 7.3% 10.3% 9.3% 6.3% -10% -5% 0% 5% 10% 15% 20% MTB Less Volatile Loan Growth Through Credit Cycles Notes: Reflects growth in loan balances for each year and annualized for 1Q17. M&T data reflects average loan balances.
Industry Commercial loans includes both “Commercial and Industrial Loans” and
“Other Loans and Leases” as outlined in the Federal Reserve H8 report. Source: Federal Reserve H8 data – domestically chartered commercial banks, not seasonally adjusted. Slower growth vs. industry average post-crisis Higher 2016 growth from draws on commitments made in prior years, which slowed in 1Q 2017 Sustained loan growth during financial crisis 9.7% 8.3% 7.6% 13.3% 0.4% (5.5%) 11.9% 11.5% 8.6% 6.4% 5.5% 7.5% 6.5% 14.1% 3.8% 19.7% 9.2% (18.8%) (0.7%) 13.1% 11.3% 6.7% 13.8% 11.9% 6.6% (7.2%) -30% -20% -10% 0% 10% 20% 30% 2005 2006 2007 2008 2009 2010 2011 2012 2013 2014 2015 2016 1Q17 MTB Industry Industry |
 10 M&T Commercial Real Estate CRE Portfolio Composition – March 31, 2017 Geographic Mix – Permanent Investor CRE ($ in billions) $ % of Total Permanent Investor CRE: Office $4.7 14% Retail/Service $4.1 12% Multifamily $4.1 12% Hotel $2.5 8% Industrial $1.4 4% Health Facilities & Other $0.6 2% Total Permanent $17.4 52% Commercial Construction $5.1 16% Residential Construction $1.8 6% Owner-Occupied CRE $8.8 26% Total CRE $33.1 100% Criticized Loans - % of Total M&T’s CRE portfolio remains broadly diversified by property type and geography, with a significant
owner-occupied component; credit metrics stable
0.0% 2.0% 4.0% 6.0% 8.0% 10.0% 12.0% 14.0% 2012 2013 2014 2015 2016 1Q17 Commercial Real Estate As of December 31, 2016 NYC 34% Other NY State 17% PA 11% Mid-Atlantic 24% Other 14% Notes: Totals may not appear to foot due to rounding. Total Construction |
 11 NYC 37% Other NY State 14% PA 11% Mid-Atlantic 26% Other 12% 76% 67% 15% 17% 9% 16% $6.2 $6.2 $0.0 $1.0 $2.0 $3.0 $4.0 $5.0 $6.0 $7.0 2012 1Q17 Permanent IRE Owner-Occupied C&I Retail Exposure Retail Sector Loan Balances Geographic Mix – Retail Permanent Inv. CRE Retail exposure is diversified and granular in both CRE and C&I NYC Largely multi-use properties with residential retail or office component As of December 31, 2016 CRE Retail exposure has declined to 16% of CRE portfolio from 22% in 2012 Malls less than 3% of retail CRE exposure Other Regions Primarily strip centers with diverse tenants C&I Majority of exposure to home improvement and food retailers Note: C&I excludes automobile dealer services. ($ in billions) |
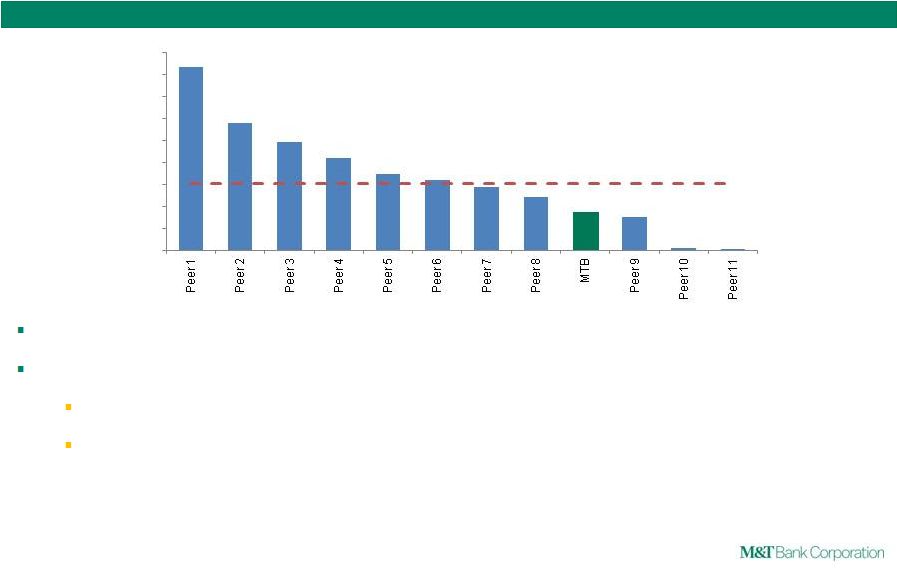 12 Auto Lending Auto % of Total Loans (March 31, 2017)¹ M&T’s auto lending strategy and volumes have remained consistent; focus on in-footprint lending to
prime customers Indirect auto loans primarily sourced through floor-plan network Average origination FICO of 731 in 2016 84% of originations above 680 FICO; with no lending to sub-620 FICOs Only 66% of industry FICOs above 660 FICO Notes: 1 – Peer group listed in the appendix. Source: New York Fed Consumer Credit Panel/Equifax, Regulatory Filings, and SNL Financial
16.7% 11.6% 9.8% 8.4% 7.0% 6.4% 5.8% 4.8% 3.5% 3.0% 0.2% 0.0% 0% 2% 4% 6% 8% 10% 12% 14% 16% 18% Group Median: 6.1% |
 13 Cumulative Capital Retained, Dividends and Share Repurchases Deploying Capital Where and When it Makes Sense 2003 – 2007 Pre-Crisis Note: Calculated using Net Operating Income, less preferred dividends and discount amortization – see appendix M&T has maintained a consistent approach to managing its shareholders’ capital over time
Retain only capital needed to support asset growth / acquisitions with returns >
cost of capital Dividends at level sustainable throughout
cycle Key decisions made annually during CCAR, based on year-end
outlook for earnings and loan growth Limited flexibility to adjust
distributions during the year should conditions change 2008
– 2011
Crisis 2012 – 2015 New Regulatory Standards 2016 Post-Hudson City 28% 52% 35% 35% 52% 50% 20% 48% 65% 15% Dividends Repurchases Capital Retained 80% 52% 35% 85% Total Payout |
 14 Net Interest Income / Margin Continued NIM expansion and NII growth following Fed actions in December and March
Still asset sensitive, but….
Reduced upside if rates continue to rise Risk from any decline in rates mitigated as hedging program initiated M&T began aligning Hudson City time deposit pricing in August 2016 $5.1 billion (52%) of Hudson City time deposits re-priced to M&T rates Loan Growth Remains in line with prior outlook – low single-digit year over year growth Continued runoff in mortgage loan portfolio – pace dependent on rate environment Noninterest Income Assumed $12 billion in subservicing in late March Balancing trade-off between volumes and margins in residential mortgage loan originations
Noninterest Expense Outlook unchanged – nominal year over year growth, excluding 2016 merger-related expenses Capital 2016 CCAR capital plan repurchases substantially complete Increased common stock dividend by $.05 to $.75 per quarter Update and Outlook |
 15 Long-term Shareholder Outperformance |
 16 2.80 0.75 8.08 2.15 $0.00 $1.00 $2.00 $3.00 $4.00 $5.00 $6.00 $7.00 $8.00 $9.00 Dividends GAAP EPS Impact of Amortization and Merger-related expenses Earnings & Dividend Growth: 1983-Q1 2017 The $8.08 net operating EPS for 2016 and the $2.15 net operating EPS for 1Q17 are non-GAAP financial measures. A reconciliation of GAAP
EPS to net operating EPS is available in the appendix.
|
 17 18.9% Annual rate of return since 1980¹ In the top 30 of the entire universe² of U.S. based stocks traded publicly since 1980
M&T Bank Corporation…a solid investment
(1) CAGR calculated assuming reinvestment of dividends through March 31, 2017 (2) Includes 567 U.S. based publically traded stocks $1,581 invested in M&T in 1980 would be worth $1 million as of today Rank Company Name Industry Annual Return 1 Eaton Vance Corp. Financials 23.3 2 TJX Companies Inc Consumer Discretionary 23.0 3 Hasbro, Inc. Consumer Discretionary 22.2 4 Stryker Corporation Health Care 22.0 5 L Brands, Inc. Consumer Discretionary 20.8 6 Progressive Corporation Financials 20.8 7 Valspar Corporation Materials 20.7 8 Mylan N.V. Health Care 20.0 9 Gap, Inc. Consumer Discretionary 19.9 10 Danaher Corporation Health Care 19.8 11 Wal-Mart Stores, Inc. Consumer Staples 19.7 12 State Street Corporation Financials 19.6 13 Sherwin-Williams Company Materials 19.6 14 Equifax Inc. Industrials 19.6 15 Berkshire Hathaway Inc. Class A Financials 19.6 16 M&T Bank Corporation Financials 18.9 17 Robert Half International Inc. Industrials 18.9 18 Constellation Brands, Inc. Class B Consumer Staples 18.7 19 Graco Inc. Industrials 18.7 20 Lowe's Companies, Inc. Consumer Discretionary 18.7 21 Walgreens Boots Alliance Inc Consumer Staples 18.6 22 Aflac Incorporated Financials 18.6 23 Flowers Foods, Inc. Consumer Staples 18.5 24 Astronics Corporation Industrials 18.4 25 Church & Dwight Co., Inc. Consumer Staples 18.3 26 V.F. Corporation Consumer Discretionary 18.0 27 RLI Corp. Financials 17.9 28 Applied Materials, Inc. Information Technology 17.9 29 Raven Industries, Inc. Industrials 17.9 30 HollyFrontier Corporation Energy 17.8 |
 18 Of the largest 100 banks operating in 1983, only 23 remain today. Among the remaining, M&T ranks 1 in stock price growth M&T Bank Corporation…a solid investment (1) 1983 Stock Prices Source: Compustat and/or Bigcharts.com st Stock Closing Price at Return 3/31/2017 3/31/1983 CAGR Rank Company Name Ticker ($) ($) 1 (%) 1 M&T Bank Corporation MTB 154.73 1.34 15.0 2 State Street Corporation STT 79.61 1.06 13.6 3 Northern Trust Corporation NTRS 86.58 1.51 12.6 4 U.S. Bancorp USB 51.50 0.92 12.6 5 Wells Fargo & Company WFC 55.66 1.18 12.0 23 — — 4.3 Median — — 9.1 MTB Price @ Median Growth Rate 25.62 1.34 9.1 |
 19 Appendix and GAAP Reconciliations |
 20 Reconciliation of GAAP and Non-GAAP Measures Net Income 2011 2012 2013 2014 2015 2016 1Q16 4Q16 1Q17 $ in millions Net income 859.5 $ 1,029.5 $ 1,138.5 $ 1,066.2 $ 1,079.7 $ 1,315.1 $ 298.5 $ 330.6 $ 348.9 $ Intangible amortization* 37.6 37.0 28.6 20.7 16.2 25.9 7.5 5.5 5.1 Merger-related items* (12.8) 6.0 7.5 - 60.8 21.7 14.0 - - Net operating income 884.3 $ 1,072.5 $ 1,174.6 $ 1,086.9 $ 1,156.6 $ 1,362.7 $ 320.1 $ 336.1 $ 354.0 $ PPNR Net Income for EPS 781.8 $ 953.4 $ 1,062.5 $ 978.6 $ 987.7 $ 1,223.5 $ 275.7 $ 307.8 $ 328.6 $ Preferred Div., Amort. of Pref. Stock & Unvested Stock Awards 77.7 76.1 75.9 87.7 92.0 91.6 22.8 22.8 20.4 Income Taxes 401.3 562.5 627.1 576.0 595.0 743.3 169.3 179.5 169.3 GAAP Pre-tax Income 1,260.8 1,592.0 1,765.6 1,642.2 1,674.7 2,058.4 467.8 510.1 518.3 Provision for credit losses 270.0 204.0 185.0 124.0 170.0 190.0 49.0 62.0 55.0 Pre-Tax, Pre-Provision Net Revenue 1,530.8 $ 1,796.0 $ 1,950.6 $ 1,766.2 $ 1,844.7 $ 2,248.4 $ 516.8 $ 572.1 $ 573.3 $ Earnings Per Share Diluted earnings per share $6.35 $7.54 $8.20 $7.42 $7.18 $7.78 $1.73 $1.98 $2.12 Intangible amortization* 0.30 0.29 0.22 0.15 0.12 0.16 0.05 0.03 0.03 Merger-related items* (0.10) 0.05 0.06 - 0.44 0.14 0.09 - - Diluted net operating earnings per share $6.55 $7.88 $8.48 $7.57 $7.74 $8.08 $1.87 $2.01 $2.15 Efficiency Ratio $ in millions Non-interest expenses $2,441.9 $2,469.8 $2,587.9 $2,689.5 $2,822.9 $3,047.5 $776.1 $769.1 $787.9 less: intangible amortization 61.6 60.6 46.9 33.8 26.4 42.6 12.3 9.1 8.4 less: merger-related expenses 83.7 9.9 12.4 - 76.0 35.8 23.2 - - Non-interest operating expenses 2,296.6 $ 2,399.2 $ 2,528.6 $ 2,655.7 $ 2,720.5 $ 2,969.1 $ 740.6 $ 760.0 $ 779.4 $ Tax equivalent revenues 3,998.6 $ 4,292.2 $ 4,563.4 $ 4,479.4 $ 4,692.1 $ 5,322.8 $ 1,299.2 $ 1,348.6 $ 1,369.1 $ less: gain/(loss) on sale of securities 150.2 0.0 56.5 - (0.1) 30.3 0.00 1.6 - less: net OTTI losses recognized (77.0) (47.8) (9.8) - - - - - - less: merger-related gains 64.9 - - - - - - - - Denominator for efficiency ratio 3,860.5 $ 4,340.0 $ 4,516.7 $ 4,479.4 $ 4,692.2 $ 5,292.5 $ 1,299.2 $ 1,347.0 $ 1,369.1 $ Net operating efficiency ratio 59.5% 55.3% 56.0% 59.3% 58.0% 56.1% 57.0% 56.4% 56.9% *Net of tax Notes: Totals may not appear to foot due to rounding. |
 21 Reconciliation of GAAP and Non-GAAP Measures Average Assets 2011 2012 2013 2014 2015 2016 1Q16 4Q16 1Q17 $ in millions Average assets 73,977 $ 79,983 $ 83,662 $ 92,143 $ 101,780 $ 124,340 $ 123,252 $ 125,734 $ 122,978 $ Goodwill (3,525) (3,525) (3,525) (3,525) (3,694) (4,593) (4,593) (4,593) (4,593) Core deposit and other intangible assets (168) (144) (90) (50) (45) (117) (134) (102) (98) Deferred taxes 43 42 27 15 16 46 52 40 39 Average tangible assets
70,327 $ 76,356 $ 80,074 $ 88,583 $ 98,057 $ 119,676 $ 118,577 $ 121,079 $ 118,326 $ Average Common Equity $ in millions Average common equity 8,207 $ 8,834 $ 9,844 $ 10,905 $ 11,996 $ 15,122 $ 15,047 $ 15,181 $ 15,091 $ Goodwill (3,525) (3,525) (3,525) (3,525) (3,694) (4,593) (4,593) (4,593) (4,593) Core deposit and other intangible assets (168) (144) (90) (50) (45) (117) (134) (102) (98) Deferred taxes 43 42 27 15 16 46 52 40 39 Average tangible common equity
4,557 $ 5,207 $ 6,256 $ 7,345 $ 8,273 $ 10,458 $ 10,372 $ 10,526 $ 10,439 $ Notes: Totals may not appear to foot due to rounding. |
| 22 BB&T Corporation PNC Financial Services Group, Inc. Comerica Incorporated Regions Financial Corporation Fifth Third Bancorp SunTrust Banks, Inc. Huntington Bancshares Incorporated Zions Bancorporation KeyCorp M&T Peer Group U.S. Bancorp M&T Bank Corporation Citizens Financial Group, Inc. |