Attached files
| file | filename |
|---|---|
| 8-K - 8-K - International Seaways, Inc. | v468018_8k.htm |
Exhibit 99.1
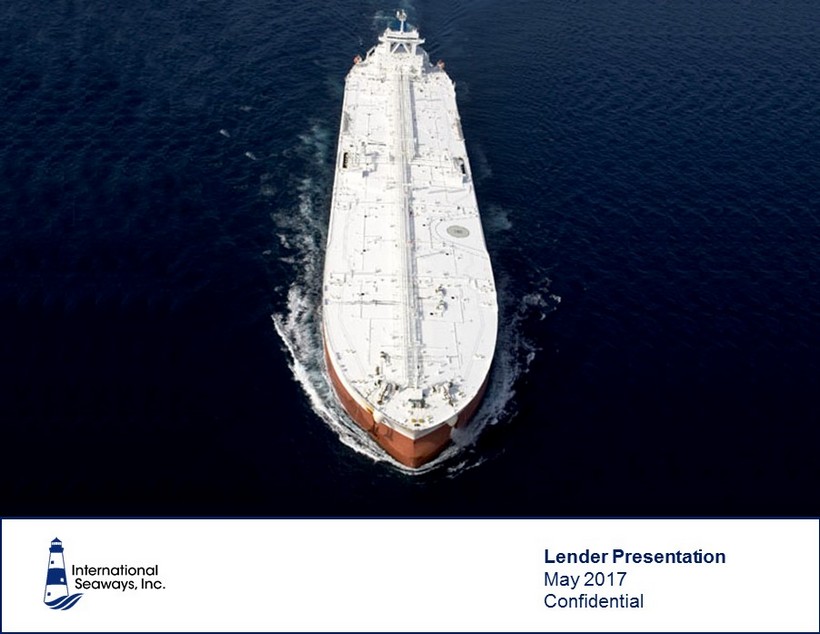
International Seaways, Inc. Confidential 1 Lender Presentation May 2017 Confidential
International Seaways, Inc. Confidential Disclaimer Fo r w ar d - Loo ki n g Sta t e m e nt s Dur ing the course of th i s presentation, the Co m pany ( International Seaways, Inc . (INSW)) m ay m a k e f or w ard - loo k ing state m ents or prov ide f or w ard - loo k ing in f or m at i on . All state m ents other than state m ents of h i storical f a c ts shou l d be c on s idered f or w ar d - loo k ing state m ent s . So m e of the s e state m ents i n c lude wor ds su c h as ‘‘out l oo k ,’’ ‘‘be l ie v e, ’ ’ ‘‘e x pe c t, ’ ’ ‘‘potent i a l ,’’ ‘‘cont i nue,’’ ‘‘ m ay ,’’ ‘‘will,’’ ‘‘shou l d, ’ ’ ‘‘cou l d, ’ ’ ‘‘see k ,’’ ‘‘predict, ’ ’ ‘‘int e nd,’’ ‘‘p l an, ’ ’ ‘‘e s ti m ate, ’ ’ ‘‘ant i cipat e ,’’ ‘‘target,’’ ‘‘pro j e c t, ’ ’ ‘‘ f oreca s t, ’ ’ ‘‘sha l l,’’ ‘‘conte m p l ate ’ ’ or the negati v e v ersion of tho s e wor ds or other co m parable word s . Although they re f le c t INSW ’s c u r r ent e x pe c tat i ons , the s e state m ents are not guarantees of f uture per f or m an c e, but i nvo l v e a nu m ber of r isks, un c ertaint i e s , and a s su m pt i ons which are d i ff ic u lt to predi c t . So m e of the f a c tors that m ay cau s e a c tual out c o m es and re s u l ts to d i ff er m ateria l ly f rom tho s e e x pressed in, or i m p l ied by , the f or w ar d - loo k ing state m ents in c lude, but a r e not ne c e s sari l y li m ited to, gener al e c ono m ic cond i tion s , co m pet i ti v e pressures, the natu re of the C o m pany ’s ser v ices and the i r pri c e m ove m ent s , and the ab i lity to r eta i n key e m p l oyee s . A discussion of material risks faced by the Company can be found in its Annual Report on Form 10 - K, which is on file with the SEC . T he Co m pany does not under ta k e to update any f or w ard - loo k ing state m ents as a resu l t of f uture deve l op m ent s , new i n f or m at i on or other w is e . N on - G AA P F ina n cial M easures In c luded in th i s presentation are certain no n - G AAP f inan c ial m ea s ures, in c lud i ng T i m e Charter Equ i v a l ent (“ T CE” ) rev enue, EBIT D A, and Ad j u s ted EBIT D A, de s igned to co m p l e m ent the f inan c ial in f or m at i on presented in a c cordance with genera l ly a c cepted a c counting princip l es in the United Sta t es of A m eri c a be c au s e m anage m ent be l ie v es su c h m ea s ures are u s e f ul to i nve s tors . T CE rev enue, which r epresents sh i pp i ng rev enues le s s v oyage e x pen s e s , i s a m ea s ure that co m pares revenue generated f rom a voyage charter to re v enue gener ated f rom a t i m e c harte r . EBIT D A r epresents net ( lo s s ) /in c o m e be f ore interest e x pen s e, in c o m e ta x es and depreciat i on and a m orti z at i on e x pen s e . Ad j u s ted EBIT D A c on s ists of EBIT D A adju s ted f or the i m pa c t of certain ite m s that we do not con s ider in d ic ati v e of our ongo i ng operating per f or m an c e . W e present no n - G AAP m ea s ures when we be l ie ve that the add i tional in f or m at i on is u s e f ul and m ean i ng f ul to i nve s tors . No n - G AAP f in an c ial m ea s ures do not have any s tandardi z ed m ean i ng and are there f ore un l ike l y to be co m parable to s i m ilar m ea s ures presented by other co m pan i e s . T he presentation of no n - G AAP f inan c ial m ea s ures is not i ntended to be a s ub s titute f or, and shou l d not be c on s idered in iso l at i on f ro m , the f inan c ial m ea s ur e s r eported in a c cordance with G AAP . See Append i x f or a re c on c iliat i on of certain no n - G AAP m ea s ures to the co m parable G AAP m ea s ures . T h i s presentation a l so contains e s ti m ates and other in f or m at i on con c erning our indu s t r y that are ba s ed on indu s t r y pub l icat i o n s , sur v ey s and f oreca s t s . T h i s in f or m at i on in v ol v es a nu m ber of assu m ptions and li m itations, and w e ha v e not indepen d ently v e r i f ied the accu r acy or co m pleteness of the in f o r m ation . Available In fo rma t ion Y ou m ay obtain additional information about the issuer, including a copy of INSW’s Annual Report on Form 10 - K for 2016 , f or f ree by v isiting ED G AR on the S EC W eb site at www . se c . go v , or from the issuer’s website at www . intlseas . com . 2
International Seaways, Inc. Confidential 3 Today’s Presenters Jeffrey D. Pribor Chief Financial Officer Lois K. Zabrocky Chief Executive Officer
International Seaways, Inc. Confidential 4 ▪ Transaction Overview ▪ Company Overview ▪ Key Credit Highlights ▪ Market Fundamentals ▪ Financial Overview ▪ Appendix Agenda

Transaction Overview
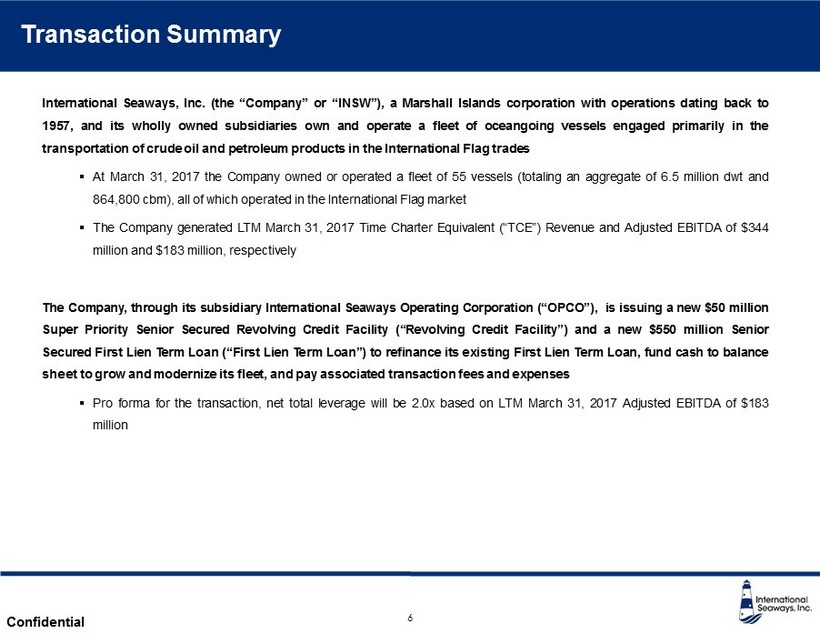
International Seaways, Inc. Confidential Transaction Summary 6 International Seaways, Inc . (the “Company” or “INSW”), a Marshall Islands corporation with operations dating back to 1957 , and its wholly owned subsidiaries own and operate a fleet of oceangoing vessels engaged primarily in the transportation of crude oil and petroleum products in the International Flag trades ▪ At March 31 , 2017 the Company owned or operated a fleet of 55 vessels (totaling an aggregate of 6 . 5 million dwt and 864 , 800 cbm ), all of which operated in the International Flag market ▪ The Company generated LTM March 31 , 2017 Time Charter Equivalent (“TCE”) Revenue and Adjusted EBITDA of $ 344 million and $ 183 million, respectively The Company, through its subsidiary International Seaways Operating Corporation (“OPCO”), is issuing a new $ 50 million Super Priority Senior Secured Revolving Credit Facility (“Revolving Credit Facility”) and a new $ 550 million Senior Secured First Lien Term Loan (“First Lien Term Loan”) to refinance its existing First Lien Term Loan, fund cash to balance sheet to grow and modernize its fleet, and pay associated transaction fees and expenses ▪ Pro forma for the transaction, net total leverage will be 2 . 0 x based on LTM March 31 , 2017 Adjusted EBITDA of $ 183 million
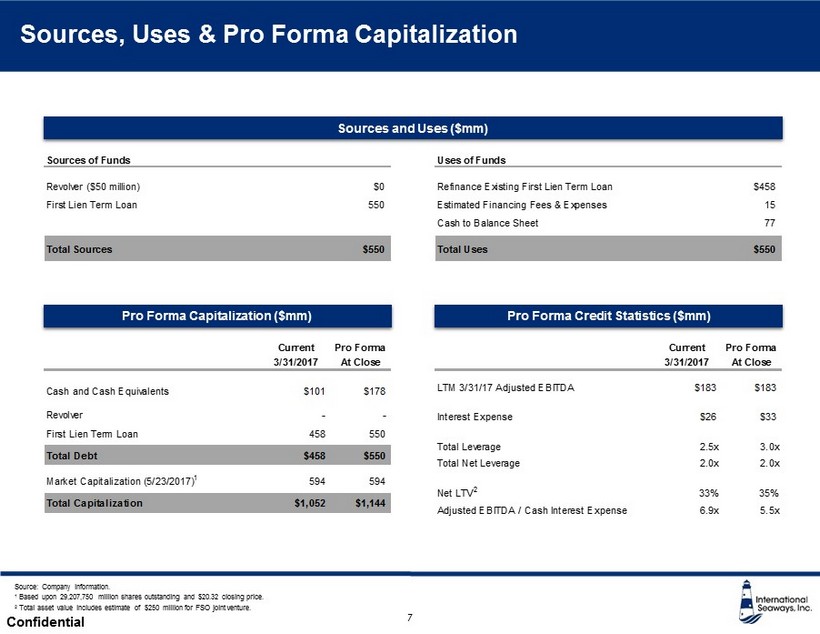
International Seaways, Inc. Confidential Sources, Uses & Pro Forma Capitalization 7 Sources and Uses ($mm) Pro Forma Capitalization ($mm) Pro Forma Credit Statistics ($mm) Source: Company information. 1 Based upon 29,207,750 million shares outstanding and $20.32 closing price. 2 Total asset value includes estimate of $250 million for FSO joint venture. Uses of Funds Refinance Existing First Lien Term Loan $458 Estimated Financing Fees & Expenses 15 Cash to Balance Sheet 77 Total Uses $550 Sources of Funds Revolver ($50 million) $0 First Lien Term Loan 550 Total Sources $550 Current Pro Forma 3/31/2017 At Close Cash and Cash Equivalents $101 $178 Revolver - - First Lien Term Loan 458 550 Total Debt $458 $550 Market Capitalization (5/23/2017) 1 594 594 Total Capitalization $1,052 $1,144 Current Pro Forma 3/31/2017 At Close LTM 3/31/17 Adjusted EBITDA $183 $183 Interest Expense $26 $33 Total Leverage 2.5x 3.0x Total Net Leverage 2.0x 2.0x Net LTV 2 33% 35% Adjusted EBITDA / Cash Interest Expense 6.9x 5.5x
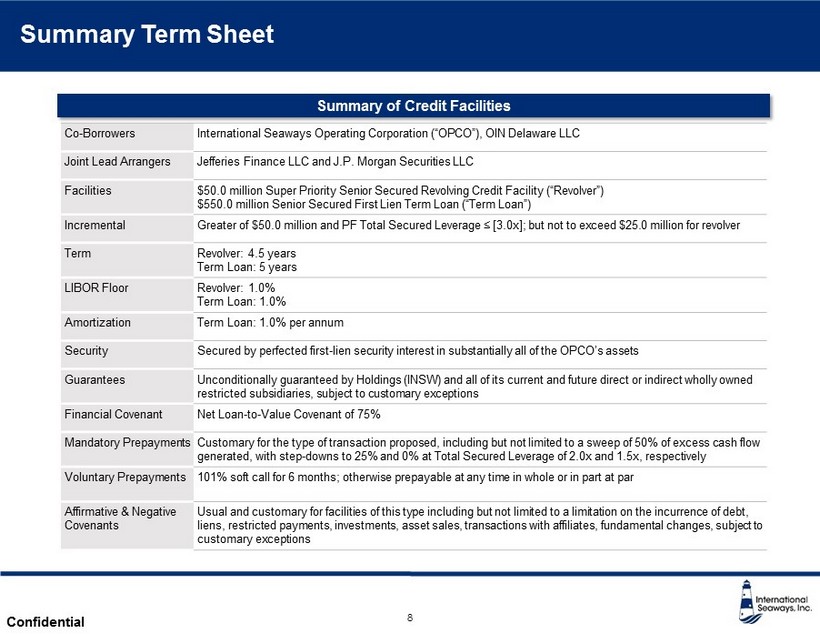
International Seaways, Inc. Confidential Summary Term Sheet 8 Summary of Credit Facilities Co - Borrowers International Seaways Operating Corporation (“OPCO”), OIN Delaware LLC Joint Lead Arrangers Jefferies Finance LLC and J.P. Morgan Securities LLC Facilities $50.0 million Super Priority Senior Secured Revolving Credit Facility (“Revolver”) $550.0 million Senior Secured First Lien Term Loan (“Term Loan”) Incremental Greater of $50.0 million and PF Total Secured Leverage ≤ [3.0x]; but not to exceed $25.0 million for revolver Term Revolver: 4.5 years Term Loan : 5 years LIBOR Floor Revolver: 1.0% Term Loan: 1.0% Amortization Term Loan: 1.0% per annum Security Secured by perfected first - lien security interest in substantially all of the OPCO’s assets Guarantees Unconditionally guaranteed by Holdings (INSW) and all of its current and future direct or indirect wholly owned restricted subsidiaries, subject to customary exceptions Financial Covenant Net Loan - to - Value Covenant of 75% Mandatory Prepayments Customary for the type of transaction proposed, including but not limited to a sweep of 50% of excess cash flow generated, with step - downs to 25% and 0% at Total Secured Leverage of 2.0x and 1.5x, respectively Voluntary Prepayments 101% soft call for 6 months; otherwise prepayable at any time in whole or in part at par Affirmative & Negative Covenants Usual and customary for facilities of this type including but not limited to a limitation on the incurrence of debt, liens, restricted payments, investments, asset sales, transactions with affiliates, fundamental changes, subject to customary exceptions
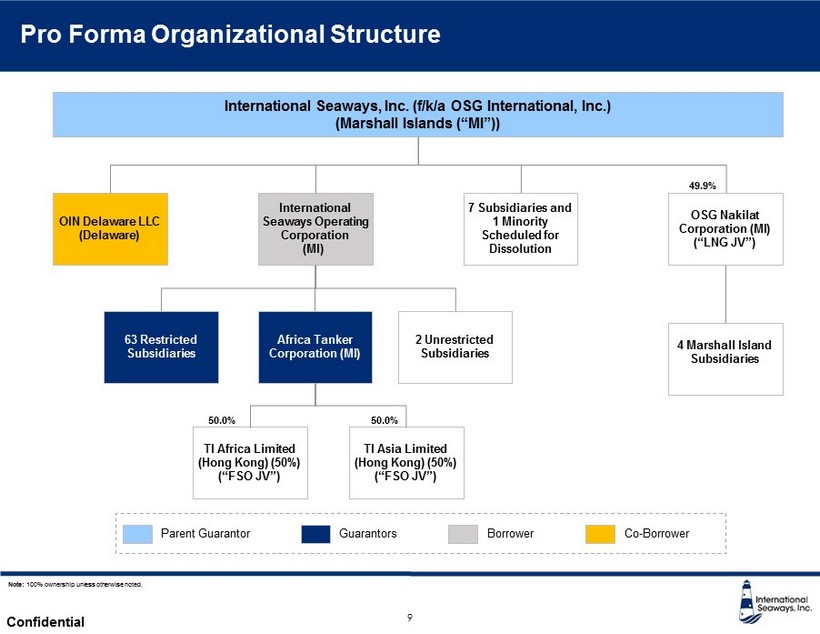
International Seaways, Inc. Confidential Pro Forma Organizational Structure 9 Note: 100% ownership unless otherwise noted. International Seaways, Inc. (f/k/a OSG International, Inc.) (Marshall Islands (“MI”)) OIN Delaware LLC (Delaware) International Seaways Operating Corporation (MI) 63 Restricted Subsidiaries Guarantors Borrower Parent Guarantor OSG Nakilat Corporation (MI) (“LNG JV”) 7 Subsidiaries and 1 Minority Scheduled for Dissolution Africa Tanker Corporation (MI) 2 Unrestricted Subsidiaries Co - Borrower 49.9% 4 Marshall Island Subsidiaries TI Africa Limited (Hong Kong) (50%) (“FSO JV”) TI Asia Limited (Hong Kong) (50%) (“FSO JV”) 50.0% 50.0%
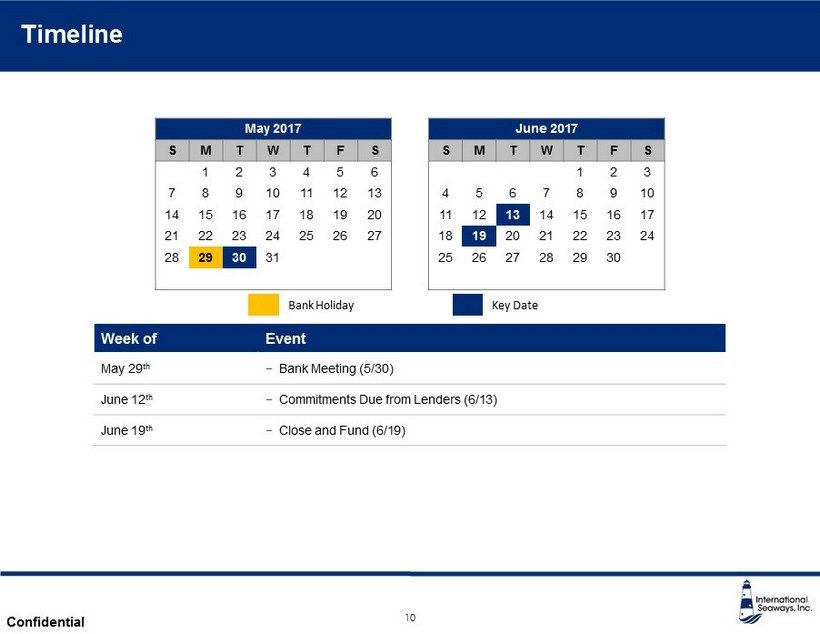
International Seaways, Inc. Confidential Timeline 10 Week of Event May 29 th − Bank Meeting (5/30) June 12 th − Commitments Due from Lenders (6/13) June 19 th − Close and Fund (6/19) Bank Holiday June 2017 S M T W T F S 1 2 3 4 5 6 7 8 9 10 11 12 13 14 15 16 17 18 19 20 21 22 23 24 25 26 27 28 29 30 May 2017 S M T W T F S 1 2 3 4 5 6 7 8 9 10 11 12 13 14 15 16 17 18 19 20 21 22 23 24 25 26 27 28 29 30 31 Key Date

Company Overview
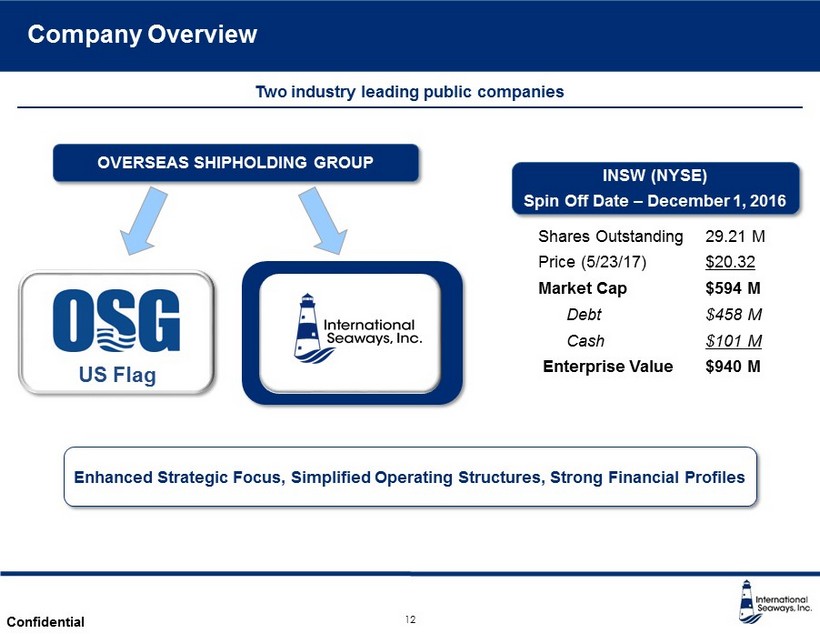
International Seaways, Inc. Confidential Company Overview Enhanced Strategic Focus, Simplified Operating Structures, Strong Financial Profiles OVERSEAS SHIPHOLDING GROUP 12 US Flag Shares Outstanding 29.21 M Price (5/23/17) $20.32 Market Cap $594 M Debt $458 M Cash $101 M Enterprise Value $940 M INSW (NYSE) Spin Off Date – December 1, 2016 Two industry leading public companies
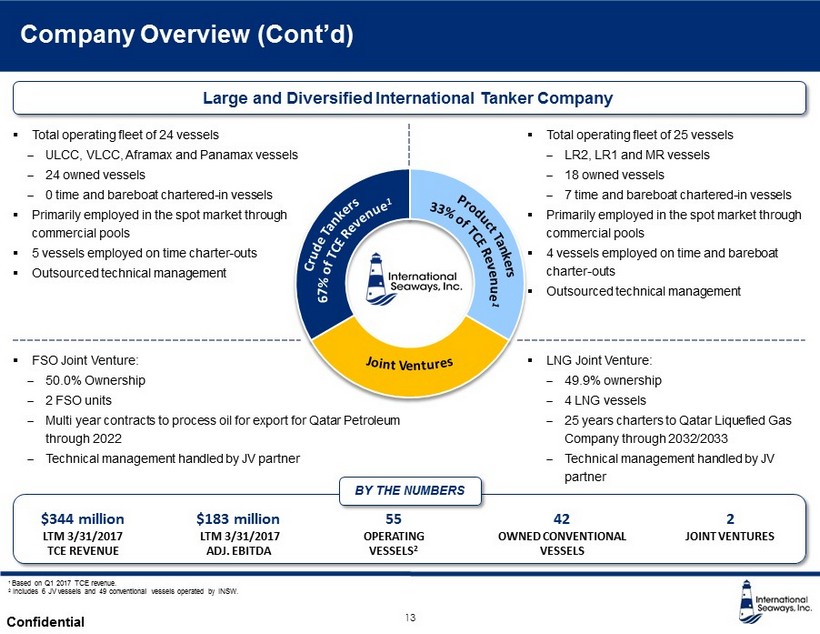
International Seaways, Inc. Confidential 13 Company Overview (Cont’d) ▪ Total operating fleet of 25 vessels ‒ LR2, LR1 and MR vessels ‒ 18 owned vessels ‒ 7 time and bareboat chartered - in vessels ▪ Primarily employed in the spot market through commercial pools ▪ 4 vessels employed on time and bareboat charter - outs ▪ Outsourced technical management Large and Diversified International Tanker Company ▪ Total operating fleet of 24 vessels ‒ ULCC, VLCC, Aframax and Panamax vessels ‒ 24 owned vessels ‒ 0 time and bareboat chartered - in vessels ▪ Primarily employed in the spot market through commercial pools ▪ 5 vessels employed on time charter - outs ▪ Outsourced technical management ▪ FSO Joint Venture: ‒ 50.0% Ownership ‒ 2 FSO units ‒ Multi year contracts to process oil for export for Qatar Petroleum through 2022 ‒ Technical management handled by JV partner ▪ LNG Joint Venture: ‒ 49.9% ownership ‒ 4 LNG vessels ‒ 25 years charters to Qatar Liquefied Gas Company through 2032/2033 ‒ Technical management handled by JV partner BY THE NUMBERS $344 million LTM 3/31/2017 TCE REVENUE $183 million LTM 3/31/2017 ADJ. EBITDA 55 OPERATING VESSELS 2 42 OWNED CONVENTIONAL VESSELS 2 JOINT VENTURES 1 Based on Q1 2017 TCE revenue. 2 Includes 6 JV vessels and 49 conventional vessels operated by INSW.

Key Credit Highlights
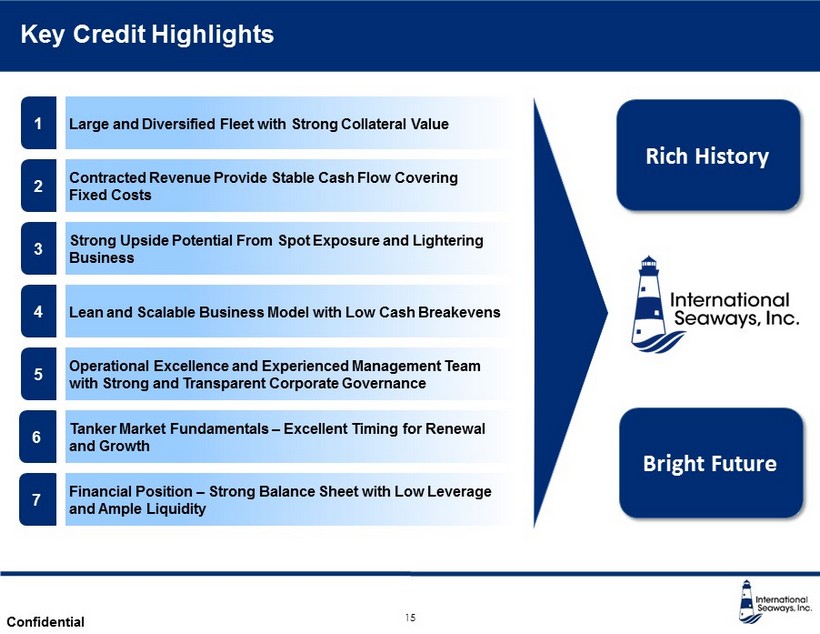
International Seaways, Inc. Confidential Key Credit Highlights Bright Future Rich History 5 Operational Excellence and Experienced Management Team with Strong and Transparent Corporate Governance 3 Strong Upside Potential From Spot Exposure and Lightering Business 2 Contracted Revenue Provide Stable Cash Flow Covering Fixed Costs 4 Lean and Scalable Business Model with Low Cash Breakevens 6 Tanker Market Fundamentals – Excellent Timing for Renewal and Growth 1 Large and Diversified Fleet with Strong Collateral Value 15 7 Financial Position – Strong Balance Sheet with Low Leverage and Ample Liquidity
International Seaways, Inc. Confidential Large and Diversified Fleet with Strong Collateral Value 16 1 Represents the number of vessels in each class as a percentage of the International Flag fleet, as of March 31, 2017. Does n ot include JV vessels. 2 Company Information. 3 Does not include one vessel operating on Commercial Management Agreement (CMA). 4 LNG – 49.9% ownership | FSO – 50% ownership. V ess e l T y pe Size (dwt) Owned Owned DWT Value ($M) 2 Chartered In Total INSW Fl e et TC & BB Out 3 VLCC / ULCC 300,000 – 440,000+ 9 2,875,775 $314.5 0 9 2 A f ra m ax / LR2 112,000 – 113,000 8 897,858 163.7 0 8 - Pana m a x / LR1 70,000 – 75,000 12 853,214 168.7 0 12 6 MR 36,000 – 51,000 13 597,396 175.8 7 20 1 T o t al Cru d e & Product Fleet 42 5,224,243 $822.7 7 49 9 LNG 4 216,000 cbm 4 N/A - - 4 - FSO 4 - 2 873,916 $250.0 - 2 - T o t al JV Fleet 6 6,098,159 $250.0 6 INSW Conventional Tanker Fleet 1 INSW Average Age: 11.8 Years ULCC/ VLCC 18% Aframax/ LR2 16% Panamax/ LR1 25% MR 41% By Vessel Class ULCC/ VLCC 55% Aframax/ LR2 17% Panamax/ LR1 17% MR 11% By DWT Not Included in Collateral 1
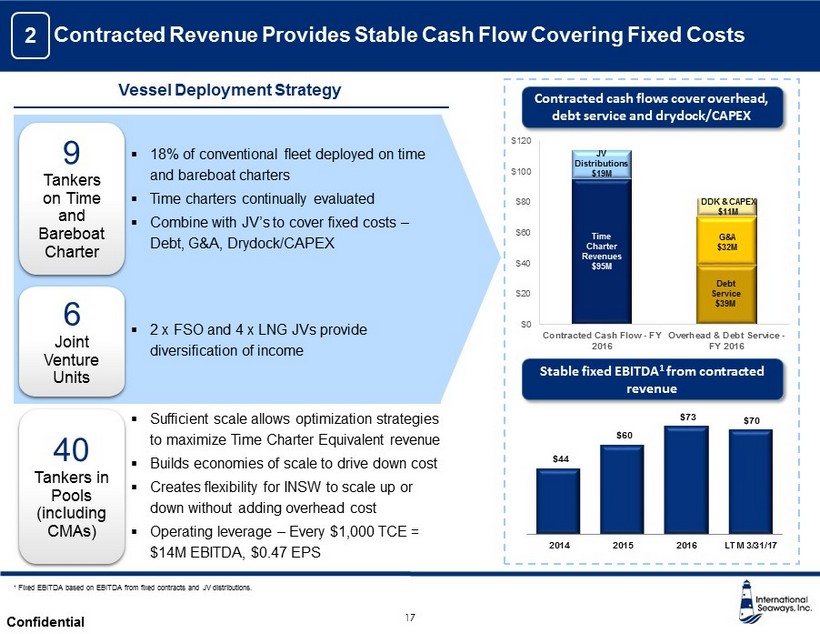
International Seaways, Inc. Confidential Contracted Revenue Provides Stable Cash Flow Covering Fixed Costs 17 ▪ Sufficient scale allows optimization strategies to maximize Time Charter Equivalent revenue ▪ Builds economies of scale to drive down cost ▪ Creates flexibility for INSW to scale up or down without adding overhead cost ▪ Operating leverage – Every $1,000 TCE = $14M EBITDA, $0.47 EPS 40 Tankers in Pools (including CMAs) ▪ 18% of conventional fleet deployed on time and bareboat charters ▪ Time charters continually evaluated ▪ Combine with JV’s to cover fixed costs – Debt, G&A, Drydock /CAPEX 9 Tankers on Time and Bareboat Charter ▪ 2 x FSO and 4 x LNG JVs provide diversification of income 6 Joint Venture Units Vessel Deployment Strategy Contracted cash flows cover overhead, debt service and drydock /CAPEX $0 $20 $40 $60 $80 $100 $120 Contracted Cash Flow - FY 2016 Overhead & Debt Service - FY 2016 Time Charter Revenues $95M JV Distributions $19M Debt Service $39M G&A $32M DDK & CAPEX $11M 2 Stable fixed EBITDA 1 from contracted revenue 1 Fixed EBITDA based on EBITDA from fixed contracts and JV distributions. $44 $60 $73 $70 2014 2015 2016 LTM 3/31/17
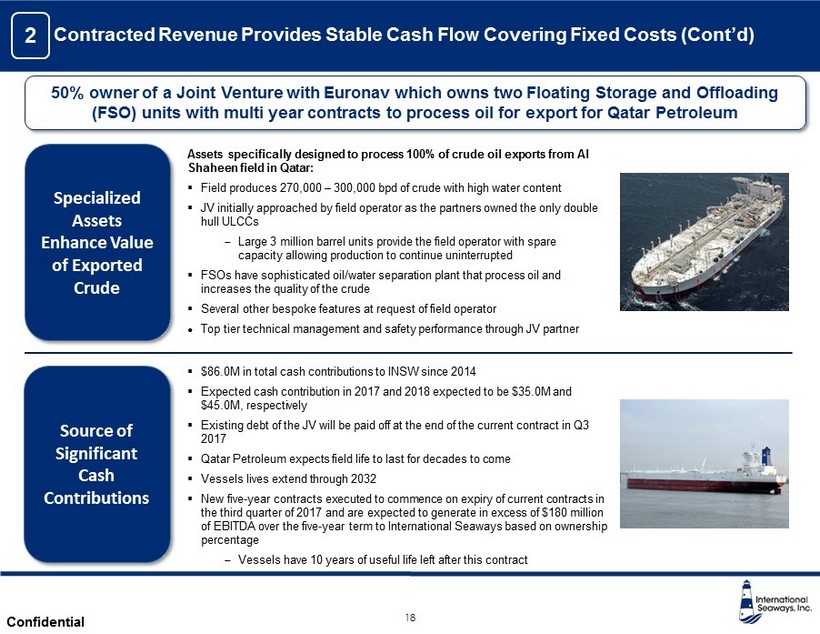
International Seaways, Inc. Confidential 18 Pro v ides global di v ersific at i on w ith expande d customer base ▪ $86.0M in total cash contributions to INSW since 2014 ▪ Expected cash contribution in 2017 and 2018 expected to be $35.0M and $45.0M, respectively ▪ Existing debt of the JV will be paid off at the end of the current contract in Q3 2017 ▪ Qatar Petroleum expects field life to last for decades to come ▪ Vessels lives extend through 2032 ▪ New five - year contracts executed to commence on expiry of current contracts in the third quarter of 2017 and are expected to generate in excess of $180 million of EBITDA over the five - year term to International Seaways based on ownership percentage ‒ Vessels have 10 years of useful life left after this contract Source of Significant Cash Contributions Specialized Assets Enhance Value of Exported Crude Assets specifically designed to process 100% of crude oil exports from Al Shaheen field in Qatar: ▪ Field produces 270,000 – 300,000 bpd of crude with high water content ▪ JV initially approached by field operator as the partners owned the only double hull ULCCs ‒ Large 3 million barrel units provide the field operator with spare capacity allowing production to continue uninterrupted ▪ FSOs have sophisticated oil/water separation plant that process oil and increases the quality of the crude ▪ Several other bespoke features at request of field operator ● Top tier technical management and safety performance through JV partner Contracted Revenue Provides Stable Cash Flow Covering Fixed Costs (Cont’d) 2 50% owner of a Joint Venture with Euronav which owns two Floating Storage and Offloading (FSO) units with multi year contracts to process oil for export for Qatar Petroleum
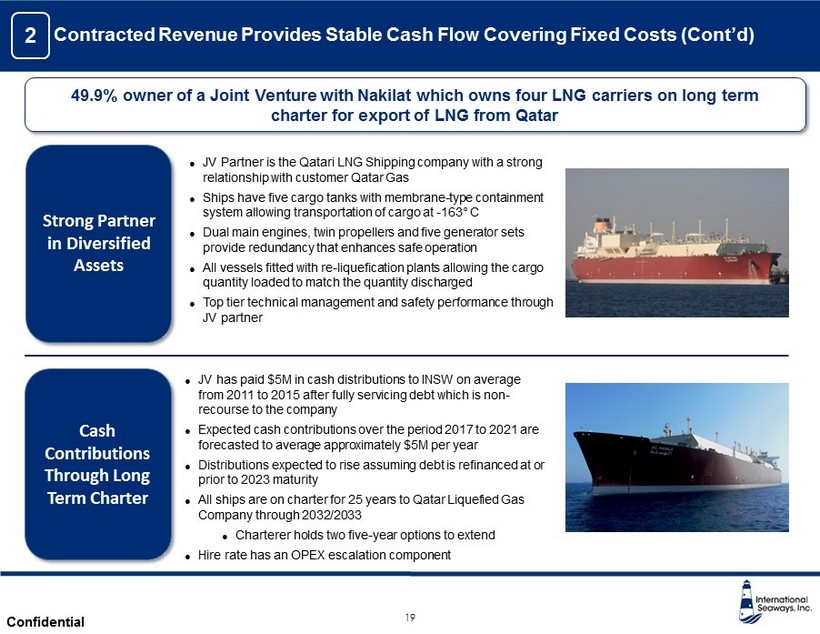
International Seaways, Inc. Confidential 19 Pro v ides global di v ersific at i on w ith expande d customer base ● JV Partner is the Qatari LNG Shipping company with a strong relationship with customer Qatar Gas ● Ships have five cargo tanks with membrane - type containment system allowing transportation of cargo at - 163 ƒ C ● Dual main engines, twin propellers and five generator sets provide redundancy that enhances safe operation ● All vessels fitted with re - liquefication plants allowing the cargo quantity loaded to match the quantity discharged ● Top tier technical management and safety performance through JV partner Strong Partner in Diversified Assets ● JV has paid $5M in cash distributions to INSW on average from 2011 to 2015 after fully servicing debt which is non - recourse to the company ● Expected cash contributions over the period 2017 to 2021 are forecasted to average approximately $5M per year ● Distributions expected to rise assuming debt is refinanced at or prior to 2023 maturity ● All ships are on charter for 25 years to Qatar Liquefied Gas Company through 2032/2033 ● Charterer holds two five - year options to extend ● Hire rate has an OPEX escalation component Cash Contributions Through Long Term Charter Contracted Revenue Provides Stable Cash Flow Covering Fixed Costs (Cont’d) 2 49.9% owner of a Joint Venture with Nakilat which owns four LNG carriers on long term charter for export of LNG from Qatar
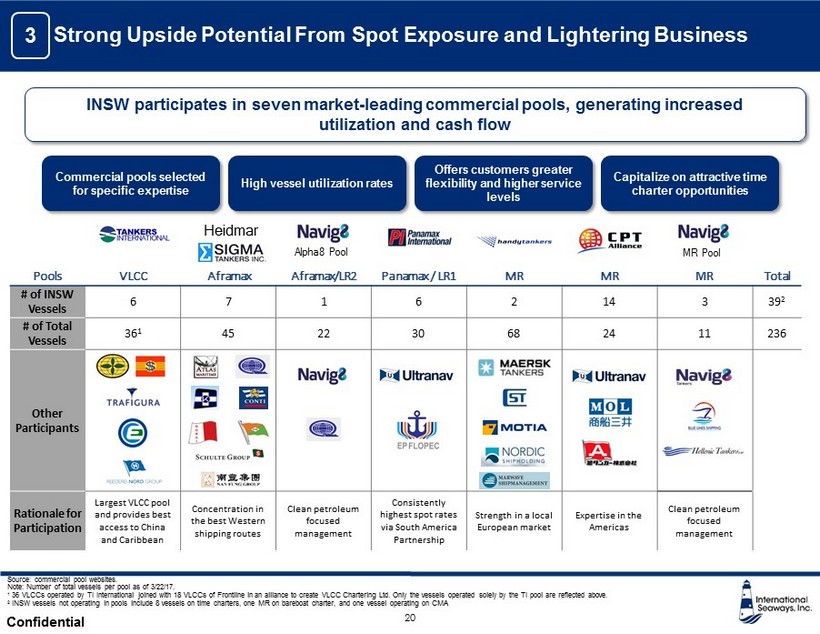
International Seaways, Inc. Confidential 20 Pools VLCC Aframax Aframax /LR2 Panamax / LR1 MR MR MR Total # of INSW Vessels 6 7 1 6 2 14 3 39 2 # of Total Vessels 36 1 45 22 30 68 24 11 236 Other Participants Rationale for Participation Largest VLCC pool and provides best access to China and Caribbean Concentration in the best Western shipping routes Clean petroleum focused management Consistently highest spot rates via South America Partnership Strength in a local European market Expertise in the Americas Clean petroleum focused management High vessel utilization rates Commercial pools selected for specific expertise Offers customers greater flexibility and higher service levels Capitalize on attractive time charter opportunities Source: commercial pool websites. Note: Number of total vessels per pool as of 3/22/17. 1 36 VLCCs operated by TI International joined with 18 VLCCs of Frontline in an alliance to create VLCC Chartering Ltd. Only th e vessels operated solely by the TI pool are reflected above. 2 INSW vessels not operating in pools include 8 vessels on time charters, one MR on bareboat charter, and one vessel operating on CMA Heidmar Alpha8 Pool MR Pool 3 Strong Upside Potential From Spot Exposure and Lightering Business INSW participates in seven market - leading commercial pools, generating increased utilization and cash flow
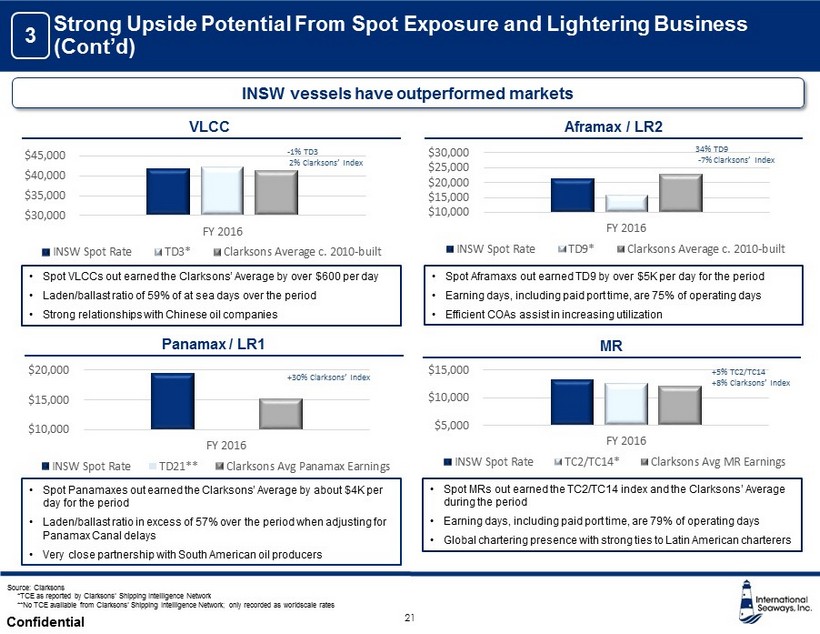
International Seaways, Inc. Confidential • Spot VLCCs out earned the Clarksons ’ Average by over $600 per day • Laden/ballast ratio of 59% of at sea days over the period • Strong relationships with Chinese oil companies $10,000 $15,000 $20,000 $25,000 $30,000 FY 2016 INSW Spot Rate TD9* Clarksons Average c. 2010-built $5,000 $10,000 $15,000 FY 2016 INSW Spot Rate TC2/TC14* Clarksons Avg MR Earnings $10,000 $15,000 $20,000 FY 2016 INSW Spot Rate TD21** Clarksons Avg Panamax Earnings • Spot Aframaxs out earned TD9 by over $5K per day for the period • Earning days, including paid port time, are 75% of operating days • Efficient COAs assist in increasing utilization 21 Source: Clarksons *TCE as reported by Clarksons’ Shipping Intelligence Network **No TCE available from Clarksons’ Shipping Intelligence Network; only recorded as worldscale rates $30,000 $35,000 $40,000 $45,000 FY 2016 INSW Spot Rate TD3* Clarksons Average c. 2010-built • Spot Panamaxes out earned the Clarksons’ Average by about $4K per day for the period • Laden/ballast ratio in excess of 57% over the period when adjusting for Panamax Canal delays • Very close partnership with South American oil producers • Spot MRs out earned the TC2/TC14 index and the Clarksons’ Average during the period • Earning days, including paid port time, are 79% of operating days • Global chartering presence with strong ties to Latin American charterers - 1% TD3 2% Clarksons’ Index 34% TD9 - 7% Clarksons’ Index +5% TC2/TC14 +8% Clarksons’ Index +30% Clarksons’ Index Strong Upside Potential From Spot Exposure and Lightering Business (Cont’d) 3 INSW vessels have outperformed markets VLCC Aframax / LR2 Panamax / LR1 MR
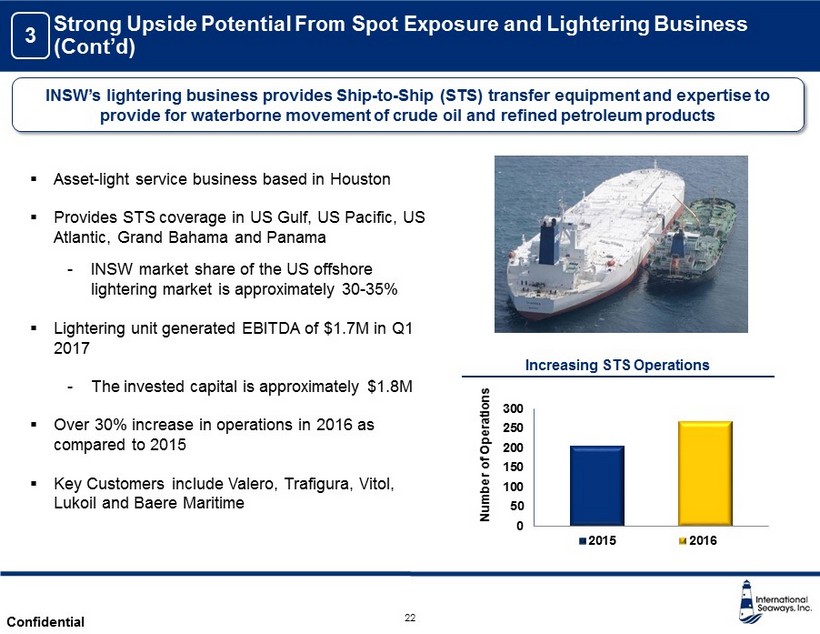
International Seaways, Inc. Confidential 22 ▪ Asset - light service business based in Houston ▪ Provides STS coverage in US Gulf, US Pacific, US Atlantic, Grand Bahama and Panama - INSW market share of the US offshore lightering market is approximately 30 - 35% ▪ Lightering unit generated EBITDA of $1.7M in Q1 2017 - The invested capital is approximately $1.8M ▪ Over 30% increase in operations in 2016 as compared to 2015 ▪ Key Customers include Valero, Trafigura , Vitol, Lukoil and Baere Maritime 0 50 100 150 200 250 300 Number of Operations 2015 2016 3 Strong Upside Potential From Spot Exposure and Lightering Business (Cont’d) INSW’s lightering business provides Ship - to - Ship (STS) transfer equipment and expertise to provide for waterborne movement of crude oil and refined petroleum products Increasing STS Operations
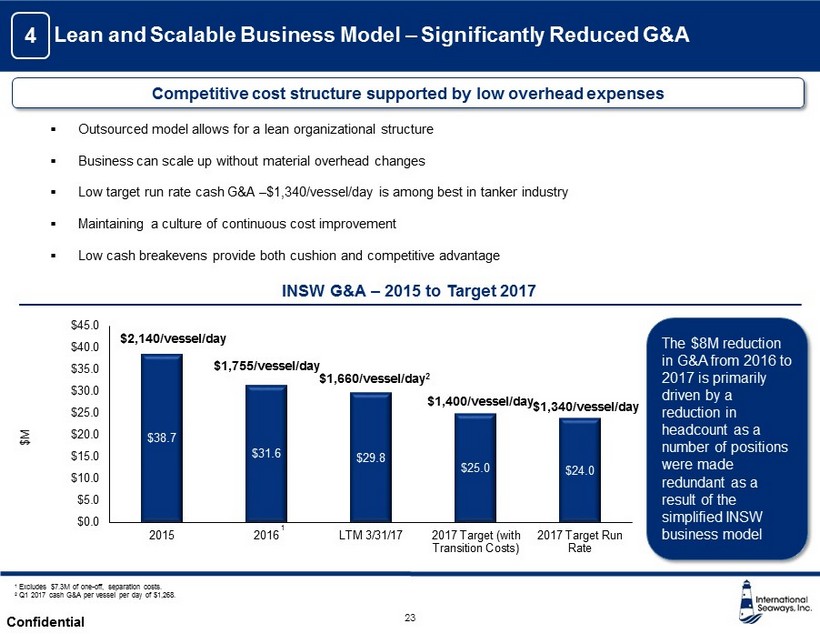
International Seaways, Inc. Confidential $38.7 $31.6 $29.8 $25.0 $24.0 $0.0 $5.0 $10.0 $15.0 $20.0 $25.0 $30.0 $35.0 $40.0 $45.0 2015 2016 LTM 3/31/17 2017 Target (with Transition Costs) 2017 Target Run Rate $M 23 ▪ Outsourced model allows for a lean organizational structure ▪ Business can scale up without material overhead changes ▪ Low target run rate cash G&A – $1,340/vessel/day is among best in tanker industry ▪ Maintaining a culture of continuous cost improvement ▪ Low cash breakevens provide both cushion and competitive advantage $2,140/vessel/day $1,755/vessel/day INSW G&A – 2015 to Target 2017 $1,660/vessel/day 2 $1,340/vessel/day The $8M reduction in G&A from 2016 to 2017 is primarily driven by a reduction in headcount as a number of positions were made redundant as a result of the simplified INSW business model 1 Excludes $7.3M of one - off, separation costs. 2 Q1 2017 cash G&A per vessel per day of $1,268. Lean and Scalable Business Model – Significantly Reduced G&A 4 Competitive cost structure supported by low overhead expenses 1 $1,400/vessel/day
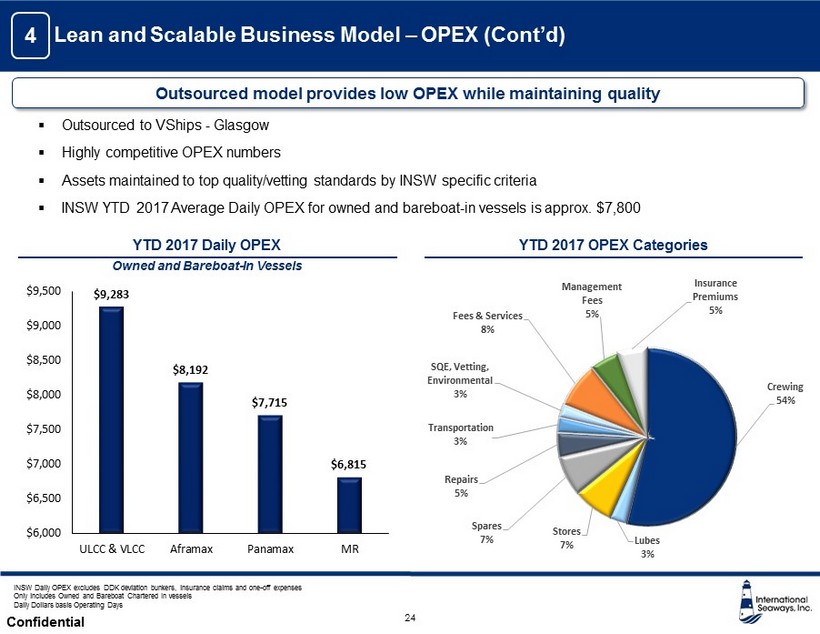
International Seaways, Inc. Confidential 24 15 ▪ Outsourced to VShips - Glasgow ▪ Highly competitive OPEX numbers ▪ Assets maintained to top quality/vetting standards by INSW specific criteria ▪ INSW YTD 2017 Average Daily OPEX for owned and bareboat - in vessels is approx. $7,800 Lean and Scalable Business Model – OPEX (Cont’d) 4 Outsourced model provides low OPEX while maintaining quality YTD 2017 OPEX Categories YTD 2017 Daily OPEX Owned and Bareboat - In Vessels INSW Daily OPEX excludes DDK deviation bunkers, insurance claims and one - off expenses Only includes Owned and Bareboat Chartered In vessels Daily Dollars basis Operating Days Crewing 54% Lubes 3% Stores 7% Spares 7% Repairs 5% Transportation 3% SQE, Vetting, Environmental 3% Fees & Services 8% Management Fees 5% Insurance Premiums 5% $9,283 $8,192 $7,715 $6,815 $6,000 $6,500 $7,000 $7,500 $8,000 $8,500 $9,000 $9,500 ULCC & VLCC Aframax Panamax MR
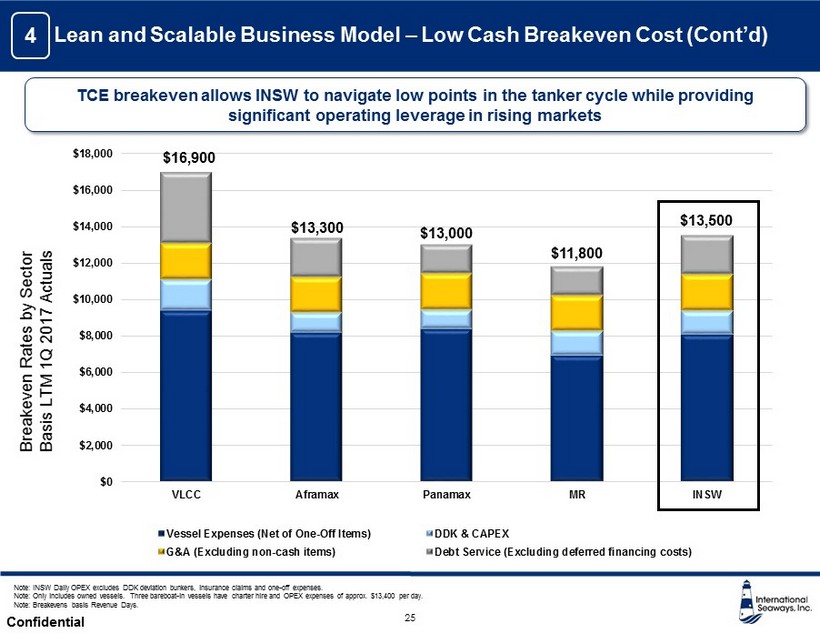
International Seaways, Inc. Confidential 25 Note: INSW Daily OPEX excludes DDK deviation bunkers, insurance claims and one - off expenses. Note: Only includes owned vessels. Three bareboat - in vessels have charter hire and OPEX expenses of approx. $13,400 per day. Note: Breakevens basis Revenue Days. Lean and Scalable Business Model – Low Cash Breakeven Cost (Cont’d) 4 TCE breakeven allows INSW to navigate low points in the tanker cycle while providing significant operating leverage in rising markets $0 $2,000 $4,000 $6,000 $8,000 $10,000 $12,000 $14,000 $16,000 $18,000 VLCC Aframax Panamax MR INSW Vessel Expenses (Net of One-Off Items) DDK & CAPEX G&A (Excluding non-cash items) Debt Service (Excluding deferred financing costs) $16,900 $13,300 $13,000 $11,800 $13,500 Breakeven Rates by Sector Basis LTM 1Q 2017 Actuals
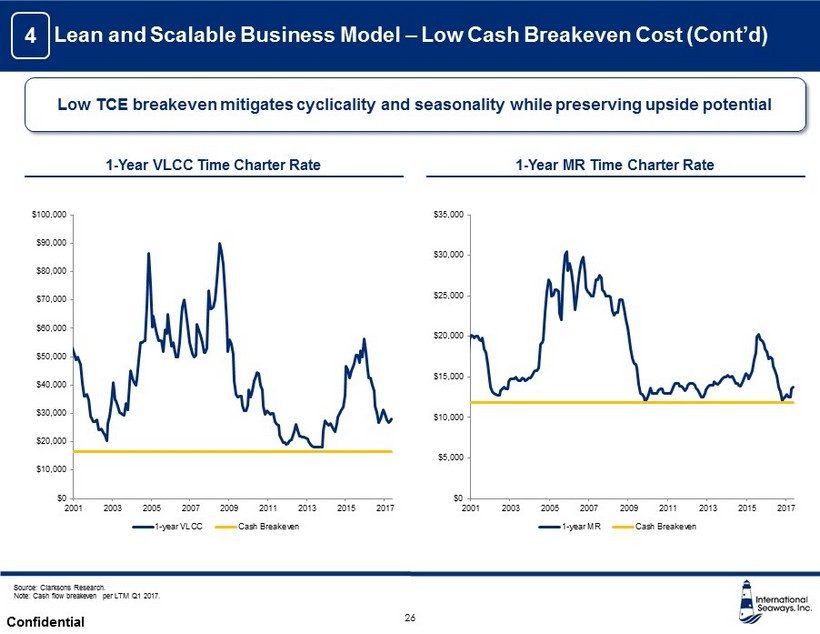
International Seaways, Inc. Confidential 26 Lean and Scalable Business Model – Low Cash Breakeven Cost (Cont’d) 4 Low TCE breakeven mitigates cyclicality and seasonality while preserving upside potential $0 $10,000 $20,000 $30,000 $40,000 $50,000 $60,000 $70,000 $80,000 $90,000 $100,000 2001 2003 2005 2007 2009 2011 2013 2015 2017 1-year VLCC Cash Breakeven $0 $5,000 $10,000 $15,000 $20,000 $25,000 $30,000 $35,000 2001 2003 2005 2007 2009 2011 2013 2015 2017 1-year MR Cash Breakeven 1 - Year MR Time Charter Rate 1 - Year VLCC Time Charter Rate Source: Clarksons Research. Note : Cash flow breakeven per LTM Q1 2017.
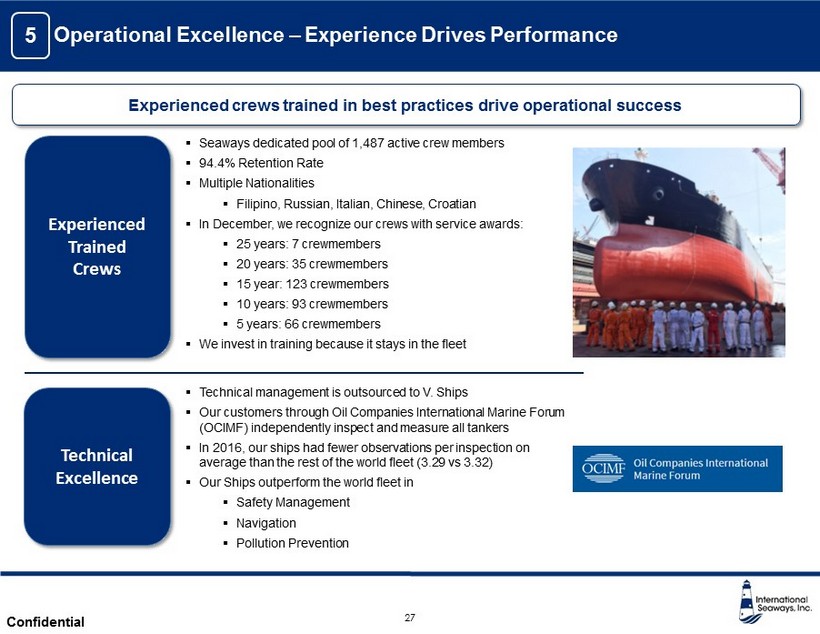
International Seaways, Inc. Confidential 27 Pro v ides global di v ersific at i on w ith expande d customer base ▪ Technical management is outsourced to V. Ships ▪ Our customers through Oil Companies International Marine Forum (OCIMF) independently inspect and measure all tankers ▪ In 2016, our ships had fewer observations per inspection on average than the rest of the world fleet (3.29 vs 3.32) ▪ Our Ships outperform the world fleet in ▪ Safety Management ▪ Navigation ▪ Pollution Prevention ▪ Seaways dedicated pool of 1,487 active crew members ▪ 94.4% Retention Rate ▪ Multiple Nationalities ▪ Filipino, Russian, Italian, Chinese, Croatian ▪ In December, we recognize our crews with service awards: ▪ 25 years: 7 crewmembers ▪ 20 years: 35 crewmembers ▪ 15 year: 123 crewmembers ▪ 10 years: 93 crewmembers ▪ 5 years: 66 crewmembers ▪ We invest in training because it stays in the fleet Experienced Trained Crews Technical Excellence Operational Excellence – Experience Drives Performance 5 Experienced crews trained in best practices drive operational success
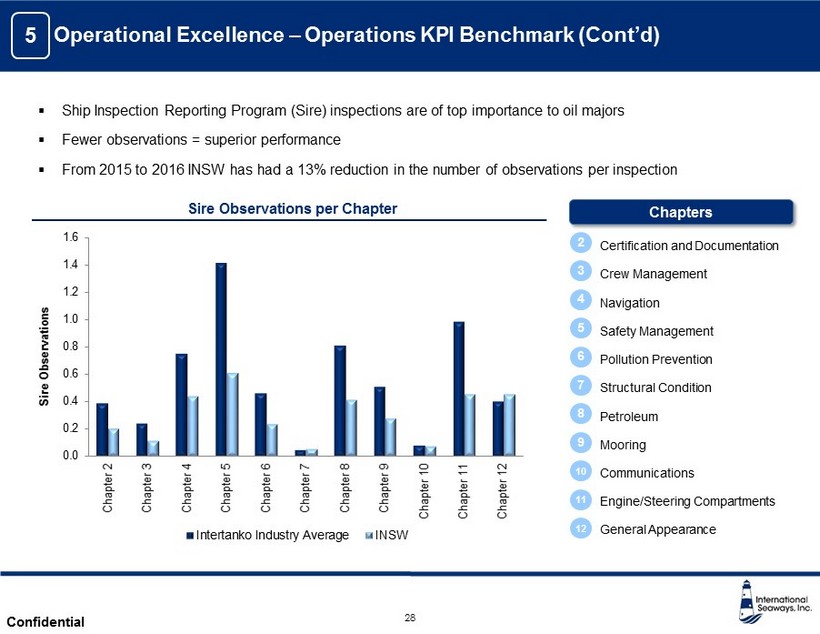
International Seaways, Inc. Confidential Confidential 0.0 0.2 0.4 0.6 0.8 1.0 1.2 1.4 1.6 Chapter 2 Chapter 3 Chapter 4 Chapter 5 Chapter 6 Chapter 7 Chapter 8 Chapter 9 Chapter 10 Chapter 11 Chapter 12 Intertanko Industry Average INSW Certification and Documentation Crew Management Navigation Safety Management Pollution Prevention Structural Condition Petroleum Mooring Communications Engine/Steering Compartments General Appearance Sire Observations per Chapter Sire Observations 2 3 4 5 6 7 8 9 10 11 12 Chapters ▪ Ship Inspection Reporting Program (Sire) inspections are of top importance to oil majors ▪ Fewer observations = superior performance ▪ From 2015 to 2016 INSW has had a 13% reduction in the number of observations per inspection 28 Operational Excellence – Operations KPI Benchmark (Cont’d) 5
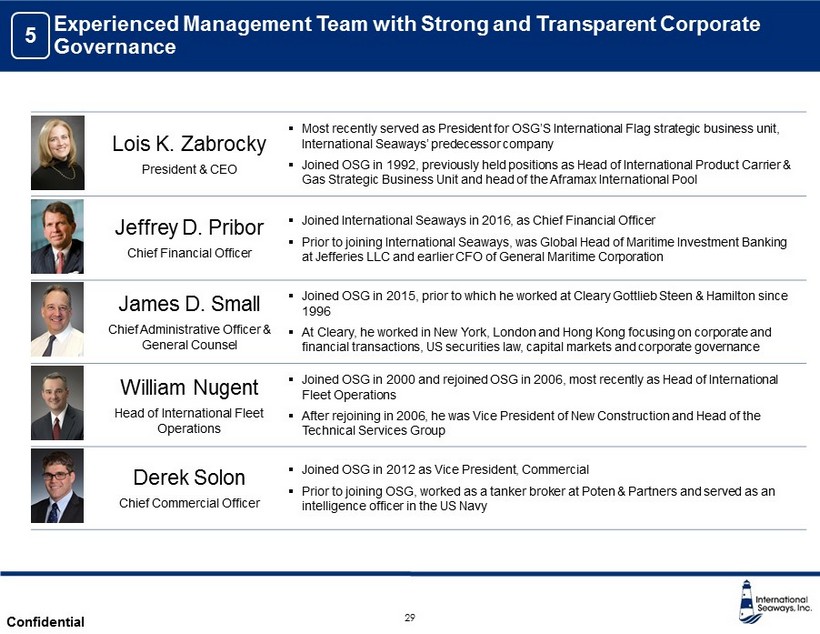
International Seaways, Inc. Confidential Lois K. Zabrocky President & CEO ▪ Most recently served as President for OSG’S International Flag strategic business unit, International Seaways’ predecessor company ▪ Joined OSG in 1992, previously held positions as Head of International Product Carrier & Gas Strategic Business Unit and head of the Aframax International Pool Jeffrey D. Pribor Chief Financial Officer ▪ Joined International Seaways in 2016, as Chief Financial Officer ▪ Prior to joining International Seaways, was Global Head of Maritime Investment Banking at Jefferies LLC and earlier CFO of General Maritime Corporation James D. Small Chief Administrative Officer & General Counsel ▪ Joined OSG in 2015, prior to which he worked at Cleary Gottlieb Steen & Hamilton since 1996 ▪ At Cleary, he worked in New York, London and Hong Kong focusing on corporate and financial transactions, US securities law, capital markets and corporate governance William Nugent Head of International Fleet Operations ▪ Joined OSG in 2000 and rejoined OSG in 2006, most recently as Head of International Fleet Operations ▪ After rejoining in 2006 , he was Vice President of New Construction and Head of the Technical Services Group Derek Solon Chief Commercial Officer ▪ Joined OSG in 2012 as Vice President, Commercial ▪ Prior to joining OSG, worked as a tanker broker at Poten & Partners and served as an intelligence officer in the US Navy 29 Experienced Management Team with Strong and Transparent Corporate Governance 5
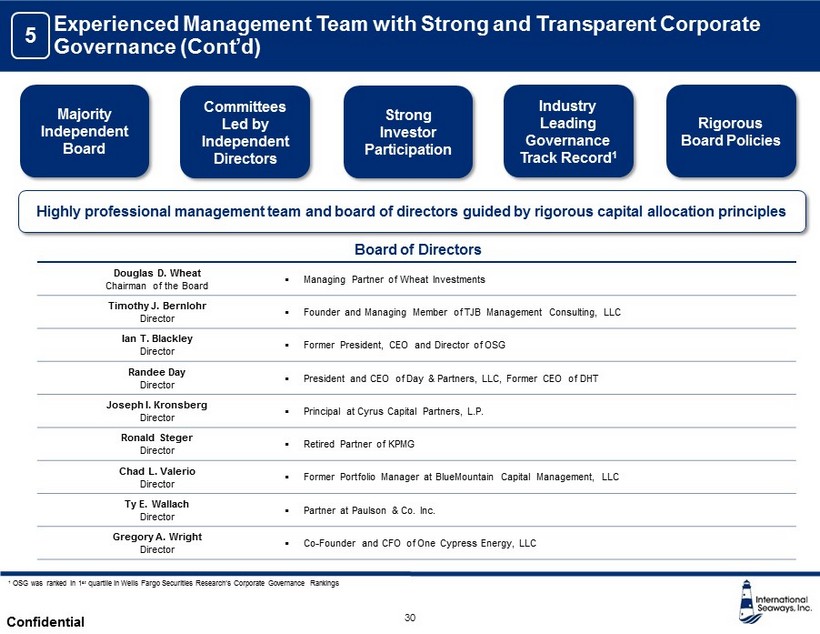
International Seaways, Inc. Confidential Douglas D. Wheat Chairman of the Board ▪ Managing Partner of Wheat Investments Timothy J. Bernlohr Director ▪ Founder and Managing Member of TJB Management Consulting, LLC Ian T. Blackley Director ▪ Former President, CEO and Director of OSG Randee Day Director ▪ President and CEO of Day & Partners, LLC, Former CEO of DHT Joseph I. Kro nsbe rg Director ▪ Principal at Cyrus Capital Partners, L.P. Ronald Steger Director ▪ Retired Partner of KPMG Chad L. Valerio Director ▪ Former Portfolio Manager at BlueMountain Capital Management, LLC Ty E. Wallach Director ▪ Partner at Paulson & Co. Inc. Gregory A. Wright Director ▪ Co - Founder and CFO of One Cypress Energy, LLC 30 Majority Independent Board Rigorous Board Policies Committees Led by Independent Directors Board of Directors Industry Leading Governance Track Record 1 Highly professional management team and board of directors guided by rigorous capital allocation principles 1 OSG was ranked in 1 st quartile in Wells Fargo Securities Research’s Corporate Governance Rankings Strong Investor Participation Experienced Management Team with Strong and Transparent Corporate Governance (Cont’d) 5
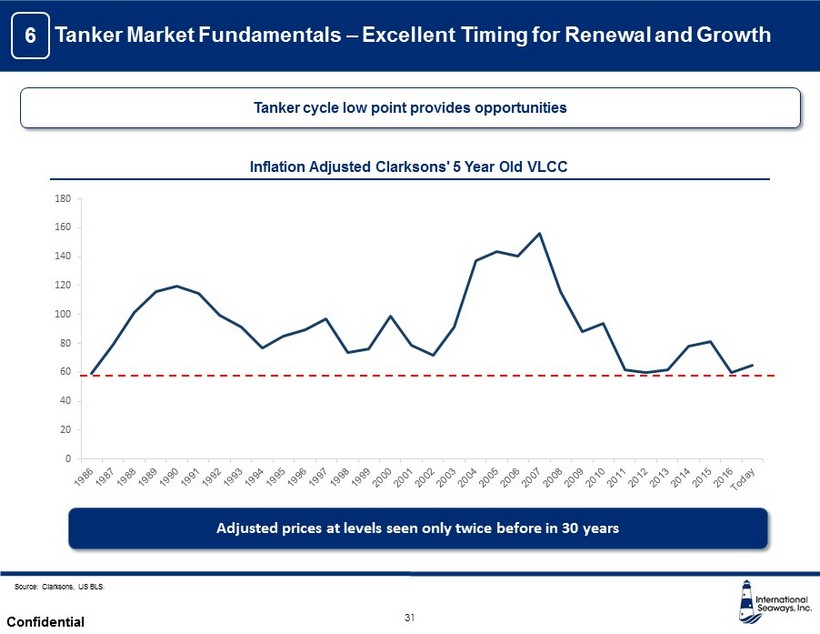
International Seaways, Inc. Confidential 0 20 40 60 80 100 120 140 160 180 Source: Clarksons, US BLS. 31 Inflation Adjusted Clarksons ' 5 Year Old VLCC Adjusted prices at levels seen only twice before in 30 years Tanker cycle low point provides opportunities Tanker Market Fundamentals – Excellent Timing for Renewal and Growth 6
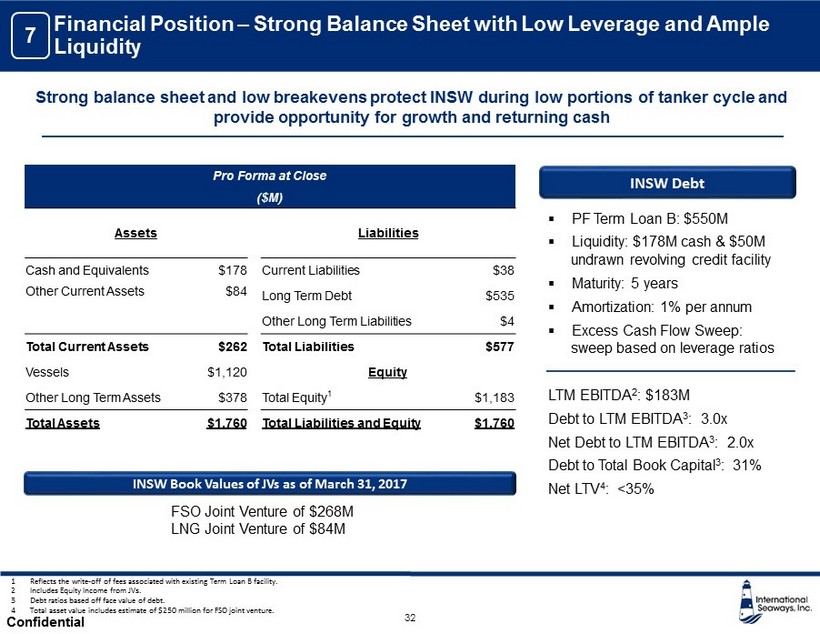
International Seaways, Inc. Confidential 32 Strong balance sheet and low breakevens protect INSW during low portions of tanker cycle and provide opportunity for growth and returning cash ▪ PF Term Loan B: $550M ▪ Liquidity: $178M cash & $50M undrawn revolving credit facility ▪ Maturity: 5 years ▪ Amortization: 1% per annum ▪ Excess Cash Flow Sweep: sweep based on leverage ratios LTM EBITDA 2 : $183M Debt to LTM EBITDA 3 : 3.0x Net Debt to LTM EBITDA 3 : 2.0x Debt to Total Book Capital 3 : 31% Net LTV 4 : <35% INSW Debt 1 Reflects the write - off of fees associated with existing Term Loan B facility. 2 Includes Equity Income from JVs. 3 Debt ratios based off face value of debt. 4 Total asset value includes estimate of $250 million for FSO joint venture. Pro Forma at Close ($M) Assets Liabilities Cash and Equivalents $178 Current Liabilities $38 Other Current Assets $84 Long Term Debt $535 Other Long Term Liabilities $4 Total Current Assets $262 Total Liabilities $577 Vessels $1,120 Equity Other Long Term Assets $378 Total Equity 1 $1,183 Total Assets $1,760 Total Liabilities and Equity $1,760 FSO Joint Venture of $268M LNG Joint Venture of $84M INSW Book Values of JVs as of March 31, 2017 7 Financial Position – Strong Balance Sheet with Low Leverage and Ample Liquidity
Market Fundamentals
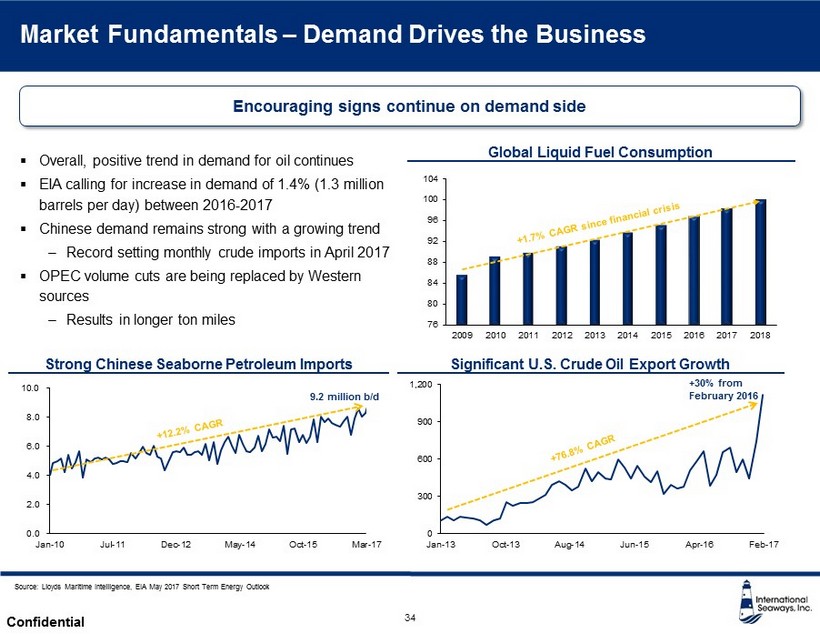
International Seaways, Inc. Confidential 76 80 84 88 92 96 100 104 2009 2010 2011 2012 2013 2014 2015 2016 2017 2018 Market Fundamentals – Demand Drives the Business 34 Source: Lloyds Maritime Intelligence, EIA May 2017 Short Term Energy Outlook Strong Chinese Seaborne Petroleum Imports Encouraging signs continue on demand side Global Liquid Fuel Consumption ▪ Overall, positive trend in demand for oil continues ▪ EIA calling for increase in demand of 1.4% (1.3 million barrels per day) between 2016 - 2017 ▪ Chinese demand remains strong with a growing trend – Record setting monthly crude imports in April 2017 ▪ OPEC volume cuts are being replaced by Western sources – Results in longer ton miles Significant U.S. Crude Oil Export Growth +30% from February 2016 0 300 600 900 1,200 Jan-13 Oct-13 Aug-14 Jun-15 Apr-16 Feb-17 0.0 2.0 4.0 6.0 8.0 10.0 Jan-10 Jul-11 Dec-12 May-14 Oct-15 Mar-17 9.2 million b/d
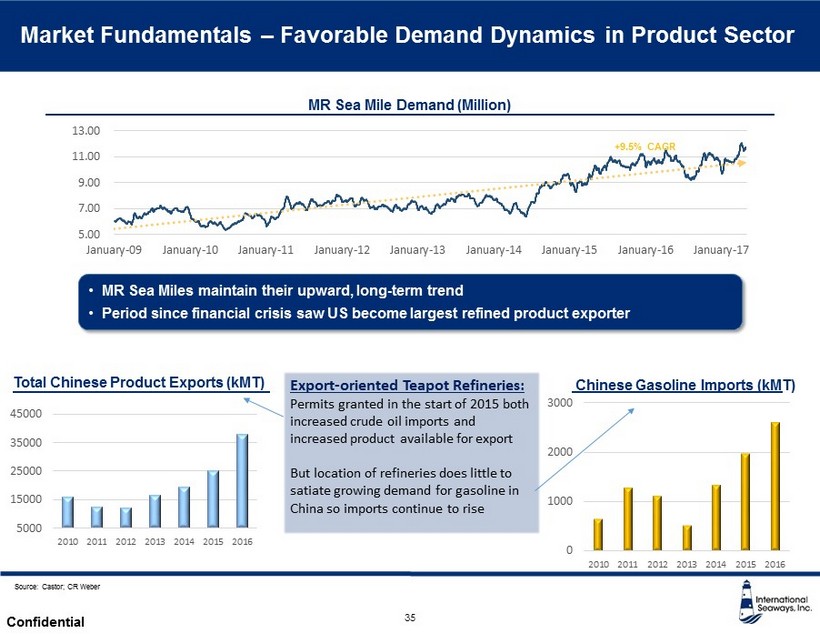
International Seaways, Inc. Confidential Export - oriented Teapot Refineries: Permits granted in the start of 2015 both increased crude oil imports and increased product available for export But location of refineries does little to satiate growing demand for gasoline in China so imports continue to rise Chinese Gasoline Imports ( kMT ) 0 1000 2000 3000 2010 2011 2012 2013 2014 2015 2016 Total Chinese Product Exports ( kMT ) 5000 15000 25000 35000 45000 2010 2011 2012 2013 2014 2015 2016 Market Fundamentals – Favorable Demand Dynamics in Product Sector 35 $/Day Source: Castor; CR Weber MR Sea Mile Demand (Million) • MR Sea Miles maintain their upward, long - term trend • Period since financial crisis saw US become largest refined product exporter 5.00 7.00 9.00 11.00 13.00 January-09 January-10 January-11 January-12 January-13 January-14 January-15 January-16 January-17 +9.5% CAGR
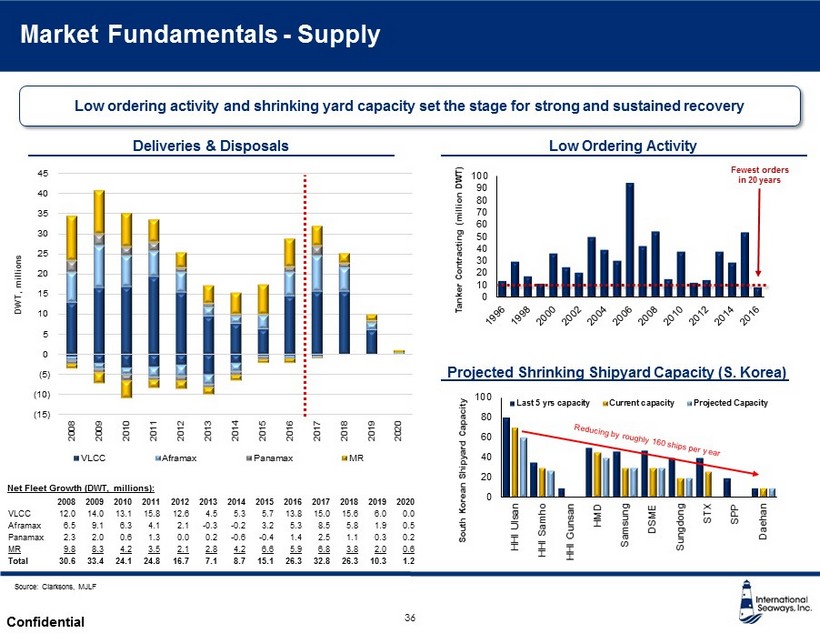
International Seaways, Inc. Confidential (15) (10) (5) 0 5 10 15 20 25 30 35 40 45 2008 2009 2010 2011 2012 2013 2014 2015 2016 2017 2018 2019 2020 DWT, millions VLCC Aframax Panamax MR Market Fundamentals - Supply 36 0 10 20 30 40 50 60 70 80 90 100 Fewest orders in 20 years 0 20 40 60 80 100 HHI Ulsan HHI Samho HHI Gunsan HMD Samsung DSME Sungdong STX SPP Daehan Last 5 yrs capacity Current capacity Projected Capacity Source: Clarksons , MJLF Low ordering activity and shrinking yard capacity set the stage for strong and sustained recovery Deliveries & Disposals Projected Shrinking Shipyard Capacity (S. Korea) Tanker Contracting (million DWT) South Korean Shipyard Capacity Low Ordering Activity Net Fleet Growth (DWT, millions): 2008 2009 2010 2011 2012 2013 2014 2015 2016 2017 2018 2019 2020 VLCC 12.0 14.0 13.1 15.8 12.6 4.5 5.3 5.7 13.8 15.0 15.6 6.0 0.0 Aframax 6.5 9.1 6.3 4.1 2.1 - 0.3 - 0.2 3.2 5.3 8.5 5.8 1.9 0.5 Panamax 2.3 2.0 0.6 1.3 0.0 0.2 - 0.6 - 0.4 1.4 2.5 1.1 0.3 0.2 MR 9.8 8.3 4.2 3.5 2.1 2.8 4.2 6.6 5.9 6.8 3.8 2.0 0.6 Total 30.6 33.4 24.1 24.8 16.7 7.1 8.7 15.1 26.3 32.8 26.3 10.3 1.2

Financial Overview
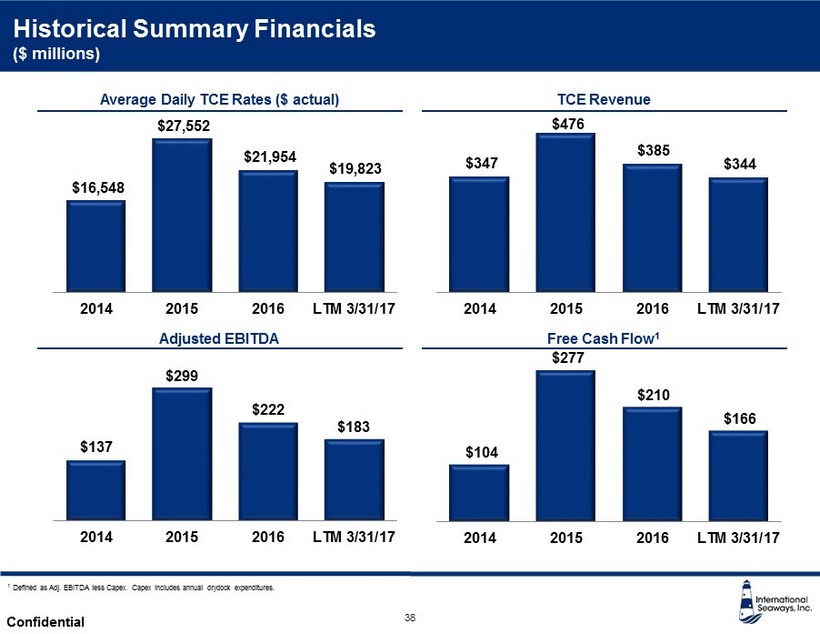
International Seaways, Inc. Confidential $347 $476 $385 $344 2014 2015 2016 LTM 3/31/17 $137 $299 $222 $183 2014 2015 2016 LTM 3/31/17 $104 $277 $210 $166 2014 2015 2016 LTM 3/31/17 Historical Summary Financials ($ millions) Adjusted EBITDA Free Cash Flow 1 Average Daily TCE Rates ($ actual) TCE Revenue 38 1 Defined as Adj. EBITDA less Capex. Capex includes annual drydock expenditures. $16,548 $27,552 $21,954 $19,823 2014 2015 2016 LTM 3/31/17
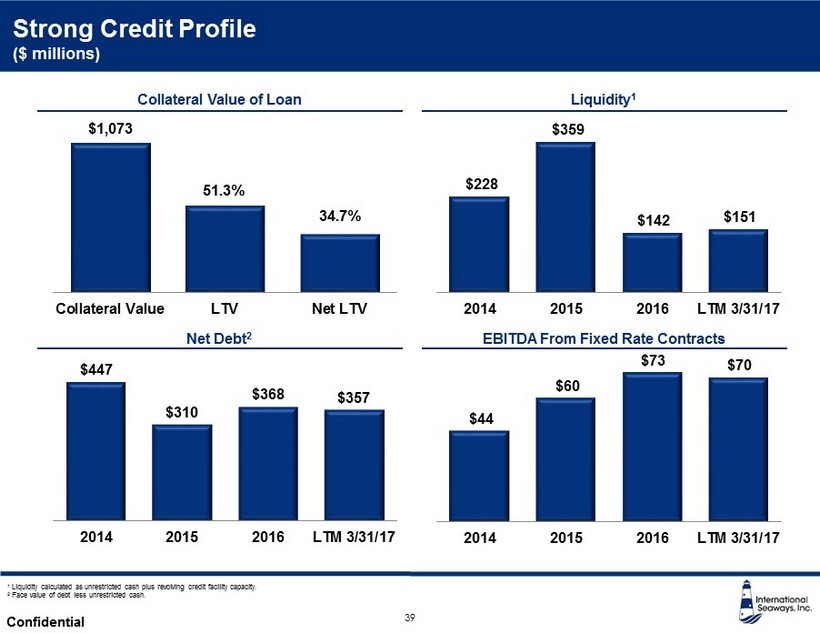
International Seaways, Inc. Confidential $228 $359 $142 $151 2014 2015 2016 LTM 3/31/17 $447 $310 $368 $357 2014 2015 2016 LTM 3/31/17 $44 $60 $73 $70 2014 2015 2016 LTM 3/31/17 Strong Credit Profile ($ millions) Net Debt 2 EBITDA From Fixed Rate Contracts Collateral Value of Loan Liquidity 1 39 1 Liquidity calculated as unrestricted cash plus revolving credit facility capacity. 2 Face value of debt less unrestricted cash. $1,073 51.3% 34.7% Collateral Value LTV Net LTV
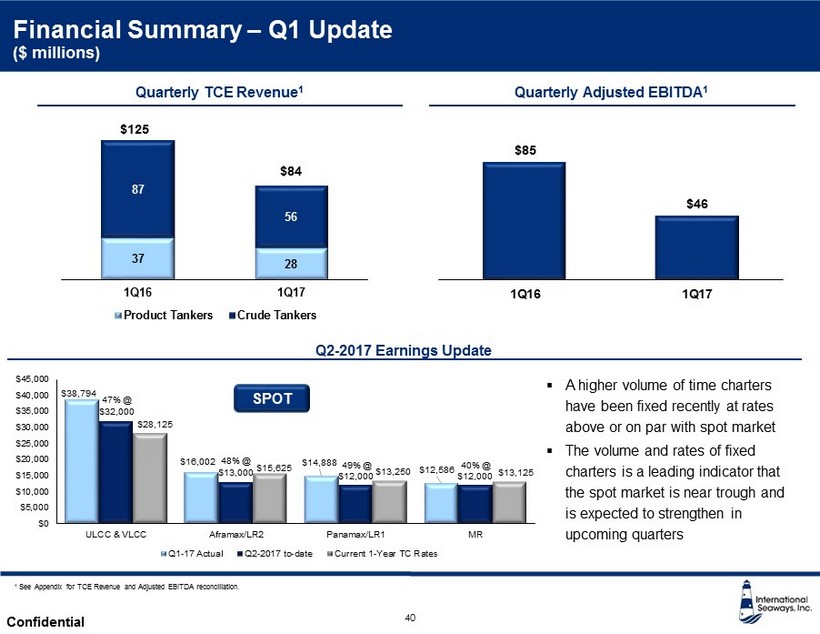
International Seaways, Inc. Confidential 37 28 87 56 1Q16 1Q17 Product Tankers Crude Tankers Financial Summary – Q1 Update ($ millions) 1 See Appendix for TCE Revenue and Adjusted EBITDA reconciliation. $125 $84 $38,794 $16,002 $14,888 $12,586 $32,000 $13,000 $12,000 $12,000 $28,125 $15,625 $13,250 $13,125 $0 $5,000 $10,000 $15,000 $20,000 $25,000 $30,000 $35,000 $40,000 $45,000 ULCC & VLCC Aframax/LR2 Panamax/LR1 MR Q1-17 Actual Q2-2017 to-date Current 1-Year TC Rates 40 47% @ 48% @ 49% @ 40% @ SPOT Quarterly TCE Revenue 1 Q2 - 2017 Earnings Update Quarterly Adjusted EBITDA 1 $85 $46 1Q16 1Q17 ▪ A higher volume of time charters have been fixed recently at rates above or on par with spot market ▪ The volume and rates of fixed charters is a leading indicator that the spot market is near trough and is expected to strengthen in upcoming quarters
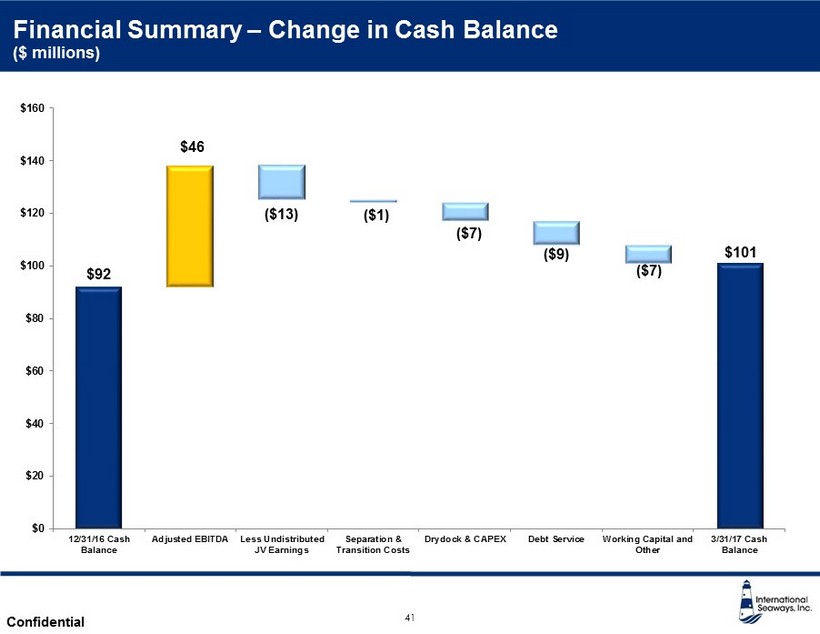
International Seaways, Inc. Confidential Financial Summary – Change in Cash Balance ($ millions) 41 $46 ($13) ($1) ($7) ($9) ($7) $92 $101 $0 $20 $40 $60 $80 $100 $120 $140 $160 12/31/16 Cash Balance Adjusted EBITDA Less Undistributed JV Earnings Separation & Transition Costs Drydock & CAPEX Debt Service Working Capital and Other 3/31/17 Cash Balance
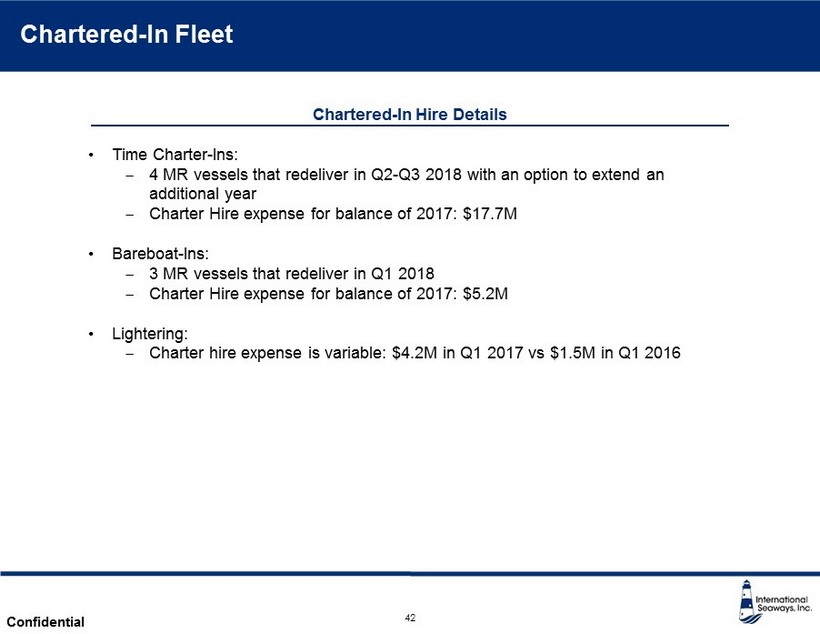
International Seaways, Inc. Confidential Chartered - In Fleet 42 • Time Charter - Ins: ‒ 4 MR vessels that redeliver in Q2 - Q3 2018 with an option to extend an additional year ‒ Charter Hire expense for balance of 2017: $17.7M • Bareboat - Ins: ‒ 3 MR vessels that redeliver in Q1 2018 ‒ Charter Hire expense for balance of 2017: $5.2M • Lightering: ‒ Charter hire expense is variable: $4.2M in Q1 2017 vs $1.5M in Q1 2016 Chartered - In Hire Details
Appendix
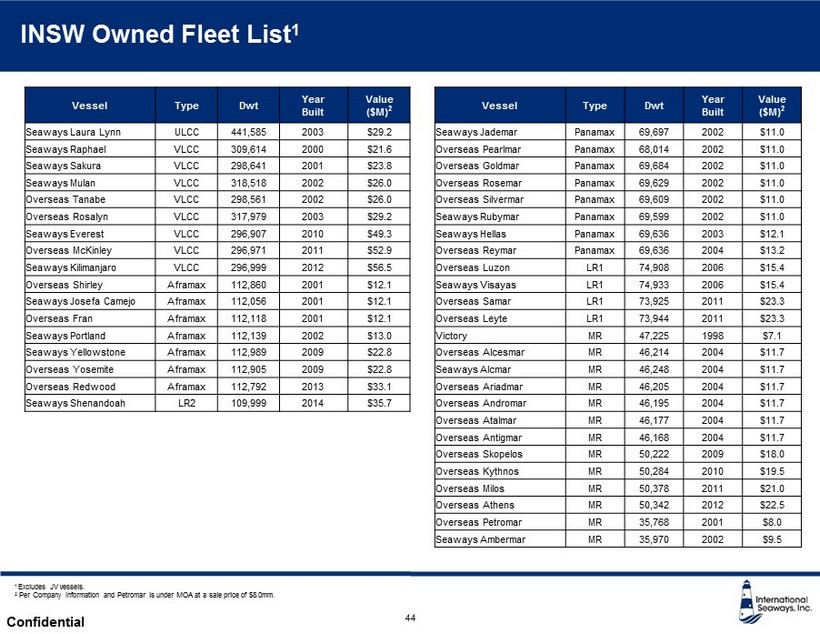
International Seaways, Inc. Confidential INSW Owned Fleet List 1 44 Vessel Type Dwt Year Built Value ($M) 2 Vessel Type Dwt Year Built Value ($M) 2 Seaways Laura Lynn ULCC 441,585 2003 $29.2 Seaways Jademar Panamax 69,697 2002 $11.0 Seaways Raphael VLCC 309,614 2000 $21.6 Overseas Pearlmar Panamax 68,014 2002 $11.0 Seaways Sakura VLCC 298,641 2001 $23.8 Overseas Goldmar Panamax 69,684 2002 $11.0 Seaways Mulan VLCC 318,518 2002 $26.0 Overseas Rosemar Panamax 69,629 2002 $11.0 Overseas Tanabe VLCC 298,561 2002 $26.0 Overseas Silvermar Panamax 69,609 2002 $11.0 Overseas Rosalyn VLCC 317,979 2003 $29.2 Seaways Rubymar Panamax 69,599 2002 $11.0 Seaways Everest VLCC 296,907 2010 $49.3 Seaways Hellas Panamax 69,636 2003 $12.1 Overseas McKinley VLCC 296,971 2011 $52.9 Overseas Reymar Panamax 69,636 2004 $13.2 Seaways Kilimanjaro VLCC 296,999 2012 $56.5 Overseas Luzon LR1 74,908 2006 $15.4 Overseas Shirley Aframax 112,860 2001 $12.1 Seaways Visayas LR1 74,933 2006 $15.4 Seaways Josefa Camejo Aframax 112,056 2001 $12.1 Overseas Samar LR1 73,925 2011 $23.3 Overseas Fran Aframax 112,118 2001 $12.1 Overseas Leyte LR1 73,944 2011 $23.3 Seaways Portland Aframax 112,139 2002 $13.0 Victory MR 47,225 1998 $7.1 Seaways Yellowstone Aframax 112,989 2009 $22.8 Overseas Alcesmar MR 46,214 2004 $11.7 Overseas Yosemite Aframax 112,905 2009 $22.8 Seaways Alcmar MR 46,248 2004 $11.7 Overseas Redwood Aframax 112,792 2013 $33.1 Overseas Ariadmar MR 46,205 2004 $11.7 Seaways Shenandoah LR2 109,999 2014 $35.7 Overseas Andromar MR 46,195 2004 $11.7 Overseas Atalmar MR 46,177 2004 $11.7 Overseas Antigmar MR 46,168 2004 $11.7 Overseas Skopelos MR 50,222 2009 $18.0 Overseas Kythnos MR 50,284 2010 $19.5 Overseas Milos MR 50,378 2011 $21.0 Overseas Athens MR 50,342 2012 $22.5 Overseas Petromar MR 35,768 2001 $8.0 Seaways Ambermar MR 35,970 2002 $9.5 1 Excludes JV vessels. 2 Per Company Information and Petromar is under MOA at a sale price of $8.0mm.
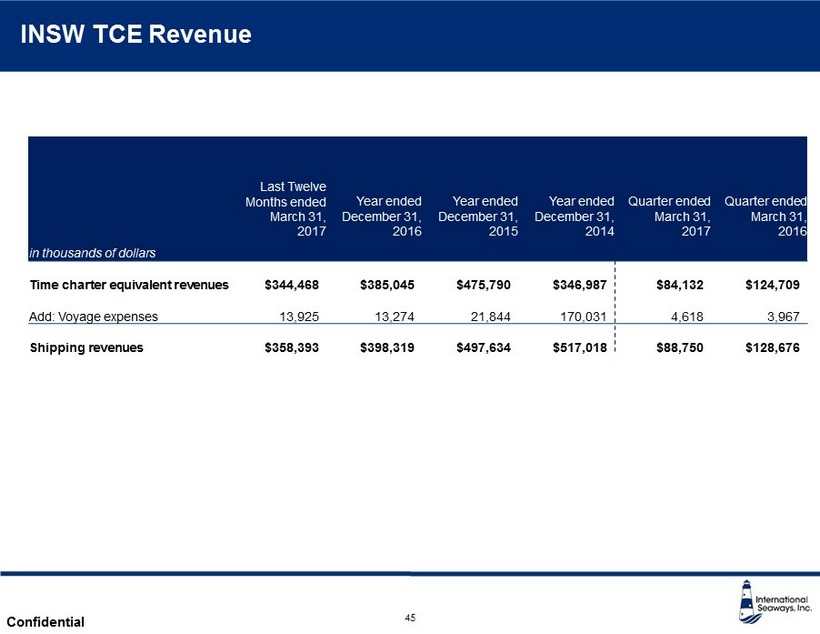
International Seaways, Inc. Confidential INSW TCE Revenue in thousands of dollars Last Twelve Months ended March 31, 2017 Year ended December 31, 2016 Year ended December 31, 2015 Year ended December 31, 2014 Quarter ended March 31, 2017 Quarter ended March 31, 2016 Time charter equivalent revenues $344,468 $385,045 $475,790 $346,987 $84,132 $124,709 Add: Voyage expenses 13,925 13,274 21,844 170,031 4,618 3,967 Shipping revenues $358,393 $398,319 $497,634 $517,018 $88,750 $128,676 45
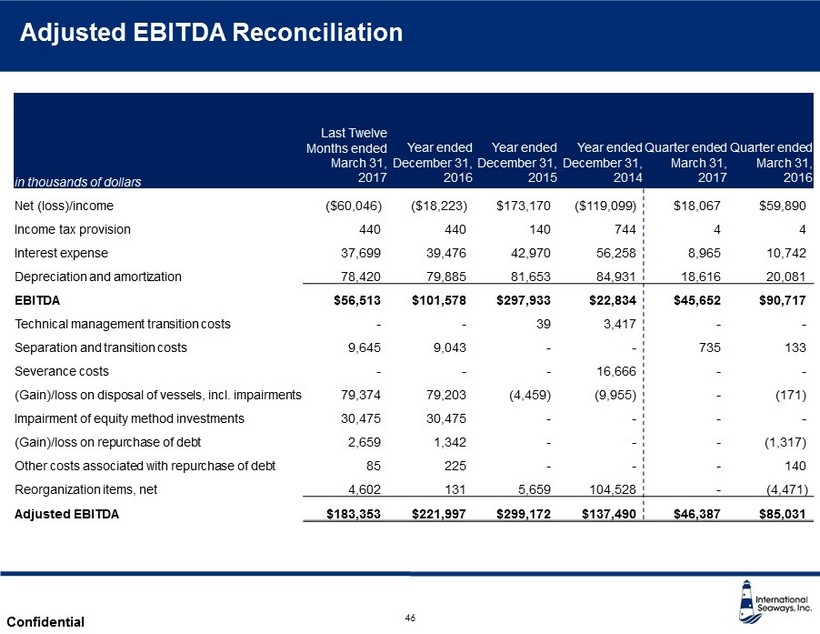
International Seaways, Inc. Confidential Adjusted EBITDA Reconciliation 46 in thousands of dollars Last Twelve Months ended March 31, 2017 Year ended December 31, 2016 Year ended December 31, 2015 Year ended December 31, 2014 Quarter ended March 31, 2017 Quarter ended March 31, 2016 Net (loss)/income ($60,046) ($18,223) $173,170 ($119,099) $18,067 $59,890 Income tax provision 440 440 140 744 4 4 Interest expense 37,699 39,476 42,970 56,258 8,965 10,742 Depreciation and amortization 78,420 79,885 81,653 84,931 18,616 20,081 EBITDA $56,513 $101,578 $297,933 $22,834 $45,652 $90,717 Technical management transition costs - - 39 3,417 - - Separation and transition costs 9,645 9,043 - - 735 133 Severance costs - - - 16,666 - - (Gain)/loss on disposal of vessels, incl. impairments 79,374 79,203 (4,459) (9,955) - (171) Impairment of equity method investments 30,475 30,475 - - - - (Gain)/loss on repurchase of debt 2,659 1,342 - - - (1,317) Other costs associated with repurchase of debt 85 225 - - - 140 Reorganization items, net 4,602 131 5,659 104,528 - (4,471) Adjusted EBITDA $183,353 $221,997 $299,172 $137,490 $46,387 $85,031
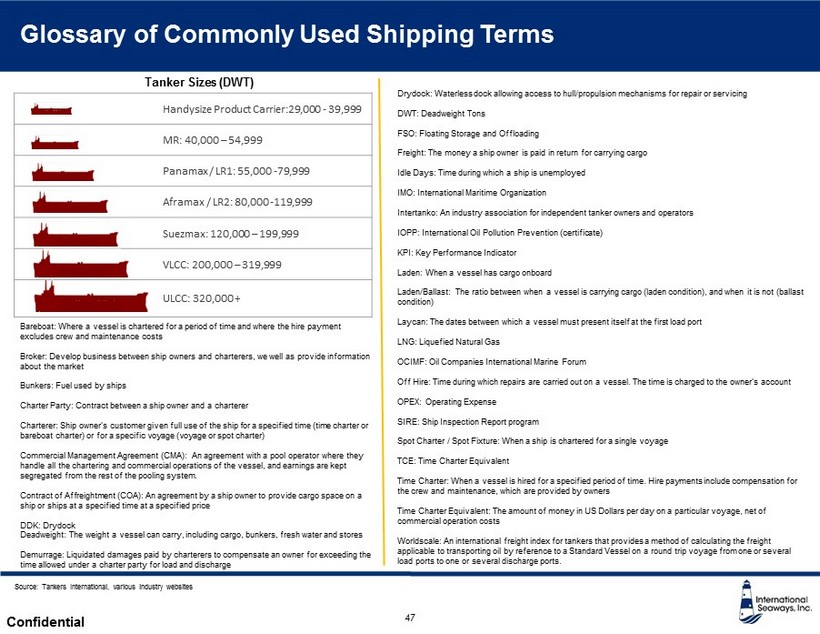
International Seaways, Inc. Confidential Handysize Product Carrier:29,000 - 39,999 MR: 40,000 – 54,999 Panamax / LR1: 55,000 - 79,999 Aframax / LR2: 80,000 - 119,999 Suezmax : 120,000 – 199,999 VLCC: 200,000 – 319,999 ULCC: 320,000 + Glossary of Commonly Used Shipping Terms 47 Source: Tankers International, various industry websites Tanker Sizes (DWT) Bareboat: Where a vessel is chartered for a period of time and where the hire payment excludes crew and maintenance costs Broker: Develop business between ship owners and charterers, we well as provide information about the market Bunkers: Fuel used by ships Charter Party: Contract between a ship owner and a charterer Charterer: Ship owner’s customer given full use of the ship for a specified time (time charter or bareboat charter) or for a specific voyage (voyage or spot charter) Commercial Management Agreement (CMA): An agreement with a pool operator where they handle all the chartering and commercial operations of the vessel, and earnings are kept segregated from the rest of the pooling system. Contract of Affreightment (COA): An agreement by a ship owner to provide cargo space on a ship or ships at a specified time at a specified price DDK: Drydock Deadweight: The weight a vessel can carry, including cargo, bunkers, fresh water and stores Demurrage: Liquidated damages paid by charterers to compensate an owner for exceeding the time allowed under a charter party for load and discharge Drydock: Waterless dock allowing access to hull/propulsion mechanisms for repair or servicing DWT: Deadweight Tons FSO: Floating Storage and Offloading Freight: The money a ship owner is paid in return for carrying cargo Idle Days: Time during which a ship is unemployed IMO: International Maritime Organization Intertanko : An industry association for independent tanker owners and operators IOPP: International Oil Pollution Prevention (certificate) KPI: Key Performance Indicator Laden: When a vessel has cargo onboard Laden/Ballast: The ratio between when a vessel is carrying cargo (laden condition), and when it is not (ballast condition) Laycan: The dates between which a vessel must present itself at the first load port LNG: Liquefied Natural Gas OCIMF: Oil Companies International Marine Forum Off Hire: Time during which repairs are carried out on a vessel. The time is charged to the owner’s account OPEX: Operating Expense SIRE: Ship Inspection Report program Spot Charter / Spot Fixture: When a ship is chartered for a single voyage TCE: Time Charter Equivalent Time Charter: When a vessel is hired for a specified period of time. Hire payments include compensation for the crew and maintenance, which are provided by owners Time Charter Equivalent: The amount of money in US Dollars per day on a particular voyage, net of commercial operation costs Worldscale : An international freight index for tankers that provides a method of calculating the freight applicable to transporting oil by reference to a Standard Vessel on a round trip voyage from one or several load ports to one or several discharge ports.
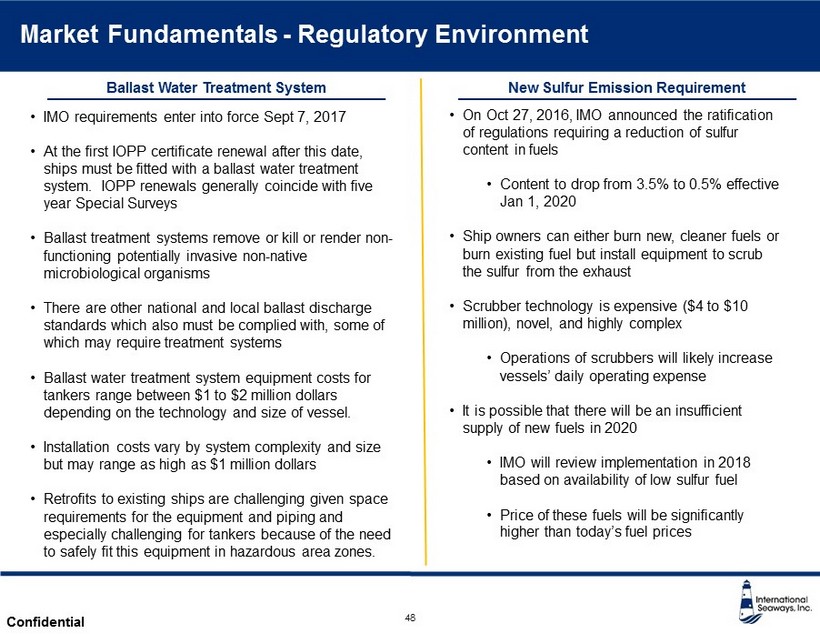
International Seaways, Inc. Confidential • IMO requirements enter into force Sept 7, 2017 • At the first IOPP certificate renewal after this date, ships must be fitted with a ballast water treatment system. IOPP renewals generally coincide with five year Special Surveys • Ballast treatment systems remove or kill or render non - functioning potentially invasive non - native microbiological organisms • There are other national and local ballast discharge standards which also must be complied with, some of which may require treatment systems • Ballast water treatment system equipment costs for tankers range between $1 to $2 million dollars depending on the technology and size of vessel. • Installation costs vary by system complexity and size but may range as high as $1 million dollars • Retrofits to existing ships are challenging given space requirements for the equipment and piping and especially challenging for tankers because of the need to safely fit this equipment in hazardous area zones. Market Fundamentals - Regulatory Environment 48 Ballast Water Treatment System • On Oct 27, 2016, IMO announced the ratification of regulations requiring a reduction of sulfur content in fuels • Content to drop from 3.5% to 0.5% effective Jan 1, 2020 • Ship owners can either burn new, cleaner fuels or burn existing fuel but install equipment to scrub the sulfur from the exhaust • Scrubber technology is expensive ($4 to $10 million), novel, and highly complex • Operations of scrubbers will likely increase vessels’ daily operating expense • It is possible that there will be an insufficient supply of new fuels in 2020 • IMO will review implementation in 2018 based on availability of low sulfur fuel • Price of these fuels will be significantly higher than today’s fuel prices New Sulfur Emission Requirement