Attached files
| file | filename |
|---|---|
| 8-K - FORM 8-K - NEWPARK RESOURCES INC | a20170522-8kxq1investorpre.htm |

N E W P A R K R E S O U R C E S P R E S E N TAT I O N
M AY 2 0 1 7

This presentation contains forward-looking statements within the meaning of the Private Securities Litigation Reform Act that are
based on management's current expectations, estimates and projections. All statements that address expectations or projections
about the future, including Newpark's strategy for growth, product development, market position, expected expenditures and
future financial results are forward-looking statements. Words such as “will”, “may”, “could”, “would”, “anticipates”, “believes”,
“estimates”, “expects”, “plans”, “intends”, and similar expressions are intended to identify these forward-looking statements but
are not the exclusive means of identifying them. These forward-looking statements reflect the current views of our management;
however, various risks, uncertainties, contingencies and other factors, some of which are beyond our control, are difficult to
predict and could cause our actual results, performance or achievements to differ materially from those expressed in, or implied
by, these statements, including the success or failure of our efforts to implement our business strategy. We assume no obligation
to update, amend or clarify publicly any forward-looking statements, whether as a result of new information, future events or
otherwise, except as required by securities laws. Many factors, including those discussed more fully elsewhere in this presentation
and in documents filed with the Securities and Exchange Commission by Newpark, particularly its Annual Report on Form 10-K for
the year ended December 31, 2016, as well as others, could cause results to differ materially from those expressed in, or implied
by, these statements. These risk factors include, but are not limited to, risks related to the worldwide oil and natural gas industry,
our customer concentration and reliance on the U.S. exploration and production market, risks related to our international
operations, the cost and continued availability of borrowed funds including noncompliance with debt covenants, operating
hazards present in the oil and natural gas industry, our ability to execute our business strategy and make successful business
acquisitions and capital investments, the availability of raw materials and skilled personnel, our market competition, compliance
with legal and regulatory matters, including environmental regulations, the availability of insurance and the risks and limitations of
our insurance coverage, potential impairments of long-lived intangible assets, technological developments in our industry, risks
related to severe weather, particularly in the U.S. Gulf Coast, cybersecurity breaches or business system disruptions and risks
related to the fluctuations in the market value of our common stock. Newpark’s filings with the Securities and Exchange
Commission can be obtained at no charge at www.sec.gov, as well as through its website at www.newpark.com.
F O R W A R D L O O K I N G S TAT E M E N T S
2

$984
$1,042
$1,118
$677
$471
$159
$115
$0
$200
$400
$600
$800
$1,000
$1,200
$1,400
2012 2013 2014 2015 2016 2017
86%
14%
First Quarter 2017 - Revenue by Segment
Two Operating Segments:
Fluids Systems
Oil and Gas exploration
Mats and Integrated Services
Oil and Gas exploration
Electrical transmission and
distribution
Pipeline
Petrochemical
Construction
Key geographic markets:
North America
EMEA
Latin America
Asia Pacific
R
e
ve
n
u
e
s
($
m
ill
io
n
s)
Consolidated Revenues
Fluids Systems Mats and Integrated Services
C O M P A N Y O V E R V I E W
3
Full Year
First Quarter

Revenue by Region
G L O B A L S T R E N G T H
4
67%
57%
45%
54%
7%
8%
7%
12%
8%
7%
9%
6%
18%
28%
39%
28%
2014 2015 2016 Q1 2017
U.S. Canada
Latin America EMEA/APAC

S T R E N G T H E N E D B Y O U R I N V E S T M E N T S
Mats: Completed Manufacturing 2015
and Technology Center 2016
Elevated capital campaign completed
Infrastructure investments open new
markets and significantly enhance our
competitiveness
Reflects our commitment to be the global
leader in fluids and mats technology
5
Fluids: Gulf of Mexico Deepwater Shorebase
Completed 2017
Fluids: Manufacturing Facility & Distribution Center
Completed 2016

48%
14%
31%
7%
U.S. Canada EMEA/APAC Latin America
Largest independent drilling
fluids provider
3rd largest drilling fluids
company worldwide*
Seek to capitalize on
competitive diversions to drive
further market share gains
Expanding global market share,
leveraging IOC/NOC
relationships
$862
$926 $965
$581
$395
$99
$136
$0
$200
$400
$600
$800
$1,000
$1,200
2012 2013 2014 2015 2016 2017
Re
ve
n
u
e
s
($
m
il
lio
n
s)
Total Segment Revenues
First Quarter 2017 Revenue by Region
*Based on company data
F L U I D S S Y S T E M S - O V E R V I E W
6
Full Year
First Quarter

F L U I D S S Y S T E M S - T E C H N O L O G Y
7
Proven drilling fluid systems designed to
enhance wellsite performance
Evolution® high-performance, water-based
technology for global applications
Fusion™ brine fluid system creates a
unique enhancement for shale basins
Kronos™ deepwater drilling fluid systems
offers operators a consistent fluid across a
wide temperature and pressure spectrum
Fluids Development
Driving continued advancements in
technology, bringing new chemistries to
enhance drilling efficiencies in challenging
environments

2,283
2,114
2,241
1,170
639
1,037
10%
11%
12%
13%
14%
15%
16%
-
500
1,000
1,500
2,000
2,500
2012 2013 2014 2015 2016 First Quarter
2017
NAM Rig Count Market Share
$615
$654
$687
$352
$183
$50
$85
$0
$100
$200
$300
$400
$500
$600
$700
$800
2012 2013 2014 2015 2016 2017
Revenues impacted by drilling
activity and operators reducing
well expenditures
Service quality, focus and
organizational alignment driving
share gains in the market
Hold #2 market share position in
U.S. land*
Focused on expanding presence
in GOM
Shorebase facility now fully
operational
(1) Source: BHI and company data
Re
ve
n
u
e
(
$
m
il
lio
n
s)
North American Revenues
NAM Rig Count & Market Share(1)
*Based on company data
F L U I D S S Y S T E M S – N O R T H A M E R I C A
8
Full Year
First Quarter

$246
$272
$278
$229 $212
$48 $51
$0
$50
$100
$150
$200
$250
$300
$350
2012 2013 2014 2015 2016 2017
$117 $137
$166 $164 $167
$87
$99
$84
$47 $40
$42
$36 $28
$18
$5
2012 2013 2014 2015 2016
EMEA LATAM APAC
International expansion is key to our
strategy
More stable than NAM, through the
industry cycles
Longer term contracts
Largely IOC’s/NOC’s
Few competitors
Key contract awards have driven growth
Kuwait (KOC)
Algeria (Sonatrach)
Republic of Congo (ENI)
Uruguay ultra-deepwater (Total)
Albania (Shell)
Chile (ENAP)
Two recent awards to begin in second
half 2017
India (Cairn)
Australia (partnering with Baker Hughes)
International Revenues
Revenues by Region
F L U I D S S Y S T E M S – I N T E R N AT I O N A L
9
Full Year
First Quarter

$122
$116
$153
$96
$76
$16
$23
$0
$20
$40
$60
$80
$100
$120
$140
$160
$180
2012 2013 2014 2015 2016 2017
Leading provider of engineered worksite
solutions
Revenues include rentals and sale of DURA-
BASE composite mats
Mat sales targeted to international E&P and
non-oil and gas customers
Patented technology and size of composite
mat rental fleet provide competitive
advantage
Established core rental business in NAM
exploration market, where mats reduce
operator’s costs and improve environmental
protection during drilling and completion
phase
Accelerating growth by expanding into new
geographic markets and industries
Segment remained profitable through the
cycle, benefiting from diversified customer
base
Total Segment Revenues
R
e
ve
n
u
e
s
($
m
ill
io
n
s)
45%
38%
17%
O & G - Exploration NAM Non-Exploration Int'l Non-Exploration
First Quarter 2017 Revenues by Market
M AT S & I N T E G R AT E D S E R V I C E S - O V E R V I E W
10
Full Year
First Quarter

Diversifying beyond the
wellsite
Accelerate penetration of
non-exploration markets,
both domestically and
internationally
Commercialize differentiated
system enhancements,
including EPZ Grounding
System™ for the utility
industry
M AT S & I N T E G R AT E D S E R V I C E S – S T R AT E G Y A N D S Y S T E M S
11

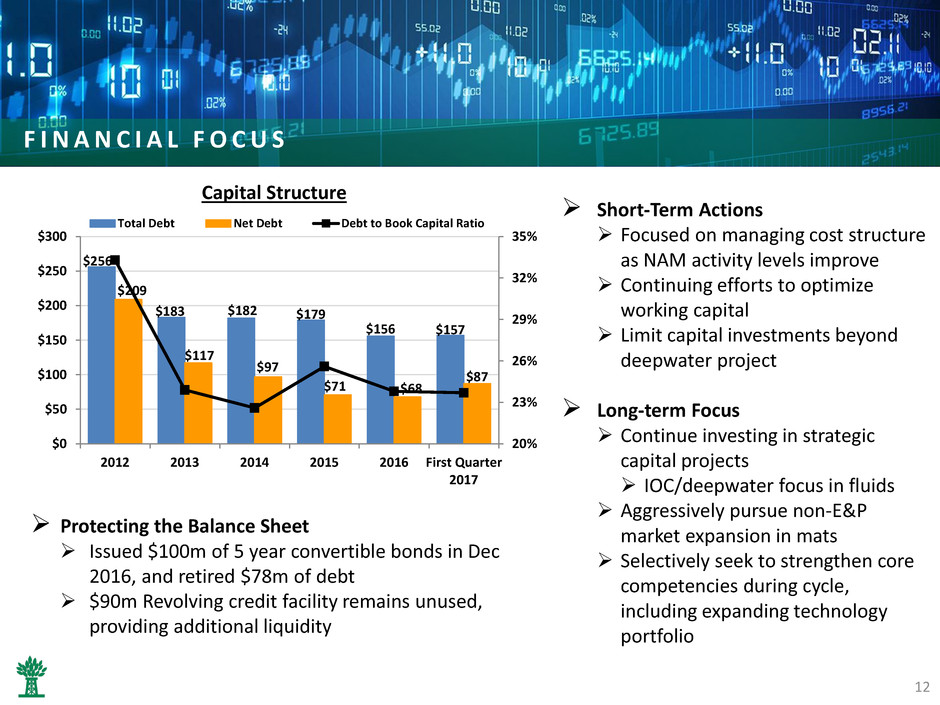
F I N A N C I A L F O C U S
Short-Term Actions
Focused on managing cost structure
as NAM activity levels improve
Continuing efforts to optimize
working capital
Limit capital investments beyond
deepwater project
Long-term Focus
Continue investing in strategic
capital projects
IOC/deepwater focus in fluids
Aggressively pursue non-E&P
market expansion in mats
Selectively seek to strengthen core
competencies during cycle,
including expanding technology
portfolio
$256
$183 $182 $179
$156 $157
$209
$117
$97
$71 $68
$87
20%
23%
26%
29%
32%
35%
$0
$50
$100
$150
$200
$250
$300
2012 2013 2014 2015 2016 First Quarter
2017
Total Debt Net Debt Debt to Book Capital Ratio
Capital Structure
Protecting the Balance Sheet
Issued $100m of 5 year convertible bonds in Dec
2016, and retired $78m of debt
$90m Revolving credit facility remains unused,
providing additional liquidity
12

A P P E N D I X

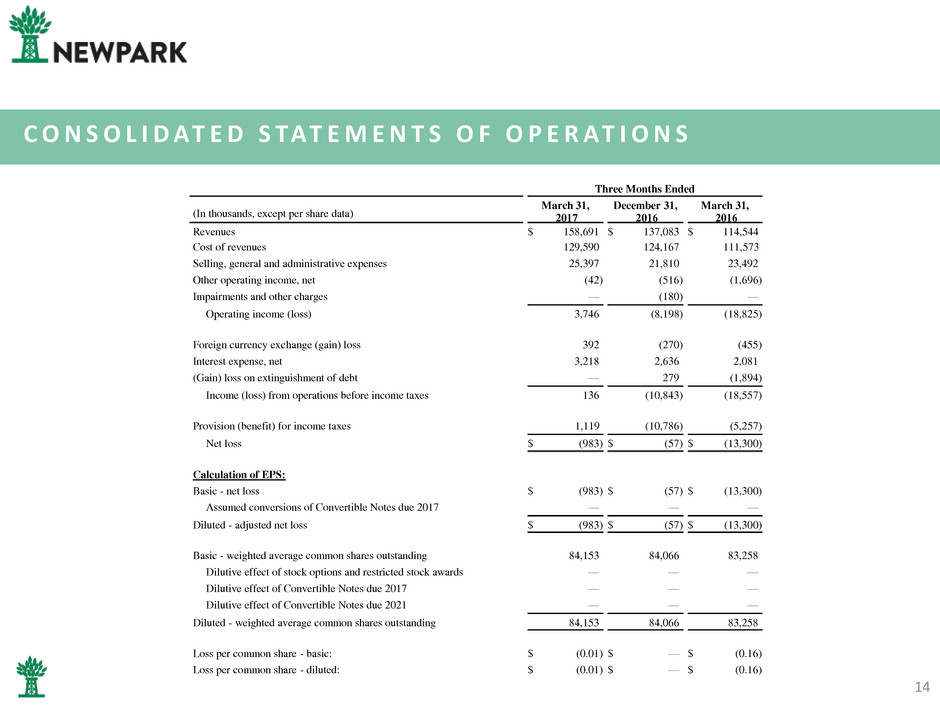
C O N S O L I D AT E D S TAT E M E N T S O F O P E R AT I O N S
14
Three Months Ended
(In thousands, except per share data)
March 31,
2017
December 31,
2016
March 31,
2016
Revenues $ 158,691 $ 137,083 $ 114,544
Cost of revenues 129,590 124,167 111,573
Selling, general and administrative expenses 25,397 21,810 23,492
Other operating income, net (42 ) (516 ) (1,696 )
Impairments and other charges — (180 ) —
Operating income (loss) 3,746 (8,198 ) (18,825 )
Foreign currency exchange (gain) loss 392 (270 ) (455 )
Interest expense, net 3,218 2,636 2,081
(Gain) loss on extinguishment of debt — 279 (1,894 )
Income (loss) from operations before income taxes 136 (10,843 ) (18,557 )
Provision (benefit) for income taxes 1,119 (10,786 ) (5,257 )
Net loss $ (983 ) $ (57 ) $ (13,300 )
Calculation of EPS:
Basic - net loss $ (983 ) $ (57 ) $ (13,300 )
Assumed conversions of Convertible Notes due 2017 — — —
Diluted - adjusted net loss $ (983 ) $ (57 ) $ (13,300 )
Basic - weighted average common shares outstanding 84,153 84,066 83,258
Dilutive effect of stock options and restricted stock awards — — —
Dilutive effect of Convertible Notes due 2017 — — —
Dilutive effect of Convertible Notes due 2021 — — —
Diluted - weighted average common shares outstanding 84,153 84,066 83,258
Loss per common share - basic: $ (0.01 ) $ — $ (0.16 )
Loss per common share - diluted: $ (0.01 ) $ — $ (0.16 )

O P E R AT I N G S E G M E N T R E S U LT S
15
Three Months Ended
(In thousands)
March 31,
2017
December 31,
2016
March 31,
2016
Revenues
Fluids systems $ 136,050 $ 111,560 $ 98,651
Mats and integrated services 22,641 25,523 15,893
Total revenues $ 158,691 $ 137,083 $ 114,544
Operating income (loss)
Fluids systems $ 6,352 $ (7,505 ) $ (15,207 )
Mats and integrated services 6,402 6,134 3,736
Corporate office (9,008 ) (6,827 ) (7,354 )
Operating income (loss) $ 3,746 $ (8,198 ) $ (18,825 )
Segment operating margin
Fluids systems 4.7 % (6.7 )% (15.4 )%
Mats and integrated services 28.3 % 24.0 % 23.5 %

C O N S O L I D AT E D B A L A N C E S H E E T S
16
March 31, 2017 December 31, 2016
ASSETS
Cash and cash equivalents $ 69,876 $ 87,878
Receivables, net 238,158 214,307
Inventories 145,384 143,612
Prepaid expenses and other current assets 16,765 17,143
Total current assets 470,183 462,940
Property, plant and equipment, net 301,167 303,654
Goodwill 20,051 19,995
Other intangible assets, net 5,452 6,067
Deferred tax assets 1,837 1,747
Other assets 3,568 3,780
Total assets $ 802,258 $ 798,183
LIABILITIES AND STOCKHOLDERS’ EQUITY
Current debt $ 83,086 $ 83,368
Accounts payable 62,536 65,281
Accrued liabilities 34,357 31,152
Total current liabilities 179,979 179,801
Long-term debt, less current portion 73,936 72,900
Deferred tax liabilities 36,323 38,743
Other noncurrent liabilities 6,627 6,196
Total liabilities 296,865 297,640
Common stock, $0.01 par value, 200,000,000 shares authorized and 99,876,940
and 99,843,094 shares issued, respectively 999
998
Paid-in capital 562,004 558,966
ccumulated other comprehensive loss (60,653 ) (63,208 )
Retained earnings 128,704 129,873
Treasury stock, at cost; 15,110,843 and 15,162,050 shares, respectively (125,661 ) (126,086 )
Total stockholders’ equity 505,393 500,543
Total liabilities and stockholders' equity $ 802,258 $ 798,183

C O N S O L I D AT E D S TAT E M E N T S O F C A S H F L O W
17
Three Months Ended March 31,
(In thousands) 2017 2016
Cash flows from operating activities:
Net loss $ (983 ) $ (13,300 )
Adjustments to reconcile net loss to net cash used in operations:
Depreciation and amortization 9,387 9,573
Stock-based compensation expense 2,836 2,974
Provision for deferred income taxes (2,545 ) (36 )
Net provision for doubtful accounts 666 528
Gain on sale of assets (847 ) (1,271 )
Gain on extinguishment of debt — (1,894 )
Amortization of original issue discount and debt issuance costs 1,330 286
Change in assets and liabilities:
(Increase) decrease in receivables (23,019 ) 27,606
(Increase) decrease in inventories (829 ) 10,630
Decrease in other assets 521 1,381
Decrease in accounts payable (1,692 ) (20,028 )
Increase (decrease) in accrued liabilities and other 3,731 (19,349 )
Net cash used in operating activities (11,444 ) (2,900 )
Cash flows from investing activities:
Capital expenditures (7,291 ) (13,418 )
Increase in restricted cash (46 ) —
Proceeds from sale of property, plant and equipment 288 1,450
Net cash used in investing activities (7,049 ) (11,968 )
Cash flows from financing activities:
Borrowings on lines of credit — 2,479
Payments on lines of credit — (4,851 )
Purchase of Convertible Notes due 2017 — (9,206 )
Debt issuance costs (157 ) —
Other financing activities (371 ) (3 )
Proceeds from employee stock plans 211 —
Purchases of treasury stock (48 ) —
Net cash used in financing activities (365 ) (11,581 )
Effect of exchange rate changes on cash 856 1,845
Net decrease in cash and cash equivalents (18,002 ) (24,604 )
Cash and cash equivalents at beginning of year 87,878 107,138
Cash and cash equivalents at end of period $ 69,876 $ 82,534

E X P E R I E N C E D L E A D E R S H I P
• Paul Howes President & CEO
• Gregg Piontek Vice President & CFO
• Mark Airola SVP, GC & Admin Officer
• Bruce Smith President
Fluids Systems
• Matthew Lanigan President
Mats & Integrated Services
• Ida Ashley Vice President, Human Resources
18

M A N A G E M E N T B I O G R A P H I E S
Paul L. Howes, President & CEO: Paul joined Newpark’s Board of Directors and was appointed its Chief Executive
Officer in March 2006. In June 2006, Mr. Howes also was appointed as Newpark’s President. Mr. Howes’ career has
included experience in the defense industry, chemicals and plastics manufacturing, and the packaging industry. From
2002 until October 2005, he served as President and Chief Executive Officer of Astaris LLC, a primary chemicals
company headquartered in St. Louis, Missouri, with operations in North America, Europe and South America. Prior to
this, from 1997 until 2002, he served as Vice President and General Manager, Packaging Division,
for Flint Ink Corporation, a global ink company headquartered in Ann Arbor, Michigan with operations in North
America, Europe, Asia Pacific and Latin America.
Gregg S. Piontek, VP & CFO: Gregg joined Newpark in April 2007 and served as Vice President, Controller and Chief
Accounting Officer from April 2007 to October 2011. Prior to joining Newpark, Mr. Piontek was Vice President and
Chief Accounting Officer of Stewart & Stevenson LLC from 2006 to 2007, where he served as the lead executive
financial officer for the asset acquisition from Stewart & Stevenson Services, Inc. and $150 million public debt offering.
From 2001 to 2006, Mr. Piontek held the positions of Assistant Corporate Controller and Division Controller for Stewart
& Stevenson Services, Inc. Prior to that, Mr. Piontek served in various financials roles at General Electric and CNH Global
N.V., after beginning his career as an auditor for Deloitte & Touche LLP. Mr. Piontek is a Certified Public Accountant and
holds a bachelor degree in Accountancy from Arizona State University and a Master of Business Administration degree
from Marquette University.
Mark J. Airola, Sr. VP, GC & Admin Officer: Mark joined Newpark in October 2006 as its Vice President, General
Counsel and Chief Administrative Officer. Mr. Airola was named Senior Vice President in February of 2011. Prior to
joining Newpark, Mr. Airola was Assistant General Counsel and Chief Compliance Officer for BJ Services Company, a
leading provider of pressure pumping and other oilfield services to the petroleum industry, serving as an executive
officer since 2003. From 1988 to 1995, he held the position of Senior Litigation Counsel at Cooper Industries, Inc., a
global manufacturer of electrical products and tools, with initial responsibility for managing environmental regulatory
matters and litigation and subsequently managing the company’s commercial litigation.
19

Bruce C. Smith, Executive VP and President Fluids Systems: Bruce joined Newpark in April 1998 as Vice President,
International. Since October 2000, he has served as President of its subsidiary Newpark Drilling Fluids, L.P. Prior to
joining Newpark, Mr. Smith was the Managing Director of the U.K. operations of M-I Swaco, a competitor of Newpark
Drilling Fluids, where he was responsible for two business units, including their drilling fluids unit.
Matthew Lanigan, President Mats and Integrated Services: Matthew joined Newpark in April 2016, as President of
Newpark Mats & Integrated Services. Matthew began his professional career at ExxonMobil in Australia working on rigs
as a Drilling & Completions Engineer, progressing from there to Offshore Production Engineer and as a Marketer for
Crude & LPG. While pursuing his MBA, he accepted a position with GE in the Plastics division where he rose to the role
of Chief Marketing Officer before transferring to the Capital division of GE, based in the UK. His first opportunity to
work in the United States came with the Enterprise Client Group of GE's Capital division, where he worked in leadership
roles in Sales & Marketing. In 2011, he was appointed as the Director of Commercial Excellence for Asia Pacific, based in
Australia. In addition to growing revenue and market share, key responsibilities for this role included developing cross-
organizational synergies and market entry strategies.
Ida Ashley, VP, Human Resources: Ida joined Newpark in March 2015 as Vice President, Human Resources. Ida
has over 20 years of experience in Human Resources, 17 of which were specific to Oilfield Services where she
specialized in Employee Relations, Mergers & Acquisitions and International HR programs. Ida has worked in a
variety of HR leadership roles in Smith International, M-I SWACO and Schlumberger. Her role prior to joining
Newpark was VP of HR, North America in Schlumberger. Originating from Smith International, she had the
unique opportunity to lead the HR integration project team during the Schlumberger/Smith merger from
August 2010 – December 2012. Ida earned her Masters of Science in Human Resources from Houston Baptist
University in 2000 and her Bachelors of Arts in Modern Languages from Texas A&M in 1991.
M A N A G E M E N T B I O G R A P H I E S
20

F O CU S E D ON C U S TOME R ’ S N E E D S
