Attached files
| file | filename |
|---|---|
| 8-K - 8-K - Atlantic Capital Bancshares, Inc. | acb-form8xkinvestorpresent.htm |

Atlantic Capital Bancshares, Inc. (ACBI)
May 24, 2017
Forward‐Looking Statements
This presentation contains forward‐looking statements within the meaning of section 27A of the Securities Act of 1933, as amended, and section
21E of the Securities Exchange Act of 1934, as amended. These forward‐looking statements reflect our current views with respect to, among
other things, future events and our financial performance. These statements are often, but not always, made through the use of words or
phrases such as “may,” “should,” “could,” “predict,” “potential,” “believe,” “will likely result,” “expect,” “continue,” “will,” “anticipate,” “seek,”
“estimate,” “intend,” “plan,” “projection,” “would” and “outlook,” or the negative version of those words or other comparable of a future or
forward‐looking nature. These forward‐looking statements are not historical facts, and are based on current expectations, estimates and
projections about our industry, management’s beliefs and certain assumptions made by management, many of which, by their nature, are
inherently uncertain and beyond our control. Accordingly, we caution you that any such forward‐looking statements are not guarantees of future
performance and are subject to risks, assumptions and uncertainties that are difficult to predict. Although we believe that the expectations
reflected in these forward‐looking statements are reasonable as of the date made, actual results may prove to be materially different from the
results expressed or implied by the forward‐looking statements.
The following risks, among others, could cause actual results to differ materially from the anticipated results or other expectations expressed in
the forward‐looking statements: (1) the expected growth opportunities and cost savings from the transaction with First Security Group, Inc.
(“First Security”) may not be fully realized or may take longer to realize than expected; (2) loss of income from our TriNet division following our
exit of this business; (3) changes in asset quality and credit risk; (4) the cost and availability of capital; (5) customer acceptance of our products
and services; (6) customer borrowing, repayment, investment and deposit practices; (7) the introduction, withdrawal, success and timing of
business initiatives; (8) the impact, extent, and timing of technological changes; (9) severe catastrophic events in our geographic area; (10) a
weakening of the economies in which we conduct operations may adversely affect our operating results; (11) the U.S. legal and regulatory
framework, including those associated with the Dodd‐Frank Wall Street Reform and Consumer Protection Act could adversely affect the
operating results of the combined company; (12) the interest rate environment may compress margins and adversely affect net interest income;
(13) changes in trade, monetary and fiscal policies of various governmental bodies and central banks could affect the economic environment in
which we operate; (14) our ability to determine accurate values of certain assets and liabilities; (15) adverse developments in securities, public
debt, and capital markets, including changes in market liquidity and volatility; (16) our ability to anticipate interest rate changes correctly and
manage interest rate risk presented through unanticipated changes in our interest rate risk position and/or short‐ and long‐term interest rates;
(17) unanticipated changes in our liquidity position, including but not limited to our ability to enter the financial markets to manage and respond
to any changes to our liquidity position; (18) adequacy of our risk management program; (19) increased costs associated with operating as a
public company; (20) competition from other financial services companies in the companies’ markets could adversely affect operations; and (21)
other factors described in Atlantic Capital’s reports filed with the Securities and Exchange Commission and available on the SEC’s website
(www.sec.gov).
2

Non‐GAAP Financial Information
Statements included in this presentation include non‐GAAP financial measures and should be read long with the accompanying tables, which
provide a reconciliation of non‐GAAP financial measures to GAAP financial measures. Atlantic Capital management uses non‐GAAP financial
measures, including: (i) operating net income; (ii) operating non‐interest expense; (iii) operating provision for loan losses; (iv) taxable equivalent
net interest margin; (v) efficiency ratio; (vi) operating return on assets; (vii) operating return on equity; (viii) tangible common equity; and (ix)
deposits excluding deposits assumed in branch sales, in its analysis of the Company's performance.
Management believes that non‐GAAP financial measures provide a greater understanding of ongoing performance and operations, and enhance
comparability with prior periods. Non‐GAAP financial measures should not be considered as an alternative to any measure of performance or
financial condition as determined in accordance with GAAP, and investors should consider Atlantic Capital’s performance and financial condition
as reported under GAAP and all other relevant information when assessing the performance or financial condition of the Company. Non‐GAAP
financial measures have limitations as analytical tools, and investors should not consider them in isolation or as a substitute for analysis of the
results or financial condition as reported under GAAP. Non‐GAAP financial measures may not be comparable to non‐GAAP financial measures
presented by other companies.
3

• Established in May 2007 with $125 million in equity capital, which was, and still is, the largest de novo bank
capital raise in US history
• Publicly traded on NASDAQ since November 2nd, 2015, under the symbol “ACBI”
• Exceptional record of soundness and growth through financial crisis, recession and recent recovery
• Differentiated by providing superior expertise, competitive capabilities, and customized service delivery
4
Atlantic Capital Bank: Our Story

Atlantic Capital Bank: Highlights
Target Markets:
• Small to mid‐sized enterprises with revenues up to $250 million
• Highly‐select group of institutional caliber commercial real estate developers and investors
• Principals of our commercial clients, professionals, and their practices
• Has grown to $2.8 billion in assets
• Initiatives in place to maintain robust top line growth
• Operating model expected to produce enhanced efficiencies going forward
• Consistently maintaining high asset quality
• NPAs/total assets 0.21% as of March 31, 2017
• Focused on Atlanta, Charlotte, Chattanooga, and Knoxville metropolitan markets
• Strong leadership continuity in key markets
• Broad management experience in all business lines
5

Proprietary & Confidential
Atlantic Capital Strategy
Become a premier
southeastern business and
private banking company
6
Accelerate Organic Growth
• Investing in people and capabilities to accelerate organic growth and build profitability
• Well positioned in attractive growth markets
• Attractive interest rate risk position
Strategic Expansion
• Completed acquisition of First Security on October 31, 2015
• Ongoing evaluation of new market expansion through mergers
and acquisitions and de novo entry
• Patient and disciplined approach with focus on shareholder value

7
Key Investment Considerations
Attractive Growth Markets
Strong Deposit Growth
Asset Sensitivity
Loan Growth with Superior Credit Quality
Building a profitable
and sound future
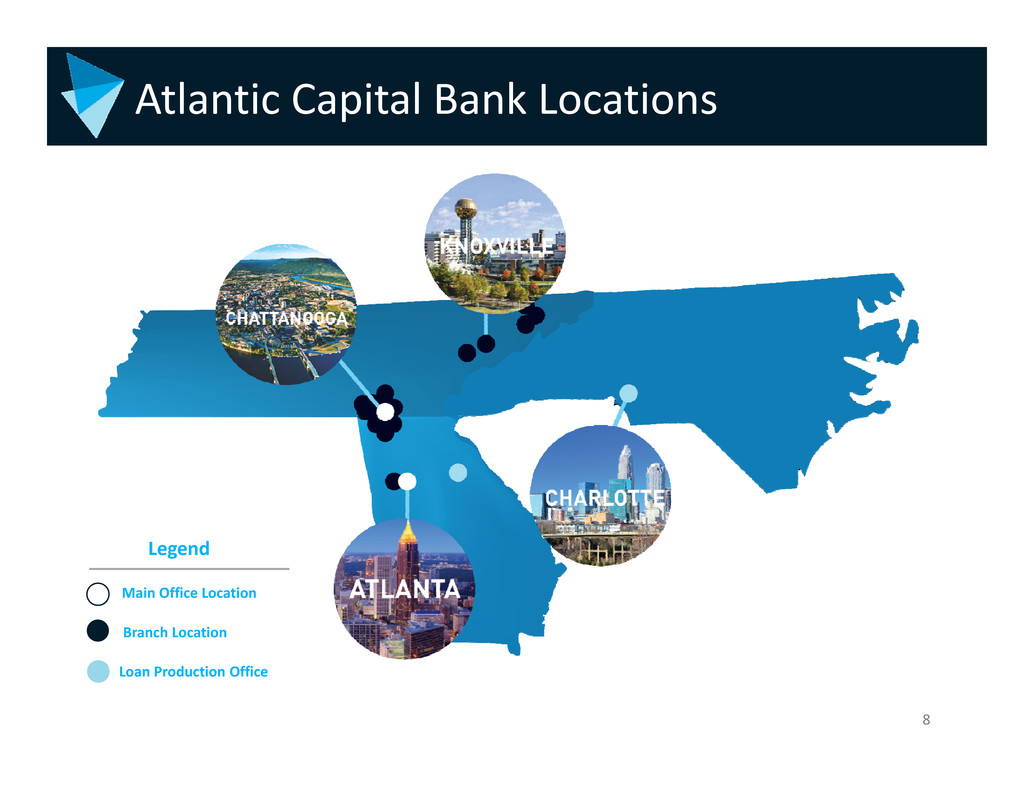
Atlantic Capital Bank Locations
8
Branch Location
Loan Production Office
Main Office Location
Legend

A leading middle market commercial bank operating throughout the southeast
Attractive Market Demographics
1) In thousands; Source: US MSA Census Information + market data from Data.com (Salesforce). 9
City
MSA
Population1
Projected
population growth
for the
next 3 years
# Target
Companies
(>$10MM REV)
# Total
businesses
(>$5MM REV)
# Total
businesses
Median
Household
Income
Atlanta 5,614 6.2% 4,271 8,600 1,261,291 $51,948
Chattanooga 544 3.0% 351 695 88,967 $37,411
Charlotte 2,380 7.4% 1,583 3,028 314,130 $46,119
Knoxville 857 2.4% 535 1,023 112,095 $36,874

10
Financial Highlights
Financial
Performance
Balance Sheet
Capital
Asset Quality
Diluted EPS $ 0.13 $ 0.06 $ 0.15 $ 0.20 $ 0.12
Diluted EPS – operating 0.13 0.07 0.16 0.15 0.14
Efficiency ratio (1) 76.78 % 78.33 % 71.57 % 72.00 % 75.22 %
Return on average assets – operating (1) (2) (3) (5) 0.48 0.25 0.60 0.54 0.52
Net interest margin (tax equivalent) (1) 3.20 3.11 3.12 3.12 3.26
Total assets(4) $ 2,802 $ 2,728 $ 2,761 $ 2,808 $ 2,727
Commercial loans held for investment (4)(6) 1,616 1,609 1,610 1,580 1,527
Deposits (excl. to be assumed in branch sale) (1) (4) 2,174 2,206 2,189 2,158 2,085
Tier 1 capital ratio 10.73 % 10.30 % 9.68 % 9.99 % 9.48 %
Total risk‐based capital ratio 13.77 13.31 12.50 12.96 12.37
Tangible common equity to tangible assets 10.16 10.16 10.19 9.81 9.69
Net charge offs to average loans (5) 0.26 % 0.03 % 0.06 % 0.00 % 0.35 %
NPAs to total assets 0.21 0.13 0.09 0.07 0.08
Allowance for loan and lease losses to loans held for
investment
1.05 1.04 0.92 0.95 0.93
(1) This is a non‐GAAP financial measure. Please see “Non‐GAAP Reconciliation” on slides 26 and 27 for more details.(2) Excludes provision for acquired non PCI
FSG loans. (3) Excludes merger related expenses. (4) Dollars in millions. (5) Annualized. (6) Excluding mortgage warehouse loans.
METRICS Q1 ‘17 Q4 ‘16 Q3 ‘16 Q2 ‘16 Q1 ‘16
$0
$500
$1,000
$1,500
$2,000
$2,500
FY 2013 FY 2014 FY 2015 FY 2016 Q1 2017
11
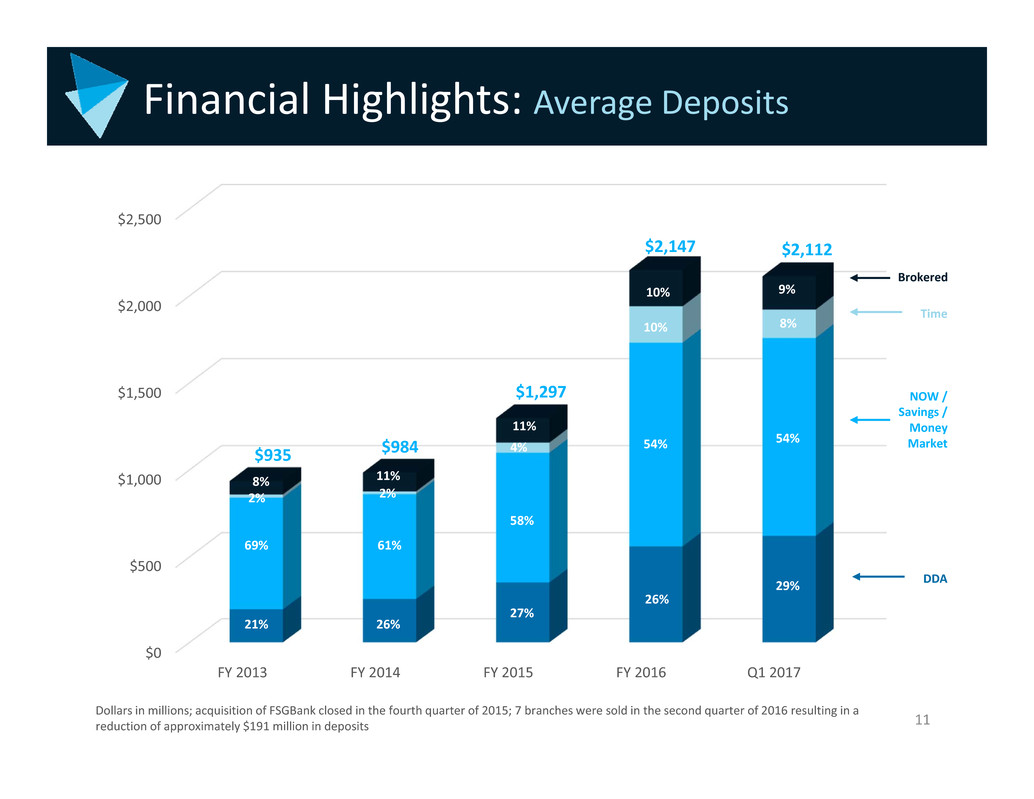
Financial Highlights: Average Deposits
Dollars in millions; acquisition of FSGBank closed in the fourth quarter of 2015; 7 branches were sold in the second quarter of 2016 resulting in a
reduction of approximately $191 million in deposits
DDA
NOW /
Savings /
Money
Market
Time
Brokered
21% 26%
27%
26%
29%
69% 61%
58%
54% 54%
2%
8%
2%
11%
11%
4%
10%
10%
8%
9%
$935 $984
$1,297
$2,147 $2,112

12
Financial Highlights: Average Deposits
Dollars in millions; acquisition of FSGBank closed in the fourth quarter of 2015; 7 branches were sold in the second quarter of 2016 resulting in a
reduction of approximately $191 million in deposits
$0
$500
$1,000
$1,500
$2,000
$2,500
Q1 2016 Q2 2016 Q3 2016 Q4 2016 Q1 2017
26% 25% 26% 28% 29%
52% 55%
57% 54% 54%
12% 10%
8%
8% 8%
10% 10% 9% 10% 9%
$2,156
$2,112$2,095
$2,164$2,135
DDA
NOW /
Savings /
Money
Market
Time
Brokered

Financial Highlights:
13
$0
$500
$1,000
$1,500
$2,000
Dec. 31, 2013 Dec. 31, 2014 Dec. 31, 2015 Dec. 31, 2016 Mar. 31, 2017
$809
$923
$1,707
$1,833 $1,844
$8
$117
$84
$148 $58
$817
$1,040
$1,791
$1,981
$1,902
Dollars in millions; acquisition of FSGBank closed in the fourth quarter of fiscal 2015
Loans Held For Investment
Mortgage
warehouse

14
Financial Highlights: Loans Held for Investment
Dollars in millions
$0
$500
$1,000
$1,500
$2,000
$2,500
Mar. 31, 2016 Jun. 30, 2016 Sep. 30, 2016 Dec. 31, 2016 Mar. 31, 2017
$1,527 $1,580 $1,610 $1,609
$1,616
$236
$236 $227 $224 $228
$124
$126
$171 $148 $58
$1,887 $1,942
$2,008 $1,981
Commercial
Other
Mortgage
warehouse
$1,902
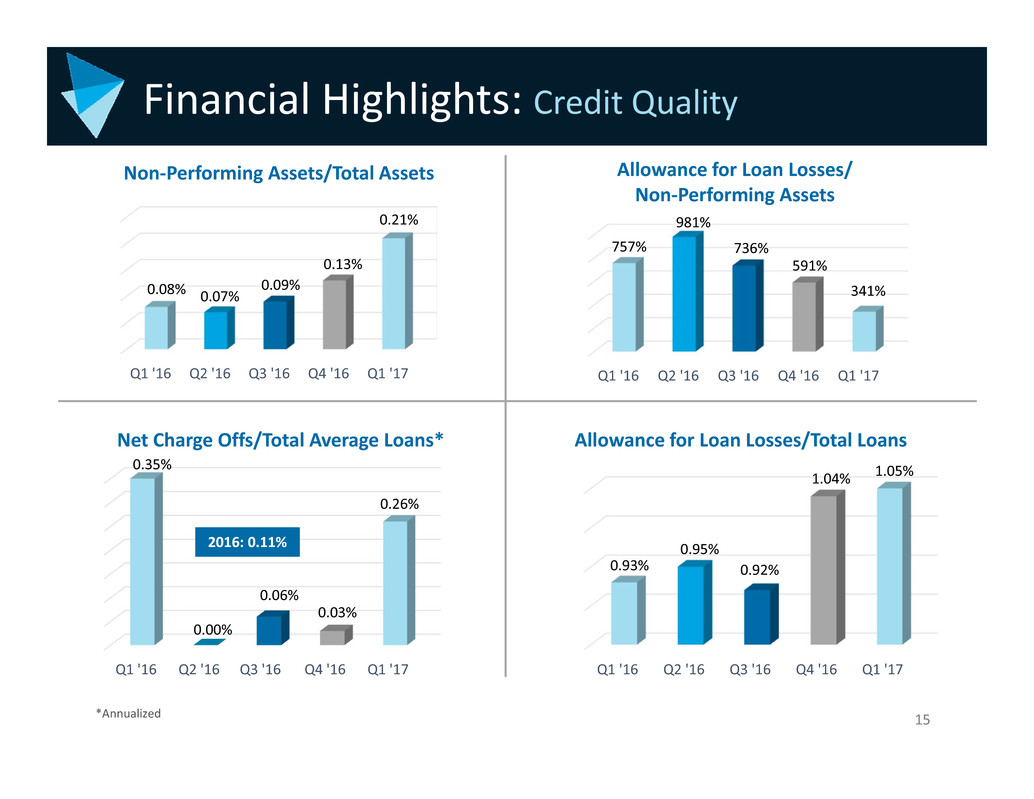
Financial Highlights: Credit Quality
15
Q1 '16 Q2 '16 Q3 '16 Q4 '16 Q1 '17
0.08% 0.07%
0.09%
0.13%
0.21%
Allowance for Loan Losses/
Non‐Performing Assets
Q1 '16 Q2 '16 Q3 '16 Q4 '16 Q1 '17
757%
981%
736%
591%
341%
Net Charge Offs/Total Average Loans* Allowance for Loan Losses/Total Loans
Q1 '16 Q2 '16 Q3 '16 Q4 '16 Q1 '17
0.93%
0.95%
0.92%
1.04% 1.05%
Non‐Performing Assets/Total Assets
Q1 '16 Q2 '16 Q3 '16 Q4 '16 Q1 '17
0.35%
0.00%
0.06%
0.03%
0.26%
2016: 0.11%
*Annualized

16
Financial Highlights:
$18,921 $19,283 $19,487 $19,501
$19,508
3.26%
3.12% 3.12% 3.11%
3.20%
3.05%
3.00% 3.00% 2.99%
3.07%
2.70%
2.80%
2.90%
3.00%
3.10%
3.20%
3.30%
$0
$5,000
$10,000
$15,000
$20,000
Q1 2016 Q2 2016 Q3 2016 Q4 2016 Q1 2017
Net interest income* Net interest margin* Net interest margin (excl purchase accounting)*
Dollars in thousands
*Net interest margin is taxable equivalent and is a non‐GAAP financial measure. Please see “Non‐GAAP Reconciliation” on slides 26 and 27 for more
details.
Net Interest Margin*

Financial Highlights: Asset Sensitivity
Change in Net Interest Income
17
0%
5%
10%
15%
20%
25%
Up 100 bps Up 200 bps Up 300 bps
7.4%
14.8%
22.1%
1 Year
As of March 31, 2017:
63% of loans are variable rate
28% of deposits are noninterest bearing

18
Financial Highlights: Noninterest Income
Dollars in thousands
$3,885 gain on
sale of branches
Service
charges
Other
noninterest
income
Mortgage
income
SBA lending
activities
Trust income
$0
$2,000
$4,000
$6,000
$8,000
$10,000
Q1 2016 Q2 2016 Q3 2016 Q4 2016 Q1 2017
$1,498 $1,392 $1,270 $1,327 $1,349
$880 $1,204
$959 $599
$1,227
$314
$386
$361
$350
$407$339
$447
$632
$499
$257
$1,389
$5,451
$780 $1,655 $617
$4,995
$3,857
$4,420
$4,002
$8,880
$4,430
19
$0
$5,000
$10,000
$15,000
$20,000
Q1 2016 Q2 2016 Q3 2016 Q4 2016 Q1 2017
$10,555 $10,420 $10,059
$11,269 $11,065
$1,100 $1,274
$1,235
$995 $1,230
$748 $760
$442
$968 $904$916 $694
$617
$1,064 $987
$4,198 $4,280
$4,364
$4,275
$3,558
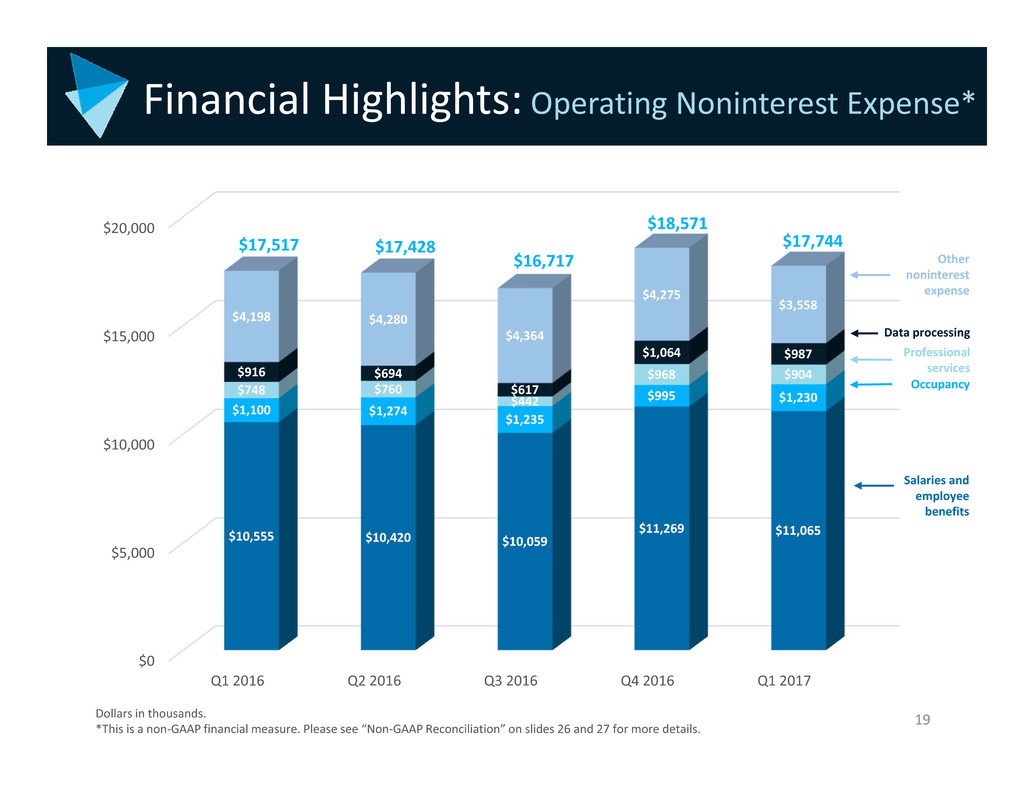
Financial Highlights: Operating Noninterest Expense*
$17,517 $17,428
$16,717
$18,571
Dollars in thousands.
*This is a non‐GAAP financial measure. Please see “Non‐GAAP Reconciliation” on slides 26 and 27 for more details.
Salaries and
employee
benefits
Occupancy
Professional
services
Data processing
Other
noninterest
expense
$17,744

20
Financial Highlights: Regulatory Capital at 3/31/17
0%
2%
4%
6%
8%
10%
12%
14%
10.8%
12.2% 12.2%
13.1%
9.5%
10.7% 10.7%
13.8%
Bank BankHolding
Company
Bank BankHolding
Company
Holding
Company
Holding
Company
Tier 1 leverage ratio Common equity tier 1 capital ratio Tier 1 capital ratio Total capital ratio

APPENDIX

Management Biographies
22
Douglas Williams
Chief Executive Officer
• CEO of Atlantic Capital since its inception
• Former Managing Director and Head of Wachovia Corporation’s International Corporate Finance Group
• Held numerous roles within Wachovia, including EVP and Head of the Global Corporate Banking Division; CRO for all corporate, institutional, and wholesale
banking activities; EVP and Co‐Head of Wachovia’s Capital Markets Division and EVP and Head of Wachovia’s US Corporate Banking Division
• Chairman of the Community Depository Institutions Advisory Council (CDIAC) of the Federal Reserve Bank of Atlanta and its representative to the CDIAC of the
Federal Reserve Board of Governors
• Serves on the Boards of the Metro Atlanta Chamber of Commerce, the Georgia Chamber of Commerce, and the YMCA of Metropolitan Atlanta and the High
Museum of Art and is a Member of the Buckhead Coalition
Michael Kramer
President, Chief Operating Officer
• CEO and President of First Security and CEO of FSGBank from 2011 to 2015
• Former Managing Director of Ridley Capital Group
• Former Director, CEO and President of Ohio Legacy Corporation
• Former COO and CTO of Integra Bank Corporation
• Serves on the Boards of Chattanooga Chamber of Commerce, Chattanooga United Way, The Tennessee Bankers Association and the Chattanooga Young Life
Committee
Patrick Oakes
Executive Vice President,
Chief Financial Officer
• Former CFO of Square 1 Financial, Inc.
• Former EVP and CFO of Encore Bancshares, Inc.
• Former SVP and Treasurer for Sterling Bancshares, Inc.
• Chartered Financial Analyst
Rich Oglesby
Executive Vice President,
Chief Risk Officer
• CRO of Atlantic Capital since its inception
• Former Chief Credit Officer for Wachovia’s Capital Finance business
• Former Head of Risk Management for all of Wachovia’s Capital Markets business
• Serves on the Board of Trustees at Children’s Literature for Children

23
ACBI Historical Balance Sheets
March 31, December 31, March 31,
(in thousands, except share data) 2017 2016 2016
ASSETS
Cash and due from banks $ 34,626 $ 36,790 $ 36,585
Interest-bearing deposits in banks 158,920 118,039 91,608
Other short-term investments 20,870 10,896 32,861
Cash and cash equivalents 214,416 165,725 161,054
Securities available-for-sale 456,942 347,705 366,641
Other investments 28,331 23,806 11,899
Loans held for sale 29,241 35,219 95,291
Loans held for investment 1,901,724 1,981,330 1,886,763
Less: allowance for loan losses (19,939) (20,595) (17,608)
Loans held for investment, net 1,881,785 1,960,735 1,869,155
Branch premises held for sale 2,897 2,995 7,200
Premises and equipment, net 12,308 11,958 22,780
Bank owned life insurance 62,516 62,160 60,981
Goodwill and intangible assets, net 29,186 29,567 33,914
Other real estate owned 1,869 1,872 1,760
Other assets 82,587 85,801 96,213
Total assets $ 2,802,078 $ 2,727,543 $ 2,726,888
LIABILITIES AND SHAREHOLDERS' EQUITY
Deposits:
Noninterest-bearing demand $ 606,386 $ 643,471 $ 560,363
Interest-bearing checking 259,760 264,062 215,176
Savings 30,756 27,932 29,788
Money market 916,390 912,493 862,120
Time 150,867 157,810 187,750
Brokered deposits 209,385 200,223 229,408
Deposits to be assumed in branch sale 29,495 31,589 197,857
Total deposits 2,203,039 2,237,580 2,282,462
Federal funds purchased and securities sold under agreements to repurchase – – 11,824
Federal Home Loan Bank borrowings 217,000 110,000 60,000
Long-term debt 49,408 49,366 49,239
Other liabilities 21,664 26,939 27,348
Total liabilities 2,491,111 2,423,885 2,430,873
SHAREHOLDERS' EQUITY
Preferred stock, no par value; 10,000,000 shares authorized; no shares issued and outstanding
as of March 31, 2017, December 31, 2016, and March 31, 2016 – – –
Common stock, no par value; 100,000,000 shares authorized;
25,535,013, 25,093,135, and 24,569,823 shares issued and outstanding as of
March 31, 2017, December 31, 2016, and March 31, 2016, respectively 296,608 292,747 288,271
Retained earnings 19,766 16,536 6,072
Accumulated other comprehensive income (loss) (5,407) (5,625) 1,672
Total shareholders’ equity 310,967 303,658 296,015
TOTAL LIABILITIES AND SHAREHOLDERS' EQUITY $ 2,802,078 $ 2,727,543 $ 2,726,888
Atlantic Capital Bancshares, Inc.
Consolidated Balance Sheets (unaudited)

24
ACBI Historical Income Statements
Atlantic Capital Bancshares, Inc.
Consolidated Statements of Income (unaudited)
(in thousands except share and per share data)
March 31,
2017
December
31, 2016
September
30, 2016
June 30,
2016
March 31,
2016
INTEREST INCOME
Loans, including fees $ 19,994 $ 20,363 $ 20,511 $ 20,282 $ 19,625
Investment securities - available-for-sale 2,018 1,477 1,293 1,327 1,601
Interest and dividends on other interest‑earning assets 449 467 491 507 273
Total interest income 22,461 22,307 22,295 22,116 21,499
INTEREST EXPENSE
Interest on deposits 2,047 1,929 1,956 1,841 1,673
Interest on Federal Home Loan Bank advances 302 234 133 147 44
Interest on federal funds purchased and securities sold under
agreements to repurchase 36 38 37 87 67
Interest on long-term debt 823 828 815 832 810
Other – – – – 38
Total interest expense 3,208 3,029 2,941 2,907 2,632
NET INTEREST INCOME BEFORE PROVISION FOR LOAN LOSSES 19,253 19,278 19,354 19,209 18,867
Provision for loan losses 634 2,208 463 777 368
NET INTEREST INCOME AFTER PROVISION FOR LOAN LOSSES 18,619 17,070 18,891 18,432 18,499
NONINTEREST INCOME
Service charges 1,349 1,327 1,270 1,392 1,498
Gains on sale of securities available-for-sale – – – 11 33
Gains on sale of other assets 78 238 71 31 48
Mortgage income 257 499 632 447 339
Trust income 407 350 361 386 314
Derivatives income (51) 346 69 98 65
Bank owned life insurance 378 395 424 398 393
SBA lending activities 1,227 599 959 1,204 880
TriNet lending activities 20 357 – 761 383
Gains on sale of branches – – – 3,885 –
Other noninterest income 192 319 216 267 467
Total noninterest income 3,857 4,430 4,002 8,880 4,420
NONINTEREST EXPENSE
Salaries and employee benefits 11,065 11,269 10,059 10,420 10,555
Occupancy 1,230 995 1,235 1,274 1,100
Equipment and software 805 694 862 724 686
Professional services 904 968 442 760 748
Postage, printing and supplies 85 73 61 159 169
Communications and data processing 987 1,064 617 694 916
Marketing and business development 270 247 269 317 267
FDIC premiums 314 262 415 493 398
Merger and conversion costs – 204 579 1,210 749
Amortization of intangibles 470 495 520 668 762
Foreclosed property/problem asset expense 3 666 39 55 104
Other noninterest expense 1,611 1,838 2,198 2,169 1,812
Total noninterest expense 17,744 18,775 17,296 18,943 18,266
INCOME (LOSS) BEFORE PROVISION FOR INCOME TAXES 4,732 2,725 5,597 8,369 4,653
Provision for income taxes 1,502 1,116 1,889 3,222 1,722
NET INCOME (LOSS) $ 3,230 $ 1,609 $ 3,708 $ 5,147 $ 2,931
Net income (loss) per common share ‑ basic $ 0.13 $ 0.06 $ 0.15 $ 0.21 $ 0.12
Net income (loss) per common share ‑ diluted $ 0.13 $ 0.06 $ 0.15 $ 0.20 $ 0.12
Weighted average shares - basic 25,320,690 25,027,304 24,891,822 24,644,755 24,485,900
Weighted average shares - diluted 25,672,286 25,407,728 25,260,280 25,158,694 24,993,597
Three months ended

25
ACBI Operating Income
(1) Interest income has been increased to reflect comparable interest on taxable securities. The rate used was 35%, reflecting the statutory
federal income tax rate. (2) Excludes merger related expenses. This is a non‐GAAP financial measure. Please see “Non‐GAAP Reconciliation” on
slides 26 and 27 for more details.
ATLANTIC CAPITAL BANCSHARES, INC.
Selected Financial Information
2017
(in thousands; taxable equivalent)
First
Quarter
Fourth
Quarter
Third
Quarter
Second
Quarter
First
Quarter
INCOME SUMMARY
Interest income (1) 22,716$ 22,530$ 22,428$ 22,190$ 21,553$
Interest expense 3,208 3,029 2,941 2,907 2,632
Net interest income 19,508 19,501 19,487 19,283 18,921
Provision for loan losses 634 2,208 463 777 368
Net interest income after provision for loan losses 18,874 17,293 19,024 18,506 18,553
Operating noninterest income 3,857 4,430 4,002 4,995 4,420
Operating noninterest expense (2) 17,744 18,571 16,717 17,428 17,517
Operating income before income taxes 4,987 3,152 6,309 6,073 5,456
Operating income tax expense 1,757 1,417 2,245 2,381 2,065
Operating net income (2) 3,230 1,735 4,064 3,692 3,391
Merger related expenses, net of income tax - 126 356 743 460
Net gain on sale of branches, net of income tax - - - 2,198 -
Net income - GAAP 3,230$ 1,609$ 3,708$ 5,147$ 2,931$
2016

Non‐GAAP Reconciliation
26
ATLANTIC CAPITAL BANCSHARES, INC.
Non-GAAP Performance Measures Reconciliation
(in thousands, except share and per share data)
2017
First Quarter Fourth Quarter Third Quarter Second Quarter First Quarter
Interest income reconciliation
Interest income - GAAP $ 22,461 $ 22,307 $ 22,295 $ 22,116 $ 21,499
Taxable equivalent adjustment 255 223 133 74 54
Interest income - taxable equivalent $ 22,716 $ 22,530 $ 22,428 $ 22,190 $ 21,553
Net interest income reconciliation
Net interest income - GAAP $ 19,253 $ 19,278 $ 19,354 $ 19,209 $ 18,867
Taxable equivalent adjustment 255 223 133 74 54
Net interest income - taxable equivalent $ 19,508 $ 19,501 $ 19,487 $ 19,283 $ 18,921
Operating noninterest income reconciliation
Noninterest income - GAAP $ 3,857 $ 4,430 $ 4,002 $ 8,880 $ 4,420
Gain on sale of branches - - - (3,885) -
Operating noninterest income $ 3,857 $ 4,430 $ 4,002 $ 4,995 $ 4,420
Operating noninterest expense reconciliation
Noninterest expense - GAAP $ 17,744 $ 18,775 $ 17,296 $ 18,943 $ 18,266
Merger-related expenses - (204) (579) (1,210) (749)
Divestiture expenses - - - (305) -
Operating noninterest expense $ 17,744 $ 18,571 $ 16,717 $ 17,428 $ 17,517
Operating income before income taxes reconciliation
Income (loss) before income taxes - GAAP $ 4,732 $ 2,725 $ 5,597 $ 8,369 $ 4,653
Taxable equivalent adjustment 255 223 133 74 54
Merger-related expenses - 204 579 1,210 749
Divestiture expenses - - - 305 -
Gain on sale of branches - - - (3,885) -
Operating income before income taxes $ 4,987 $ 3,152 $ 6,309 $ 6,073 $ 5,456
Income tax reconciliation
Income tax expense - GAAP $ 1,502 $ 1,116 $ 1,889 $ 3,222 $ 1,722
Taxable equivalent adjustment 255 223 133 74 54
Merger related expenses, tax benefit - 78 223 467 289
Divestiture expenses, tax benefit - - - 118 -
Gain on sale of branches, tax expense - - - (1,500) -
Operating income tax expense $ 1,757 $ 1,417 $ 2,245 $ 2,381 $ 2,065
Net income reconciliation
Net income - GAAP $ 3,230 $ 1,609 $ 3,708 $ 5,147 $ 2,931
Merger related expenses, net of income tax - 126 356 743 460
Divestiture expenses, net of income tax - - - 187 -
Gain on sale of branches, net of income tax - - - (2,385) -
Operating net income $ 3,230 $ 1,735 $ 4,064 $ 3,692 $ 3,391
Diluted earnings per share reconciliation
Diluted earnings per share - GAAP $ 0.13 $ 0.06 $ 0.15 $ 0.20 $ 0.12
Merger related expenses - 0.01 0.01 0.03 0.02
Net gain on sale of branches - - - (0.08) -
Diluted earnings per share - operating $ 0.13 $ 0.07 $ 0.16 $ 0.15 $ 0.14
Book value per common share reconciliation
Total shareholders’ equity $ 310,967 $ 303,658 $ 308,463 $ 304,066 $ 294,652
Intangible assets (29,186) (29,567) (30,071) (31,674) (33,914)
Total tangible common equity $ 281,781 $ 274,091 $ 278,392 $ 272,392 $ 260,738
Common shares outstanding 25,535,013 25,093,135 24,950,099 24,750,163 24,569,823
Book value per common share - GAAP $ 12.18 $ 12.10 $ 12.36 $ 12.29 $ 11.99
Tangible book value 11.04 10.92 11.16 11.01 10.61
2016

Non‐GAAP Reconciliation (continued)
27
ATLANTIC CAPITAL BANCSHARES, INC.
Non-GAAP Performance Measures Reconciliation
(in thousands, except share and per share data)
2017
First Quarter Fourth Quarter Third Quarter Second Quarter First Quarter
Return on average equity reconciliation
Net income - GAAP $ 3,230 $ 1,609 $ 3,708 $ 5,147 $ 2,931
Merger related expenses, net of income tax - 126 356 743 460
Divestiture expenses, net of income tax - - - 187 -
Gain on sale of branches, net of income tax - - - (2,385) -
Operating net income $ 3,230 $ 1,735 $ 4,064 $ 3,692 $ 3,391
Average shareholders' equity 308,261 308,588 306,642 299,170 291,806
Return on average equity - GAAP 4.19% 2.09% 4.84% 6.88% 4.02%
Return on average equity - operating 4.19% 2.25% 5.30% 4.94% 4.65%
Return on average assets reconciliation
Net income - GAAP $ 3,230 $ 1,609 $ 3,708 $ 5,147 $ 2,931
Merger related expenses, net of income tax - 126 356 743 460
Divestiture expenses, net of income tax - - - 187 -
Gain on sale of branches, net of income tax - - - (2,385) -
Operating net income $ 3,230 $ 1,735 $ 4,064 $ 3,692 $ 3,391
Average assets 2,694,715 2,722,444 2,717,996 2,718,110 2,620,750
Return on average assets - GAAP 0.48% 0.24% 0.55% 0.76% 0.45%
Return on average assets - operating 0.48% 0.25% 0.60% 0.54% 0.52%
Efficiency ratio reconciliation
Noninterest income - GAAP $ 3,857 $ 4,430 $ 4,002 $ 8,880 $ 4,420
Gain on sale of branches - - - (3,885) -
Operating noninterest income $ 3,857 $ 4,430 $ 4,002 $ 4,995 $ 4,420
Noninterest expense - GAAP $ 17,744 $ 18,775 $ 17,296 $ 18,943 $ 18,266
Merger-related expenses - (204) (579) (1,210) (749)
Divestiture expenses - - - (305) -
Operating noninterest expense $ 17,744 $ 18,571 $ 16,717 $ 17,428 $ 17,517
Net interest income 19,253 19,278 19,354 19,209 18,867
Efficiency ratio 76.78% 78.33% 71.57% 72.00% 75.22%
Tangible common equity to tangible assets reconciliation
Total shareholders’ equity $ 310,967 $ 303,658 $ 308,463 $ 304,066 $ 294,652
Intangible assets (29,186) (29,567) (30,071) (31,674) (33,914)
Total tangible common equity $ 281,781 $ 274,091 $ 278,392 $ 272,392 $ 260,738
Total assets $ 2,802,078 $ 2,727,543 $ 2,761,244 $ 2,807,822 $ 2,724,669
Intangible assets (29,186) (29,567) (30,071) (31,674) (33,914)
Total tangible assets $ 2,772,892 $ 2,697,976 $ 2,731,173 $ 2,776,148 $ 2,690,755
Tangible common equity to tangible assets 10.16% 10.16% 10.19% 9.81% 9.69%
Deposits excluding deposits to be assumed in branch sales
Total deposits $ 2,203,039 $ 2,237,580 $ 2,188,856 $ 2,158,305 $ 2,282,462
Deposits to be assumed in branch sales (29,495) (31,589) - - (197,857)
Deposits excluding deposits to be assumed in branch sales $ 2,173,544 $ 2,205,991 $ 2,188,856 $ 2,158,305 $ 2,084,605
Loans held for investment excluding mortgage warehouse loans
Total loans held for investment $ 1,901,724 $ 1,981,330 $ 2,008,102 $ 1,942,137 $ 1,886,763
Mortgage warehouse loans (58,357) (147,519) (171,251) (126,108) (123,875)
Loans held for investment excluding mortgage warehouse loans $ 1,843,367 $ 1,833,811 $ 1,836,851 $ 1,816,029 $ 1,762,888
2016

