Attached files
| file | filename |
|---|---|
| EX-99.4 - EX-99.4 - PDL Community Bancorp | d371501dex994.htm |
| EX-1.1 - EX-1.1 - PDL Community Bancorp | d371501dex11.htm |
| EX-99.5 - EX-99.5 - PDL Community Bancorp | d371501dex995.htm |
| EX-23.3 - EX-23.3 - PDL Community Bancorp | d371501dex233.htm |
| EX-23.2 - EX-23.2 - PDL Community Bancorp | d371501dex232.htm |
| EX-3.2 - EX-3.2 - PDL Community Bancorp | d371501dex32.htm |
| EX-3.1 - EX-3.1 - PDL Community Bancorp | d371501dex31.htm |
| S-1/A - S-1/A - PDL Community Bancorp | d371501ds1a.htm |
Exhibit 99.3
PRO FORMA VALUATION REPORT
MUTUAL HOLDING COMPANY
STOCK OFFERING
PDL Community Bancorp | Bronx, New York
PROPOSED HOLDING COMPANY FOR:
Ponce De Leon Federal Bank | Bronx, New York
Dated as of May 5, 2017

1100 North Glebe Road Suite 600
Arlington, Virginia 22201
703.528.1700
rpfinancial.com

May 5, 2017
Board of Directors
Ponce Bank Mutual Holding Company
PDL Community Bancorp
Ponce De Leon Federal Bank
2244 Westchester Avenue
Bronx, New York 10462
Members of the Board of Directors:
At your request, we have completed and hereby provide an independent appraisal (“Appraisal”) of the estimated pro forma market value of the common stock which is to be issued in connection with the stock issuance transaction described below.
This Appraisal is furnished pursuant to the requirements stipulated in the Code of Federal Regulations and has been prepared in accordance with the “Guidelines for Appraisal Reports for the Valuation of Savings and Loan Associations Converting from Mutual to Stock Form of Organization” (the “Valuation Guidelines”) of the Office of Thrift Supervision (“OTS”) and accepted by the Federal Reserve Board (“FRB”), the Office of the Comptroller of the Currency (“OCC”) and the Federal Deposit Insurance Corporation (“FDIC”), and applicable regulatory interpretations thereof.
Description of Plan of Reorganization and Stock Offering
On November 17, 2016, the Board of Directors of Ponce De Leon Federal Bank adopted a plan of reorganization (the “Reorganization”) and on April 7, 2017 the Board of Directors of Ponce De Leon Federal Bank adopted amendment No. 1 to the Reorganization, pursuant to which Ponce De Leon Federal Bank will reorganize into a two-tier mutual holding company structure. After the Reorganization, PDL Community Bancorp (the “Company”), a federal corporation, will be the mid-tier stock holding company and Ponce Bank Mutual Holding Company (the “MHC”), a federally chartered mutual holding company, will be the top-tier mutual holding company. The Reorganization will be completed as follows:
| (i) | Ponce De Leon Federal Bank will organize an interim stock savings association as a wholly owned subsidiary (“Interim Bank”); |
| (ii) | After Interim Bank receives approval from the FDIC for insurance of accounts and the FDIC has issued it a certificate number, Ponce De Leon Federal Bank will transfer pursuant to a purchase and assumption agreement all of its assets and liabilities, except $200,000 in cash, to Interim Bank, and Interim Bank will become the stock savings association resulting from the reorganization, including the purchase and assumption transaction pursuant to the plan (the “Stock Bank”); |
| Washington Headquarters | ||
| Three Ballston Plaza | Telephone: (703) 528-1700 | |
| 1100 North Glebe Road, Suite 600 | Fax No.: (703) 528-1788 | |
| Arlington, VA 22201 | Toll-Free No.: (866) 723-0594 | |
| www.rpfinancial.com | E-Mail: mail@rpfinancial.com |
Board of Directors
May 5, 2017
Page 2
| (iii) | Ponce De Leon Federal Bank will amend its charter and bylaws to read in the form of a federal mutual holding company to become Ponce Bank Mutual Holding Company; |
| (iv) | Ponce Bank Mutual Holding Company will organize PDL Community Bancorp as a wholly-owned subsidiary, and transfer $1,000 to PDL Community Bancorp in exchange for 100 shares of PDL Community Bancorp common stock; and |
| (v) | Ponce Bank Mutual Holding Company will transfer all of the initially issued stock of the Stock Bank to PDL Community Bancorp in exchange for additional shares of PDL Community Bancorp common stock, and the Stock Bank will become a wholly-owned subsidiary of PDL Community Bancorp, operating under the name Ponce Bank. |
For purposes of this document, Ponce De Leon Federal Bank will hereinafter be referred to as Ponce Bank or the “Bank”.
Concurrent with the Reorganization, PDL Community Bancorp will issue a majority of its common stock to the MHC and sell a minority of its common stock to the public. At the completion of the public stock offering, the Company will retain up to 50% of the net stock proceeds. The MHC will own a controlling interest in the Company of at least 51%, and the Company will be the sole subsidiary of the MHC. The Company will own 100% of the Bank’s outstanding stock. The Company’s initial activity will be ownership of its subsidiary, Ponce Bank, investment of the net cash proceeds retained at the holding company level and extending a loan to the employee stock ownership plan.
PDL Community Bancorp will offer its common stock in a subscription offering to Eligible Account Holders, Tax-Qualified Plans including Ponce Bank’s employee stock ownership plan (the “ESOP”), Supplemental Eligible Account Holders and Other Members as such terms are defined for purposes of applicable regulatory guidelines governing stock offerings by mutual institutions. To the extent that shares remain available for purchase after satisfaction of all subscriptions received in the subscription offering, the shares may be offered for sale to members of the general public in a community offering and a syndicated community offering. At least 50% of the net proceeds from the stock offering will be invested in Ponce Bank and the balance of the net proceeds will be retained by the Company.
At this time, no other activities are contemplated for the Company other than the ownership of Ponce Bank, a loan to the newly-formed ESOP and reinvestment of the proceeds that are retained by the Company. In the future, PDL Community Bancorp may acquire or organize other operating subsidiaries, diversify into other banking-related activities, pay dividends or repurchase its stock, although there are no specific plans to undertake such activities at the present time.
The Reorganization provides for the establishment of a new charitable foundation (the “Foundation”). The Foundation contribution will be funded with 3.3% of the number of shares of common stock issued in the stock issuance and $200,000 of cash funded by the net proceeds retained by the Company. The purpose of the Foundation is to provide financial support to charitable organizations in the communities in which Ponce Bank operates and to enable those communities to share in the Bank’s long-term growth. The Foundation will be dedicated completely to community activities and the promotion of charitable causes.
Board of Directors
May 5, 2017
Page 3
RP® Financial, LC.
RP® Financial, LC. (“RP Financial”) is a financial consulting firm serving the financial services industry nationwide that, among other things, specializes in financial valuations and analyses of business enterprises and securities, including the pro forma valuation for savings institutions converting from mutual-to-stock form. The background and experience of RP Financial is detailed in Exhibit V-1. We believe that, except for the fee we will receive for the Appraisal, we are independent of the Company, the Bank, the MHC and the other parties engaged by the Bank, the Company or the MHC to assist in the stock conversion process.
Valuation Methodology
In preparing our Appraisal, we have reviewed the regulatory applications of the Company, the Bank and the MHC, including the prospectus as filed with the FRB, the OCC and the Securities and Exchange Commission (“SEC”). We have conducted a financial analysis of the Company, the Bank and the MHC that has included a review of audited financial information for the years ended December 31, 2012 through December 31, 2016, a review of various unaudited information and internal financial reports through March 31, 2017, and due diligence related discussions with the Bank’s management; WeiserMazars LLP, the Bank’s independent auditor; Locke Lord LLP, the Bank’s counsel for the Reorganization and Raymond James Associates, Inc., the Bank’s marketing advisor in connection with the stock offering. All assumptions and conclusions set forth in the Appraisal were reached independently from such discussions. In addition, where appropriate, we have considered information based on other available published sources that we believe are reliable. While we believe the information and data gathered from all these sources are reliable, we cannot guarantee the accuracy and completeness of such information.
We have investigated the competitive environment within which Ponce Bank operates and have assessed Ponce Bank’s relative strengths and weaknesses. We have kept abreast of the changing regulatory and legislative environment for financial institutions and analyzed the potential impact on Ponce Bank and the industry as a whole. We have analyzed the potential effects of the stock offering on Ponce Bank’s operating characteristics and financial performance as they relate to the pro forma market value of PDL Community Bancorp. We have reviewed the economic and demographic characteristics of the Bank’s primary market area. We have compared Ponce Bank’s financial performance and condition with selected publicly-traded thrifts in accordance with the Valuation Guidelines, as well as all publicly-traded thrifts and thrift holding companies. We have reviewed the current conditions in the securities markets in general and the market for thrift stocks in particular, including the market for existing thrift issues and initial public offerings by thrifts and thrift holding companies. We have excluded from such analyses thrifts subject to announced or rumored acquisition, and/or institutions that exhibit other unusual characteristics.
The Appraisal is based on Ponce Bank’s representation that the information contained in the regulatory applications and additional information furnished to us by Ponce Bank and its
Board of Directors
May 5, 2017
Page 4
independent auditor, legal counsel and other authorized agents are truthful, accurate and complete. We did not independently verify the financial statements and other information provided by Ponce Bank, or its independent auditor, legal counsel and other authorized agents nor did we independently value the assets or liabilities of Ponce Bank. The valuation considers Ponce Bank only as a going concern and should not be considered as an indication of Ponce Bank’s liquidation value.
Our appraised value is predicated on a continuation of the current operating environment for Ponce Bank and for all thrifts and their holding companies. Changes in the local, state and national economy, the legislative and regulatory environment for financial institutions and mutual holding companies, the stock market, interest rates, and other external forces (such as natural disasters or significant world events) may occur from time to time, often with great unpredictability and may materially impact the value of thrift stocks as a whole or the value of Ponce Bank’s stock alone. It is our understanding that there are no current plans for selling control of Ponce Bank following completion of the stock offering. To the extent that such factors can be foreseen, they have been factored into our analysis.
The estimated pro forma market value is defined as the price at which PDL Community Bancorp’s common stock, immediately upon completion of the stock offering, would change hands between a willing buyer and a willing seller, neither being under any compulsion to buy or sell and both having reasonable knowledge of relevant facts.
Valuation Conclusion
It is our opinion that, as of May 5, 2017, the estimated aggregate pro forma market value of the shares to be issued immediately following the offering, both shares issued publicly as well as to the MHC, was $139,607,030 at the midpoint, equal to 13,960,703 shares issued at a per share value of $10.00. Pursuant to conversion guidelines, the 15% offering range indicates a minimum value of $118,665,980 and a maximum value of $160,548,080. Based on the $10.00 per share offering price determined by the Board, this valuation range equates to total shares outstanding of 11,866,598 shares at the minimum of the valuation range and 16,054,808 total shares outstanding at the maximum of the valuation range. In the event that the appraised value is subject to an increase, the aggregate pro forma market value may be increased up to a super maximum value of $184,630,290 without a resolicitation. Based on the $10.00 per share offering price, the super maximum value would result in total shares outstanding of 18,463,029. The Board of Directors has established a public offering range such that the public ownership of the Company will constitute a 45.0% ownership interest of the Company prior to the issuance of the shares to the Foundation. Accordingly, the offering range to the public of the minority stock will be $53,399,690 at the minimum, $62,823,160 at the midpoint, $72,246,630 at the maximum and $83,083,620 at the super maximum. Based on the public offering range, and inclusive of the shares issued to the Foundation, the public ownership of the shares will represent 48.3% of the shares issued, with the MHC owning the majority of the shares.
Limiting Factors and Considerations
The valuation is not intended, and must not be construed, as a recommendation of any kind as to the advisability of purchasing shares of the common stock. Moreover, because such
Board of Directors
May 5, 2017
Page 5
valuation is determined in accordance with applicable regulatory guidelines and is necessarily based upon estimates and projections of a number of matters, all of which are subject to change from time to time, no assurance can be given that persons who purchase shares of common stock in the stock offering will thereafter be able to buy or sell such shares at prices related to the foregoing valuation of the estimated pro forma market value thereof. The appraisal reflects only a valuation range as of this date for the pro forma market value of PDL Community Bancorp immediately upon issuance of the stock and does not take into account any trading activity with respect to the purchase and sale of common stock in the secondary market on the date of issuance of such securities or at anytime thereafter following the completion of the stock offering.
RP Financial’s valuation was based on the financial condition and operations of Ponce Bank as of March 31, 2017, the date of the financial data included in the prospectus.
RP Financial is not a seller of securities within the meaning of any federal and state securities laws and any report prepared by RP Financial shall not be used as an offer or solicitation with respect to the purchase or sale of any securities. RP Financial maintains a policy which prohibits RP Financial, its principals or employees from purchasing stock of its client institutions.
This valuation will be updated as provided for in the conversion regulations and guidelines. These updates will consider, among other things, any developments or changes in the financial performance and condition of Ponce Bank, management policies, and current conditions in the equity markets for thrift shares, both existing issues and new issues. These updates may also consider changes in other external factors which impact value including, but not limited to: various changes in the legislative and regulatory environment for financial institutions, the stock market and the market for thrift stocks, and interest rates. Should any such new developments or changes be material, in our opinion, to the valuation of the shares, appropriate adjustments to the estimated pro forma market value will be made. The reasons for any such adjustments will be explained in the update at the date of the release of the update. The valuation will also be updated at the completion of PDL Community Bancorp’s stock offering.
| Respectfully submitted, |
| RP® FINANCIAL, LC. |
|
|
| Ronald S. Riggins |
| Managing Director |
|
|
| Gregory E. Dunn |
| Director |


| RP® Financial, LC. | TABLE OF CONTENTS | |
| i |
TABLE OF CONTENTS
PDL COMMUNITY BANCORP
PONCE BANK
Bronx, New York
| DESCRIPTION |
PAGE NUMBER |
|||||
| CHAPTER ONE |
OVERVIEW AND FINANCIAL ANALYSIS |
|||||
| Introduction |
I.1 | |||||
| Plan of Reorganization and Stock Offering |
I.1 | |||||
| Strategic Overview |
I.3 | |||||
| Balance Sheet Trends |
I.5 | |||||
| Income and Expense Trends |
I.8 | |||||
| Interest Rate Risk Management |
I.11 | |||||
| Lending Activities and Strategy |
I.12 | |||||
| Asset Quality |
I.14 | |||||
| Funding Composition and Strategy |
I.15 | |||||
| Subsidiary Activities |
1.16 | |||||
| Legal Proceedings |
I.16 | |||||
| CHAPTER TWO |
MARKET AREA |
|||||
| Introduction |
II.1 | |||||
| National Economic Factors |
II.1 | |||||
| Market Area Demographics |
II.5 | |||||
| Local Economy |
II.7 | |||||
| Unemployment Trends |
II.8 | |||||
| Market Area Deposit Characteristics and Competition |
II.9 | |||||
| CHAPTER THREE |
PEER GROUP ANALYSIS |
|||||
| Peer Group Selection |
III.1 | |||||
| Financial Condition |
III.5 | |||||
| Income and Expense Components |
III.8 | |||||
| Loan Composition |
III.11 | |||||
| Interest Rate Risk |
III.11 | |||||
| Credit Risk |
III.14 | |||||
| Summary |
III.14 | |||||
| RP® Financial, LC. | TABLE OF CONTENTS | |
| ii |
TABLE OF CONTENTS
PDL COMMUNITY BANCORP
PONCE BANK
Bronx, New York
(continued)
| DESCRIPTION |
PAGE NUMBER |
|||||
| CHAPTER FOUR |
VALUATION ANALYSIS |
|||||
| Introduction |
IV.1 | |||||
| Appraisal Guidelines |
IV.1 | |||||
| RP Financial Approach to the Valuation |
IV.1 | |||||
| Valuation Analysis |
IV.2 | |||||
| 1. Financial Condition |
IV.3 | |||||
| 2. Profitability, Growth and Viability of Earnings |
IV.4 | |||||
| 3. Asset Growth |
IV.6 | |||||
| 4. Primary Market Area |
IV.6 | |||||
| 5. Dividends |
IV.7 | |||||
| 6. Liquidity of the Shares |
IV.8 | |||||
| 7. Marketing of the Issue |
IV.9 | |||||
| A. The Public Market |
IV.9 | |||||
| B. The New Issue Market |
IV.12 | |||||
| C. The Acquisition Market |
IV.13 | |||||
| 8. Management |
IV.16 | |||||
| 9. Effect of Government Regulation and Regulatory Reform |
IV.17 | |||||
| Summary of Adjustments |
IV.17 | |||||
| Valuation Approaches: Fully-Converted Basis |
IV.17 | |||||
| Basis of Valuation- Fully-Converted Pricing Ratios |
IV.19 | |||||
| 1. Price-to-Earnings (“P/E”) |
IV.19 | |||||
| 2. Price-to-Book (“P/B”) |
IV.22 | |||||
| 3. Price-to-Assets (“P/A”) |
IV.23 | |||||
| Comparison to Publicly-Traded MHCs |
IV.23 | |||||
| Comparison to Recent MHC Offerings |
IV.27 | |||||
| Valuation Conclusion |
IV.27 | |||||
| RP® Financial, LC. | LIST OF TABLES | |
| iii |
LIST OF TABLES
PDL COMMUNITY BANCORP
PONCE BANK
Bronx, New York
| TABLE |
DESCRIPTION |
PAGE | ||||
| 1.1 |
Historical Balance Sheet Data |
I.6 | ||||
| 1.2 |
Historical Income Statements |
I.9 | ||||
| 2.1 |
Summary Demographic Data |
II.6 | ||||
| 2.2 |
Primary Market Area Employment Sectors |
II.7 | ||||
| 2.3 |
Market Area Largest Employers |
II.8 | ||||
| 2.4 |
Unemployment Trends |
II.9 | ||||
| 2.5 |
Deposit Summary |
II.10 | ||||
| 2.6 |
Market Area Deposit Competitors – As of June 30, 2016 |
II.11 | ||||
| 3.1 |
Peer Group of Publicly-Traded Thrifts |
III.3 | ||||
| 3.2 |
Balance Sheet Composition and Growth Rates |
III.6 | ||||
| 3.3 |
Income as a Pct. of Avg. Assets and Yields, Costs, Spreads |
III.9 | ||||
| 3.4 |
Loan Portfolio Composition and Related Information |
III.12 | ||||
| 3.5 |
Interest Rate Risk Measures and Net Interest Income Volatility |
III.13 | ||||
| 3.6 |
Credit Risk Measures and Related Information |
III.15 | ||||
| 4.1 |
Market Area Unemployment Rates |
IV.7 | ||||
| 4.2 |
Pricing Characteristics and After-Market Trends |
IV.14 | ||||
| 4.3 |
Market Pricing Comparatives |
IV.15 | ||||
| 4.4 |
Fully-Converted Market Pricing Versus Peer Group |
IV.20 | ||||
| 4.5 |
MHC Market Pricing Versus Peer Group |
IV.21 | ||||
| 4.6 |
Calculation of Implied Per Share Data- Incorporating MHC Second Step Conversion |
IV.25 | ||||
| 4.7 |
MHC Institutions Implied Pricing Ratios, Full Conversion Basis |
IV.26 | ||||
| RP® Financial, LC. | OVERVIEW AND FINANCIAL ANALYSIS | |
| I.1 |
I. OVERVIEW AND FINANCIAL ANALYSIS
Introduction
Ponce De Leon Federal Bank, established in 1960, is a federally-chartered mutual savings association headquartered in Bronx, New York. The Bank serves the New York metropolitan area through its headquarters office and 13 full service branch offices. A map of the Bank’s office locations is provided in Exhibit I-1. Ponce Bank is a member of the Federal Home Loan Bank (“FHLB”) system and its deposits are insured up to the maximum allowable amount by the Federal Deposit Insurance Corporation (“FDIC”). As of March 31, 2017, Ponce Bank had total assets of $786.3 million, total deposits of $655.9 million and total equity of $93.5 million equal to 11.89% of total assets. The Bank’s audited financial statements are included by reference as Exhibit I-2.
Plan of Reorganization and Stock Offering
On November 17, 2016, the Board of Directors of Ponce De Leon Federal Bank adopted a plan of reorganization (the “Reorganization”) and on April 7, 2017 the Board of Directors of Ponce De Leon Federal Bank adopted amendment No. 1 to the Reorganization, pursuant to which Ponce De Leon Federal Bank will reorganize into a two-tier mutual holding company structure. After the Reorganization, PDL Community Bancorp (the “Company”), a federal corporation, will be the mid-tier stock holding company and Ponce Bank Mutual Holding Company (the “MHC”), a federally chartered mutual holding company, will be the top-tier mutual holding company. The Reorganization will be completed as follows:
| (i) | Ponce De Leon Federal Bank will organize an interim stock savings association as a wholly owned subsidiary (“Interim Bank”); |
| (ii) | After Interim Bank receives approval from the FDIC for insurance of accounts and the FDIC has issued it a certificate number, Ponce De Leon Federal Bank will transfer pursuant to a purchase and assumption agreement all of its assets and liabilities, except $200,000 in cash, to Interim Bank, and Interim Bank will become the stock savings association resulting from the reorganization, including the purchase and assumption transaction pursuant to the plan (the “Stock Bank”); |
| (iii) | Ponce De Leon Federal Bank will amend its charter and bylaws to read in the form of a federal mutual holding company to become Ponce Bank Mutual Holding Company; |
| (iv) | Ponce Bank Mutual Holding Company will organize PDL Community Bancorp as a wholly-owned subsidiary, and transfer $1,000 to PDL Community Bancorp in exchange for 100 shares of PDL Community Bancorp common stock; and |
| (v) | Ponce Bank Mutual Holding Company will transfer all of the initially issued stock of the Stock Bank to PDL Community Bancorp in exchange for additional shares of PDL Community Bancorp common stock, and the Stock Bank will become a wholly-owned subsidiary of PDL Community Bancorp, operating under the name Ponce Bank. |
| RP® Financial, LC. | OVERVIEW AND FINANCIAL ANALYSIS | |
| I.2 |
For purposes of this document, Ponce De Leon Federal Bank will hereinafter be referred to as Ponce Bank or the “Bank”.
Concurrent with the Reorganization, PDL Community Bancorp will issue a majority of its common stock to the MHC and sell a minority of its common stock to the public. At the completion of the public stock offering, the Company will retain up to 50% of the net stock proceeds. The MHC will own a controlling interest in the Company of at least 51%, and the Company will be the sole subsidiary of the MHC. The Company will own 100% of the Bank’s outstanding stock. The Company’s initial activity will be ownership of its subsidiary, Ponce Bank, investment of the net cash proceeds retained at the holding company level and extending a loan to the employee stock ownership plan.
PDL Community Bancorp will offer its common stock in a subscription offering to Eligible Account Holders, Tax-Qualified Plans including Ponce Bank’s employee stock ownership plan (the “ESOP”), Supplemental Eligible Account Holders and Other Members as such terms are defined for purposes of applicable regulatory guidelines governing stock offerings by mutual institutions. To the extent that shares remain available for purchase after satisfaction of all subscriptions received in the subscription offering, the shares may be offered for sale to members of the general public in a community offering and a syndicated community offering. At least 50% of the net proceeds from the stock offering will be invested in Ponce Bank and the balance of the net proceeds will be retained by the Company.
At this time, no other activities are contemplated for the Company other than the ownership of Ponce Bank, a loan to the newly-formed ESOP and reinvestment of the proceeds that are retained by the Company. In the future, PDL Community Bancorp may acquire or organize other operating subsidiaries, diversify into other banking-related activities, pay dividends or repurchase its stock, although there are no specific plans to undertake such activities at the present time.
The Reorganization provides for the establishment of a new charitable foundation (the “Foundation”). The Foundation contribution will be funded with 3.3% of the number of shares of
| RP® Financial, LC. | OVERVIEW AND FINANCIAL ANALYSIS | |
| I.3 |
common stock issued in the stock issuance and $200,000 of cash funded by the net proceeds retained by the Company. The purpose of the Foundation is to provide financial support to charitable organizations in the communities in which Ponce Bank operates and to enable those communities to share in the Bank’s long-term growth. The Foundation will be dedicated completely to community activities and the promotion of charitable causes.
Strategic Overview
Ponce Bank maintains a local community banking emphasis, with a primary strategic objective of meeting the borrowing and savings needs of its local customer base. Historically, as a traditional thrift institution, the Bank’s lending activities were concentrated in origination of 1-4 family permanent mortgage loans and such loans continue to comprise the largest concentration of the loan portfolio. In recent years, the Bank embarked on a new strategic direction designed to build a full service community banking franchise dedicated to meeting the banking needs of business and retail customers in the communities that are served by the Bank. In connection with the implementation of a full service community banking strategy, the Bank invested in infrastructure and personnel to manage and facilitate growth strategies. Most notably, in support of implementation of a diversified lending strategy, the Bank has been building a team of commercial lenders experienced in developing full service commercial banking relationships in the local market. The Bank’s objective is to fund asset growth primarily through deposit growth, emphasizing growth of lower cost core deposits. Core deposit growth is expected to be in part facilitated by growth of commercial lending relationships, pursuant to which the Bank is seeking to establish a full service banking relationship with its commercial loan customers through offering a full range of commercial loan products that can be packaged with lower cost commercial deposit products.
Investments serve as a supplement to the Bank’s lending activities and the investment portfolio is considered to be indicative of a low risk investment philosophy. U.S. Government and federal agency securities constitute the largest portion of the Bank’s investment portfolio, with other investments consisting of mortgage-backed securities that are guaranteed or insured by government sponsored enterprises (“GSEs”) or backed by GInnie Mae and certificates of deposit (“CDs”) held in other financial institutions.
Deposits have consistently served as the primary funding source for the Bank, with supplemental funding provided by utilization of borrowings as an alternative funding source for purposes of managing funding costs and interest rate risk. CDs constitute the largest portion of the Bank’s deposit base. Borrowings currently held by the Bank consist of FHLB advances.
| RP® Financial, LC. | OVERVIEW AND FINANCIAL ANALYSIS | |
| I.4 |
Ponce Bank’s earnings base is largely dependent upon net interest income and operating expense levels. The Bank has experienced some net interest margin compression during the past two years, which has been primarily attributable to a more significant decline in interest-earning assets yields as interest-bearing funding costs have been relatively stable in recent years. Operating expense ratios have trended higher in recent years, primarily in connection with building out the Bank’s commercial lending platform. Non-interest operating income has been a fairly stable but limited contributor to the Bank’s earnings, reflecting limiting diversification into fee-based products and services. The amount of loan loss provisions established has decreased significantly in recent years, which was facilitated by improving trends in the Bank’s credit quality.
The post-offering business plan of the Bank is expected to continue to focus on implementing strategic initiatives to develop and grow a full service community banking franchise. Accordingly, Ponce Bank will continue to be an independent full service community bank, with a commitment to meeting the retail and commercial banking needs of individuals and businesses in the New York metropolitan area.
The Bank’s Board of Directors has elected to complete a public stock offering to sustain growth strategies and facilitate implementation of its strategic plan. The capital realized from the stock offering will increase the Bank’s operating flexibility and allow for additional growth of the balance sheet. The additional funds realized from the stock offering will provide an alternative funding source to deposits and borrowings in meeting the Bank’s future funding needs, which may facilitate a reduction in Ponce Bank’s funding costs. Additionally, Ponce Bank’s higher equity-to-assets ratio will enable the Bank to pursue expansion opportunities. Such expansion would most likely occur through the acquisition of other financial institutions or financial service companies that would increase market penetration in the markets currently served by the Bank or to gain a market presence into nearby complementary markets. At this time, the Bank has no specific plans for expansion. The projected uses of proceeds are highlighted below.
| • | The Company. The Company is expected to retain up to 50% of the net offering proceeds. At present, funds at the Company level, net of the loan to the ESOP and the cash contribution to the Foundation, are expected to be primarily invested initially into liquid funds held as a deposit at the Bank. Over time, the |
| RP® Financial, LC. | OVERVIEW AND FINANCIAL ANALYSIS | |
| I.5 |
| funds may be utilized for various corporate purposes, possibly including acquisitions, infusing additional equity into the Bank, repurchases of common stock and the payment of cash dividends. |
| • | The Bank. Approximately 50% of the net conversion proceeds will be infused into the Bank. Cash proceeds (i.e., net proceeds less deposits withdrawn to fund stock purchases) infused into the Bank are anticipated to become part of general operating funds and are expected to be primarily utilized to fund loan growth over time. |
Overall, it is the Bank’s objective to pursue controlled growth that will serve to increase returns, while continuing to emphasize management of the overall risk associated with Ponce Bank’s operations.
Balance Sheet Trends
Table 1.1 shows the Bank’s historical balance sheet data for the past five and one-quarter years. From yearend 2012 through March 31, 2017, Ponce Bank’s assets increased at a 0.75% annual rate. Total assets trended lower from yearend 2012 through yearend 2015, which was followed by a healthy increase in assets during 2016 and the first quarter of 2017. Both loans and cash and investments declined during the period of asset shrinkage, while asset growth during 2016 and the first quarter of 2017 was sustained by loan growth. Asset shrinkage and borrowings funded deposit run-off from yearend 2012 through yearend 2015, while deposit growth in 2016 funded asset growth and the pay down of borrowings. Asset growth during the first quarter of 2017 was funded by deposit growth and an increase in borrowings. A summary of Ponce Bank’s key operating ratios for the past five years is presented in Exhibit I-3.
Ponce Bank’s loans receivable portfolio increased at a 3.53% annual rate from yearend 2012 through March 31, 2017, in which the loans receivable balance declined from yearend 2012 through yearend 2014 and then increased during the past two and one-quarter years. The most significant loan growth was realized during 2016, and the first quarter of 2017 which was primarily attributable to growth of multi-family loans. Loan growth combined with asset shrinkage provided for an increase in the loans-to-assets ratio from 76.77% at yearend 2012 to 86.17% at March 31, 2017.
Trends in the Bank’s loan portfolio composition since yearend 2012 show that the concentration of 1-4 family mortgage loans comprising total loans decreased from 52.67% of total loans receivable at yearend 2012 to 48.60% of total loans receivable at March 31, 2017. Comparatively, from yearend 2012 through March 31, 2017, multi-family increased from 18.16%
| RP® Financial, LC. | OVERVIEW AND FINANCIAL ANALYSIS | |
| I.6 |
Table 1.1
Ponce Bank
Historical Balance Sheet Data
| 12/31/12- | ||||||||||||||||||||||||||||||||||||||||||||||||||||
| 3/31/17 | ||||||||||||||||||||||||||||||||||||||||||||||||||||
| At December 31, | At March 31, | Annual. | ||||||||||||||||||||||||||||||||||||||||||||||||||
| 2012 | 2013 | 2014 | 2015 | 2016 | 2017 | Growth Rate | ||||||||||||||||||||||||||||||||||||||||||||||
| Amount | Pct(1) | Amount | Pct(1) | Amount | Pct(1) | Amount | Pct(1) | Amount | Pct(1) | Amount | Pct(1) | Pct | ||||||||||||||||||||||||||||||||||||||||
| ($000) | (%) | ($000) | (%) | ($000) | (%) | ($000) | (%) | ($000) | (%) | ($000) | (%) | (%) | ||||||||||||||||||||||||||||||||||||||||
| Total Amount of: |
||||||||||||||||||||||||||||||||||||||||||||||||||||
| Assets |
$ | 761,544 | 100.00 | % | $ | 730,644 | 100.00 | % | $ | 706,414 | 100.00 | % | $ | 703,157 | 100.00 | % | $ | 744,983 | 100.00 | % | $ | 786,253 | 100.00 | % | 0.75 | % | ||||||||||||||||||||||||||
| Cash and cash equivalents |
21,141 | 2.78 | % | 12,752 | 1.75 | % | 15,849 | 2.24 | % | 12,694 | 1.81 | % | 11,716 | 1.57 | % | 16,504 | 2.10 | % | -5.66 | % | ||||||||||||||||||||||||||||||||
| Investment securities/CDs |
108,693 | 14.27 | % | 102,305 | 14.00 | % | 100,574 | 14.24 | % | 82,034 | 11.67 | % | 52,690 | 7.07 | % | 51,937 | 6.61 | % | -15.95 | % | ||||||||||||||||||||||||||||||||
| Loans held for sale |
— | 0.00 | % | 5,667 | 0.78 | % | 2,707 | 0.38 | % | 3,303 | 0.47 | % | 2,143 | 0.29 | % | 2,143 | 0.27 | % | NM | |||||||||||||||||||||||||||||||||
| Loans receivable, net |
584,606 | 76.77 | % | 561,623 | 76.87 | % | 543,289 | 76.91 | % | 567,662 | 80.73 | % | 642,148 | 86.20 | % | 677,525 | 86.17 | % | 3.53 | % | ||||||||||||||||||||||||||||||||
| FHLB stock |
1,124 | 0.15 | % | 1,596 | 0.22 | % | 1,267 | 0.18 | % | 1,162 | 0.17 | % | 964 | 0.13 | % | 2,089 | 0.27 | % | 15.70 | % | ||||||||||||||||||||||||||||||||
| Core deposit intangible |
564 | 0.07 | % | 420 | 0.06 | % | 276 | 0.04 | % | 132 | 0.02 | % | 3 | 0.00 | % | 3 | 0.00 | % | -70.83 | % | ||||||||||||||||||||||||||||||||
| Deposits |
$ | 666,851 | 87.57 | % | $ | 627,060 | 85.82 | % | $ | 599,697 | 84.89 | % | $ | 599,506 | 85.26 | % | $ | 643,078 | 86.32 | % | $ | 655,882 | 83.42 | % | -0.39 | % | ||||||||||||||||||||||||||
| Borrowings |
— | 0.00 | % | 11,000 | 1.51 | % | 10,000 | 1.42 | % | 8,000 | 1.14 | % | 3,000 | 0.40 | % | 28,000 | 3.56 | % | NM | |||||||||||||||||||||||||||||||||
| 0.00 | % | |||||||||||||||||||||||||||||||||||||||||||||||||||
| Equity |
$ | 86,147 | 11.31 | % | $ | 87,711 | 12.00 | % | $ | 89,600 | 12.68 | % | $ | 91,062 | 12.95 | % | $ | 92,992 | 12.48 | % | $ | 93,474 | 11.89 | % | 1.94 | % | ||||||||||||||||||||||||||
| Tangible equity |
$ | 85,583 | 11.24 | % | $ | 87,291 | 11.95 | % | $ | 89,324 | 12.64 | % | $ | 90,930 | 12.93 | % | $ | 92,989 | 12.48 | % | $ | 93,471 | 11.89 | % | 2.10 | % | ||||||||||||||||||||||||||
| Loans/Deposits |
87.67 | % | 89.56 | % | 90.59 | % | 94.69 | % | 99.86 | % | 103.30 | % | ||||||||||||||||||||||||||||||||||||||||
| Number of offices |
12 | 13 | 13 | 13 | 13 | 13 | ||||||||||||||||||||||||||||||||||||||||||||||
| (1) | Ratios are as a percent of ending assets. |
| Sources: | Ponce Bank’s prospectus, audited and unaudited financial statements, SNL Financial and RP Financial calculations. |
| RP® Financial, LC. | OVERVIEW AND FINANCIAL ANALYSIS | |
| I.7 |
of total loans receivable to 23.55% of total loans receivable, commercial real estate loans increased from 19.45% of total loans receivable to 20.45% of total loans receivable and construction and land loans increased from 5.00% of total loans receivable to 5.47% of total loans receivable. Over the same time period, the relative concentration of commercial business loans decreased from 4.47% of total loans receivable to 1.81% of total loans receivable, while the Bank’s holdings of consumer loans was nominal throughout the five year period. Additionally, loans held for sale, fluctuated from a zero balance at yearend 2012 to a high of $5.7 million at yearend 2013 and equaled $2.1 million or 0.27% of assets at March 31, 2017.
The intent of the Bank’s investment policy is to provide adequate liquidity and to generate a favorable return within the context of supporting Ponce Bank’s overall credit and interest rate risk objectives. It is anticipated that proceeds retained at the holding company level will be invested into liquid funds held as a deposit at the Bank. Since yearend 2012, the Bank’s level of cash and investment securities (inclusive of FHLB stock) ranged from a low of 8.77% of assets at yearend 2016 to a high of 17.20% of assets at yearend 2012. The decrease in the balance of cash and investments since yearend 2012 was largely related to redeployment of those funds for purposes of funding loan growth during the past two and one-quarter years. U.S. Government and federal agency securities totaling $41.5 million comprised the most significant component of the Bank’s investment portfolio at March 31, 2017. Other investments held by the Bank at March 31, 2017 consisted of mortgage-backed securities ($10.0 million) and CDs ($500,000). As of March 31, 2017, all investments were maintained as available for sale and reflected a net unrealized loss of $344,000. Exhibit I-4 provides historical detail of the Bank’s investment portfolio. As of March 31, 2017, the Bank also held $16.5 million of cash and cash equivalents and $2.1 million of FHLB stock.
Since yearend 2012, Ponce Bank’s funding needs have been addressed through a combination of deposits, borrowings and internal cash flows. From yearend 2012 through March 31, 2017, the Bank’s deposits decreased at a 0.39% annual rate. Deposits declined from yearend 2012 through yearend 2015, which was followed by deposit growth during 2016 and the first quarter of 2017. Overall, deposits as a percent of assets remained fairly stable over the past five and one-quarter years, equaling 87.57% of assets at yearend 2012 and 83.42% of assets at March 31, 2017. CDs account for the largest concentration of the Bank’s deposits and comprised 56.42% of average deposits during first quarter of 2017.
| RP® Financial, LC. | OVERVIEW AND FINANCIAL ANALYSIS | |
| I.8 |
Borrowings serve as an alternative funding source for the Bank to address funding needs for growth and to support management of deposit costs and interest rate risk. From yearend 2012 through March 31, 2017, borrowings ranged from a zero balance at yearend 2012 to high of $28.0 million or 3.56% of assets at March 31, 2017. Borrowing held by the Bank at March 31, 2017 consisted of overnight FHLB advances.
The Bank’s equity increased at a 1.94% annual rate from yearend 2012 through March 31, 2017, which was largely attributable to retention of earnings. The increase in equity combined with a comparatively slower rate of asset growth since yearend 2012 provided for a slight increase in the Bank’s equity-to-assets ratio from 11.31% at yearend 2012 to 11.89% at March 31, 2017. Similarly, the Bank’s tangible equity-to-assets ratio increased from 11.24% at yearend 2012 to 11.89% at March 31, 2017. The Bank maintained a nominal core deposit intangible balance at March 31, 2017. The Bank maintained capital surpluses relative to all of its regulatory capital requirements at March 31, 2017. The addition of stock proceeds will serve to strengthen the Bank’s capital position, as well as support growth opportunities. At the same time, the increase in Ponce Bank’s pro forma capital position will initially depress its ROE.
Income and Expense Trends
Table 1.2 shows the Bank’s historical income statements for the past five years and for the twelve months ended March 31, 2017. The Bank’s reported earnings ranged from a low of $1.2 million or 0.16% of average assets during the twelve months ended March 31, 2017 to a high of $4.1 million or 0.53% of average assets during 2012. Net interest income and operating expenses represent the primary components of the Bank’s recurring earnings, while non-operating income has been somewhat of a limited source of earnings for the Bank. Loan loss provisions have had a varied impact on the Bank’s earnings over the past five and one-quarter years. Non-operating gains and losses have not been a factor on the Bank’s earnings over the past five and one-quarter years.
During the period covered in Table 1.2, the Bank’s net interest income to average assets ratio ranged from a low of 3.79% during the twelve months ended March 31, 2017 to a high of 4.14% during 2014. The decline in the Bank’s net interest income ratio since 2014 has been largely attributable to interest rate spread compression that has resulted from a more significant decrease in the yield earned on interest-earnings assets relative to the cost of interest-bearing liabilities. As the result of the prolonged low interest rate environment, the decline in yield earned on less rate sensitive interest-earning assets has become more significant relative to the
| RP® Financial, LC. | OVERVIEW AND FINANCIAL ANALYSIS | |
| I.9 |
Table 1.2
Ponce Bank
Historical Income Statements
| For the Year Ended December 31, | For the Twelve Months Ended March 31, |
|||||||||||||||||||||||||||||||||||||||||||||||
| 2012 | 2013 | 2014 | 2015 | 2016 | 2017 | |||||||||||||||||||||||||||||||||||||||||||
| Amount | Pct(1) | Amount | Pct(1) | Amount | Pct(1) | Amount | Pct(1) | Amount | Pct(1) | Amount | Pct(1) | |||||||||||||||||||||||||||||||||||||
| ($000) | (%) | ($000) | (%) | ($000) | (%) | ($000) | (%) | ($000) | (%) | ($000) | (%) | |||||||||||||||||||||||||||||||||||||
| Interest income |
$ | 41,078 | 5.33 | % | $ | 37,162 | 4.98 | % | $ | 35,495 | 4.93 | % | $ | 33,590 | 4.70 | % | $ | 33,741 | 4.65 | % | $ | 33,935 | 4.60 | % | ||||||||||||||||||||||||
| Interest expense |
(9,504 | ) | -1.23 | % | (7,701 | ) | -1.03 | % | (5,730 | ) | -0.80 | % | (5,650 | ) | -0.79 | % | (5,936 | ) | -0.82 | % | (5,998 | ) | -0.81 | % | ||||||||||||||||||||||||
|
|
|
|
|
|
|
|
|
|
|
|
|
|
|
|
|
|
|
|
|
|
|
|
|
|||||||||||||||||||||||||
| Net interest income |
$ | 31,574 | 4.10 | % | $ | 29,461 | 3.95 | % | $ | 29,765 | 4.14 | % | $ | 27,940 | 3.91 | % | $ | 27,805 | 3.83 | % | $ | 27,937 | 3.79 | % | ||||||||||||||||||||||||
| Provision for loan losses |
(5,132 | ) | -0.67 | % | (3,426 | ) | -0.46 | % | (1,183 | ) | -0.16 | % | (353 | ) | -0.05 | % | 57 | 0.01 | % | (542 | ) | -0.07 | % | |||||||||||||||||||||||||
|
|
|
|
|
|
|
|
|
|
|
|
|
|
|
|
|
|
|
|
|
|
|
|
|
|||||||||||||||||||||||||
| Net interest income after provisions |
$ | 26,442 | 3.43 | % | $ | 26,035 | 3.49 | % | $ | 28,582 | 3.97 | % | $ | 27,587 | 3.86 | % | $ | 27,862 | 3.84 | % | $ | 27,395 | 3.71 | % | ||||||||||||||||||||||||
| Non-interest operating income |
$ | 3,042 | 0.39 | % | $ | 3,106 | 0.42 | % | $ | 2,749 | 0.38 | % | $ | 2,462 | 0.34 | % | $ | 2,431 | 0.34 | % | $ | 2,648 | 0.36 | % | ||||||||||||||||||||||||
| Operating expense |
(23,970 | ) | -3.11 | % | (24,671 | ) | -3.31 | % | (25,797 | ) | -3.59 | % | (26,216 | ) | -3.67 | % | (27,863 | ) | -3.84 | % | (28,003 | ) | -3.80 | % | ||||||||||||||||||||||||
|
|
|
|
|
|
|
|
|
|
|
|
|
|
|
|
|
|
|
|
|
|
|
|
|
|||||||||||||||||||||||||
| Net operating income |
$ | 5,514 | 0.72 | % | $ | 4,470 | 0.60 | % | $ | 5,534 | 0.77 | % | $ | 3,833 | 0.54 | % | $ | 2,430 | 0.34 | % | $ | 2,040 | 0.28 | % | ||||||||||||||||||||||||
| Net income before tax |
$ | 5,514 | 0.72 | % | $ | 4,470 | 0.60 | % | $ | 5,534 | 0.77 | % | $ | 3,833 | 0.54 | % | $ | 2,430 | 0.34 | % | $ | 2,040 | 0.28 | % | ||||||||||||||||||||||||
| Income tax provision |
(1,424 | ) | -0.18 | % | (2,015 | ) | -0.27 | % | (2,998 | ) | -0.42 | % | (1,315 | ) | -0.18 | % | (1,005 | ) | -0.14 | % | (860 | ) | -0.12 | % | ||||||||||||||||||||||||
|
|
|
|
|
|
|
|
|
|
|
|
|
|
|
|
|
|
|
|
|
|
|
|
|
|||||||||||||||||||||||||
| Net income (loss) |
$ | 4,090 | 0.53 | % | $ | 2,455 | 0.33 | % | $ | 2,536 | 0.35 | % | $ | 2,518 | 0.35 | % | $ | 1,425 | 0.20 | % | $ | 1,180 | 0.16 | % | ||||||||||||||||||||||||
| Adjusted Earnings |
||||||||||||||||||||||||||||||||||||||||||||||||
| Net income |
$ | 4,090 | 0.53 | % | $ | 2,455 | 0.33 | % | $ | 2,536 | 0.35 | % | $ | 2,518 | 0.35 | % | $ | 1,425 | 0.20 | % | $ | 1,180 | 0.16 | % | ||||||||||||||||||||||||
| Add(Deduct): Non-operating income |
0 | 0.00 | % | 0 | 0.00 | % | 0 | 0.00 | % | 0 | 0.00 | % | 0 | 0.00 | % | 0 | 0.00 | % | ||||||||||||||||||||||||||||||
| Tax effect (2) |
0 | 0.00 | % | 0 | 0.00 | % | 0 | 0.00 | % | 0 | 0.00 | % | 0 | 0.00 | % | 0 | 0.00 | % | ||||||||||||||||||||||||||||||
|
|
|
|
|
|
|
|
|
|
|
|
|
|
|
|
|
|
|
|
|
|
|
|
|
|||||||||||||||||||||||||
| Adjusted earnings |
$ | 4,090 | 0.53 | % | $ | 2,455 | 0.33 | % | $ | 2,536 | 0.35 | % | $ | 2,518 | 0.35 | % | $ | 1,425 | 0.20 | % | $ | 1,180 | 0.16 | % | ||||||||||||||||||||||||
| Expense Coverage Ratio (3) |
1.32x | 1.19x | 1.15x | 1.07x | 1.00x | 1.00x | ||||||||||||||||||||||||||||||||||||||||||
| Efficiency Ratio (4) |
69.27 | % | 75.74 | % | 79.42 | % | 86.35 | % | 92.09 | % | 91.57 | % | ||||||||||||||||||||||||||||||||||||
| (1) | Ratios are as a percent of average assets. |
| (2) | Assumes a 34.0% effective tax rate. |
| (3) | Expense coverage ratio calculated as net interest income before provisions for loan losses divided by operating expenses. |
| (4) | Efficiency ratio calculated as operating expenses divided by the sum of net interest income before provisions for loan losses plus non-interest operating income. |
| Sources: | Ponce Bank’s prospectus, audited & unaudited financial statements, SNL Financial and RP Financial calculations. |
| RP® Financial, LC. | OVERVIEW AND FINANCIAL ANALYSIS | |
| I.10 |
rate paid on more rate sensitive liabilities which had more significant downward repricing earlier in the prevailing interest rate environment. In fact, the Bank’s cost of funds increased slightly during 2016. Partially offsetting decline in yield earned on interest-earning assets during the past two years has been a shift in the Bank’s interest-earning asset composition towards a higher concentration of loans, which earn higher yields relative to investments and short-term liquid funds. Overall, during the past three and one quarter years, the Bank’s interest rate spread ranged declined from a high of 4.26% during 2014 to a low of 3.82% during 2016. For the three months ended March 31, 2017, the Bank’s interest rate spread equaled 3.88% versus an interest rate spread of 4.08% for the year ago quarter. The Bank’s net interest rate spreads and yields and costs for the past five and one-quarter years are set forth in Exhibit I-3 and Exhibit I-5.
Non-interest operating income has been somewhat of a limited contributor to the Bank’s earnings over the past five and one-quarter years, reflecting the Bank’s limited diversification into products and services that generate non-interest operating income. Revenues derived from non-interest income sources is also limited by the relatively high concentration of deposits maintained in CDs, as opposed to fee-based deposit products. Throughout the period shown in Table 1.2, non-interest operating income ranged from a low of $2.4 million or 0.34% of average assets during 2016 to a high of $3.1 million or 0.42% of average assets during 2013. For the twelve months ended March 31, 2017, non-interest operating income amounted to $2.6 million or 0.36% of average assets. Fees and service charges and mortgage banking brokerage commissions constitute the major sources of the Bank’s non-interest operating revenues.
Operating expenses represent the other major component of the Bank’s earnings, ranging from a low of $24.0 million or 3.11% of average assets during 2012 to a high of $28.0 million or 3.80% of average assets during the twelve months ended March 31, 217. The increase in the Bank’s operating expense ratio since 2012 reflects infrastructure that has been put into place to facilitate implementation of the Bank’s strategic plan and, in particular, the additional resources that have been devoted to building the Bank’s full service commercial lending platform.
Overall, during the past five and one-quarter years, the Bank’s expense coverage ratios (net interest income divided by operating expenses) ranged from a low of 1.00x during 2016 and the twelve months ended March 31, 2017 to a high of 1.32x during 2012. Similarly, the Bank’s efficiency ratio (operating expenses as a percent of the sum of net interest income and other
| RP® Financial, LC. | OVERVIEW AND FINANCIAL ANALYSIS | |
| I.11 |
operating income) reflected a downward trend in core earnings, based on efficiency ratios of 69.27% and 92.09% during 2012 and 2016, respectively. For the twelve months ended March 31, 2017, the Bank’s efficiency ratio improved slightly to a ratio of 91.57%.
During the period covered in Table 1.2, the amount of loan loss provisions established ranged from a reversal of loan loss provisions of $57,000 or 0.01% of average assets during 2016 to a high of $5.1 million or 0.67% of average assets during 2012. For the twelve months ended March 31, 2017, the Bank reported loan loss provisions of $542,000 or 0.07% of assets. The reduction in loan loss provisions established from 2012 through 2016 was facilitated by improving credit quality trends, including decreases in the amount of net charge-offs recorded. The increase in loan loss provisions established during the most recent twelve month period was related to loan growth, as opposed to deterioration in credit quality. As of March 31, 2017 the Bank maintained loan loss allowances of $10.4 million, equal to 1.51% of total loans receivable and 134.92% of non-accruing loans. Exhibit I-6 sets forth the Bank’s loan loss allowance activity for the past five and one-quarter years.
Over the past five and one-quarter years, the Bank’s effective tax rate ranged from a low of 25.83% during 2012 to a high of 54.17% during fiscal year 2014 and equaled 42.16% during the twelve months ended March 31, 2017. As set forth in the prospectus, the Bank’s marginal effective tax rate is 34.0%.
Interest Rate Risk Management
The Bank’s balance sheet is liability-sensitive in the short-term (less than one year) and, thus, the net interest margin will typically be adversely affected during periods of rising and higher interest rates. Comparatively, the Bank’s net interest margin benefits from a declining interest rate environment. As interest rates have remained at or near historically low levels for an extended period of time, the Bank has experienced interest spread compression as the average yield earned on interest-earning assets has started to decline more relative to the average rate paid on interest-bearing liabilities. As of March 31, 2017, an analysis of the Bank’s net present value (“NPV”) and net interest income indicated that in the event of an instantaneous parallel 200 basis point increase in interest rates NPV would decrease by 11.26% and net interest income would decrease by 5.18% in year one (see Exhibit I-7).
The Bank pursues a number of strategies to manage interest rate risk, particularly with respect to seeking to limit the repricing mismatch between interest rate sensitive assets and
| RP® Financial, LC. | OVERVIEW AND FINANCIAL ANALYSIS | |
| I.12 |
liabilities. The Bank manages interest rate risk from the asset side of the balance sheet through investing in investment securities with adjustable interest rates, maintaining the investment portfolio as available for sale and emphasizing origination of adjustable rate and shorter term fixed rate loans, for retention in the Bank’s loan portfolio. As of March 31, 2017, of the Bank’s total loans due after March 31, 2018, adjustable rate loans comprised 84.21%% of total loans receivable (see Exhibit I-8). On the liability side of the balance sheet, management of interest rate risk has been pursued through emphasizing growth of lower costing and less interest rate sensitive transaction and savings accounts and seeking to extend CD maturities through offering attractive rates on certain longer term CDs. Transaction and savings account deposits comprised 43.58% of the Bank’s average total deposits during the three months ended March 31, 2017.
The infusion of stock proceeds will serve to further limit the Bank’s interest rate risk exposure, as most of the net proceeds will be redeployed into interest-earning assets and the increase in the Bank’s capital position will lessen the proportion of interest rate sensitive liabilities funding assets.
Lending Activities and Strategy
Historically, Ponce Bank’s lending activities have emphasized 1-4 family permanent mortgage loans and such loans continue to comprise the largest concentration of the Bank’s loan portfolio composition. Pursuant to the Bank’s strategic plan, the Bank is pursuing a diversified lending strategy emphasizing commercial real estate/multi-family loans and commercial business loans as the primary areas of targeted loan growth. Other areas of lending diversification for the Bank include construction and land loans, home equity loans and lines of credit and other consumer loans. Exhibit I-9 provides historical detail of Ponce Bank’s loan portfolio composition for the past five and one-quarter years and Exhibit I-10 provides the contractual maturity of the Bank’s loan portfolio by loan type as of March 31, 2017.
1-4 Family Residential Loans. As a portfolio only lender, Ponce Bank presently only offers adjustable rate 1-4 family permanent mortgage loans. The Bank generally limits owner-occupied 1-4 family loans to loan-to-value (“LTV”) ratio of 80% and investor owned 1-4 family loans to a to LTV ratio of 70% on purchases and 65% on refinances. A minimum debt-coverage ratio of 1.2 times is required for investor owned 1-4 family loans. Adjustable rate loans offered by the Bank generally have repricing terms of one or five years and are indexed to the comparable term Treasury note. As of March 31, 2017, the Bank’s outstanding balance of 1-4 family loans equaled $334.0 million or 48.60% of total loans receivable and consisted of $237.9 million of investor owned loans and $96.1 million of owner occupied loans.
| RP® Financial, LC. | OVERVIEW AND FINANCIAL ANALYSIS | |
| I.13 |
Home Equity Loans and Lines of Credit. Included in the Bank’s 1-4 family loan portfolio are home equity loans and lines of credit, which totaled $10.0 million at March 31, 2017. Home equity loans are originated with comparable terms as 1-4 family permanent mortgage loans. Home equity lines of credit are tied to the prime rate as published in The Wall Street Journal and are offered for terms of up to a five year draw period followed by a 25 year repayment period. The Bank will originate home equity loans and lines of credit up to a maximum LTV ratio of 75%, inclusive of other liens on the property.
Construction Loans. Construction loans originated by the Bank consist primarily of loans to finance the construction of multi-family properties and, to a lesser extent, to finance the construction of commercial properties and 1-4 family residences. Construction loans are generally offered as fixed rate interest only loans during the construction period, which is typically up to 24 months. Construction loans are generally offered up to a maximum LTV ratio of 70% of the appraised value of the completed property. The Bank’s 1-4 family construction lending activities consist of originations to professional developers, contractors and builders, and individuals. As of March 31, 2017, the Bank’s outstanding balance of construction loans equaled $37.6 million or 5.47% of total loans receivable.
Commercial Real Estate and Multi-Family Loans. Commercial real estate and multi-family loans consist largely of loans originated by the Bank, which are collateralized by properties in the Bank’s regional lending area. Ponce Bank generally originates commercial real estate and multi-family loans up to a LTV ratio of 75% and generally requires a minimum debt-coverage ratio of 1.3 times. Commercial real estate and multi-family loans are originated with amortization terms of up to 30 years. Loan terms offered on commercial real estate and multi-family loans generally consist of adjustable rate loans, which are indexed to the corresponding FHLB advance rate of the repricing term. Properties securing the commercial real estate and multi-family loan portfolio include office buildings, industrial and warehouse facilities, retail and wholesale facilities, apartments, churches, restaurants, hotels and motels and service facilities (doctor, dentist, beauty, etc.). As of March 31, 2017, the Bank’s outstanding balance of commercial real estate and multi-family loans totaled $302.3 million equal to 44.00% of total loans outstanding and included $161.8 million of multi-family loans.
| RP® Financial, LC. | OVERVIEW AND FINANCIAL ANALYSIS | |
| I.14 |
Commercial Business Loans. The commercial business loan portfolio is generated through extending loans to businesses operating in the local market area. Expansion of commercial business lending activities is a desired area of loan growth for the Bank, pursuant to which the Bank is seeking to become a full service community bank to its commercial loan customers through offering a full range of commercial loan products that can be packaged with lower cost commercial deposit products. Commercial business loans offered by the Bank consist of lines of credit and term loans, with terms of generally no more than seven years. Commercial business loans are typically indexed to The Wall Street Journal prime rate. The commercial business loan portfolio consists substantially of loans secured by business assets such as accounts receivable, inventory, equipment and real estate. As of March 31, 2017, the Bank’s outstanding balance of commercial business loans equaled $12.4 million or 1.81% of total loans receivable.
Consumer Loans. Consumer lending other than home equity lines of credit has been a limited area of lending diversification for the Bank, with such loans consisting of installment loans and loans secured by savings accounts or CDs. As of March 31, 2017, the Bank held $796,000 of consumer loans or 0.12% of total loans receivable.
Exhibit I-11 provides a summary of the Bank’s lending activities over the past five and one-quarter years. Total loans originated ranged from a low of $76.9 million during 2012 to a high of $162.8 million during 2016. Loan originated for the three months ended March 31, 2017 totaled $74.8 million, which was well above the $41.2 million of loans originated during the year ago quarter. The increase in loans originated was primarily driven by increased originations of 1-4 family loans, multi-family loans and commercial real estate loans. The Bank was not active in purchasing or selling loans over the past five and one-quarter years, with the exception of selling $838,000 of multi-family loans during 2014 and in 2012 the Bank sold loans totaling $2.4 million consisting of 1-4 family loans, multi-family loans and construction and land loans. Following three years of decline from 2012 through 2014, the Bank’s net loan activity showed increases of $24.4 million in 2015, $75.0 million in 2016 and $35.5 million during the three months ended March 31, 2017.
Asset Quality
Historically, the Bank’s lending emphasis on lending in local and familiar markets generally supported maintenance of relatively favorable credit quality measures. However, following the national recession and bursting of the housing bubble in 2008, the Bank
| RP® Financial, LC. | OVERVIEW AND FINANCIAL ANALYSIS | |
| I.15 |
experienced elevated levels of problems assets. In recent years, the Bank has taken proactive measures to address credit quality deterioration and significantly reduce the balance of non-performing balance assets from peak levels. Over the past five and one-quarter years, Ponce Bank’s balance of non-performing assets ranged from a high of $62.8 million or 8.25% of assets at yearend 2012 to a low of $7.7 million or 0.98% of assets at March 31, 2017. As shown in Exhibit I-12, non-performing assets at March 31, 2016 consisted of $7.7 million of non-accruing loans. Non-accruing loans held by the Bank at March 31, 2017 were primarily concentrated in 1-4 family permanent mortgage loans totaling $4.2 million.
To track the Bank’s asset quality and the adequacy of valuation allowances, the Bank has established detailed asset classification policies and procedures which are consistent with regulatory guidelines. Classified assets are reviewed monthly by senior management and quarterly by the Board. Pursuant to these procedures, when needed, the Bank establishes additional valuation allowances to cover anticipated losses in classified or non-classified assets. As of March 31, 2017, the Bank maintained loan loss allowances of $10.4 million, equal to 1.51% of total loans receivable and 134.92% of non-performing loans.
Funding Composition and Strategy
Deposits have consistently served as the Bank’s primary funding source and at March 31, 2017 deposits accounted for 95.91% of Ponce Bank’s combined balance of deposits and borrowings. Exhibit I-13 sets forth the Bank’s deposit composition for the past three and one-quarter years and Exhibit I-14 provides the interest rate and maturity composition of the CD portfolio at March 31, 2017. CDs constitute the largest component of the Bank’s deposit composition; although, the concentration of CDs comprising total deposits has declined slightly during the past three years, as the result of growth of transaction and savings account deposits and a decrease in CDs. For the three months ended March 31, 2017, the balance of CDs averaged $362.5 million or 56.42% of average deposits, versus comparable measures of $379.9 million and 62.07% of average deposits for 2014. CDs with scheduled maturities of one year or less comprised 43.16% of the Bank’s CDs at March 31, 2017. As of March 31, 2017, jumbo CDs (CD accounts with balances of $100,000 or more) amounted to $232.2 million or 63.54% of total CDs. The Bank did not maintain any brokered deposit as of March 31, 2017.
Transaction and savings account deposits comprised 43.58% of average total deposits during the three months ended March 31, 2017, as compared to 37.93% of average total deposits during 2014. Savings account deposits comprised the largest concentration of the Banks core deposits during the three months ended March 31, 2017, averaging $128.9 million or 46.02% of average core deposits.
| RP® Financial, LC. | OVERVIEW AND FINANCIAL ANALYSIS | |
| I.16 |
Borrowings serve as an alternative funding source for the Bank to facilitate management of funding costs and interest rate risk Borrowings totaled $28.0 million at March 31, 2017 and consisted entirely of FHLB advances on an overnight line of credit basis. At March 31, 2017, the FHLB advances had a weighted average interest rate of 1.04%. Exhibit I-15 provides further detail of the Bank’s borrowings activities during the past three and one-quarter years.
Subsidiary Activities
Ponce Bank maintains two wholly-owned subsidiaries: PFS Service Corp, which owns two the Bank’s properties, and Ponce de Leon Mortgage Corp., which is a mortgage banking entity.
Legal Proceedings
The Bank is not currently party to any pending legal proceedings that the Bank’s management believes would have a material adverse effect on the Bank’s financial condition, results of operations or cash flows.
| RP® Financial, LC. | MARKET AREA | |
| II.1 |
II. MARKET AREA
Introduction
Headquartered in Bronx, New York, Ponce Bank serves the New York metropolitan area through its headquarters office and 13 full service branch offices The Bank’s branch network covers a four-county market area in New York: Bronx County (4 branches), Queens County (3 branches), Kings County (3 branches) and New York County (2 branches). Ponce Bank also maintains one branch location in Hudson County, New Jersey. Exhibit II-1 provides information on the Bank’s office facilities.
With operations in a major metropolitan area, the Bank’s competitive environment includes a significant number of commercial banks, thrifts and other financial services companies, some of which have a regional or national presence. These institutions also have greater resources at their disposal than the Bank. The New York metropolitan area has a highly developed economy, with a relatively high concentration of highly skilled workers who are employed in a number of different industry clusters including financial services, healthcare and technology.
Future growth opportunities for Ponce Bank depend on the future growth and stability of the local and regional economy, demographic growth trends, and the nature and intensity of the competitive environment. These factors have been briefly examined to help determine the growth potential that exists for the Bank, the relative economic health of the Bank’s market area, and the resultant impact on value.
National Economic Factors
The future success of the Bank’s operations is partially dependent upon various national and local economic trends. In assessing national economic trends over the past few quarters, manufacturing activity picked up slightly in October 2016 with an index reading of 51.9. Comparatively, service sector activity for October expanded at a slower rate with an index reading of 54.8. Employers added 161,000 jobs in October and the unemployment rate for October ticked down to 4.9%, which was due to a decline in the number of people participating in the workforce. Notably, wage gains for October were the strongest since 2009 and, thereby, keeping the Federal Reserve on a pace for a December rate hike. Housing starts jumped 25.5% in October, while existing home sales for October climbed 2.0%. Comparatively, new
| RP® Financial, LC. | MARKET AREA | |
| II.2 |
home sales declined 1.9% in October and October pending home sales increased 0.1%. U.S. employers added 178,000 jobs in November and the November unemployment rate fell to a nine-year low of 4.6%. Manufacturing and service sector activity accelerated in November, with respective readings of 53.2 and 57.2. Following a strong October, housing starts declined 18.7% in November. However, existing home sales were up for the third straight month in November, increasing 0.7% which was the highest sales pace since February 2007. Sales of new homes for November showed a healthy increase of 5.2%, while November pending home sales declined 2.5%. Manufacturing activity for December rose to 54.7, hitting its highest level since December 2014, and December service sector activity held steady with a reading of 57.2. The U.S. economy added 156,000 jobs in December and the December unemployment rate ticked up to 4.7%. The pace of home sales slowed in December, as existing home sales for sales decreased 2.8% compared to November. New home sales plunged 10.4% in December compared to the prior month, which was viewed as an indication that affordability challenges were beginning to cut into demand. However, December pending home sales increased 1.6% compared to November. Fourth quarter GDP increased at a 1.9% annual rate (subsequently revised to 2.1%).
Job growth for the first month of 2017 was stronger than expected, as U.S. employers added 227,000 in January 2017. However, the January 2017 unemployment rate for the U.S. edged up to 4.8%, due to more Americans actively seeking employment. Manufacturing activity for January accelerated with a reading of 56.0, while January service sector activity grew at a slightly slower pace with a reading of 56.5. Retail sales for January showed a healthy 0.4% increase from December. Housing starts for January declined 2.6%, which was due to a drop in multi-family construction. Comparatively, January existing home sales increased 3.3%, which was the fastest pace for existing home sales since February 2007. Economic activity in the manufacturing sector expanded in February to a reading of 57.7, while February service sector activity also increased to a reading of 57.6. The U.S. economy added 235,000 jobs in February and the February unemployment rate ticked down to 4.7%. Retail sales for February showed a modest increase of 0.1%. Data for February home sales was mixed, as February new home sales increased 6.1% and February pending home sales jumped 5.5%. Comparatively, February existing homes declined 3.7%. Manufacturing and service sector activity expanded at slightly lower rates with respective readings of 57.2 and 55.2. Job growth for March was less than expected, as U.S. employers added only 98,000 jobs in March. The March unemployment rate edged down to 4.5%. Existing home sales for March rebounded with a.4.4% increase in
| RP® Financial, LC. | MARKET AREA | |
| II.3 |
sales, which was the strongest month of sales since February 2007. March new home sales also showed a healthy increase of 5.8%, while pending home sales for March slipped 0.8%. The decrease in March pending home sales was attributable to a low inventory of listings in the affordable price range. First quarter GDP increased at an annual rate of 0.7%, which was the slowest growth since the first quarter of 2014. Manufacturing activity eased in April, with an index reading of 54.8, while April service sector activity accelerated an index reading of 57.5. The U.S. economy added 211,000 jobs in April and the unemployment rate for April fell to 4.4%, which was the lowest unemployment rate since May 2007.
In terms of interest rates trends over the past few quarters, stronger readings for September manufacturing and service sector activity helped to push the 10-year Treasury yield above 1.70% in mid-October 2016. Long-term Treasury yields continued to edge higher going into late-October, as signs of inflation ticking up pushed the 10-year Treasury yield to its highest level in four months. The Federal Reserve concluded its early-November policy meeting leaving interest rates unchanged, but noted that inflation had increased somewhat and left the door open for a rate increase in December. Interest rates stabilized ahead of the Presidential election and then surged higher following the election, based on expectations that there would be an increase in government spending and a pick-up in inflation under the Trump administration. The upward trend in long-term Treasury yields continued through the end of November and into December, in which the 10-year Treasury yield rose to a 17-month high of 2.44% on December 1, 2016. Treasury prices continued to slide lower through mid-December, as the Federal Reserve concluded its two-day policy meeting raising its target interest rate by 0.25% and signaled interest rates would rise faster than previously projected based on growing optimism about the strength of the U.S. economy. After hitting a mid-December high of 2.60%, the yield on the 10-year Treasury eased lower in the closing weeks of 2016.
Long-term Treasury yields edged lower during the first half of January 2017, as the December employment report showed weaker than expected job growth. Treasury yields reversed course in the second half of January, with renewed optimism about the U.S. economy prompting investors to buy stocks and lighten up on their holdings of safer assets such as Treasury bonds. At the start of February, the Federal Reserve concluded its two-day policy meeting with no change in its target interest rate and indicated it remained on track to gradually raise short-term interest rates this year. Long-term Treasury yields edged lower following the release of the January jobs report. Interest rates edged higher going into the second half of February, as increases in retail sales, factory output and inflation pointed to a healthy start in
| RP® Financial, LC. | MARKET AREA | |
| II.4 |
2017 for the U.S. economy. Growing expectations for higher interest rates pushed Treasury yields higher in early-March, as the Federal Reserve Chairwoman signaled that the Federal Reserve was on course to raise short-term interest rates in the near future. The 10-year Treasury yield closed at 2.61% ahead of the mid-March meeting of the Federal Reserve, which was its highest yield in over two years. The Federal Reserve concluded its mid-March meeting by raising the federal funds rate by a quarter point to a range between 0.75% and 1% and signaled that additional gradual rate increases were ahead. Following the Federal Reserve meeting, long-term Treasury yields trended lower during the second half of March.
The rally in Treasury bonds continued during the first half of April 2017, with the 10-year Treasury yield declining to a low of 2.18%. Disappointing job growth reflected in the March employment data and investors moving into safe haven assets on news of the U.S. dropping a bomb on an Islamic State target in Afghanistan were noted factors contributing the rally in Treasury bonds. Long-term Treasury yields edged up slightly during the second of half of April and into the first week of May. The Federal Reserve concluded its two-day policy meeting in early-May voting to hold its benchmark rate steady. As of May 5, 2017, the bond equivalent yields for U.S. Treasury bonds with terms of one and ten years equaled 1.10% and 2.36%, respectively, versus comparable year ago yields of 0.51% and 1.76%. Exhibit II-2 provides historical interest rate trends.
Based on the consensus outlook of economists surveyed by The Wall Street Journal in April 2017, GDP growth was projected to increase to 2.3% in 2017. The unemployment rate was forecasted to equal 4.6% in June 2017 and then decline slightly to equal 4.4% in December 2017. An average of 169,000 jobs were projected to be added per month during 2017. On average, the economists forecasted an increase in the federal funds rate to 1.07% in June 2017 and to 1.41% in December 2017. On average, the economists forecasted that the 10-year Treasury yield would increase to 2.59% in June 2017 and increase to 2.84% by the end of 2017. The surveyed economists also forecasted home prices would rise 4.8% in 2017 and housing starts were forecasted to continue to trend slightly higher in 2017.
The April 2017 mortgage finance forecast from the Mortgage Bankers Association (the “MBA”) was for 2017 existing home sales to increase by 5.7% from 2016 sales and new home sales were forecasted to increase by 11.8% in 2017 from sales in 2016. The 2017 median sale prices for new and existing homes were forecasted to increase by 4.2% and 0.8%, respectively. Total mortgage production was forecasted to decline in 2017 to $1.592 trillion, compared to
| RP® Financial, LC. | MARKET AREA | |
| II.5 |
$1.891 trillion in 2016. The forecasted decrease in 2017 originations was based on a 9.2% increase in purchase volume and a 43.3% decrease in refinancing volume. Purchase mortgage originations were forecasted to total $1.081 trillion in 2017, versus refinancing volume totaling $511 billion. Housing starts for 2017 were projected to increase by 8.2% to total $1.273 million.
Market Area Demographics
Demographic and economic growth trends, measured by changes in population, number of households, age distribution and median household income, provide key insight into the health of the market area served by Ponce Bank (see Table 2.1). The primary market area counties are densely populated markets, ranking among the largest populations in New Jersey and New York. Kings County (Brooklyn) has the largest population among the four primary market area counties and is the largest county in New York, followed by Queens County and New York County as the second and third largest counties in New York. Bronx County is the fifth largest county in New York and Hudson County is the fifth largest county in New Jersey. Four out of the five primary market area counties served by Ponce Bank experienced relatively strong growth during the 2010 to 2017 period, as New York County was the only county that lagged the comparable U.S. population and household growth rates. All five of the primary market area counties posted stronger population and household growth rates compared to the state of New York. Population and household growth rates for the primary market area counties are projected to slow slightly over the next five years and, therefore, be more comparable to the projected U.S. population and household growth rates.
Age distribution measures reflect that the primary market area counties has a somewhat similarly-aged population relative to the state of New York and the U.S.
Income measures show New York County is a relatively affluent market. Comparatively, income measures for Bronx County, which has a relatively broad socioeconomic spectrum, were well below the comparable state measures as well as the other four primary market area counties. Projected income growth rates for the primary market area counties were generally fairly consistent with the projected income growth rates for New Jersey, New York and the U.S, with the highest income growth rates projected for Kings County and the lowest income growth rates projected for Bronx County.
| RP® Financial, LC. | MARKET AREA | |
| II.6 |
Table 2.1
Ponce Bank
Summary Demographic Data
| Year | Growth Rate | |||||||||||||||||||
| 2010 | 2017 | 2022 | 2010-2017 | 2017-2022 | ||||||||||||||||
| (%) | (%) | |||||||||||||||||||
| Population (000) |
||||||||||||||||||||
| USA |
308,746 | 325,139 | 337,393 | 0.7 | % | 0.7 | % | |||||||||||||
| New York |
19,378 | 19,892 | 20,287 | 0.4 | % | 0.4 | % | |||||||||||||
| Bronx, NY |
1,385 | 1,476 | 1,535 | 0.9 | % | 0.8 | % | |||||||||||||
| Kings, NY |
2,505 | 2,668 | 2,768 | 0.9 | % | 0.7 | % | |||||||||||||
| New York, NY |
1,586 | 1,657 | 1,703 | 0.6 | % | 0.6 | % | |||||||||||||
| Queens, NY |
2,231 | 2,368 | 2,455 | 0.9 | % | 0.7 | % | |||||||||||||
| Hudson, NJ |
634 | 684 | 713 | 1.1 | % | 0.8 | % | |||||||||||||
| Households (000) |
||||||||||||||||||||
| USA |
116,716 | 123,357 | 128,247 | 0.8 | % | 0.8 | % | |||||||||||||
| New York |
7,318 | 7,568 | 7,745 | 0.5 | % | 0.5 | % | |||||||||||||
| Bronx, NY |
483 | 518 | 539 | 1.0 | % | 0.8 | % | |||||||||||||
| Kings, NY |
917 | 988 | 1,030 | 1.1 | % | 0.8 | % | |||||||||||||
| New York, NY |
764 | 802 | 827 | 0.7 | % | 0.6 | % | |||||||||||||
| Queens, NY |
780 | 828 | 858 | 0.9 | % | 0.7 | % | |||||||||||||
| Hudson, NJ |
246 | 269 | 282 | 1.3 | % | 0.9 | % | |||||||||||||
| Median Household Income ($) |
||||||||||||||||||||
| USA |
NA | 57,462 | 61,642 | NA | 1.4 | % | ||||||||||||||
| New York |
NA | 62,222 | 65,981 | NA | 1.2 | % | ||||||||||||||
| Bronx, NY |
NA | 34,959 | 36,302 | NA | 0.8 | % | ||||||||||||||
| Kings, NY |
NA | 50,530 | 55,811 | NA | 2.0 | % | ||||||||||||||
| New York, NY |
NA | 77,932 | 83,752 | NA | 1.5 | % | ||||||||||||||
| Queens, NY |
NA | 60,760 | 64,427 | NA | 1.2 | % | ||||||||||||||
| Hudson, NJ |
NA | 62,864 | 67,490 | NA | 1.4 | % | ||||||||||||||
| Per Capita Income ($) |
||||||||||||||||||||
| USA |
NA | 31,459 | 34,068 | NA | 1.6 | % | ||||||||||||||
| New York |
NA | 35,725 | 38,286 | NA | 1.4 | % | ||||||||||||||
| Bronx, NY |
NA | 18,469 | 19,260 | NA | 0.8 | % | ||||||||||||||
| Kings, NY |
NA | 28,958 | 32,012 | NA | 2.0 | % | ||||||||||||||
| New York, NY |
NA | 67,621 | 71,740 | NA | 1.2 | % | ||||||||||||||
| Queens, NY |
NA | 28,283 | 30,311 | NA | 1.4 | % | ||||||||||||||
| Hudson, NJ |
NA | 36,657 | 39,939 | NA | 1.7 | % | ||||||||||||||
| 2017 Age Distribution (%) |
0-14 Yrs. | 15-34 Yrs. | 35-54 Yrs. | 55-69 Yrs. | 70+ Yrs. | |||||||||||||||
| USA |
18.8 | 27.1 | 25.7 | 18.1 | 10.3 | |||||||||||||||
| New York |
17.6 | 27.6 | 26.1 | 18.2 | 10.5 | |||||||||||||||
| Bronx, NY |
21.3 | 30.1 | 25.8 | 14.8 | 8.0 | |||||||||||||||
| Kings, NY |
20.2 | 29.5 | 26.3 | 15.4 | 8.5 | |||||||||||||||
| New York, NY |
13.2 | 32.4 | 27.8 | 16.3 | 10.3 | |||||||||||||||
| Queens, NY |
17.3 | 27.1 | 28.3 | 17.6 | 9.7 | |||||||||||||||
| Hudson, NJ |
17.9 | 31.1 | 28.5 | 14.8 | 7.6 | |||||||||||||||
| 2017 HH Income Dist. (%) |
Less Than 25,000 |
$25,000 to 50,000 |
$50,000 to 100,000 |
$100,000+ | ||||||||||||
| USA |
21.9 | 22.9 | 29.5 | 25.7 | ||||||||||||
| New York |
22.1 | 20.2 | 27.6 | 30.1 | ||||||||||||
| Bronx, NY |
39.2 | 24.4 | 23.6 | 12.8 | ||||||||||||
| Kings, NY |
28.2 | 21.4 | 25.9 | 24.4 | ||||||||||||
| New York, NY |
22.4 | 14.7 | 21.5 | 41.4 | ||||||||||||
| Queens, NY |
21.4 | 21.1 | 30.3 | 27.2 | ||||||||||||
| Hudson, NJ |
22.6 | 19.4 | 27.2 | 30.9 | ||||||||||||
| Source: | SNL Financial |
| RP® Financial, LC. | MARKET AREA | |
| II.7 |
The relative affluence of New York County is further evidenced by a comparison of household income distribution measures, as New York County maintains a much higher percentage of households with incomes over $100,000 relative to the U.S and New York. Comparatively, Bronx County maintains a relatively high percentage of households with incomes of less than $25,000 and a relatively low percentage of households with income over $100,000.
Local Economy
The markets served by the Bank have large and diverse economies. Comparative employment data in Table 2.2 shows that employment in services constitutes the primary source of employment in all of the primary area counties with the exception of Bronx County. Jobs in the education/healthcare/social services sector was the largest source of employment in Bronx County, as well as the state of New York, and was the second largest employment sector in the other four primary market area counties. Service jobs were the second largest source of jobs for Bronx County and the state of New York. The prominence of Wall Street jobs on the New York County economy is highlighted by the County’s relatively high concentration of jobs in finance/insurance/real estate sector, while wholesale/retail jobs were the third largest employment sector for the other primary market area counties and the state of New York.
Table 2.2
Ponce Bank
Primary Market Area Employment Sectors
(Percent of Labor Force)
| Employment Sector |
New York | Bronx New York |
Kings New York |
New York New York |
Queens New York |
Hudson New Jersey |
||||||||||||||||||
| (%) | (%) | (%) | (%) | (%) | (%) | |||||||||||||||||||
| Services |
26.5 | % | 27.1 | % | 29.5 | % | 35.1 | % | 30.0 | % | 28.3 | % | ||||||||||||
| Education,Healthcare, Soc. Serv. |
27.4 | % | 32.3 | % | 28.7 | % | 22.7 | % | 23.8 | % | 20.1 | % | ||||||||||||
| Wholesale/Retail Trade |
13.1 | % | 13.1 | % | 11.5 | % | 9.8 | % | 12.5 | % | 14.0 | % | ||||||||||||
| Manufacturing |
6.1 | % | 3.7 | % | 3.4 | % | 2.7 | % | 4.0 | % | 6.8 | % | ||||||||||||
| Construction |
5.6 | % | 5.4 | % | 4.9 | % | 1.9 | % | 7.0 | % | 5.5 | % | ||||||||||||
| Finance/Insurance/Real Estate |
7.9 | % | 6.4 | % | 7.3 | % | 15.8 | % | 7.6 | % | 11.2 | % | ||||||||||||
| Transportation/Utility |
5.4 | % | 7.0 | % | 6.5 | % | 3.1 | % | 8.3 | % | 7.7 | % | ||||||||||||
| Government |
4.4 | % | 3.1 | % | 3.7 | % | 2.5 | % | 4.2 | % | 2.9 | % | ||||||||||||
| Information |
3.0 | % | 1.7 | % | 4.3 | % | 6.4 | % | 2.5 | % | 3.4 | % | ||||||||||||
| Agriculture |
0.6 | % | 0.1 | % | 0.1 | % | 0.0 | % | 0.2 | % | 0.0 | % | ||||||||||||
|
|
|
|
|
|
|
|
|
|
|
|
|
|||||||||||||
| 100.0 | % | 100.0 | % | 100.0 | % | 100.0 | % | 100.0 | % | 100.0 | % | |||||||||||||
Source: U.S. Census Bureau
| RP® Financial, LC. | MARKET AREA | |
| II.8 |
The market area served by the Bank, characterized primarily as the New York MSA, has a highly developed and diverse economy, Healthcare, transportation, education and banking companies or institutions constitute major sources of employment in the Bank’s market area. Tourism also is a prominent component of the market area’s economy, as New York City annually ranks as one of the nation’s top tourist destinations. Table 2.3 lists in detail the major employers in the New York metropolitan area.
Table 2.3
Ponce Bank
Market Area Largest Employers
| Employer |
Industry | |
| American Airlines | Transportation | |
| Columbia University | Education | |
| JPMorgan Chase | Banking | |
| Memorial Sloan Kettering Cancer Center | Healthcare | |
| Morgan Stanley Children’s Hospitay | Healthcare | |
| Mount Sinai Hospital | Healthcare | |
| New York-Presbyterian Hospital | Healthcare | |
| Nielsen Company | Marketing | |
| Northwell Health, Inc. | Healthcare | |
| Verizion | Telecom | |
| Source: | Division of Research & Statistics Analysis of InfoUSA ARC employer database and publicly available Information |
Unemployment Trends
Comparative unemployment rates for the primary market area counties, as well as for the U.S, and New York, are shown in Table 2.4. March 2017 unemployment rates for the primary market area counties ranged from a low of 3.6% for New York County and Queens County to a high of 5.7% for Bronx County. With the exception of Bronx County, March 2017 unemployment rates for the primary market counties were lower than the comparable U.S. and New York unemployment rates of 4.5% and 4.3%, respectively. Consistent with the national trend, all of the primary market area counties and the state of New York reported lower unemployment rates for March 2017 compared to a year ago.
| RP® Financial, LC. | MARKET AREA | |
| II.9 |
Table 2.4
Ponce Bank
Unemployment Trends
| Unemployment Rate | Net | |||||||||||
| Region |
March 2016 | March 2017 | Change | |||||||||
| USA |
5.0 | % | 4.5 | % | -0.5 | % | ||||||
| New York |
4.8 | % | 4.3 | % | -0.5 | % | ||||||
| Bronx, NY |
7.4 | % | 5.7 | % | -1.7 | % | ||||||
| Kings, NY |
5.5 | % | 4.2 | % | -1.3 | % | ||||||
| New York, NY |
4.7 | % | 3.6 | % | -1.1 | % | ||||||
| Queens, NY |
4.7 | % | 3.6 | % | -1.1 | % | ||||||
| Hudson, NJ |
4.9 | % | 3.9 | % | -1.0 | % | ||||||
| Source: | SNL Financial, LC. |
Market Area Deposit Characteristics and Competition
The Bank’s retail deposit base is closely tied to the New York metropolitan market area and, in particular, to the markets that are nearby to the Bank’s branch locations. Table 2.5 displays deposit market trends from June 30, 2012 through June 30, 2016 for the primary market counties. Additional data is also presented for the state of New York. The data indicates that commercial banks gained or maintained deposit market share in all five of the primary market area counties during the four year period covered in Table 2.5. Similar to the states of New York, commercial banks maintained a larger market share of deposits than savings institutions in all five of the Bank’s primary market area counties.
Ponce Bank’s largest holding and highest market share of deposits is in Bronx County, where the Bank is headquartered and maintains its largest branch presence. The Bank’s $232.2 million of deposits at the Bronx County branches represented a 1.9% market share of bank and thrift deposits at June 30, 2016. The Bank’s deposit market share in the remaining four counties was nominal, based on deposit market shares of 0.3% or less in those four counties.
| RP® Financial, LC. | MARKET AREA | |
| II.10 |
Table 2.5
Ponce Bank
Deposit Summary
| As of June 30, | ||||||||||||||||||||||||||||
| 2012 | 2016 | Deposit | ||||||||||||||||||||||||||
| Deposits | Market Share |
No. of Branches |
Deposits | Market Share |
No. of Branches |
Growth Rate 2012-2016 |
||||||||||||||||||||||
| (Dollars in Thousands) | (%) | |||||||||||||||||||||||||||
| New York |
$ | 1,043,365,000 | 100.0 | % | 5,433 | $ | 1,496,993,000 | 100.0 | % | 5,167 | 9.4 | % | ||||||||||||||||
| Commercial Banks |
969,334,000 | 92.9 | % | 4,484 | 1,426,672,000 | 95.3 | % | 4,406 | 10.1 | % | ||||||||||||||||||
| Savings Institutions |
74,031,000 | 7.1 | % | 949 | 70,321,000 | 4.7 | % | 761 | -1.3 | % | ||||||||||||||||||
| Bronx |
$ | 10,422,908 | 100.0 | % | 150 | $ | 11,935,315 | 100.0 | % | 149 | 3.4 | % | ||||||||||||||||
| Commercial Banks |
8,516,218 | 81.7 | % | 123 | 10,112,143 | 84.7 | % | 123 | 4.4 | % | ||||||||||||||||||
| Savings Institutions |
1,906,690 | 18.3 | % | 27 | 1,823,172 | 15.3 | % | 26 | -1.1 | % | ||||||||||||||||||
| Ponce Bank |
266,474 | 2.6 | % | 4 | 232,186 | 1.9 | % | 4 | -3.4 | % | ||||||||||||||||||
| Kings |
$ | 37,603,197 | 100.0 | % | 358 | $ | 50,596,933 | 100.0 | % | 370 | 7.7 | % | ||||||||||||||||
| Commercial Banks |
31,438,290 | 83.6 | % | 276 | 43,203,681 | 85.4 | % | 284 | 8.3 | % | ||||||||||||||||||
| Savings Institutions |
6,164,907 | 16.4 | % | 82 | 7,393,252 | 14.6 | % | 86 | 4.6 | % | ||||||||||||||||||
| Ponce Bank |
125,298 | 0.3 | % | 3 | 107,791 | 0.2 | % | 3 | -3.7 | % | ||||||||||||||||||
| New York |
$ | 682,762,089 | 100.0 | % | 689 | $ | 1,025,152,281 | 100.0 | % | 690 | 10.7 | % | ||||||||||||||||
| Commercial Banks |
677,597,223 | 99.2 | % | 649 | 1,019,350,801 | 99.4 | % | 650 | 10.7 | % | ||||||||||||||||||
| Savings Institutions |
5,164,866 | 0.8 | % | 40 | 5,801,480 | 0.6 | % | 40 | 2.9 | % | ||||||||||||||||||
| Ponce Bank |
59,844 | 0.0 | % | 1 | 63,792 | 0.0 | % | 2 | 1.6 | % | ||||||||||||||||||
| Queens |
$ | 43,546,874 | 100.0 | % | 451 | $ | 59,702,067 | 100.0 | % | 437 | 8.2 | % | ||||||||||||||||
| Commercial Banks |
32,234,175 | 74.0 | % | 334 | 44,521,594 | 74.6 | % | 320 | 8.4 | % | ||||||||||||||||||
| Savings Institutions |
11,312,699 | 26.0 | % | 117 | 15,180,473 | 25.4 | % | 117 | 7.6 | % | ||||||||||||||||||
| Ponce Bank |
181,006 | 0.4 | % | 3 | 191,836 | 0.3 | % | 3 | 1.5 | % | ||||||||||||||||||
| Hudson, NJ |
$ | 26,423,125 | 100.0 | % | 177 | $ | 29,643,052 | 100.0 | % | 166 | 2.9 | % | ||||||||||||||||
| Commercial Banks |
23,201,789 | 87.8 | % | 134 | 26,782,392 | 90.3 | % | 128 | 3.7 | % | ||||||||||||||||||
| Savings Institutions |
3,221,336 | 12.2 | % | 43 | 2,860,660 | 9.7 | % | 38 | -2.9 | % | ||||||||||||||||||
| Ponce Bank |
44,476 | 0.2 | % | 1 | 36,833 | 0.1 | % | 1 | -4.6 | % | ||||||||||||||||||
| Source: | FDIC. |
As implied by the Bank’s low market shares of deposits, the Bank faces significant competition. Among the Bank’s competitors are much larger and more diversified institutions, which have greater resources than maintained by Ponce Bank. Financial institution competitors in the Bank’s primary market area include other locally based thrifts and banks, as well as regional, super regional and money center banks. Table 2.6 lists the Bank’s largest competitors in the five counties currently served by its branches, based on deposit market share.
| RP® Financial, LC. | MARKET AREA | |
| II.11 |
Table 2.6
Ponce Bank
Market Area Deposit Competitors - As of June 30, 2016
| Location |
Name |
Market Share |
Rank | |||||||
| (%) | ||||||||||
| Bronx County |
JPMorgan Chase & Co. (NY) | 35.00 | ||||||||
| Citigroup Inc. (NY) | 18.33 | |||||||||
| Apple Financial Holding Inc. (NY) | 9.12 | |||||||||
| Capital One Financial Corp. (VA) | 7.00 | |||||||||
| Bank of America Corp. (NC) | 5.19 | |||||||||
| Ponce Bank | 1.95 | 10 of 23 | ||||||||
| Kings County |
JPMorgan Chase & Co. (NY) | 28.89 | ||||||||
| Banco Santander | 11.95 | |||||||||
| Citigroup Inc. (NY) | 11.72 | |||||||||
| Toronto-Dominion Bank | 6.56 | |||||||||
| Capital One Financial Corp. (VA) | 6.19 | |||||||||
| Ponce Bank | 0.21 | 27 of 41 | ||||||||
| New York County |
JPMorgan Chase & Co. (NY) | 46.14 | ||||||||
| Bank of New York Mellon Corp. (NY) | 12.87 | |||||||||
| HSBC Holdings | 10.37 | |||||||||
| Citigroup Inc. (NY) | 7.63 | |||||||||
| Bank of America Corp. (NC) | 6.20 | |||||||||
| Ponce Bank | 0.01 | 71 of 90 | ||||||||
| Queens County |
JPMorgan Chase & Co. (NY) | 23.09 | ||||||||
| Citigroup Inc. (NY) | 13.57 | |||||||||
| New York Community Bancorp (NY) | 11.90 | |||||||||
| Capital One Financial Corp. (VA) | 8.82 | |||||||||
| Toronto-Dominion Bank | 6.04 | |||||||||
| Ponce Bank | 0.32 | 32 of 54 | ||||||||
| Hudson County |
Bank of America Corp. (NC) | 52.86 | ||||||||
| JPMorgan Chase & Co. (NY) | 5.59 | |||||||||
| Capital One Financial Corp. (VA) | 5.12 | |||||||||
| Banco Santander | 4.91 | |||||||||
| Toronto-Dominion Bank | 4.04 | |||||||||
| Ponce Bank | 0.12 | 24 of 31 | ||||||||
| Source: | SNL Financial, LC. |
| RP® Financial, LC. | PEER GROUP ANALYSIS | |
| III.1 |
III. PEER GROUP ANALYSIS
This chapter presents an analysis of Ponce Bank’s operations versus a group of comparable savings institutions (the “Peer Group”) selected from the universe of all publicly-traded savings institutions in a manner consistent with the regulatory valuation guidelines. The basis of the pro forma market valuation of Ponce Bank is derived from the pricing ratios of the Peer Group institutions, incorporating valuation adjustments for key differences in relation to the Peer Group. Since no Peer Group can be exactly comparable to Ponce Bank, key areas examined for differences are: financial condition; profitability, growth and viability of earnings; asset growth; primary market area; dividends; liquidity of the shares; marketing of the issue; management; and effect of government regulations and regulatory reform.
Peer Group Selection
The Peer Group selection process is governed by the general parameters set forth in the regulatory valuation guidelines. Accordingly, the Peer Group is comprised of only those publicly-traded savings institutions whose common stock is either listed on the NYSE or NASDAQ, since their stock trading activity is regularly reported and generally more frequent than non-publicly traded and closely-held institutions. Institutions that are not listed on the NYSE or NASDAQ are inappropriate, since the trading activity for thinly-traded or closely-held stocks are typically highly irregular in terms of frequency and price and thus may not be a reliable indicator of market value. We have also excluded from the Peer Group those companies under acquisition or subject to rumored acquisition and recent conversions, since their pricing ratios are subject to unusual distortion and/or have limited trading history. A recent listing of the universe of all publicly-traded savings institutions is included as Exhibit III-1.
Ideally, the Peer Group, which must have at least 10 members to comply with the regulatory valuation guidelines, should be comprised of publicly-traded MHCs with comparable resources, strategies and financial characteristics as Ponce Bank. However, there are currently only eight publicly-traded MHCs. Accordingly, in deriving a Peer Group comprised of institutions with relatively comparable characteristics as Ponce Bank, the companies selected for Ponce Bank’s Peer Group are all fully-converted companies. The valuation adjustments applied in the Chapter IV analysis will take into consideration differences between the Bank’s MHC form of ownership relative to the fully-converted Peer Group companies. Also included in Chapter IV is a pricing analysis of the publicly-traded MHCs on a fully-converted basis.
| RP® Financial, LC. | PEER GROUP ANALYSIS | |
| III.2 |
From the universe of publicly-traded thrifts, we selected ten institutions with characteristics similar to those of Ponce Bank. In the selection process, we applied two “screens” to the universe of all public companies that were eligible for consideration:
| • | Screen #1 Mid-Atlantic institutions with assets between $500 million and $1.5 billion, tangible equity-to-assets ratios of greater than 7.0% and positive reported and core earnings. Nine companies met the criteria for Screen #1 and seven were included in the Peer Group: Bay Bancorp, Inc. of Maryland, Clifton Bancorp, Inc. of New Jersey, Elmira Savings Bank of New York, Hamilton Bancorp, Inc. of Maryland, Malvern Bancorp, Inc. of Pennsylvania, Pathfinder Bancorp, Inc. of New York and Prudential Bancorp, Inc. of Pennsylvania. Severn Bancorp, Inc. of Maryland met the selection criteria, but was excluded on the basis of earnings being distorted by a reversal of a $10.8 million valuation allowance recorded against its net deferred tax asset. PCSB Financial Corporation of New York was excluded due to its recent conversion status, as the result of completing its conversion in April 2017. Exhibit III-2 provides financial and public market pricing characteristics of all publicly-traded Mid-Atlantic thrifts. |
| • | Screen #2 New England institutions with assets between $500 million and $1.5 billion, tangible equity-to-assets ratios of greater than 7.0% and positive reported and core earnings. Three companies met the criteria for Screen #2 and all three were included in the Peer Group: Coastway Bancorp Inc. of Rhode Island, PB Bancorp, Inc. of Connecticut and Wellesley Bancorp, Inc. of Massachusetts. Exhibit III-3 provides financial and public market pricing characteristics of all publicly-traded New England thrifts. |
Table 3.1 shows the general characteristics of each of the ten Peer Group companies and Exhibit III-4 provides summary demographic and deposit market share data for the primary market areas served by each of the Peer Group companies. While there are expectedly some differences between the Peer Group companies and Ponce Bank, we believe that the Peer Group companies, on average, provide a good basis for valuation subject to valuation adjustments. The following sections present a comparison of Ponce Bank’s financial condition, income and expense trends, loan composition, interest rate risk and credit risk versus the Peer Group as of the most recent publicly available date. Comparative data for all publicly-traded thrifts, and publicly-traded New York thrifts have been included in the Chapter III tables as well.
In addition to the selection criteria used to identify the Peer Group companies, a summary description of the key comparable characteristics of each of the Peer Group companies relative to Ponce Bank’s characteristics is detailed below.
| RP® Financial, LC. | PEER GROUP ANALYSIS | |
| III.3 |
Table 3.1
Peer Group of Publicly-Traded Thrifts
As of December 31, 2016
| As of May 5, 2017 |
||||||||||||||||||||||||||||||||
| Ticker |
Financial Institution |
Exchange | City | State | Total Assets |
Offices | Fiscal Year End |
Conv. Date |
Stock Price |
Market Value |
||||||||||||||||||||||
| ($Mil) | ($) | ($Mil) | ||||||||||||||||||||||||||||||
| BYBK |
Bay Bancorp, Inc. |
NASDAQ | Columbia | MD | 620 | 14 | Dec | 1/0/1900 | 7.05 | 74.33 | ||||||||||||||||||||||
| CSBK |
Clifton Bancorp Inc. |
NASDAQ | Clifton | NJ | 1,371 | 12 | Mar | 4/2/2014 | 16.31 | 375.52 | ||||||||||||||||||||||
| CWAY |
Coastway Bancorp, Inc. |
NASDAQ | Warwick | RI | 644 | 11 | Dec | 1/15/2014 | 20.20 | 88.73 | ||||||||||||||||||||||
| ESBK |
Elmira Savings Bank |
NASDAQ | Elmira | NY | 573 | 13 | Dec | 3/1/1985 | 20.80 | 68.72 | ||||||||||||||||||||||
| HBK |
Hamilton Bancorp, Inc. |
NASDAQ | Towson | MD | 500 | 7 | Mar | 10/10/2012 | 15.12 | 51.55 | ||||||||||||||||||||||
| MLVF |
Malvern Bancorp, Inc. |
NASDAQ | Paoli | PA | 879 | 9 | Sep | 10/12/2012 | 21.95 | 144.27 | ||||||||||||||||||||||
| PBHC |
Pathfinder Bancorp, Inc. |
NASDAQ | Oswego | NY | 749 | 17 | Dec | 10/17/2014 | 15.04 | 63.87 | ||||||||||||||||||||||
| PBBI |
PB Bancorp, Inc. |
NASDAQ | Putnam | CT | 521 | 8 | Jun | 10/5/2004 | 10.35 | 81.52 | ||||||||||||||||||||||
| PBIP |
Prudential Bancorp, Inc. |
NASDAQ | Philadelphia | PA | 590 | 11 | Sep | 10/10/2013 | 17.75 | 160.03 | ||||||||||||||||||||||
| WEBK |
Wellesley Bancorp, Inc. |
NASDAQ | Wellesley | MA | 695 | 6 | Dec | 1/26/2012 | 27.00 | 67.09 | ||||||||||||||||||||||
| Source: | SNL Financial, LC. |
| RP® Financial, LC. | PEER GROUP ANALYSIS | |
| III.4 |
| • | Bay Bancorp, Inc. of Maryland. Comparable due to similar size of branch network, similar interest-bearing funding composition, similar net interest income to average assets ratio, relatively high operating expense ratio and lending diversification emphasis on commercial real estate/multi-family loans. |
| • | Clifton Bancorp, Inc. of New Jersey. Comparable due to similar size of branch network, limited earnings contribution from sources of non-interest operating income and lending diversification emphasis on commercial real estate/multi-family loans. |
| • | Coastway Bancorp Inc. of Rhode Island. Comparable due to similar size of branch network, similar interest-earning asset composition, similar impact of loan loss provisions on earnings, relatively high operating expense ratio and lending diversification emphasis on commercial real estate/multi-family loans. |
| • | Elmira Savings of New York. Comparable due to similar size of branch network, similar interest-bearing funding composition, similar impact of loan loss provision on earnings and lending diversification emphasis on commercial real estate/multi-family loans. |
| • | Hamilton Bancorp, Inc. of Maryland. Comparative due to similar interest-bearing funding composition, limited earnings contribution from sources of non-interest operating income and lending diversification emphasis on commercial real estate/multi-family loans. |
| • | Malvern Bancorp, Inc. of Pennsylvania. Comparable due to similar asset size, limited earnings contribution from sources of non-interest operating income and lending diversification emphasis on commercial real estate/multi-family loans. |
| • | Pathfinder Bancorp, Inc. of New York. Comparable due to similar asset size, similar interest-bearing funding composition and lending diversification emphasis commercial real estate/multi-family loans. |
| • | PB Bancorp, Inc. of Connecticut. Comparable due to similar concentration of 1-4 family loans as a percent of assets, similar impact of loan loss provisions on earnings and lending diversification emphasis commercial real estate/multi-family loans. |
| • | Prudential Bancorp, Inc. of Pennsylvania. Comparable due to similar size of branch network, similar impact of loan loss provisions on earnings, limited earnings contribution from sources of non-interest operating income, similar concentration of 1-4 family loans as a percent of assets, lending diversification emphasis on commercial real estate/multi-family loans and similar ratio of non-performing assets as a percent of assets. |
| • | Wellesley Bancorp, Inc. of Massachusetts. Comparable due to similar interest-earning asset composition, similar impact of loan loss provisions on earnings, limited earnings contribution from sources of non-interest operating income, similar concentration of 1-4 family loans as a percent of assets and lending diversification emphasis on commercial real estate/multi-family loans. |
In aggregate, the Peer Group companies maintained a slightly higher level of tangible equity than the industry average (12.10% of assets versus 11.57% for all public companies), generated lower earnings as a percent of average assets (0.57% core ROAA versus 0.74% for all public companies), and earned a lower ROE (4.85% core ROE versus 6.12% for all public companies). Overall, the Peer Group’s average P/TB ratio and average core P/E multiple were below and approximately same compared to the respective averages for all publicly-traded thrifts.
| RP® Financial, LC. | PEER GROUP ANALYSIS | |
| III.5 |
| All Publicly-Traded |
Peer Group | |||||||
| Financial Characteristics (Averages) |
||||||||
| Assets ($Mil) |
$ | 3,327 | $ | 753 | ||||
| Market capitalization ($Mil) |
$ | 547 | $ | 118 | ||||
| Tangible equity/assets (%) |
11.57 | % | 12.10 | % | ||||
| Core return on average assets (%) |
0.74 | 0.57 | ||||||
| Core return on average equity (%) |
6.12 | 4.85 | ||||||
| Pricing Ratios (Averages)(1) |
||||||||
| Core price/earnings (x) |
20.83 | x | 20.02 | x | ||||
| Price/tangible book (%) |
145.09 | % | 125.10 | % | ||||
| Price/assets (%) |
15.96 | 13.66 | ||||||
| (1) | Based on market prices as of May 5, 2017. |
Ideally, the Peer Group companies would be comparable to Ponce Bank in terms of all of the selection criteria, but the universe of publicly-traded thrifts does not provide for an appropriate number of such companies. However, in general, the companies selected for the Peer Group were fairly comparable to Ponce Bank, as will be highlighted in the following comparative analysis. Comparative data for all publicly-traded thrifts and publicly-traded New York thrifts have been included in the Chapter III tables as well.
Financial Condition
Table 3.2 shows comparative balance sheet measures for Ponce Bank and the Peer Group, reflecting the expected similarities and some differences given the selection procedures outlined above. The Bank’s and the Peer Group’s ratios reflect balances as of March 31, 2017 and December 31, 2016, respectively. Ponce Bank’s equity-to-assets ratio of 11.89% was slightly lower than the Peer Group’s average net worth ratio of 12.75%. With the infusion of the net proceeds, the Bank’s pro forma equity-to-assets ratio will exceed the Peer Group’s equity-to-assets ratio. Tangible equity-to-assets ratios for the Bank and the Peer Group equaled 11.89% and 12.10%, respectively. The increase in Ponce Bank’s pro forma capital position will be favorable from a risk perspective and in terms of future earnings potential that could be realized through leverage and lower funding costs. At the same time, the Bank’s higher pro forma capitalization will initially depress return on equity. Both Ponce Bank’s and the Peer
| RP® Financial, LC. | PEER GROUP ANALYSIS | |
| III.6 |
Table 3.2
Balance Sheet Composition and Growth Rates
Comparable Institution Analysis
As of December 31, 2016
| Balance Sheet as a Percent of Assets | Balance Sheet Annual Growth Rates | Regulatory Capital | ||||||||||||||||||||||||||||||||||||||||||||||||||||||||||||||||||||||||||||||||||
| Cash & Equivalents |
MBS & Invest |
BOLI | Net Loans (1) |
Deposits | Borrowed Funds |
Sub. Debt |
Total Equity |
Goodwill & Intang |
Tangible Equity |
Assets | MBS, Cash & Investments |
Loans (1) |
Deposits | Borrows. & Subdebt |
Total Equity |
Tangible Equity |
Tier 1 Leverage |
Tier 1 Risk-Based |
Risk-Based Capital |
|||||||||||||||||||||||||||||||||||||||||||||||||||||||||||||||||
| Ponce Bank |
NY | |||||||||||||||||||||||||||||||||||||||||||||||||||||||||||||||||||||||||||||||||||
| March 31, 2017 |
2.10 | % | 6.87 | % | 0.00 | % | 86.44 | % | 83.42 | % | 3.56 | % | 0.00 | % | 11.89 | % | 0.00 | % | 11.89 | % | 9.28 | % | -22.14 | % | 14.79 | % | 7.41 | % | 153.11 | % | 2.11 | % | 2.23 | % | 13.08 | % | 16.91 | % | 18.16 | % | ||||||||||||||||||||||||||||||||||||||||||||
| All Public Companies |
||||||||||||||||||||||||||||||||||||||||||||||||||||||||||||||||||||||||||||||||||||
| Averages |
5.62 | % | 16.39 | % | 1.85 | % | 72.51 | % | 74.79 | % | 10.97 | % | 0.44 | % | 12.65 | % | 0.85 | % | 11.57 | % | 14.43 | % | 3.79 | % | 19.26 | % | 16.77 | % | 6.81 | % | 13.41 | % | 7.80 | % | 11.98 | % | 17.90 | % | 19.02 | % | ||||||||||||||||||||||||||||||||||||||||||||
| Medians |
4.03 | % | 13.98 | % | 1.82 | % | 75.11 | % | 75.08 | % | 8.95 | % | 0.00 | % | 11.32 | % | 0.34 | % | 10.63 | % | 9.14 | % | 3.07 | % | 13.10 | % | 10.39 | % | 0.43 | % | 3.08 | % | 2.56 | % | 10.57 | % | 14.51 | % | 16.16 | % | ||||||||||||||||||||||||||||||||||||||||||||
| State of NY |
||||||||||||||||||||||||||||||||||||||||||||||||||||||||||||||||||||||||||||||||||||
| Averages |
5.03 | % | 13.82 | % | 1.31 | % | 76.35 | % | 77.59 | % | 10.92 | % | 0.82 | % | 9.55 | % | 1.16 | % | 8.40 | % | 5.91 | % | 4.07 | % | 6.43 | % | 9.79 | % | -5.64 | % | 5.81 | % | 7.06 | % | 9.04 | % | 13.55 | % | 14.58 | % | ||||||||||||||||||||||||||||||||||||||||||||
| Medians |
3.44 | % | 10.63 | % | 1.48 | % | 78.67 | % | 81.73 | % | 7.60 | % | 0.37 | % | 9.25 | % | 0.59 | % | 8.03 | % | 2.83 | % | 3.16 | % | 4.25 | % | 2.34 | % | -13.18 | % | 2.46 | % | 4.69 | % | 9.20 | % | 13.02 | % | 14.16 | % | ||||||||||||||||||||||||||||||||||||||||||||
| Comparable Group |
||||||||||||||||||||||||||||||||||||||||||||||||||||||||||||||||||||||||||||||||||||
| Averages |
4.10 | % | 18.29 | % | 2.47 | % | 71.52 | % | 74.73 | % | 11.28 | % | 0.34 | % | 12.75 | % | 0.65 | % | 12.10 | % | 16.53 | % | 13.27 | % | 21.89 | % | 19.48 | % | 21.50 | % | 5.38 | % | 5.84 | % | 11.79 | % | 18.00 | % | 19.05 | % | ||||||||||||||||||||||||||||||||||||||||||||
| Medians |
3.93 | % | 17.03 | % | 2.37 | % | 72.18 | % | 75.06 | % | 11.76 | % | 0.00 | % | 10.77 | % | 0.24 | % | 10.45 | % | 15.71 | % | 7.50 | % | 18.11 | % | 19.47 | % | 14.09 | % | -1.19 | % | -2.87 | % | 9.80 | % | 13.18 | % | 14.01 | % | ||||||||||||||||||||||||||||||||||||||||||||
| Comparable Group |
||||||||||||||||||||||||||||||||||||||||||||||||||||||||||||||||||||||||||||||||||||
| BYBK |
Bay Bancorp, Inc. |
MD | 6.45 | % | 10.19 | % | 2.54 | % | 78.33 | % | 84.87 | % | 3.22 | % | 0.00 | % | 10.63 | % | 0.49 | % | 10.14 | % | 26.29 | % | 42.78 | % | 22.60 | % | 43.29 | % | -61.76 | % | -2.59 | % | -3.32 | % | 10.45 | % | 12.32 | % | 12.87 | % | ||||||||||||||||||||||||||||||||||||||||||
| CSBK |
Clifton Bancorp Inc. |
NJ | 1.62 | % | 24.20 | % | 4.47 | % | 68.32 | % | 58.59 | % | 18.41 | % | 0.00 | % | 22.10 | % | 0.00 | % | 22.10 | % | 17.43 | % | -10.42 | % | 33.79 | % | 19.19 | % | 71.77 | % | -9.24 | % | -9.24 | % | 22.44 | % | 40.08 | % | 40.82 | % | ||||||||||||||||||||||||||||||||||||||||||
| CWAY |
Coastway Bancorp, Inc. |
RI | 6.93 | % | 0.96 | % | 0.69 | % | 85.13 | % | 69.44 | % | 18.82 | % | 0.00 | % | 10.64 | % | 0.00 | % | 10.64 | % | 13.99 | % | 71.31 | % | 12.84 | % | 19.76 | % | 4.98 | % | -3.31 | % | -3.31 | % | 9.14 | % | 13.20 | % | 13.79 | % | ||||||||||||||||||||||||||||||||||||||||||
| ESBK |
Elmira Savings Bank |
NY | 4.24 | % | 8.88 | % | 2.37 | % | 79.39 | % | 81.88 | % | 7.32 | % | 0.00 | % | 9.72 | % | 2.15 | % | 7.57 | % | 2.16 | % | 10.15 | % | 0.98 | % | 6.60 | % | -29.44 | % | 1.74 | % | 2.34 | % | 8.24 | % | 12.78 | % | 13.96 | % | ||||||||||||||||||||||||||||||||||||||||||
| HBK |
Hamilton Bancorp, Inc. |
MD | 3.76 | % | 21.69 | % | 3.63 | % | 65.89 | % | 81.69 | % | 5.24 | % | 0.00 | % | 12.14 | % | 1.88 | % | 10.26 | % | 35.73 | % | 13.71 | % | 45.42 | % | 41.27 | % | 55.48 | % | 0.05 | % | -4.19 | % | 8.24 | % | 12.07 | % | 12.75 | % | ||||||||||||||||||||||||||||||||||||||||||
| MLVF |
Malvern Bancorp, Inc. |
PA | 7.20 | % | 12.36 | % | 2.11 | % | 76.04 | % | 74.93 | % | 13.42 | % | 0.00 | % | 10.89 | % | 0.00 | % | 10.89 | % | 20.88 | % | -26.14 | % | 44.84 | % | 23.18 | % | 14.56 | % | 15.82 | % | 15.82 | % | 11.11 | % | 13.16 | % | 14.06 | % | ||||||||||||||||||||||||||||||||||||||||||
| PBHC |
Pathfinder Bancorp, Inc. |
NY | 2.99 | % | 26.68 | % | 1.53 | % | 64.87 | % | 81.57 | % | 7.87 | % | 2.01 | % | 7.79 | % | 0.63 | % | 7.16 | % | 20.18 | % | 38.13 | % | 14.40 | % | 24.61 | % | 31.41 | % | -18.07 | % | -19.33 | % | 8.59 | % | 13.34 | % | 14.52 | % | ||||||||||||||||||||||||||||||||||||||||||
| PBBI |
PB Bancorp, Inc. |
CT | 1.98 | % | 37.20 | % | 2.38 | % | 54.94 | % | 69.96 | % | 12.53 | % | 0.00 | % | 16.45 | % | 1.33 | % | 15.12 | % | 3.87 | % | -14.52 | % | 21.82 | % | -6.02 | % | 13.62 | % | 66.03 | % | 76.25 | % | 12.31 | % | 19.35 | % | 20.20 | % | ||||||||||||||||||||||||||||||||||||||||||
| PBIP |
Prudential Bancorp, Inc. |
PA | 1.68 | % | 30.56 | % | 3.94 | % | 59.22 | % | 69.18 | % | 10.98 | % | 0.00 | % | 19.17 | % | 0.00 | % | 19.17 | % | 12.88 | % | 4.85 | % | 8.58 | % | 10.15 | % | 103.20 | % | -2.43 | % | -2.43 | % | 19.20 | % | 33.12 | % | 34.16 | % | ||||||||||||||||||||||||||||||||||||||||||
| WEBK |
Wellesley Bancorp, Inc. |
MA | 4.10 | % | 10.13 | % | 1.05 | % | 83.07 | % | 75.19 | % | 15.00 | % | 1.41 | % | 7.94 | % | 0.00 | % | 7.94 | % | 11.93 | % | 2.80 | % | 13.60 | % | 12.74 | % | 11.16 | % | 5.82 | % | 5.82 | % | 8.21 | % | 10.57 | % | 13.35 | % | ||||||||||||||||||||||||||||||||||||||||||
| (1) | Includes loans held for sale. |
| Source: | SNL Financial, LC. and RP® Financial, LC. calculations. The information provided in this table has been obtained from sources we believe are reliable, but we cannot guarantee the accuracy or completeness of such information. |
Copyright (c) 2017 by RP® Financial, LC.
| RP® Financial, LC. | PEER GROUP ANALYSIS | |
| III.7 |
Group’s capital ratios reflected capital surpluses with respect to the regulatory capital requirements.
The interest-earning asset compositions for the Bank and the Peer Group were somewhat similar, with loans constituting the bulk of interest-earning assets for both Ponce Bank and the Peer Group. The Bank’s loans-to-assets ratio of 86.44% was higher than the comparable Peer Group ratio of 71.52%. Comparatively, the Bank’s cash and investments-to-assets ratio of 8.97% was lower than the comparable Peer Group ratio of 22.39%. Overall, Ponce Bank’s interest-earning assets amounted to 95.41% of assets, which was slightly higher than the comparable Peer Group ratio of 93.91%. The Peer Group’s non-interest earning assets included bank-owned life insurance (“BOLI”) equal to 2.47% of assets and goodwill/intangibles equal to 0.65% of assets, while the Bank maintained a zero balance of BOLI and a very nominal balance of goodwill/intangibles.
Ponce Bank’s funding liabilities reflected a funding strategy that was somewhat similar to that of the Peer Group’s funding composition. The Bank’s deposits equaled 83.42% of assets, which was above the Peer Group’s ratio of 74.73%. Comparatively, the Bank maintained a lower level of borrowings to fund assets, as indicated by borrowings-to-assets ratios of 3.56% and 11.62% for Ponce Bank and the Peer Group, respectively. Total interest-bearing liabilities maintained by the Bank and the Peer Group, as a percent of assets, equaled 86.98% and 86.35%, respectively.
A key measure of balance sheet strength for a thrift institution is its interest-earnings assets/interest-bearing liabilities (“IEA/IBL”) ratio. Presently, the Bank’s IEA/IBL ratio is approximately the same as the Peer Group’s ratio, based on IEA/IBL ratios of 109.69% and 108.76%, respectively. The additional capital realized from stock proceeds should serve to provide Ponce Bank with an IEA/IBL ratio that more significantly exceeds the Peer Group’s ratio, as the increase in capital provided by the infusion of stock proceeds will serve to lower the level of interest-bearing liabilities funding assets and will be primarily deployed into interest-earning assets.
The growth rate section of Table 3.2 shows annual growth rates for key balance sheet items. Ponce Bank’s growth rates are based on annualized growth for the fifteen months ended March 31, 2017 and the Peer Group’s growth rates are based on growth for the twelve months ended December 31, 2016. Ponce Bank recorded a 9.28% increase in assets, versus asset growth of 16.53% recorded by the Peer Group. The Peer Group’s higher growth rate was in part due to acquisition related growth by Bay Bancorp, Inc. and Prudential Bancorp, Inc. Asset
| RP® Financial, LC. | PEER GROUP ANALYSIS | |
| III.8 |
growth for Ponce Bank was driven by a 14.79% increase in loans, which was in part funded by a 22.14% reduction in cash and investments. Comparatively, asset growth for the Peer Group was driven by a 21.89% increase in loans and was supplemented with a 13.27% increase in cash and investments.
Asset growth for Ponce Bank was funded by a 7.41% increase in deposits and a 153.11% increase in borrowings. Asset growth for the Peer Group was funded through deposit growth of 19.48% and a 21.50% increase in borrowings. The Bank’s tangible capital increased 2.23%, which was largely attributable to retention of earnings. Comparatively, the Peer Group’s tangible capital increased 5.84%, with the Peer Group’s higher growth rate in part supported by PB Bancorp’s relatively high capital growth rate realized in connection with its second-step conversion. The Bank’s post-conversion capital growth rate will initially be constrained by maintenance of a higher pro forma capital position. Additionally, implementation of any stock repurchases and dividend payments, pursuant to regulatory limitations and guidelines, could also slow the Bank’s capital growth rate in the longer term following the stock offering.
Income and Expense Components
Table 3.3 displays statements of operations for the Bank and the Peer Group. The Bank’s and the Peer Group’s ratios are based on earnings for the twelve months ended March 31, 2017 and December 31, 2016, respectively. Ponce Bank and the Peer Group reported net income to average assets ratios of 0.16% and 0.54%, respectively. The Peer Group’s higher return was realized through a higher ratio for non-interest operating income, a lower ratio for operating expenses and a lower effective tax rate, which were partially offset by the Bank’s higher ratio for net interest income and lower ratio for loan loss provisions
The Bank’s higher net interest income to average assets ratio was realized through a higher interest income ratio, which was partially offset by the Peer Group’s lower interest expense ratio. The Bank’s higher interest income ratio was supported by maintaining a higher overall yield earned on interest-earning assets (4.82% versus 3.69% for the Peer Group), as well as maintaining a slightly higher concentration of interest-earning assets as a percent of assets. Likewise, the Peer Group’s lower interest expense ratio was supported by a lower cost of funds (0.77% versus 1.06% for the Bank), as well as maintaining a slightly lower ratio of interest-bearing liabilities funding assets. Overall, Ponce Bank and the Peer Group reported net interest income to average assets ratios of 3.79% and 2.83%, respectively.
| RP® Financial, LC. | Peer Group Analysis | |
| Page III.9 |
Table 3.3
Income as Percent of Average Assets and Yields, Costs, Spreads
Comparable Institution Analysis
For the 12 Months Ended December 31, 2016
| Net Interest Income | Non-Interest Income | Non-Op. Items | Yields, Costs, and Spreads | |||||||||||||||||||||||||||||||||||||||||||||||||||||||||||||||||||||
| Net Income |
Income | Expense | NII | Loss Provis. on IEA |
NII After Provis. |
Gain on Sale of Loans |
Other Non-Int Income |
Total Non-Int Expense |
Net Gains/ Losses (1) |
Extrao. Items |
Provision for Taxes |
Yield On IEA |
Cost Of IBL |
Yld-Cost Spread |
MEMO: Assets/ FTE Emp. |
MEMO: Effective Tax Rate |
||||||||||||||||||||||||||||||||||||||||||||||||||||||||
| (%) | (%) | (%) | (%) | (%) | (%) | (%) | (%) | (%) | (%) | (%) | (%) | (%) | (%) | (%) | (%) | |||||||||||||||||||||||||||||||||||||||||||||||||||||||||
| Ponce Bank |
NY | |||||||||||||||||||||||||||||||||||||||||||||||||||||||||||||||||||||||
| March 31, 2017 |
0.16 | % | 4.60 | % | 0.81 | % | 3.79 | % | 0.07 | % | 3.71 | % | 0.00 | % | 0.36 | % | 3.80 | % | 0.00 | % | 0.00 | % | 0.12 | % | 4.82 | % | 1.06 | % | 3.76 | % | $ | 4,442 | 42.16 | % | ||||||||||||||||||||||||||||||||||||||
| All Public Thrifts |
||||||||||||||||||||||||||||||||||||||||||||||||||||||||||||||||||||||||
| Averages |
0.74 | % | 3.53 | % | 0.59 | % | 2.94 | % | 0.08 | % | 2.85 | % | 0.41 | % | 0.52 | % | 2.77 | % | 0.00 | % | 0.00 | % | 0.28 | % | 3.76 | % | 0.77 | % | 3.00 | % | $ | 7,199 | 24.62 | % | ||||||||||||||||||||||||||||||||||||||
| Medians |
0.68 | % | 3.53 | % | 0.57 | % | 2.92 | % | 0.08 | % | 2.84 | % | 0.05 | % | 0.44 | % | 2.66 | % | 0.00 | % | 0.00 | % | 0.30 | % | 3.72 | % | 0.76 | % | 2.95 | % | $ | 5,935 | 33.49 | % | ||||||||||||||||||||||||||||||||||||||
| State of NY |
||||||||||||||||||||||||||||||||||||||||||||||||||||||||||||||||||||||||
| Averages |
0.65 | % | 3.54 | % | 0.70 | % | 2.83 | % | 0.05 | % | 2.78 | % | 0.22 | % | 0.41 | % | 2.53 | % | 0.17 | % | 0.00 | % | 0.41 | % | 3.73 | % | 0.83 | % | 2.90 | % | $ | 7,954 | 33.06 | % | ||||||||||||||||||||||||||||||||||||||
| Medians |
0.77 | % | 3.54 | % | 0.77 | % | 2.91 | % | 0.06 | % | 2.83 | % | 0.00 | % | 0.47 | % | 2.75 | % | 0.02 | % | 0.00 | % | 0.35 | % | 3.73 | % | 0.92 | % | 2.87 | % | $ | 5,710 | 31.42 | % | ||||||||||||||||||||||||||||||||||||||
| Comparable Group |
||||||||||||||||||||||||||||||||||||||||||||||||||||||||||||||||||||||||
| Averages |
0.54 | % | 3.47 | % | 0.65 | % | 2.83 | % | 0.14 | % | 2.68 | % | 0.13 | % | 0.35 | % | 2.57 | % | 0.02 | % | 0.01 | % | 0.12 | % | 3.69 | % | 0.77 | % | 2.98 | % | $ | 6,410 | 18.51 | % | ||||||||||||||||||||||||||||||||||||||
| Medians |
0.47 | % | 3.45 | % | 0.62 | % | 2.83 | % | 0.12 | % | 2.69 | % | 0.02 | % | 0.30 | % | 2.54 | % | 0.01 | % | 0.00 | % | 0.17 | % | 3.66 | % | 0.72 | % | 3.07 | % | $ | 5,222 | 31.08 | % | ||||||||||||||||||||||||||||||||||||||
| Comparable Group |
||||||||||||||||||||||||||||||||||||||||||||||||||||||||||||||||||||||||
| BYBK |
Bay Bancorp, Inc. |
MD | 0.37 | % | 4.29 | % | 0.34 | % | 3.95 | % | 0.26 | % | 3.69 | % | 0.16 | % | 0.67 | % | 4.00 | % | -0.03 | % | 0.07 | % | 0.19 | % | 4.50 | % | 0.50 | % | 4.00 | % | $ | 4,734 | 38.61 | % | ||||||||||||||||||||||||||||||||||||
| CSBK |
Clifton Bancorp Inc. |
NJ | 0.34 | % | 3.04 | % | 0.86 | % | 2.18 | % | 0.17 | % | 2.01 | % | 0.00 | % | 0.14 | % | 1.67 | % | 0.01 | % | 0.00 | % | 0.15 | % | 3.26 | % | 1.18 | % | 2.08 | % | $ | 10,715 | 30.75 | % | ||||||||||||||||||||||||||||||||||||
| CWAY |
Coastway Bancorp, Inc. |
RI | 0.58 | % | 3.55 | % | 0.47 | % | 3.08 | % | 0.08 | % | 3.00 | % | 0.55 | % | 0.38 | % | 3.36 | % | 0.00 | % | 0.00 | % | 0.38 | % | 3.81 | % | 0.70 | % | 3.11 | % | $ | 4,486 | 39.53 | % | ||||||||||||||||||||||||||||||||||||
| ESBK |
Elmira Savings Bank |
NY | 0.77 | % | 3.68 | % | 0.77 | % | 2.91 | % | 0.09 | % | 2.83 | % | 0.54 | % | 0.47 | % | 2.75 | % | 0.03 | % | 0.00 | % | 0.35 | % | 4.05 | % | 1.00 | % | 3.05 | % | $ | 4,589 | 31.42 | % | ||||||||||||||||||||||||||||||||||||
| HBK |
Hamilton Bancorp, Inc. |
MD | 0.03 | % | 3.31 | % | 0.57 | % | 2.74 | % | 0.27 | % | 2.47 | % | 0.00 | % | 0.22 | % | 2.55 | % | -0.10 | % | 0.00 | % | 0.01 | % | 3.60 | % | 0.73 | % | 2.87 | % | $ | 6,781 | 16.33 | % | ||||||||||||||||||||||||||||||||||||
| MLVF |
Malvern Bancorp, Inc. |
PA | 1.49 | % | 3.37 | % | 0.90 | % | 2.47 | % | 0.20 | % | 2.27 | % | 0.02 | % | 0.21 | % | 1.78 | % | 0.05 | % | 0.00 | % | -0.72 | % | 3.57 | % | 1.08 | % | 2.49 | % | $ | 10,847 | -93.11 | % | ||||||||||||||||||||||||||||||||||||
| PBHC |
Pathfinder Bancorp, Inc. |
NY | 0.48 | % | 3.54 | % | 0.56 | % | 2.98 | % | 0.14 | % | 2.84 | % | 0.00 | % | 0.53 | % | 2.81 | % | 0.09 | % | 0.00 | % | 0.16 | % | 3.73 | % | 0.55 | % | 3.18 | % | $ | 5,710 | 25.20 | % | ||||||||||||||||||||||||||||||||||||
| PBBI |
PB Bancorp, Inc. |
CT | 0.31 | % | 2.87 | % | 0.63 | % | 2.24 | % | 0.10 | % | 2.14 | % | 0.01 | % | 0.46 | % | 2.29 | % | 0.09 | % | 0.00 | % | 0.11 | % | 3.04 | % | 0.62 | % | 2.42 | % | $ | 3,010 | 26.21 | % | ||||||||||||||||||||||||||||||||||||
| PBIP |
Prudential Bancorp, Inc. |
PA | 0.55 | % | 3.25 | % | 0.61 | % | 2.64 | % | 0.07 | % | 2.56 | % | 0.01 | % | 0.17 | % | 1.96 | % | 0.02 | % | 0.00 | % | 0.26 | % | 3.38 | % | 0.43 | % | 3.46 | % | $ | 3,594 | 31.67 | % | ||||||||||||||||||||||||||||||||||||
| WEBK |
Wellesley Bancorp, Inc. |
MA | 0.45 | % | 3.84 | % | 0.76 | % | 3.08 | % | 0.07 | % | 3.01 | % | 0.04 | % | 0.22 | % | 2.54 | % | 0.00 | % | 0.00 | % | 0.28 | % | 3.95 | % | 0.86 | % | 3.09 | % | $ | 9,631 | 38.50 | % | ||||||||||||||||||||||||||||||||||||
| (1) | Net gains/losses includes gain/loss on sale of securities and nonrecurring income and expense. |
| Source: | SNL Financial, LC. and RP® Financial, LC. calculations. The information provided in this table has been obtained from sources we believe are reliable, but we cannot guarantee the accuracy or completeness of such information. |
Copyright (c) 2017 by RP® Financial, LC.
| RP® Financial, LC. | PEER GROUP ANALYSIS | |
| III.10 |
In another key area of core earnings strength, the Bank maintained a significantly higher level of operating expenses than the Peer Group. For the period covered in Table 3.3, the Bank and the Peer Group reported operating expense to average assets ratios of 3.80% and 2.57%, respectively. The Bank’s higher operating expense ratio was consistent with the comparatively higher number of employees maintained relative to its asset size. Assets per full time equivalent employee equaled $4.442 million for the Bank, versus $6.410 million for the Peer Group.
When viewed together net interest income and operating expenses provide considerable insight into a thrift’s earnings strength, since those sources of income and expenses are typically the most prominent components of earnings and are generally more predictable than losses and gains realized from the sale of assets or other non-recurring activities. In this regard, as measured by their expense coverage ratios (net interest income divided by operating expenses), the Bank’s earnings were less favorable than the Peer Group’s. Expense coverage ratios for Ponce Bank and the Peer Group equaled 1.00x and 1.10x, respectively.
Sources of non-interest operating income provided a larger contribution to the Peer Group’s earnings, with such income amounting to 0.36% and 0.48% of Ponce Bank’s and the Peer Group’s average assets, respectively. Taking non-interest operating income into account in comparing the Bank’s and the Peer Group’s earnings, Ponce Bank’s efficiency ratio (operating expenses, as a percent of the sum of non-interest operating income and net interest income) of 91.57% was less favorable than the Peer Group’s efficiency ratio of 77.64%.
Loan loss provisions had a larger impact on the Peer Group’s earnings, with loan loss provisions established by the Peer Group equaling 0.14% of average assets. Comparatively, the Bank recorded loan loss provisions equal to 0.07% of average assets.
Net non-operating gains equaled 0.02% of average assets for the Peer Group and were not a factor in the Bank’s earnings. Typically, gains and losses generated from the sale of assets and other non-operating activities are viewed as earnings with a relatively high degree of volatility, particularly to the extent that such gains and losses result from the sale of investments or other assets that are not considered to be part of an institution’s core operations. Extraordinary items were not a factor in either the Bank’s or the Peer Group’s earnings.
Taxes had a more significant impact on the Bank’s earnings, as the Bank and the Peer Group posted effective tax rates of 42.16% and 18.51%, respectively. As indicated in the prospectus, the Bank’s effective marginal tax rate is equal to 34.0%.
| RP® Financial, LC. | PEER GROUP ANALYSIS | |
| III.11 |
Loan Composition
Table 3.4 presents data related to the Bank’s and the Peer Group’s loan portfolio compositions (including the investment in mortgage-backed securities). The Bank’s loan portfolio composition reflected a lower combined concentration of 1-4 family permanent mortgage loans and mortgage-backed securities in comparison to the Peer Group (43.75% of assets versus 51.58% for the Peer Group), as the Peer Group’s higher concentration of mortgage-backed securities was only slightly offset by the Bank’s higher concentration of 1-4 family loans. The Bank did not hold any loans serviced for others, while loans serviced for others for the Peer Group equaled 4.24% of the Peer Group’s assets; thereby indicating that loan servicing income and expenses were a larger factor in the Peer Group’s earnings. Loan servicing intangibles constituted a modest balance sheet item for the Peer Group.
Overall, diversification into higher risk and higher yielding types of lending was more significant for the Bank, which was primarily attributable to the Bank’s higher concentration of multi-family loans (20.58% of assets versus 2.70% for the Peer Group). Commercial real estate loans constituted the most significant type of lending diversification for the Peer Group (18.43% of assets versus 17.87% for the Bank). The Bank also maintained a slightly higher concentration of construction/land loans, while the Peer Group maintained higher concentrations of commercial business loans and consumer loans. In total, construction/land, commercial real estate, multi-family, commercial business and consumer loans comprised 44.91% and 30.72% of the Bank’s and the Peer Group’s assets, respectively. Overall, the Bank’s asset composition provided for a higher risk weighted assets-to-assets ratio of 75.08%, versus a comparable Peer Group ratio of 60.72%.
Interest Rate Risk
Table 3.5 reflects various key ratios highlighting the relative interest rate risk exposure of the Bank versus the Peer Group. In terms of balance sheet composition, Ponce Bank’s interest rate risk characteristics were considered to be fairly similar to the comparable measures for the Peer Group. Most notably, the Bank’s tangible equity-to-assets ratio and IEA/IBL ratio were similar to the comparable Peer Group ratios. However, the Bank maintained a slightly advantage with respect to its lower ratio of non-interest earning assets as a percent of assets. On a pro forma basis, the infusion of stock proceeds should serve to provide the Bank with more favorable balance sheet interest rate risk characteristics than maintained by the Peer
| RP® Financial, LC. | PEER GROUP ANALYSIS | |
| III.12 |
Table 3.4
Loan Portfolio Composition and Related Information
Comparable Institution Analysis
As of December 31, 2016
| Portfolio Composition as a Percent of Assets | ||||||||||||||||||||||||||||||||||||||||||||
| Institution |
MBS | 1-4 Family(1) |
Constr. & Land |
Multi- Family |
Comm RE | Commerc. Business |
Consumer | RWA/ Assets |
Serviced For Others |
Servicing Assets |
||||||||||||||||||||||||||||||||||
| (%) | (%) | (%) | (%) | (%) | (%) | (%) | (%) | ($000) | ($000) | |||||||||||||||||||||||||||||||||||
| Ponce Bank |
NY | 1.27 | % | 42.48 | % | 4.78 | % | 20.58 | % | 17.87 | % | 1.58 | % | 0.10 | % | 75.08 | % | $ | 0 | $ | 0 | |||||||||||||||||||||||
| March 31, 2017 |
||||||||||||||||||||||||||||||||||||||||||||
| All Public Companies |
||||||||||||||||||||||||||||||||||||||||||||
| Averages |
9.53 | % | 32.64 | % | 3.80 | % | 9.95 | % | 18.64 | % | 4.60 | % | 1.55 | % | 68.79 | % | $ | 1,500,818 | $ | 8,303 | ||||||||||||||||||||||||
| Medians |
8.40 | % | 32.60 | % | 2.87 | % | 3.63 | % | 17.62 | % | 3.94 | % | 0.35 | % | 70.39 | % | $ | 59,991 | $ | 385 | ||||||||||||||||||||||||
| State of NY |
||||||||||||||||||||||||||||||||||||||||||||
| Averages |
5.08 | % | 31.71 | % | 1.42 | % | 18.65 | % | 12.85 | % | 3.31 | % | 0.90 | % | 66.55 | % | $ | 3,108,671 | $ | 33,843 | ||||||||||||||||||||||||
| Medians |
5.21 | % | 24.91 | % | 0.74 | % | 2.31 | % | 13.35 | % | 1.73 | % | 0.03 | % | 68.93 | % | $ | 26,428 | $ | 193 | ||||||||||||||||||||||||
| Comparable Group |
||||||||||||||||||||||||||||||||||||||||||||
| Averages |
10.44 | % | 41.14 | % | 4.02 | % | 2.70 | % | 18.43 | % | 4.71 | % | 0.86 | % | 60.72 | % | $ | 31,930 | $ | 232 | ||||||||||||||||||||||||
| Medians |
8.40 | % | 39.51 | % | 3.16 | % | 2.18 | % | 16.06 | % | 4.55 | % | 0.26 | % | 61.88 | % | $ | 2,705 | $ | 20 | ||||||||||||||||||||||||
| Comparable Group |
||||||||||||||||||||||||||||||||||||||||||||
| BYBK |
Bay Bancorp Inc. |
MD | 5.15 | % | 31.47 | % | 4.20 | % | 2.77 | % | 30.56 | % | 9.46 | % | 0.33 | % | 82.51 | % | $ | 5,410 | $ | 0 | ||||||||||||||||||||||
| CSBK |
Clifton Bancorp Inc |
NJ | 19.35 | % | 47.98 | % | 0.00 | % | 8.86 | % | 11.75 | % | 0.10 | % | 0.04 | % | 55.16 | % | $ | 0 | $ | 0 | ||||||||||||||||||||||
| CWAY |
Coastway Bncp, Inc. |
RI | 0.00 | % | 55.80 | % | 1.73 | % | 0.96 | % | 22.17 | % | 4.67 | % | 0.18 | % | 71.36 | % | $ | 0 | $ | 0 | ||||||||||||||||||||||
| ESBK |
Elmira Savings Bank |
NY | 2.71 | % | 55.17 | % | 1.62 | % | 2.52 | % | 10.90 | % | 3.78 | % | 6.15 | % | 48.92 | % | $ | 254,086 | $ | 1,748 | ||||||||||||||||||||||
| HBK |
Hamilton Bancorp Inc |
MD | 16.36 | % | 38.04 | % | 3.17 | % | 1.95 | % | 18.27 | % | 4.44 | % | 0.49 | % | 12.82 | % | $ | 0 | $ | 0 | ||||||||||||||||||||||
| MLVF |
Malvern Bancorp Inc |
PA | 2.56 | % | 30.63 | % | 4.37 | % | 2.25 | % | 33.21 | % | 6.10 | % | 0.19 | % | 79.30 | % | $ | 0 | $ | 313 | ||||||||||||||||||||||
| PBHC |
Pathfinder Bancorp Inc. |
NY | 11.65 | % | 29.80 | % | 5.41 | % | 2.10 | % | 17.13 | % | 9.14 | % | 0.78 | % | 65.33 | % | $ | 17,034 | $ | 40 | ||||||||||||||||||||||
| PBBI |
PB Bancorp Inc. |
CT | 28.34 | % | 40.52 | % | 0.76 | % | 1.02 | % | 10.42 | % | 2.35 | % | 0.13 | % | 56.95 | % | $ | 27,051 | $ | 99 | ||||||||||||||||||||||
| PBIP |
Prudential Bancorp Inc. |
PA | 15.80 | % | 38.51 | % | 3.15 | % | 2.09 | % | 14.98 | % | 0.00 | % | 0.33 | % | 58.43 | % | $ | 0 | $ | 0 | ||||||||||||||||||||||
| WEBK |
Wellesley Bancorp |
MA | 2.45 | % | 43.52 | % | 15.81 | % | 2.48 | % | 14.92 | % | 7.10 | % | 0.02 | % | 76.38 | % | $ | 15,716 | $ | 122 | ||||||||||||||||||||||
| (1) | Includes home equity loans and lines of credit. |
| Source: | SNL Financial LC. and RP® Financial, LC. calculations. The information provided in this table has been obtained from sources we believe are reliable, but we cannot guarantee the accuracy or completeness of such information. |
Copyright (c) 2017 by RP® Financial, LC.
| RP® Financial, LC. | Peer Group Analysis | |
| Page III.13 |
Table 3.5
Interest Rate Risk Measures and Net Interest Income Volatility
Comparable Institution Analysis
As of December 31, 2016
| Balance Sheet Measures | ||||||||||||||||||||||||||||||||||||||||
| Tangible | Non-IEA | Quarterly Change in Net Interest Income | ||||||||||||||||||||||||||||||||||||||
| Equity/ | IEA/ | Assets/ | ||||||||||||||||||||||||||||||||||||||
| Assets | IBL | Assets | 12/31/2016 | 9/30/2016 | 6/30/2016 | 3/31/2016 | 12/31/2015 | 9/30/2015 | ||||||||||||||||||||||||||||||||
| (%) | (%) | (%) | (change in net interest income is annualized in basis points) | |||||||||||||||||||||||||||||||||||||
| Ponce Bank |
NY | |||||||||||||||||||||||||||||||||||||||
| March 31, 2017 |
11.9 | % | 109.7 | % | 4.6 | % | 1 | -8 | -36 | 16 | 3 | -5 | ||||||||||||||||||||||||||||
| All Public Companies |
11.7 | % | 129.0 | % | 7.4 | % | 0 | -1 | 2 | -5 | 1 | 3 | ||||||||||||||||||||||||||||
| State of NY |
8.5 | % | 116.9 | % | 6.4 | % | -5 | -1 | -1 | -3 | 5 | -1 | ||||||||||||||||||||||||||||
| Comparable Group |
||||||||||||||||||||||||||||||||||||||||
| Average |
12.1 | % | 109.0 | % | 6.1 | % | -5 | 1 | 1 | -9 | 1 | 2 | ||||||||||||||||||||||||||||
| Median |
10.5 | % | 107.0 | % | 5.9 | % | -5 | 4 | 1 | -4 | -2 | 2 | ||||||||||||||||||||||||||||
| Comparable Group |
||||||||||||||||||||||||||||||||||||||||
| BYBK |
Bay Bancorp, Inc. |
MD | 10.1 | % | 107.8 | % | 5.0 | % | 16 | -40 | 14 | -31 | -16 | -13 | ||||||||||||||||||||||||||
| CSBK |
Clifton Bancorp Inc. |
NJ | 22.1 | % | 122.3 | % | 5.9 | % | -6 | -2 | -2 | -1 | -4 | 2 | ||||||||||||||||||||||||||
| CWAY |
Coastway Bancorp, Inc. |
RI | 10.6 | % | 105.4 | % | 7.0 | % | -15 | 1 | -2 | 2 | -4 | 3 | ||||||||||||||||||||||||||
| ESBK |
Elmira Savings Bank |
NY | 7.6 | % | 103.7 | % | 7.5 | % | -3 | 8 | -5 | -1 | 25 | -3 | ||||||||||||||||||||||||||
| HBK |
Hamilton Bancorp, Inc. |
MD | 10.3 | % | 105.1 | % | 8.7 | % | 10 | 4 | 1 | -29 | 21 | 4 | ||||||||||||||||||||||||||
| MLVF |
Malvern Bancorp, Inc. |
PA | 10.9 | % | 108.2 | % | 4.4 | % | -3 | 10 | 3 | -7 | 2 | 2 | ||||||||||||||||||||||||||
| PBHC |
Pathfinder Bancorp, Inc. |
NY | 7.2 | % | 103.4 | % | 5.5 | % | -33 | 14 | 1 | -8 | -13 | 6 | ||||||||||||||||||||||||||
| PBBI |
PB Bancorp, Inc. |
CT | 15.1 | % | 114.1 | % | 5.9 | % | 6 | 6 | 6 | -1 | 0 | 8 | ||||||||||||||||||||||||||
| PBIP |
Prudential Bancorp, Inc. |
PA | 19.2 | % | 114.1 | % | 8.5 | % | -10 | 2 | 1 | 4 | -4 | 15 | ||||||||||||||||||||||||||
| WEBK |
Wellesley Bancorp, Inc. |
MA | 7.9 | % | 106.2 | % | 2.7 | % | -11 | 4 | -2 | -16 | 6 | -7 | ||||||||||||||||||||||||||
NA=Change is greater than 100 basis points during the quarter.
| Source: | SNL Financial LC. and RP® Financial, LC. calculations. The information provided in this table has been obtained from sources we believe are reliable, but we cannot guarantee the accuracy or completeness of such information. |
Copyright (c) 2017 by RP® Financial, LC.
| RP® Financial, LC. | PEER GROUP ANALYSIS | |
| III.14 |
Group, as the result of the increases that will be realized in Bank’s equity-to-assets and IEA/IBL ratios following the infusion of stock proceeds.
To analyze interest rate risk associated with the net interest margin, we reviewed quarterly changes in net interest income as a percent of average assets for Ponce Bank and the Peer Group. In general, the comparative fluctuations in the Bank’s and the Peer Group’s net interest income ratios implied that the interest rate risk associated with the Bank’s net interest margin was greater than the Peer Group’s implied net interest margin interest rate risk, based on the interest rate environment that prevailed during the period covered in Table 3.5. The stability of the Bank’s net interest margin should be enhanced by the infusion of stock proceeds, as interest rate sensitive liabilities will be funding a lower portion of Ponce Bank’s assets and the proceeds will be substantially deployed into interest-earning assets.
Credit Risk
Overall, based on a comparison of credit risk measures, the Bank’s implied credit risk exposure was viewed to be greater relative to the Peer Group’s credit risk exposure. As shown in Table 3.6, the Bank’s ratios for non-performing/assets and non-performing loans/loans equaled 3.29% and 3.77%, respectively, versus comparable measures of 1.33% and 1.73% for the Peer Group. It should be noted that the measures for non-performing assets and non-performing loans in Table 3.6 include accruing loans that are classified as troubled debt restructurings, which accounted for slightly more than 70% of the Bank’s non-performing loan balance at March 31, 2017. The Bank’s and the Peer Group’s loss reserves as a percent of non-performing loans equaled 40.06% and 132.56%, respectively. Loss reserves maintained as percent of loans receivable equaled 1.51% for the Bank, versus 0.82% for the Peer Group. Net loan charge-offs were a larger factor for the Peer Group, as net loan charge-offs for the Peer Group equaled 0.08% loans. Comparatively, the Bank recorded a net recovery equal to 0.05% of loans.
Summary
Based on the above analysis, RP Financial concluded that the Peer Group forms a reasonable basis for determining the pro forma market value of the Bank. Such general characteristics as asset size, capital position, interest-earning asset composition, funding composition, core earnings measures, loan composition, credit quality and exposure to interest
| RP® Financial, LC. | Peer Group Analysis | |
| Page III.15 |
Table 3.6
Credit Risk Measures and Related Information
Comparable Institution Analysis
As of December 31, 2016
| REO/ Assets |
NPAs & 90+Del/ Assets (1) |
Adj NPAs & 90+Del/ Assets (2) |
NPLs/ Loans (1) |
Rsrves/ Loans HFI |
Rsrves/ NPLs (1) |
Rsrves/ NPAs & 90+Del (1) |
Net Loan Chargeoffs (3) |
NLCs/ Loans |
||||||||||||||||||||||||||||||||
| (%) | (%) | (%) | (%) | (%) | (%) | (%) | ($000) | (%) | ||||||||||||||||||||||||||||||||
| Ponce Bank |
NY | |||||||||||||||||||||||||||||||||||||||
| March 31, 2017 |
0.00 | % | 3.29 | % | 0.98 | % | 3.77 | % | 1.51 | % | 40.06 | % | 40.06 | % | -$ | 366 | -0.05 | % | ||||||||||||||||||||||
| All Public Companies |
||||||||||||||||||||||||||||||||||||||||
| Averages |
0.07 | % | 0.98 | % | 0.66 | % | 1.23 | % | 0.97 | % | 124.02 | % | 110.03 | % | $ | 1,507 | 0.05 | % | ||||||||||||||||||||||
| Medians |
0.03 | % | 0.82 | % | 0.48 | % | 1.02 | % | 0.92 | % | 89.91 | % | 81.12 | % | $ | 168 | 0.02 | % | ||||||||||||||||||||||
| State of NY |
||||||||||||||||||||||||||||||||||||||||
| Averages |
0.08 | % | 0.94 | % | 0.60 | % | 1.19 | % | 0.78 | % | 112.43 | % | 96.00 | % | $ | 874 | 0.04 | % | ||||||||||||||||||||||
| Medians |
0.06 | % | 0.88 | % | 0.66 | % | 1.08 | % | 0.73 | % | 84.75 | % | 80.56 | % | $ | 392 | 0.00 | % | ||||||||||||||||||||||
| Comparable Group |
||||||||||||||||||||||||||||||||||||||||
| Averages |
0.10 | % | 1.33 | % | 1.02 | % | 1.73 | % | 0.82 | % | 132.56 | % | 126.57 | % | $ | 301 | 0.08 | % | ||||||||||||||||||||||
| Medians |
0.07 | % | 1.14 | % | 0.75 | % | 1.49 | % | 0.92 | % | 60.87 | % | 49.68 | % | $ | 249 | 0.05 | % | ||||||||||||||||||||||
| Comparable Group |
||||||||||||||||||||||||||||||||||||||||
| BYBK |
Bay Bancorp, Inc. |
MD | 0.20 | % | 2.55 | % | 2.47 | % | 2.49 | % | 0.58 | % | 23.16 | % | 17.83 | % | $ | 339 | 0.08 | % | ||||||||||||||||||||
| CSBK |
Clifton Bancorp Inc. |
NJ | 0.05 | % | 0.39 | % | 0.30 | % | 0.49 | % | 0.59 | % | 120.28 | % | 103.91 | % | $ | 322 | 0.04 | % | ||||||||||||||||||||
| CWAY |
Coastway Bancorp, Inc. |
RI | 0.07 | % | 2.08 | % | 0.79 | % | 2.35 | % | 0.47 | % | 19.22 | % | 18.62 | % | $ | 176 | 0.03 | % | ||||||||||||||||||||
| ESBK |
Elmira Savings Bank |
NY | 0.05 | % | 0.92 | % | 0.92 | % | 1.09 | % | 0.94 | % | 84.75 | % | 80.56 | % | $ | 372 | 0.08 | % | ||||||||||||||||||||
| HBK |
Hamilton Bancorp, Inc. |
MD | 0.09 | % | 1.08 | % | 0.70 | % | 1.49 | % | 0.62 | % | 41.90 | % | 38.32 | % | $ | 1,247 | 0.44 | % | ||||||||||||||||||||
| MLVF |
Malvern Bancorp, Inc. |
PA | 0.00 | % | 0.38 | % | 0.22 | % | 0.48 | % | 0.92 | % | 190.00 | % | 183.19 | % | $ | 6 | 0.00 | % | ||||||||||||||||||||
| PBHC |
Pathfinder Bancorp, Inc. |
NY | 0.08 | % | 1.46 | % | 0.72 | % | 2.10 | % | 1.27 | % | 60.40 | % | 57.11 | % | $ | 412 | 0.09 | % | ||||||||||||||||||||
| PBBI |
PB Bancorp, Inc. |
CT | 0.37 | % | 1.20 | % | 1.20 | % | 1.50 | % | 0.92 | % | 61.34 | % | 42.26 | % | $ | 141 | 0.06 | % | ||||||||||||||||||||
| PBIP |
Prudential Bancorp, Inc. |
PA | 0.10 | % | 3.17 | % | 2.83 | % | 5.13 | % | 0.98 | % | 19.09 | % | 18.49 | % | ($ | 125 | ) | -0.04 | % | |||||||||||||||||||
| WEBK |
Wellesley Bancorp, Inc. |
MA | 0.00 | % | 0.11 | % | 0.09 | % | 0.13 | % | 0.93 | % | 705.45 | % | 705.45 | % | $ | 117 | 0.02 | % | ||||||||||||||||||||
| (1) | Includes TDRs for the Company and the Peer Group. |
| (2) | Excludes TDRs that are in compliance with their modified terms. |
| (3) | Net loan chargeoffs are shown on a last twelve month basis. |
| Source: | SNL Financial, LC and RP® Financial, LC. calculations. The information provided in this table has been obrained from sources we believe are reliable, but we cannot guarantee the accuracy or completeness of such information. |
Copyright (c) 2017 by RP® Financial, LC.
| RP® Financial, LC. | PEER GROUP ANALYSIS | |
| III.16 |
rate risk all tend to support the reasonability of the Peer Group from a financial standpoint. Those areas where differences exist will be addressed in the form of valuation adjustments to the extent necessary.
| RP® Financial, LC. | VALUATION ANALYSIS | |
| IV.1 |
IV. VALUATION ANALYSIS
Introduction
This chapter presents the valuation analysis and methodology prepared pursuant to the regulatory guidelines, and valuation adjustments and assumptions used to determine the estimated pro forma market value of the common stock to be issued in conjunction with the Bank’s minority stock offering.
Appraisal Guidelines
The federal regulatory appraisal guidelines required by the OCC, FRB, the FDIC and state banking agencies specify the pro forma market value methodology for estimating the pro forma market value of an institution. Pursuant to this methodology: (1) a peer group of comparable publicly-traded institutions is selected; (2) a financial and operational comparison of the subject company to the peer group is conducted to discern key differences; and (3) a valuation analysis in which the pro forma market value of the subject company is determined based on the market pricing of the peer group as of the date of valuation, incorporating valuation adjustments for key differences. In addition, the pricing characteristics of recent conversions, both at conversion and in the aftermarket, must be considered. Given the unique differences in the pricing characteristics of publicly-traded MHCs relative to fully-converted thrift stocks, we have also reviewed the pricing characteristics of publicly-traded MHCs on a fully-converted basis.
RP Financial Approach to the Valuation
The valuation analysis herein complies with such regulatory approval guidelines. Accordingly, the valuation incorporates a detailed analysis based on the Peer Group, discussed in Chapter III, which constitutes “fundamental analysis” techniques. Additionally, the valuation incorporates a “technical analysis” of recently completed conversions, including closing pricing and aftermarket trading of such offerings. It should be noted that these valuation analyses cannot possibly fully account for all the market forces which impact trading activity and pricing characteristics of a stock on a given day.
| RP® Financial, LC. | VALUATION ANALYSIS | |
| IV.2 |
The pro forma market value determined herein is a preliminary value for the Company’s to-be-issued stock. Throughout the stock issuance process, RP Financial will: (1) review changes in the Bank’s operations and financial condition; (2) monitor the Bank’s operations and financial condition relative to the Peer Group to identify any fundamental changes; (3) monitor the external factors affecting value including, but not limited to, local and national economic conditions, interest rates, and the stock market environment, including the market for thrift stocks; and (4) monitor pending conversion offerings, both regionally and nationally. If material changes should occur prior to the close of the offering, RP Financial will evaluate if updated valuation reports should be prepared reflecting such changes and their related impact on value, if any. RP Financial will also prepare a final valuation update at the closing of the offering to determine if the prepared valuation analysis and resulting range of value continues to be appropriate.
The appraised value determined herein is based on the current market and operating environment for the Bank and for all thrifts. Subsequent changes in the local and national economy, the legislative and regulatory environment, the stock market, interest rates, and other external forces (such as natural disasters or major world events), which may occur from time to time (often with great unpredictability) may materially impact the market value of all thrift stocks, including Ponce Bank’s value, the market value of the stocks of public MHC institutions, or Ponce Bank’s value alone. To the extent a change in factors impacting the Bank’s value can be reasonably anticipated and/or quantified, RP Financial has incorporated the estimated impact into its analysis.
Valuation Analysis
A fundamental analysis discussing similarities and differences relative to the Peer Group was presented in Chapter III. The following sections summarize the key differences between the Bank and the Peer Group and how those differences affect the pro forma valuation. Emphasis is placed on the specific strengths and weaknesses of the Bank relative to the Peer Group in such key areas as financial condition, profitability, growth and viability of earnings, asset growth, primary market area, dividends, liquidity of the shares, marketing of the issue, management, and the effect of government regulations and/or regulatory reform. We have also considered the market for thrift stocks, in particular new issues, to assess the impact on value of Ponce Bank coming to market at this time.
| RP® Financial, LC. | VALUATION ANALYSIS | |
| IV.3 |
| 1. | Financial Condition |
The financial condition of an institution is an important determinant in pro forma market value because investors typically look to such factors as liquidity, capital, asset composition and quality, and funding sources in assessing investment attractiveness. The similarities and differences in the Bank’s and the Peer Group’s financial strengths are noted as follows:
| • | Overall A/L Composition. Loans funded by retail deposits were the primary components of both Ponce Bank’s and the Peer Group’s balance sheets. The Bank’s interest-earning asset composition exhibited a higher concentration of loans and a greater degree of diversification into higher risk types of loans. Overall, the Bank’s asset composition provided for a higher yield earned on interest-earning assets and a higher risk weighted assets-to-assets ratio in comparison to the Peer Group’s ratios. Ponce Bank’s funding composition reflected a higher level of deposits and a lower level of borrowings in comparison to the Peer Group’s ratios, which provided the Bank with a slightly higher cost of funds than maintained by the Peer Group. Overall, as a percent of assets, the Bank maintained slightly higher levels of interest-earning assets and interest-bearing liabilities relative to the comparable ratios for the Peer Group, which translated into a similar IEA/IBL ratio for the Bank and the Peer Group. After factoring in the impact of the net stock proceeds, the Bank’s IEA/IBL ratio will be more comparable to or exceed the Peer Group’s ratio. On balance, RP Financial concluded that asset/liability composition was a neutral factor in our adjustment for financial condition. |
| • | Credit Quality. The Bank’s ratios for non-performing assets as a percent of assets and non-performing loans as a percent of loans were higher than the comparable ratios for the Peer Group, which was due the Bank’s comparatively higher balance of accruing loans classified as troubled debt restructurings. In comparison to the Peer Group, the Bank maintained lower loss reserves as a percent of non-performing loans and higher reserves as a percent of loans. Net loan charge-offs as a percent of loans were higher for the Peer Group, as the Bank recorded a net recovery during the twelve months ended March 31, 2017. The Bank’s risk weighted assets-to-assets ratio was higher than the Peer Group’s ratio. Overall, RP Financial concluded that credit quality was a slightly negative factor in our adjustment for financial condition. |
| • | Balance Sheet Liquidity. The Peer Group operated with a higher level of cash and investment securities relative to the Bank (22.39% of assets versus 8.97% for the Bank). Following the infusion of stock proceeds, the Bank’s cash and investments ratio is expected to increase as a portion of the proceeds retained at the holding company level will initially be held in short-term liquid funds. The Bank’s future borrowing capacity was considered to be slightly greater than the Peer Group’s borrowing capacity, based on the lower level of borrowings that are funding the Bank’s assets. Overall, RP Financial concluded that balance sheet liquidity was a neutral factor in our adjustment for financial condition. |
| • | Funding Liabilities. The Bank’s interest-bearing funding composition reflected a higher concentration of deposits and a lower level of borrowings relative to the |
| RP® Financial, LC. | VALUATION ANALYSIS | |
| IV.4 |
| comparable Peer Group ratios, which translated into a higher cost of funds for the Bank. The Bank’s ratio of total interest-bearing liabilities as a percent of assets was slightly above the Peer Group’s ratio. Following the stock offering, the increase in the Bank’s capital position will reduce the level of interest-bearing liabilities funding the Bank’s assets to a level that is lower than the Peer Group’s ratio of interest-bearing liabilities as a percent of assets. Overall, RP Financial concluded that funding liabilities were a neutral factor in our adjustment for financial condition. |
| • | Capital. The Peer Group currently operates with a slightly higher equity-to-assets ratio than the Bank. Following the stock offering, Ponce Bank’s pro forma capital position will exceed the Peer Group’s equity-to-assets ratio. On balance, RP Financial concluded that capital strength was a slightly positive factor in our adjustment for financial condition. |
On balance, Ponce Bank’s balance sheet strength was considered to be comparable to the Peer Group’s balance sheet strength and, thus, no adjustment was applied for the Bank’s financial condition.
| 2. | Profitability, Growth and Viability of Earnings |
Earnings are a key factor in determining pro forma market value, as the level and risk characteristics of an institution’s earnings stream and prospects to generate future earnings heavily influence the multiple that the investment community will pay for earnings. The major factors considered in the valuation are described below.
| • | Reported Earnings. The Bank’s reported earnings were lower than the Peer Group’s on a ROAA basis (0.16% of average assets versus 0.54% for the Peer Group). The Peer Group maintained more favorable ratios for non-interest operating income, operating expenses and effective tax rate, which were partially offset by the Bank’s more favorable ratios for loan loss provisions and net interest income. Reinvestment of stock proceeds into interest-earning assets will serve to increase the Bank’s earnings, with the benefit of reinvesting proceeds expected to be somewhat offset by higher operating expenses associated with operating as a publicly-traded company and the implementation of stock benefit plans. Overall, the Bank’s reported earnings were considered to be less favorable than the Peer Group’s reported earnings and, thus, RP Financial concluded that this was a moderately negative factor in our adjustment for profitability, growth and viability of earnings. |
| • | Core Earnings. Net interest income, operating expenses, non-interest operating income and loan loss provisions were reviewed in assessing the relative strengths and weaknesses of the Bank’s and the Peer Group’s core earnings. In these measures, the Bank operated with a higher net interest income ratio, a higher operating expense ratio and a lower level of non-interest operating income. The Bank’s higher net interest income and operating expense ratios translated into a lower expense coverage ratio in comparison to the Peer Group’s ratio (equal to 1.00x versus 1.10x for the Peer Group). Similarly, the Bank’s |
| RP® Financial, LC. | VALUATION ANALYSIS | |
| IV.5 |
| efficiency ratio of 91.57% was less favorable than the Peer Group’s efficiency ratio of 77.64%. Loan loss provisions had a larger impact on the Peer Group’s earnings. Overall, these measures, as well as the expected earnings benefits the Bank should realize from the redeployment of stock proceeds into interest-earning assets and leveraging of post-conversion capital, which will be somewhat negated by expenses associated with the stock benefit plans and operating as a publicly-traded company, indicate that the Bank’s pro forma core earnings will remain less favorable than the Peer Group’s core earnings. Therefore, RP Financial concluded that this was a moderately negative factor in our adjustment for profitability, growth and viability of earnings. |
| • | Interest Rate Risk. Quarterly changes in the Bank’s and the Peer Group’s net interest income to average assets ratios indicated that a greater degree of volatility was associated with the Bank’s net interest margin. Other measures of interest rate risk, such as capital levels, IEA/IBL ratios and levels of non-interest earning assets were fairly similar for the Bank and the Peer Group. On a pro forma basis, the infusion of stock proceeds can be expected to provide the Bank with equity-to-assets and IEA/ILB ratios that exceed the Peer Group ratios, as well as enhance the stability of the Bank’s net interest margin. Accordingly, on balance, this was a neutral factor in our adjustment for profitability, growth and viability of earnings. |
| • | Credit Risk. Loan loss provisions were a slightly larger factor in the Peer Group’s earnings (0.14% of average assets versus 0.07% of average assets for the Bank). In terms of future exposure to credit quality related losses, the Bank maintained a higher concentration of assets in loans and greater diversification into higher risk types of loans. The Bank’s credit quality measures generally implied a higher degree of credit risk exposure relative to the comparable credit quality measures indicated for the Peer Group. Overall, RP Financial concluded that credit risk was a slightly negative factor in our adjustment for profitability, growth and viability of earnings. |
| • | Earnings Growth Potential. Several factors were considered in assessing earnings growth potential. First, the Bank currently maintains a higher interest rate spread than the Peer Group, which would tend to facilitate a continuation of a higher net interest margin for the Bank goring forward. Second, the infusion of stock proceeds will provide the Bank with greater growth potential through leverage than currently maintained by the Peer Group. Third, the Bank’s lower ratios of non-interest operating income and higher operating expenses were viewed as disadvantages to sustain earnings growth during periods when net interest margins come under pressure as the result of adverse changes in interest rates. Overall, earnings growth potential was considered to be a neutral factor in our adjustment for profitability, growth and viability of earnings. |
| • | Return on Equity. Currently, the Bank’s core ROE is lower than the Peer Group’s core ROE. As the result of the increase in capital that will be realized from the infusion of net stock proceeds into the Bank’s equity, the Bank’s pro forma return equity on a core earnings basis will remain lower than the Peer Group’s core ROE. Accordingly, this was a moderately negative factor in the adjustment for profitability, growth and viability of earnings. |
| RP® Financial, LC. | VALUATION ANALYSIS | |
| IV.6 |
On balance, Ponce Bank’s pro forma earnings strength was considered to be less favorable than the Peer Group’s and, thus, a moderate downward adjustment was applied for profitability, growth and viability of earnings.
| 3. | Asset Growth |
Comparative asset growth rates for the Bank and the Peer Group showed a 9.28% increase in the Bank’s assets, versus a 16.53% increase in the Peer Group’s assets. The Peer Group’s stronger asset growth was in part attributable to acquisition related growth. Asset growth for the Bank was sustained by a 14.79% increase in loans, which was partially funded with cash and investments. The Peer Group’s asset growth was primarily sustained by a 21.89% increase in loans and also included an increase in cash and investments. Overall, net of the Peer Group’s acquisition related growth the Bank’s recent asset growth trends would tend to be viewed fairly comparable to the Peer Group’s asset growth trends in terms of supporting future earnings growth. On a pro forma basis, the Bank’s tangible equity-to-assets ratio will exceed the Peer Group’s tangible equity-to-assets ratio, providing the Bank with greater leverage capacity than maintained by the Peer Group. On balance, a slight upward adjustment was applied for asset growth.
| 4. | Primary Market Area |
The general condition of an institution’s market area has an impact on value, as future success is in part dependent upon opportunities for profitable activities in the local market served. Ponce Bank serves the New York metropolitan area through the headquarters office and 13 full service branches. Operating in a densely populated market area provides the Bank with growth opportunities, but such growth must be achieved in a highly competitive market environment. The Bank competes against significantly larger institutions that provide a larger array of services and have significantly larger branch networks than maintained by Ponce Bank.
The Peer Group companies generally operate in markets with smaller populations compared to Bronx County. Population growth for the primary market area counties served by the Peer Group companies reflected a range of growth rates, but, overall, population growth rates in the markets served by the Peer Group companies were less than Bronx County’s recent historical and projected population growth rates. Bronx County has a lower per capita income compared to the Peer Group’s average per capita income and, on average, the Peer Group’s primary market area counties were more affluent markets within their respective states
| RP® Financial, LC. | VALUATION ANALYSIS | |
| IV.7 |
compared to Bronx County’s per capita income as a percent of New York’s per capita income (99.2% for the Peer Group versus 51.7% for Bronx County). The average and median deposit market shares maintained by the Peer Group companies were greater than the Bank’s market share of deposits in Bronx County. Overall, the degree of competition faced by the Peer Group companies was viewed as less than the Bank’s competitive environment in Bronx County, while the growth potential in the markets served by the Peer Group companies was for the most part viewed to be slightly less favorable than provided by the Bank’s primary market area. Summary demographic and deposit market share data for the Bank and the Peer Group companies is provided in Exhibit III-4. As shown in Table 4.1, the average unemployment rate for the primary market area counties served by the Peer Group companies was below the unemployment rate reflected for Bronx County. On balance, we concluded that no adjustment was appropriate for the Bank’s market area.
Table 4.1
Market Area Unemployment Rates
Ponce Bank and the Peer Group Companies (1)
| County | March 2017 Unemployment |
|||||||
| Ponce Bank - NY |
Bronx | 5.7 | % | |||||
| Peer Group Average |
4.8 | |||||||
| The Peer Group |
||||||||
| Bay Bancorp, Inc. – MD |
Howard | 3.2 | ||||||
| Clifton Bancorp, Inc. - NJ |
Passaic | 5.4 | ||||||
| Coastway Bancorp, Inc. – RI |
Kent | 4.1 | ||||||
| Elmira Savings Bank – NY |
Chemung | 5.5 | ||||||
| Hamilton Bancorp, Inc. – MD |
Baltimore | 4.6 | ||||||
| Malvern Bancorp, Inc. - PA |
Chester | 3.5 | ||||||
| Pathfinder Bancorp, Inc. – NY |
Ocean | 6.5 | ||||||
| PB Bancorp, Inc. – CT |
Windham | 5.7 | ||||||
| Prudential Bancorp, Inc. – PA |
Philadelphia | 6.0 | ||||||
| Wellesley Bancorp, Inc. – MA |
Norfolk | 3.3 | ||||||
| (1) | Unemployment rates are not seasonally adjusted. |
| Source: | SNL Financial, LC; Department of Labor. |
| 5. | Dividends |
At this time the Bank has not established a dividend policy. Future declarations of dividends by the Board of Directors will depend upon a number of factors, including investment
| RP® Financial, LC. | VALUATION ANALYSIS | |
| IV.8 |
opportunities, growth objectives, financial condition, profitability, tax considerations, minimum capital requirements, regulatory limitations, stock market characteristics and general economic conditions.
Six out of the ten Peer Group companies pay regular cash dividends, with implied dividend yields ranging from 0.59% to 4.42%. The average dividend yield on the stocks of the Peer Group institutions equaled 1.00% as of May 5, 2017. Comparatively, as of May 5, 2017, the average dividend yield on the stocks of all fully-converted publicly-traded thrifts equaled 1.66%.
Our valuation adjustment for dividends for Ponce Bank also considered the regulatory policy with regard to payment of dividends to the MHC. Under current FRB and OCC policy, any dividends declared by the Company would be required to be paid to all shareholders. Accordingly, dividends paid by the Company would increase the amount of assets held by the MHC, after adjusting for applicable income taxes, and, thereby, increase the implied dilution incurred by the minority shareholders in a second-step conversion pursuant to the calculation to account for net assets held by the MHC in a second-step offering.
Overall, while the Bank has not established a definitive dividend policy prior to its stock offering, the Bank will have the capacity to pay a dividend comparable to the Peer Group’s average dividend yield based on pro forma earnings and capitalization. At the same time, dividend payments retained by the MHC would increase the implied dilution to minority shareholders in a second-step offering. On balance, we concluded that a slight downward adjustment was warranted for purposes of the Bank’s dividend policy.
| 6. | Liquidity of the Shares |
The Peer Group is by definition composed of companies that are traded in the public markets. All ten of the Peer Group members trade on the NASDAQ system. Typically, the number of shares outstanding and market capitalization provides an indication of how much liquidity there will be in a particular stock. The market capitalization of the Peer Group companies ranged from $51.6 million to $375.5 million as of May 5, 2017, with average and median market values of $117.6 million and $77.9 million, respectively. The shares issued and outstanding of the Peer Group companies ranged from 2.5 million to 23.0 million, with average and median shares outstanding of 7.5 million and 5.5 million, respectively. The Bank’s stock offering is expected to have a pro forma public market value and shares outstanding of public
| RP® Financial, LC. | VALUATION ANALYSIS | |
| IV.9 |
shareholders that will be similar to the median market value and average shares outstanding indicated for the Peer Group companies. Like all of the Peer Group companies, the Bank’s stock will be quoted on the NASDAQ following the stock offering. Overall, we anticipate that the Bank’s public stock will have a comparable trading market as the Peer Group companies on average and, therefore, concluded no adjustment was necessary for this factor.
| 7. | Marketing of the Issue |
Three separate markets exist for thrift stocks: (1) the after-market for public companies, both fully-converted stock companies and MHCs, in which trading activity is regular and investment decisions are made based upon financial condition, earnings, capital, ROE, dividends and future prospects; (2) the new issue market in which converting thrifts are evaluated on the basis of the same factors but on a pro forma basis without the benefit of prior operations as a publicly-held company and stock trading history; and (3) the thrift acquisition market. All three of these markets were considered in the valuation of the Bank’s to-be-issued stock.
| A. | The Public Market |
The value of publicly-traded thrift stocks is easily measurable, and is tracked by most investment houses and related organizations. Exhibit IV-1 provides pricing and financial data on all publicly-traded thrifts. In general, thrift stock values react to market stimuli such as interest rates, inflation, perceived industry health, projected rates of economic growth, regulatory issues and stock market conditions in general. Exhibit IV-2 displays historical stock market trends for various indices and includes historical stock price index values for thrifts and commercial banks. Exhibit IV-3 displays various stock price indices as of May 5, 2017.
In terms of assessing general stock market conditions, the overall stock market has trended higher in recent quarters. Stocks traded unevenly at the start of the fourth quarter of 2016, as investors reacted to third quarter earnings reports that had varied results. Consumer shares weighed on the broader stock market in the second half of October, following a string of disappointing earnings reports coming out of the consumer sector and a downbeat outlook for the rest of 2016. The Dow Jones Industrial Average (the “DJIA”) fell for a third month in a row to close out October, with a monthly decline of 0.9%. Stocks extended their losing streak in early-November, as investors reacted to tightening polls for the presidential election. News of the FBI
| RP® Financial, LC. | VALUATION ANALYSIS | |
| IV.10 |
finding no new evidence to warrant charges against Democratic candidate Hillary Clinton sent stocks sharply higher the day before the presidential election. However, investors embraced Trump’s election, as stocks surged higher based on expectations for reduced corporate taxes and regulation and greater infrastructure spending under a Trump administration. Following seven consecutive sessions of closing higher, the DJIA closed down in mid-November 2016 as investors pared gains in shares that led the post-election stock market rally. The post-election stock market rally resumed during the second half of November, as U.S. stocks notched new record highs. Overall, the DJIA finished up 5.4% for the month of November. Led by gains in financial shares, stocks continued to surge higher during the first half of December. Stocks retreated after the Federal Reserve raised its target rate by a quarter of a percentage point at the conclusion of its mid-December policy meeting. After trading in a narrow range heading into late-December, stocks slumped in the final trading days of 2016. However, overall, the major U.S. stock indexes posted solid gains for 2016, with the DJIA and NASDAQ increasing 13.4% and 7.5%, respectively, in 2016.
Bank and healthcare stocks led the stock market higher at the start of 2017, as the DJIA approached the 20000 milestone in the first week of trading during 2017. Stocks traded in a narrow range heading into the fourth quarter earnings season and then edged lower in mid-January, as investors weighed both the timing and ultimate impact of expected policy changes from the Trump administration. The DJIA closed above 20000 for the first time in late-January, as President Trump’s moves during his first week in office to promote infrastructure spending and cut regulation propelled stocks higher. Stocks stumbled at the end of January, as President Trump’s restriction on immigration took a toll on the stock market’s optimism. The broader stock market rebounded during the first half of February, as the major U.S. stock indexes moved to fresh highs in response to President Trump taking action to scale back financial regulations and advancing campaign promises to lower taxes. Data pointing towards continuing growth in the U.S. economy sustained the bull market in the second half of February 2017, as the DJIA notched twelve consecutive highs through February 27, 2017. The streak of consecutive gains in the DJIA ended on the last day of February, which was followed by a surge in U.S. stock market indexes at the start of March. On March 1, 2017, the DJIA posted a gain of over 300 points and closed above 21000 for the first time as investors embraced optimism from President Trump’s State of the Union address and signals from the Federal Reserve that they were growing confident enough in the U.S. economy to raise short-term interest rates in the near future. Stocks retreated following the record breaking day for the DJIA, with energy shares
| RP® Financial, LC. | VALUATION ANALYSIS | |
| IV.11 |
leading the decline as a supply glut of oil sent oil prices for lower for seven consecutive sessions going into mid-March. The Federal Reserve’s decision to raise its benchmark federal funds rate by a quarter helped to propel stocks higher at the conclusion of its mid-March meeting. Stocks reversed course during the second half of March, as the DJIA fell for eight consecutive trading sessions. Stocks that led the post-election rally, such as financial and infrastructure companies, were among the biggest decliners, amid political uncertainty over the fate of President Trump’s pro-business growth agenda and deregulation of the financial industry after Republicans pulled their healthcare bill from the House floor due to lack of adequate support.
The downward trend in the broader stock market continued during the first half of April 2017, with geopolitical uncertainty and weaker-than-expected job growth reflected in the March employment contributing to the pullback. Stocks rallied during the second half of April, led by a rebound in financial and industrial shares. Easing geopolitical concerns, a series of upbeat first quarter earnings reports and a victory by a centrist candidate in the first round of France’s presidential election were among the factors that supported the rally. The broader market traded in a narrow range at the end of April and into early-May, as gains in technology and industrial companies offset losses in the energy sector. A slightly stronger-than-expected jobs report for April helped to lift the S&P 500 index and the NASDAQ Composite index to record highs at the close of the first week of May. On May 5, 2017, the DJIA closed at 21006.94, an increase of 18.4% from one year ago and an increase of 6.3% year-to-date, and the NASDAQ Composite index closed at 6100.76, an increase of 28.8% from one year ago and an increase of 13.3% year-to-date. The S&P 500 Index closed at 2399.29 on May 5, 2017, an increase of 16.6% from one year ago and an increase of 7.7% year-to-date.
The market for thrift stocks has also generally trended higher in recent quarters. In advance of third quarter earnings reports, thrift shares remained stable during the first half of October 2016. Financial shares led the stock market higher heading into the second half of October, in light of third quarter earnings reports generally offering fresh evidence of profitability improving for banks. Thrift stocks were largely trendless through the end of October and then pulled back along with the broader stock market in early-November. Bank and thrift stocks were among the strongest performers in leading the post-election stock market rally, reflecting investor expectations for reduced regulation of the banking sector. Financial shares retreated along with the broader stock market following the mid-December rate hike by the Federal Reserve. While thrift shares traded in a tight range in the closing weeks of 2016, the SNL Index for all publicly-traded thrifts finished 2016 with a gain of 19.49% in which the substantial portion of the gains occurred following the presidential election.
| RP® Financial, LC. | VALUATION ANALYSIS | |
| IV.12 |
Financial shares led the stock market higher at the start of 2017, which was followed by a pullback as investors dumped shares of financial companies and bought government bonds. Despite generally favorable fourth quarter earnings reports posted by the money center banks, the downturn in financial shares continued heading into the second half of January. Financial shares paralleled trends in the broader stock market in late-January and then led the stock market rally in early-February following action by President Trump to scale back financial regulations. Financial shares also led the market lower heading into mid-February, as investors reacted to a flattening of the yield curve. Data indicating the U.S. economy was poised for additional growth contributed to thrift stocks rallying along with the broader stock market during the second half of February. Financial shares spiked higher at the start of March, which was followed by general downward trend in thrift stocks through the first half of March. Thrift shares declined sharply along with the broader stock market heading into the close of the first quarter, amid growing uncertainty of how successful the Trump administration would be in pushing its agenda through Congress. A fresh round of upbeat economic data contributed to a rebound in thrift stocks at the close of the first quarter.
Financial shares led the broader stock market lower during the first half of April 2017, as investors pulled back from sectors that led the post-election rally in favor of technology stocks. Some favorable first quarter earnings reports posted by large banks and deal activity in the financial sector bolstered thrift stocks in the final week of April. Thrift shares traded in tight range throughout the first week of May. On May 5, 2017, the SNL Index for all publicly-traded thrifts closed at 911.9, an increase of 16.9% from one year ago and a decrease of 5.7% year-to-date.
| B. | The New Issue Market |
In addition to thrift stock market conditions in general, the new issue market for converting thrifts is also an important consideration in determining the Bank’s pro forma market value. The new issue market is separate and distinct from the market for seasoned thrift stocks in that the pricing ratios for converting issues are computed on a pro forma basis, specifically: (1) the numerator and denominator are both impacted by the conversion offering amount, unlike existing stock issues in which price change affects only the numerator; and (2) the pro forma
| RP® Financial, LC. | VALUATION ANALYSIS | |
| IV.13 |
pricing ratio incorporates assumptions regarding source and use of proceeds, effective tax rates, stock plan purchases, etc. which impact pro forma financials, whereas pricing for existing issues are based on reported financials. The distinction between pricing of converting and existing issues is perhaps no clearer than in the case of the price/book (“P/B”) ratio in that the P/B ratio of a converting thrift will typically result in a discount to book value whereas in the current market for existing thrifts the P/B ratio often reflects a premium to book value. Therefore, it is appropriate to also consider the market for new issues, both at the time of the conversion and in the aftermarket.
As shown in Table 4.2, one standard conversion offering and one first-step MHC offering were completed during the past three months. For purposes of our analysis, the first-step MHC offering is considered to be more relevant. The first-step MHC offering was completed by Community First Bancshares of Georgia, which completed its mutual holding company offering on April 28, 2017. Community First Bancshares’ offering was closed at the top of its offering range equal to gross proceeds of $34.7 million and a pro forma fully-converted price/tangible book ratio of 68.5%. After the first week of trading, Community First Bancshares’ stock price was up 33.7% from its IPO price.
Shown in Table 4.3 is the current pricing ratios for PCSB Financial Corporation, which was the only fully-converted offering completed during the past three months that trades on NASDAQ. PCSB Financial’s current P/TB ratio is 115.35%, based on its closing stock price as of May 5, 2017.
| C. | The Acquisition Market |
Also considered in the valuation was the potential impact on Ponce Bank’s stock price of recently completed and pending acquisitions of other savings institutions operating in New York. As shown in Exhibit IV-4, there were three New York thrift acquisitions completed from the beginning of 2013 through year-to-date 2017, and there are currently three acquisitions pending for a New York savings institution. To the extent that speculation of a re-mutualization may impact the Bank’s valuation, we have largely taken this into account in selecting companies for the Peer Group which operate in markets that have experienced a comparable level of acquisition activity as the Bank’s market and, thus, are subject to the same type of acquisition speculation that may influence the Company’s stock. However, since converting thrifts are subject to a three-year regulatory moratorium from being acquired, acquisition speculation in the
| RP® Financial, LC. | Valuation Analysis | |
| IV.14 |
Table 4.2
Pricing Characteristics and After-Market Trends
Conversions Completed in the Last Three Months
| Institutional Information |
Pre-Conversion Data |
Contribution to | Insider Purchases | Pro Forma Data | Post-IPO Pricing Trends |
|||||||||||||||||||||||||||||||||||||||||||||||||||||||||||||||||||||||||||||||
| Financial Info. |
Asset Quality |
Offering Information |
Char. Found. |
% Off Incl. Fdn.+Merger Shares | Pricing Ratios(2)(5) | Financial Charac. |
Closing Price: |
|||||||||||||||||||||||||||||||||||||||||||||||||||||||||||||||||||||||||||||
| Excluding Foundation |
% of | Benefit Plans | Initial | First | After | After | ||||||||||||||||||||||||||||||||||||||||||||||||||||||||||||||||||||||||||||||
| Institution |
Conversion |
Ticker |
Assets |
Equity/ |
NPAs/ |
Res. |
Gross |
% Offer |
% of |
Exp./ |
Form |
Public Off. |
ESOP | Recog. |
Stk |
Mgmt. & |
Div. Yield |
P/TB | Core P/E |
P/A | Core |
TE/A | Core |
IPO Price |
Trading |
% Chge |
First |
% Chge |
First |
% Chge |
Thru 5/5/2017 |
% Chge |
||||||||||||||||||||||||||||||||||||||||||||||||||||
| ($Mil) |
(%) |
(%) |
(%) |
($Mil.) |
(%) | (%) |
(%) |
(%) |
(%) | (%) |
(%) |
(%)(1) |
(%) |
(%) | (x) |
(%) | (%) |
(%) | (%) |
($) |
($) |
(%) | ($) |
(%) | ($) |
(%) | ($) | (%) | ||||||||||||||||||||||||||||||||||||||||||||||||||||||||
| Standard Conversions |
||||||||||||||||||||||||||||||||||||||||||||||||||||||||||||||||||||||||||||||||||||
| PCSB Financial Corporation - NY* |
4/21/17 | PCSB-NASDAQ | $1,241 | 9.09% | 0.88% | 53% | $178.3 | 98 | % | 102% | 1.8% | S/C | 2.8% | 8.0 | % | 4.0% | 10.0% | 1.4% | 0.00% | 70.1 | % | 83.2x | 13.0 | % | 0.2% | 18.7 | % | 0.8% | $10.00 | $16.46 | 64.6 | % | $16.31 | 63.1 | % | $16.46 | 64.6 | % | $ | 16.46 | 64.6 | % | ||||||||||||||||||||||||||||||||||||||||||
| Averages - Standard Conversions: |
$1,241 | 9.09% | 0.88% | 53% | $178.3 | 98 | % | 102% | 102% | N.A. | 2.8% | 8.0 | % | 4.0% | 10.0% | 1.4% | 0.00% | 70.1 | % | 83.2x | 13.0 | % | 0.2% | 18.7 | % | 0.8% | $10.00 | $16.46 | 64.6 | % | $16.31 | 63.1 | % | $16.46 | 64.6 | % | $ | 16.46 | 64.6 | % | ||||||||||||||||||||||||||||||||||||||||||||
| Medians - Standard Conversions: |
$1,241 | 9.09% | 0.88% | 53% | $178.3 | 98 | % | 102% | 1.8% | N.A. | 2.8% | 8.0 | % | 4.0% | 10.0% | 1.4% | 0.00% | 70.1 | % | 83.2x | 13.0 | % | 0.2% | 18.7 | % | 0.8% | $10.00 | $16.46 | 64.6 | % | $16.31 | 63.1 | % | $16.46 | 64.6 | % | $ | 16.46 | 64.6 | % | ||||||||||||||||||||||||||||||||||||||||||||
| Mutual Holding Companies |
||||||||||||||||||||||||||||||||||||||||||||||||||||||||||||||||||||||||||||||||||||
| Community First Bancshares, Inc. - GA* |
4/28/17 | CFBI-NASDAQ | $238 | 19.10% | 2.05% | 95% | $34.7 | 54 | % | 132% | 4.0% | N.A. | N.A. | 3.9 | % | 2.0% | 4.9% | 2.1% | 0.00% | 68.5 | % | 73.0x | 24.9 | % | 0.3% | 36.4 | % | 0.9% | $10.00 | $13.29 | 32.9 | % | $13.37 | 33.7 | % | $13.37 | 33.7 | % | $ | 13.37 | 33.7 | % | ||||||||||||||||||||||||||||||||||||||||||
| Averages - MHC Conversions: |
$238 | 19.10% | 2.05% | 95% | $34.7 | 54 | % | 132% | 4.0% | N.A. | N.A. | 3.9 | % | 2.0% | 4.9% | 2.1% | 0.00% | 68.5 | % | 73.0x | 24.9 | % | 0.3% | 36.4 | % | 0.9% | $10.00 | $13.29 | 32.9 | % | $13.37 | 33.7 | % | $13.37 | 33.7 | % | $ | 13.37 | 33.7 | % | ||||||||||||||||||||||||||||||||||||||||||||
| Medians - MHC Conversions: |
$238 | 19.10% | 2.05% | 95% | $34.7 | 54 | % | 132% | 4.0% | N.A. | N.A. | 3.9 | % | 2.0% | 4.9% | 2.1% | 0.00% | 68.5 | % | 73.0x | 24.9 | % | 0.3% | 36.4 | % | 0.9% | $10.00 | $13.29 | 32.9 | % | $13.37 | 33.7 | % | $13.37 | 33.7 | % | $ | 13.37 | 33.7 | % | ||||||||||||||||||||||||||||||||||||||||||||
| Averages - All Conversions: |
$739 | 14.09% | 1.47% | 74% | $106.5 | 76 | % | 117% | 2.9% | N.A. | N.A. | 6.0 | % | 3.0% | 7.5% | 1.7% | 0.00% | 69.3 | % | 78.1x | 19.0 | % | 0.2% | 27.5 | % | 0.9% | $10.00 | $14.88 | 48.8 | % | $14.84 | 48.4 | % | $14.92 | 49.2 | % | $ | 14.92 | 49.2 | % | ||||||||||||||||||||||||||||||||||||||||||||
| Medians - All Conversions: |
$739 | 14.09% | 1.47% | 74% | $106.5 | 76 | % | 117% | 2.9% | N.A. | N.A. | 6.0 | % | 3.0% | 7.5% | 1.7% | 0.00% | 69.3 | % | 78.1x | 19.0 | % | 0.2% | 27.5 | % | 0.9% | $10.00 | $14.88 | 48.8 | % | $14.84 | 48.4 | % | $14.92 | 49.2 | % | $ | 14.92 | 49.2 | % | ||||||||||||||||||||||||||||||||||||||||||||
| Note: | * - Appraisal performed by RP Financial; BOLD = RP Fin. Did the business plan, “NT” - Not Traded; “NA” - Not Applicable, Not Available; C/S-Cash/Stock. |
| (1) As a percent of MHC offering for MHC transactions. |
(5) Mutual holding company pro forma data on full conversion basis. | |
| (2) Does not take into account the adoption of SOP 93-6. |
(6) Simultaneously completed acquisition of another financial institution. | |
| (3) Latest price if offering is less than one week old. |
(7) Simultaneously converted to a commercial bank charter. | |
| (4) Latest price if offering is more than one week but less than one month old. |
(8) Former credit union. |
5/5/2017
| RP® Financial, LC. | Valuation Analysis | |
| IV.15 |
Table 4.3
Market Pricing Comparatives
As of May 5, 2017
| Market | Per Share Data | |||||||||||||||||||||||||||||||||||||||||||||||||||||||||||||||||||||||||||||||||||
| Capitalization | Core | Book | Dividends(3) | Financial Characteristics(5) | ||||||||||||||||||||||||||||||||||||||||||||||||||||||||||||||||||||||||||||||||
| Price/ | Market | 12 Month | Value/ | Pricing Ratios(2) | Amount/ | Payout | Total | Equity/ | Tang. Eq./ | NPAs/ | Reported | Core | ||||||||||||||||||||||||||||||||||||||||||||||||||||||||||||||||||||||||
| Share | Value | EPS(1) | Share | P/E | P/B | P/A | P/TB | P/Core | Share | Yield | Ratio(4) | Assets | Assets | T. Assets | Assets | ROAA | ROAE | ROAA | ROAE | |||||||||||||||||||||||||||||||||||||||||||||||||||||||||||||||||
| ($) | ($Mil) | ($) | ($) | (x) | (%) | (%) | (%) | (x) | ($) | (%) | (%) | ($Mil) | (%) | (%) | (%) | (%) | (%) | (%) | (%) | |||||||||||||||||||||||||||||||||||||||||||||||||||||||||||||||||
| All Non-MHC Public Companies(6) |
||||||||||||||||||||||||||||||||||||||||||||||||||||||||||||||||||||||||||||||||||||
| Averages |
$ | 22.35 | $ | 546.69 | $ | 1.03 | $ | 16.64 | 20.24x | 131.15 | % | 15.96 | % | 145.09 | % | 20.83x | $ | 0.37 | 1.66 | % | 56.54 | % | $ | 3,327 | 12.60 | % | 11.54 | % | 0.96 | % | 0.74 | % | 6.30 | % | 0.74 | % | 6.12 | % | ||||||||||||||||||||||||||||||||||||||||||||||
| Median |
$ | 17.55 | $ | 161.01 | $ | 0.77 | $ | 14.81 | 18.98x | 126.65 | % | 15.60 | % | 130.77 | % | 20.11x | $ | 0.26 | 1.36 | % | 45.58 | % | $ | 1,081 | 11.57 | % | 10.67 | % | 0.84 | % | 0.63 | % | 5.99 | % | 0.64 | % | 5.68 | % | ||||||||||||||||||||||||||||||||||||||||||||||
| Comparable Group |
||||||||||||||||||||||||||||||||||||||||||||||||||||||||||||||||||||||||||||||||||||
| Averages |
$ | 16.46 | $ | 299.00 | $ | 0.12 | $ | 14.64 | 102.88x | 112.43 | % | 21.45 | % | 115.35 | % | 137.17x | $ | 0.00 | 0.00 | % | 0.00 | % | $ | 1,394 | 19.10 | % | 18.60 | % | 1.40 | % | 0.20 | % | 1.07 | % | 0.16 | % | 0.82 | % | ||||||||||||||||||||||||||||||||||||||||||||||
| Medians |
$ | 16.46 | $ | 299.00 | $ | 0.12 | $ | 14.64 | 102.88x | 112.43 | % | 21.45 | % | 115.35 | % | 137.17x | $ | 0.00 | 0.00 | % | 0.00 | % | $ | 1,394 | 19.10 | % | 18.60 | % | 1.40 | % | 0.20 | % | 1.07 | % | 0.16 | % | 0.82 | % | ||||||||||||||||||||||||||||||||||||||||||||||
| Comparable Group |
||||||||||||||||||||||||||||||||||||||||||||||||||||||||||||||||||||||||||||||||||||
| PCSB PCSB Financial Corporation |
NY | $ | 16.46 | $ | 299.00 | $ | 0.12 | $ | 14.64 | 102.88x | 112.43 | % | 21.45 | % | 115.35 | % | 137.17x | $ | 0.00 | 0.00 | % | 0.00 | % | $ | 1,394 | 19.10 | % | 18.60 | % | 1.40 | % | 0.20 | % | 1.07 | % | 0.16 | % | 0.82 | % | |||||||||||||||||||||||||||||||||||||||||||||
| (1) | Core income, on a diluted per-share basis. Core income is net income after taxes and before extraordinary items, less net income attributable to noncontrolling interest, gain on the sale of securities, amortization of intangibles, goodwill and nonrecurring items. Assumed tax rate is 35%. |
| (2) | P/E = Price to earnings; P/B = Price to book; P/A = Price to assets; P/TB = Price to tangible book value; and P/Core = Price to core earnings. P/E and P/Core =NM if the ratio is negative or above 35x. |
| (3) | Indicated 12 month dividend, based on last quarterly dividend declared. |
| (4) | Indicated 12 month dividend as a percent of trailing 12 month earnings. |
| (5) | ROAA (return on average assets) and ROAE (return on average equity) are indicated ratios based on trailing 12 month earnings and average equity and assets balances. |
| (6) | Excludes from averages and medians those companies the subject of actual or rumored acquisition activities or unusual operating characteristics. |
Source: SNL Financial, LC. and RP Financial, LC. calculations. The information provided in this report has been obtained from sources we believe are reliable, but we cannot guarantee the accuracy or completeness of such information.
Copyright (c) 2017 by RP® Financial, LC.
| RP® Financial, LC. | VALUATION ANALYSIS | |
| IV.16 |
Company’s stock would tend to be less compared to the stocks of the Peer Group companies. Furthermore, in comparison to the stocks of the fully-converted Peer Group companies, the degree of acquisition speculation in the Company’s stock is also viewed to be relatively more limited since there will be fewer potential acquirers for the Company’s stock as a re-mutualization transaction can only be completed by a mutual institution or an institution in the MHC form of ownership. Additionally, there tends to be less acquisition speculation in the stocks of publicly-traded MHCs in general, given the majority of the shares are held by the MHC rather than public shareholders which own 100% of the stocks of the fully-converted Peer Group companies. Accordingly, the Peer Group companies are considered to be subject to a greater degree of acquisition speculation relative to the acquisition speculation that may influence the Company’s trading price.
* * * * * * * * * * *
In determining our valuation adjustment for marketing of the issue, we considered trends in both the overall thrift market, the new issue market including the new issue market for MHC shares and the local acquisition market for thrift stocks. Taking these factors and trends into account, RP Financial concluded that no adjustment was appropriate in the valuation analysis for purposes of marketing of the issue.
| 8. | Management |
Ponce Bank’s management team appears to have experience and expertise in all of the key areas of the Bank’s operations. Exhibit IV-5 provides summary resumes of Ponce Bank’s Board of Directors and senior management. The financial characteristics of the Bank suggest that the Board and senior management have been effective in implementing an operating strategy that can be well managed by the Bank’s present organizational structure. The Bank currently does not have any senior management positions that are vacant.
Similarly, the returns, capital positions and other operating measures of the Peer Group companies are indicative of well-managed financial institutions, which have Boards and management teams that have been effective in implementing competitive operating strategies. Therefore, on balance, we concluded no valuation adjustment relative to the Peer Group was appropriate for this factor.
| RP® Financial, LC. | VALUATION ANALYSIS | |
| IV.17 |
| 9. | Effect of Government Regulation and Regulatory Reform |
In summary, as a federally-insured savings institution operating in the MHC form of ownership, Ponce Bank will be operating in substantially the same regulatory environment as the Peer Group members — all of whom are adequately capitalized institutions and the substantial majority are operating with no apparent restrictions. Exhibit IV-6 reflects the Bank’s pro forma regulatory capital ratios. Accordingly, no adjustment has been applied for the effect of government regulation and regulatory reform.
Summary of Adjustments
Overall, based on the factors discussed above, we concluded that the Bank’s pro forma market value should reflect the following valuation adjustments relative to the Peer Group:
| Key Valuation Parameters: | Valuation Adjustment | |
| Financial Condition | No Adjustment | |
| Profitability, Growth and Viability of Earnings | Moderate Downward | |
| Asset Growth | Slight Upward | |
| Primary Market Area | No Adjustment | |
| Dividends | Slight Downward | |
| Liquidity of the Shares | No Adjustment | |
| Marketing of the Issue | No Adjustment | |
| Management | No Adjustment | |
| Effect of Government Regulations and Regulatory Reform | No Adjustment | |
Valuation Approaches: Fully-Converted Basis
In applying the accepted valuation methodology promulgated by the OCC and the FRB, i.e., the pro forma market value approach, we considered the three key pricing ratios in valuing the Company’s to-be-issued stock — price/earnings (“P/E”), price/book (“P/B”), and price/assets (“P/A”) approaches — all performed on a pro forma basis including the effects of the stock proceeds. In computing the pro forma impact of the conversion and the related pricing ratios, we have incorporated the valuation parameters disclosed in the Company’s prospectus for reinvestment rate, effective tax rate, stock benefit plan assumptions, the Foundation and offering expenses (summarized in Exhibits IV-9 and IV-10). The assumptions utilized in the pro forma analysis in calculating the Bank’s full conversion value were consistent with the assumptions utilized for the minority stock offering, except expenses were assumed to equal 2.5% of gross proceeds (summarized in Exhibits IV-7 and IV-8).
| RP® Financial, LC. | VALUATION ANALYSIS | |
| IV.18 |
In our estimate of value, we assessed the relationship of the pro forma pricing ratios relative to the Peer Group, recent conversions and publicly-traded MHCs on a fully-converted basis.
RP Financial’s valuation placed an emphasis on the following:
| • | P/E Approach. The P/E approach is generally the best indicator of long-term value for a stock. At the same time, recognizing that (1) the earnings multiples will be evaluated on a pro forma fully-converted basis for the Bank; and (2) the Peer Group on average has had the opportunity to realize the benefit of reinvesting net conversion proceeds, we also gave weight to the other valuation approaches. |
| • | P/B Approach. P/B ratios have generally served as a useful benchmark in the valuation of thrift stocks, particularly in the context of an initial public offering, as the earnings approach involves assumptions regarding the use of proceeds. RP Financial considered the P/B approach to be a valuable indicator of pro forma value taking into account the pricing ratios under the P/E and P/A approaches. We have also modified the P/B approach to exclude the impact of intangible assets (i.e., price/tangible book value or “P/TB”), in that the investment community frequently makes this adjustment in its evaluation of this pricing approach. |
| • | P/A Approach. P/A ratios are generally a less reliable indicator of market value, as investors typically assign less weight to assets and attribute greater weight to book value and earnings. Furthermore, this approach as set forth in the regulatory valuation guidelines does not take into account the amount of stock purchases funded by deposit withdrawals, thus understating the pro forma P/A ratio. At the same time, the P/A ratio is an indicator of franchise value, and, in the case of highly capitalized institutions, high P/A ratios may limit the investment community’s willingness to pay market multiples for earnings or book value when ROE is expected to be low. |
The Bank will adopt “Employers’ Accounting for Employee Stock Ownership Plans” (“ASC 718-40”), which will cause earnings per share computations to be based on shares issued and outstanding excluding unreleased ESOP shares. For purposes of preparing the pro forma pricing analyses, we have reflected all shares issued in the offering, including all ESOP shares, to capture the full dilutive impact, particularly since the ESOP shares are economically dilutive, receive dividends and can be voted. However, we did consider the impact of ASC 718-40 in the valuation.
| RP® Financial, LC. | VALUATION ANALYSIS | |
| IV.19 |
Based on the application of the three valuation approaches, taking into consideration the valuation adjustments discussed above and the dilutive impact of the stock contribution to the Foundation, RP Financial concluded that as of May 5, 2017, the pro forma market value of Ponce Bank’s full conversion offering equaled $139,607,030 at the midpoint, equal to 13,960,703 shares at $10.00 per share.
Basis of Valuation - Fully-Converted Pricing Ratios
1. Price-to-Earnings (“P/E”). The application of the P/E valuation method requires calculating the Bank’s pro forma market value by applying a valuation P/E multiple (fully-converted basis) to the pro forma earnings base. In applying this technique, we considered both reported earnings and a recurring earnings base, that is, earnings adjusted to exclude any one-time non-operating items, plus the estimated after-tax earnings benefit of the reinvestment of the net proceeds. The Bank’s reported earnings equaled $1.180 million for the twelve months ended March 31, 2017 and were also viewed to be representative of the Bank’s core earnings.
Based on Ponce Bank’s reported and core earnings and incorporating the impact of the pro forma assumptions discussed previously, the Bank’s pro forma reported and core P/E multiples (fully-converted basis) at the $139.6 million midpoint value both equaled 200.51 times, which provided for premiums of 882.41% and 901.55% relative to the Peer Group’s average reported and core P/E multiples of 20.41 times and 20.02 times, respectively (see Table 4.4). In comparison to the Peer Group’s median reported and core earnings multiples which equaled 19.64 times and 20.31 times, respectively, the Banks pro forma reported and core P/E multiples (fully-converted basis) at the midpoint value indicated premiums of 920.93% and 887.25%, respectively. The Bank’s pro forma P/E ratios (fully-converted basis) at the minimum and the super maximum equaled 155.06 times and 337.02 times, respectively.
On an MHC reported basis, the Bank’s reported and core P/E multiples at the midpoint value of $139.6 million both equaled 162.69 times (see Table 4.5). The Bank’s reported and core P/E multiples provided for premiums of 697.11% and 712.64% relative to the Peer Group’s average reported and core P/E multiples of 20.41 times and 20.02 times, respectively. In comparison to the Peer Group’s median reported and core earnings multiples which equaled 19.64 times and 20.31 times, respectively, the Bank’s pro forma reported and core P/E multiples (MHC basis) at the midpoint value indicated premiums of 728.36% and 701.03%, respectively. The Bank’s pro forma P/E ratios (MHC basis) at the minimum and the super maximum equaled 132.02 times and 239.08 times, respectively.
| RP® Financial, LC. | Valuation Analysis | |
| IV.20 |
Table 4.4
Fully-Converted Market Pricing Versus Peer Group
Ponce Bank
As of May 5, 2017
| Market | Per Share Data | |||||||||||||||||||||||||||||||||||||||||||||||||||||||||||||||||||||||||||||||||||||
| Capitalization | Core | Book | Dividends(3) | Financial Characteristics(5) | ||||||||||||||||||||||||||||||||||||||||||||||||||||||||||||||||||||||||||||||||||
| Price/ | Market | 12 Month | Value/ | Pricing Ratios(2) | Amount/ | Payout | Total | Comm Eq./ | Comm T. Eq./ | NPAs/ | Reported | Core | ||||||||||||||||||||||||||||||||||||||||||||||||||||||||||||||||||||||||||
| Share | Value | EPS(1) | Share | P/E | P/B | P/A | P/TB | P/Core | Share | Yield | Ratio(4) | Assets | Assets | Assets | Assets | ROAA | ROAE | ROAA | ROAE | |||||||||||||||||||||||||||||||||||||||||||||||||||||||||||||||||||
| ($) | ($Mil) | ($) | ($) | (x) | (%) | (%) | (%) | (x) | ($) | (%) | (%) | ($Mil) | (%) | (%) | (%) | (%) | (%) | (%) | (%) | |||||||||||||||||||||||||||||||||||||||||||||||||||||||||||||||||||
| Ponce Bank |
NY | |||||||||||||||||||||||||||||||||||||||||||||||||||||||||||||||||||||||||||||||||||||
| Super Maximum |
$ | 10.00 | $ | 184.63 | $ | 0.03 | $ | 13.31 | 337.02x | 75.13 | % | 19.67 | % | 75.13 | % | 337.02x | $ | 0.00 | 0.00 | % | 0.00 | % | $ | 938 | 26.18 | % | 26.18 | % | 2.76 | % | 0.06 | % | 0.22 | % | 0.06 | % | 0.22 | % | ||||||||||||||||||||||||||||||||||||||||||||||||
| Maximum |
$ | 10.00 | $ | 160.55 | $ | 0.04 | $ | 14.05 | 255.97x | 71.17 | % | 17.48 | % | 71.17 | % | 255.97x | $ | 0.00 | 0.00 | % | 0.00 | % | $ | 918 | 24.57 | % | 24.57 | % | 2.82 | % | 0.07 | % | 0.28 | % | 0.07 | % | 0.28 | % | ||||||||||||||||||||||||||||||||||||||||||||||||
| Midpoint |
$ | 10.00 | $ | 139.61 | $ | 0.05 | $ | 14.91 | 200.51x | 67.07 | % | 15.50 | % | 67.07 | % | 200.51x | $ | 0.00 | 0.00 | % | 0.00 | % | $ | 901 | 23.10 | % | 23.10 | % | 2.87 | % | 0.08 | % | 0.33 | % | 0.08 | % | 0.33 | % | ||||||||||||||||||||||||||||||||||||||||||||||||
| Minimum |
$ | 10.00 | $ | 118.67 | $ | 0.06 | $ | 16.07 | 155.06x | 62.23 | % | 13.43 | % | 62.23 | % | 155.06x | $ | 0.00 | 0.00 | % | 0.00 | % | $ | 883 | 21.58 | % | 21.58 | % | 2.93 | % | 0.09 | % | 0.40 | % | 0.09 | % | 0.40 | % | ||||||||||||||||||||||||||||||||||||||||||||||||
| All Non-MHC Public Companies(6) |
||||||||||||||||||||||||||||||||||||||||||||||||||||||||||||||||||||||||||||||||||||||
| Averages |
$ | 22.35 | $ | 546.69 | $ | 1.03 | $ | 16.64 | 20.24x | 131.15 | % | 15.96 | % | 145.09 | % | 20.83x | $ | 0.37 | 1.66 | % | 56.54 | % | $ | 3,327 | 12.60 | % | 11.54 | % | 0.96 | % | 0.74 | % | 6.30 | % | 0.74 | % | 6.12 | % | ||||||||||||||||||||||||||||||||||||||||||||||||
| Median |
$ | 17.55 | $ | 161.01 | $ | 0.77 | $ | 14.81 | 18.98x | 126.65 | % | 15.60 | % | 130.77 | % | 20.11x | $ | 0.26 | 1.36 | % | 45.58 | % | $ | 1,081 | 11.57 | % | 10.67 | % | 0.84 | % | 0.63 | % | 5.99 | % | 0.64 | % | 5.68 | % | ||||||||||||||||||||||||||||||||||||||||||||||||
| All Non-MHC State of |
||||||||||||||||||||||||||||||||||||||||||||||||||||||||||||||||||||||||||||||||||||||
| Averages |
$ | 14.00 | $ | 1,055.81 | $ | 0.55 | $ | 11.62 | 20.10x | 137.75 | % | 10.27 | % | 157.37 | % | 17.24x | $ | 0.44 | 2.84 | % | 57.51 | % | $ | 7,945 | 9.55 | % | 8.49 | % | 1.16 | % | 0.53 | % | 5.26 | % | 0.52 | % | 5.28 | % | ||||||||||||||||||||||||||||||||||||||||||||||||
| Medians |
$ | 15.03 | $ | 183.86 | $ | 0.78 | $ | 13.98 | 18.00x | 123.67 | % | 10.48 | % | 168.51 | % | 17.44x | $ | 0.41 | 3.09 | % | 61.54 | % | $ | 1,105 | 9.19 | % | 8.31 | % | 0.85 | % | 0.58 | % | 6.04 | % | 0.74 | % | 7.62 | % | ||||||||||||||||||||||||||||||||||||||||||||||||
| State of NY(1) |
||||||||||||||||||||||||||||||||||||||||||||||||||||||||||||||||||||||||||||||||||||||
| CARV |
Carver Bancorp, Inc. |
NY | $ | 4.00 | $ | 14.78 | ($ | 0.64 | ) | $ | 1.71 | NM | 234.56 | % | 2.26 | % | 234.56 | % | NM | $ | 0.00 | 0.00 | % | NM | $ | 699 | 7.36 | % | 7.36 | % | 2.41 | % | -0.28 | % | -3.76 | % | -0.30 | % | -3.91 | % | ||||||||||||||||||||||||||||||||||||||||||||||
| DCOM |
Dime Community Bancshares, Inc. |
NY | $ | 19.50 | $ | 732.60 | $ | 1.12 | $ | 15.26 | 21.43x | 127.80 | % | 12.02 | % | 141.54 | % | 17.44x | $ | 0.56 | 2.87 | % | 61.54 | % | $ | 6,095 | 9.40 | % | 8.57 | % | 0.23 | % | 0.58 | % | 6.04 | % | 0.71 | % | 7.36 | % | ||||||||||||||||||||||||||||||||||||||||||||||
| ESBK |
Elmira Savings Bank |
NY | $ | 20.80 | $ | 68.72 | $ | 1.28 | $ | 16.82 | 16.38x | 123.67 | % | 10.48 | % | 168.51 | % | 16.29x | $ | 0.92 | 4.42 | % | 72.44 | % | $ | 557 | 10.08 | % | 8.04 | % | NA | 0.77 | % | 7.82 | % | 0.78 | % | 7.88 | % | |||||||||||||||||||||||||||||||||||||||||||||||
| FSBC |
FSB Bancorp, Inc. |
NY | $ | 15.02 | $ | 29.16 | NA | $ | 16.43 | 33.00x | 91.44 | % | 10.19 | % | 91.44 | % | NM | NA | NA | NM | $ | 286 | 11.14 | % | 11.14 | % | NA | 0.33 | % | 3.14 | % | NA | NA | |||||||||||||||||||||||||||||||||||||||||||||||||||||
| NYCB |
New York Community Bancorp, Inc. |
NY | $ | 13.24 | $ | 6,475.16 | NA | $ | 12.57 | 13.79x | 105.36 | % | 13.40 | % | 174.59 | % | NM | $ | 0.68 | 5.14 | % | 70.83 | % | $ | 48,825 | 13.61 | % | 9.08 | % | NA | 0.96 | % | 7.67 | % | NA | NA | ||||||||||||||||||||||||||||||||||||||||||||||||||
| PBHC |
Pathfinder Bancorp, Inc. |
NY | $ | 15.04 | $ | 63.87 | NA | $ | 13.98 | 18.34x | 107.57 | % | 7.97 | % | 116.88 | % | NM | $ | 0.20 | 1.33 | % | 24.39 | % | $ | 802 | 7.46 | % | 6.91 | % | NA | 0.49 | % | 5.90 | % | NA | NA | ||||||||||||||||||||||||||||||||||||||||||||||||||
| PCSB |
PCSB Financial Corporation |
NY | $ | 16.46 | $ | 299.00 | NA | NA | NM | NA | NA | NA | NM | NA | NA | NM | $ | 1,407 | 8.33 | % | 7.89 | % | NA | NA | NA | NA | NA | |||||||||||||||||||||||||||||||||||||||||||||||||||||||||||
| TRST |
TrustCo Bank Corp NY |
NY | $ | 7.95 | $ | 763.18 | $ | 0.44 | $ | 4.57 | 17.67x | 173.82 | % | 15.60 | % | 174.04 | % | 17.97x | $ | 0.26 | 3.30 | % | 58.33 | % | $ | 4,887 | 8.98 | % | 8.97 | % | 0.85 | % | 0.89 | % | 9.97 | % | 0.88 | % | 9.80 | % | ||||||||||||||||||||||||||||||||||||||||||||||
| Comparable Group |
||||||||||||||||||||||||||||||||||||||||||||||||||||||||||||||||||||||||||||||||||||||
| Averages |
$ | 17.16 | $ | 117.56 | $ | 0.67 | $ | 14.69 | 20.41x | 116.81 | % | 14.11 | % | 125.10 | % | 20.02x | $ | 0.18 | 1.00 | % | 46.26 | % | $ | 753 | 12.34 | % | 11.68 | % | 1.28 | % | 0.49 | % | 4.53 | % | 0.57 | % | 4.85 | % | ||||||||||||||||||||||||||||||||||||||||||||||||
| Medians |
$ | 17.03 | $ | 77.93 | $ | 0.26 | $ | 14.83 | 19.64x | 121.33 | % | 12.88 | % | 121.50 | % | 20.31x | $ | 0.14 | 0.63 | % | 18.40 | % | $ | 669 | 10.76 | % | 10.34 | % | 1.20 | % | 0.47 | % | 4.56 | % | 0.53 | % | 4.62 | % | ||||||||||||||||||||||||||||||||||||||||||||||||
| Comparable Group |
||||||||||||||||||||||||||||||||||||||||||||||||||||||||||||||||||||||||||||||||||||||
| BYBK |
Bay Bancorp, Inc. |
MD | $ | 7.05 | $ | 74.33 | $ | 0.26 | $ | 6.38 | 30.65x | 110.48 | % | 11.74 | % | 115.27 | % | 27.35x | $ | 0.00 | 0.00 | % | 0.00 | % | $ | 633 | 10.62 | % | 10.23 | % | 1.93 | % | 0.47 | % | 4.16 | % | 0.53 | % | 4.62 | % | ||||||||||||||||||||||||||||||||||||||||||||||
| CSBK |
Clifton Bancorp Inc. |
NJ | $ | 16.31 | $ | 375.52 | $ | 0.20 | $ | 13.15 | NM | 124.02 | % | 27.41 | % | 124.02 | % | NM | $ | 0.24 | 1.47 | % | 120.00 | % | $ | 1,371 | 22.10 | % | 22.10 | % | 0.39 | % | 0.34 | % | 1.40 | % | 0.34 | % | 1.38 | % | ||||||||||||||||||||||||||||||||||||||||||||||
| CWAY |
Coastway Bancorp, Inc. |
RI | $ | 20.20 | $ | 88.73 | $ | 0.83 | $ | 15.68 | 24.34x | 128.82 | % | 14.03 | % | 128.82 | % | 24.34x | $ | 0.00 | 0.00 | % | 0.00 | % | $ | 633 | 10.89 | % | 10.89 | % | 2.14 | % | 0.55 | % | 4.95 | % | 0.55 | % | 4.95 | % | ||||||||||||||||||||||||||||||||||||||||||||||
| ESBK |
Elmira Savings Bank |
NY | $ | 20.80 | $ | 68.72 | $ | 1.28 | $ | 16.82 | 16.38x | 123.67 | % | 10.48 | % | 168.51 | % | 16.29x | $ | 0.92 | 4.42 | % | 72.44 | % | $ | 557 | 10.08 | % | 8.04 | % | 0.93 | % | 0.77 | % | 7.82 | % | 0.78 | % | 7.88 | % | ||||||||||||||||||||||||||||||||||||||||||||||
| HBK |
Hamilton Bancorp, Inc. |
MD | $ | 15.12 | $ | 51.55 | $ | 0.17 | $ | 17.77 | NM | 85.07 | % | 10.33 | % | 100.65 | % | NM | $ | 0.00 | 0.00 | % | 0.00 | % | $ | 500 | 12.14 | % | 10.46 | % | 1.08 | % | 0.03 | % | 0.27 | % | 0.11 | % | 0.90 | % | ||||||||||||||||||||||||||||||||||||||||||||||
| MLVF |
Malvern Bancorp, Inc. |
PA | $ | 21.95 | $ | 144.27 | $ | 1.82 | $ | 14.83 | 11.80x | 148.02 | % | 15.00 | % | 148.02 | % | 12.09x | $ | 0.00 | 0.00 | % | 0.00 | % | $ | 962 | 10.13 | % | 10.13 | % | 0.33 | % | 1.43 | % | 13.01 | % | 1.40 | % | 12.71 | % | ||||||||||||||||||||||||||||||||||||||||||||||
| PBHC |
Pathfinder Bancorp, Inc. |
NY | $ | 15.04 | $ | 63.87 | NA | $ | 13.98 | 18.34x | 107.57 | % | 7.97 | % | 116.88 | % | NM | $ | 0.20 | 1.33 | % | 24.39 | % | $ | 802 | 7.46 | % | 6.91 | % | 1.46 | % | 0.49 | % | 5.90 | % | NA | NA | |||||||||||||||||||||||||||||||||||||||||||||||||
| PBBI |
PB Bancorp, Inc. |
CT | $ | 10.35 | $ | 81.52 | $ | 0.17 | $ | 10.86 | NM | 95.22 | % | 15.66 | % | 103.59 | % | NM | $ | 0.16 | 1.55 | % | 61.90 | % | $ | 521 | 16.45 | % | 15.32 | % | 1.32 | % | 0.31 | % | 1.90 | % | 0.25 | % | 1.53 | % | ||||||||||||||||||||||||||||||||||||||||||||||
| PBIP |
Prudential Bancorp, Inc. |
PA | $ | 17.75 | $ | 160.03 | NA | NA | NM | 126.25 | % | 18.96 | % | 126.25 | % | NM | $ | 0.12 | 0.68 | % | 171.43 | % | $ | 844 | 15.49 | % | 14.69 | % | 3.17 | % | 0.06 | % | 0.30 | % | NA | NA | ||||||||||||||||||||||||||||||||||||||||||||||||||
| WEBK |
Wellesley Bancorp, Inc. |
MA | $ | 27.00 | $ | 67.09 | NA | $ | 22.69 | 20.93x | 118.99 | % | 9.53 | % | 118.99 | % | NM | $ | 0.16 | 0.59 | % | 12.40 | % | $ | 704 | 8.01 | % | 8.01 | % | 0.09 | % | 0.46 | % | 5.59 | % | NA | NA | |||||||||||||||||||||||||||||||||||||||||||||||||
| (1) | Core income, on a diluted per-share basis. Core income is net income after taxes and before extraordinary items, less net income attributable to noncontrolling interest, gain on the sale of securities, amortization of intangibles, goodwill and nonrecurring items. Assumed tax rate is 35%. |
| (2) | P/E = Price to earnings; P/B = Price to book; P/A = Price to assets; P/TB = Price to tangible book value; and P/Core = Price to core earnings. P/E and P/Core =NM if the ratio is negative or above 35x. |
| (3) | Indicated 12 month dividend, based on last quarterly dividend declared. |
| (4) | Indicated 12 month dividend as a percent of trailing 12 month earnings. |
| (5) | Equity and tangible equity equal common equity and tangible common equity, respectively. ROAA (return on average assets) and ROAE (return on average equity) are indicated ratios based on trailing 12 month earnings and average equity and assets balances. |
| (6) | Excludes from averages and medians those companies the subject of actual or rumored acquisition activities or unusual operating characteristics. |
Source: SNL Financial, LC. and RP Financial, LC. calculations. The information provided in this report has been obtained from sources we believe are reliable, but we cannot guarantee the accuracy or completeness of such information.
Copyright (c) 2017 by RP® Financial, LC.
| RP® Financial, LC. | Valuation Analysis | |
| IV.21 |
Table 4.5
MHC Market Pricing Versus Peer Group
Ponce Bank
As of May 5, 2017
| Market | Per Share Data | |||||||||||||||||||||||||||||||||||||||||||||||||||||||||||||||||||||||||||||||||
| Capitalization | Core | Book | Dividends(3) | Financial Characteristics(5) | ||||||||||||||||||||||||||||||||||||||||||||||||||||||||||||||||||||||||||||||
| Price/ | Market | 12 Month | Value/ | Pricing Ratios(2) | Amount/ | Payout | Total | Comm Eq./ | Comm T. Eq./ | NPAs/ | Reported | Core |
Offering | |||||||||||||||||||||||||||||||||||||||||||||||||||||||||||||||||||||
| Share | Value | EPS(1) | Share | P/E | P/B | P/A | P/TB | P/Core | Share | Yield | Ratio(4) | Assets | Assets | Assets | Assets | ROAA | ROAE | ROAA |
ROAE |
Size | ||||||||||||||||||||||||||||||||||||||||||||||||||||||||||||||
| ($) | ($Mil) | ($) | ($) | (x) | (%) | (%) | (%) | (x) | ($) | (%) | (%) | ($Mil) | (%) | (%) | (%) | (%) | (%) | (%) | (%) | ($Mil) | ||||||||||||||||||||||||||||||||||||||||||||||||||||||||||||||
| Ponce Bank |
NY | |||||||||||||||||||||||||||||||||||||||||||||||||||||||||||||||||||||||||||||||||
| Super Maximum |
$ | 10.00 | $ | 184.63 | $ | 0.04 | $ | 8.82 | 239.08x | 113.38 | % | 21.58 | % | 113.38 | % | 239.08x | $ | 0.00 | 0.00 | % | 0.00 | % | $ | 856 | 19.04 | % | 19.04 | % | 3.02 | % | 0.09 | % | 0.47 | % | 0.09% | 0.47% | $83.1 | |||||||||||||||||||||||||||||||||||||||||||||
| Maximum |
$ | 10.00 | $ | 160.55 | $ | 0.05 | $ | 9.55 | 196.16x | 104.71 | % | 18.97 | % | 104.71 | % | 196.16x | $ | 0.00 | 0.00 | % | 0.00 | % | $ | 846 | 18.12 | % | 18.12 | % | 3.06 | % | 0.10 | % | 0.53 | % | 0.10% | 0.53% | $72.2 | |||||||||||||||||||||||||||||||||||||||||||||
| Midpoint |
$ | 10.00 | $ | 139.61 | $ | 0.06 | $ | 10.38 | 162.69x | 96.34 | % | 16.66 | % | 96.34 | % | 162.69x | $ | 0.00 | 0.00 | % | 0.00 | % | $ | 838 | 17.31 | % | 17.31 | % | 3.09 | % | 0.10 | % | 0.59 | % | 0.10% | 0.59% | $62.8 | |||||||||||||||||||||||||||||||||||||||||||||
| Minimum |
$ | 10.00 | $ | 118.67 | $ | 0.08 | $ | 11.51 | 132.02x | 86.88 | % | 14.31 | % | 86.88 | % | 132.02x | $ | 0.00 | 0.00 | % | 0.00 | % | $ | 829 | 16.48 | % | 16.48 | % | 3.12 | % | 0.11 | % | 0.66 | % | 0.11% | 0.66% | $53.4 | |||||||||||||||||||||||||||||||||||||||||||||
| All Non-MHC Public Companies(6) |
||||||||||||||||||||||||||||||||||||||||||||||||||||||||||||||||||||||||||||||||||
| Averages |
$ | 22.35 | $ | 546.69 | $ | 1.03 | $ | 16.64 | 20.24x | 131.15 | % | 15.96 | % | 145.09 | % | 20.83x | $ | 0.37 | 1.66 | % | 56.54 | % | $ | 3,327 | 12.60 | % | 11.54 | % | 0.96 | % | 0.74 | % | 6.30 | % | 0.74% | 6.12% | ||||||||||||||||||||||||||||||||||||||||||||||
| Median |
$ | 17.55 | $ | 161.01 | $ | 0.77 | $ | 14.81 | 18.98x | 126.65 | % | 15.60 | % | 130.77 | % | 20.11x | $ | 0.26 | 1.36 | % | 45.58 | % | $ | 1,081 | 11.57 | % | 10.67 | % | 0.84 | % | 0.63 | % | 5.99 | % | 0.64% | 5.68% | ||||||||||||||||||||||||||||||||||||||||||||||
| All Non-MHC State of |
||||||||||||||||||||||||||||||||||||||||||||||||||||||||||||||||||||||||||||||||||
| Averages |
$ | 14.00 | $ | 1,055.81 | $ | 0.55 | $ | 11.62 | 20.10x | 137.75 | % | 10.27 | % | 157.37 | % | 17.24x | $ | 0.44 | 2.84 | % | 57.51 | % | $ | 7,945 | 9.55 | % | 8.49 | % | 1.16 | % | 0.53 | % | 5.26 | % | 0.52% | 5.28% | ||||||||||||||||||||||||||||||||||||||||||||||
| Medians |
$ | 15.03 | $ | 183.86 | $ | 0.78 | $ | 13.98 | 18.00x | 123.67 | % | 10.48 | % | 168.51 | % | 17.44x | $ | 0.41 | 3.09 | % | 61.54 | % | $ | 1,105 | 9.19 | % | 8.31 | % | 0.85 | % | 0.58 | % | 6.04 | % | 0.74% | 7.62% | ||||||||||||||||||||||||||||||||||||||||||||||
| State of NY(1) |
||||||||||||||||||||||||||||||||||||||||||||||||||||||||||||||||||||||||||||||||||
| CARV |
Carver Bancorp, Inc. |
NY | $ | 4.00 | $ | 14.78 | ($ | 0.64 | ) | $ | 1.71 | NM | 234.56 | % | 2.26 | % | 234.56 | % | NM | $ | 0.00 | 0.00 | % | NM | $ | 699 | 7.36 | % | 7.36 | % | 2.41 | % | -0.28 | % | -3.76 | % | -0.30% | -3.91% | ||||||||||||||||||||||||||||||||||||||||||||
| DCOM |
Dime Community Bancshares, Inc. |
NY | $ | 19.50 | $ | 732.60 | $ | 1.12 | $ | 15.26 | 21.43x | 127.80 | % | 12.02 | % | 141.54 | % | 17.44x | $ | 0.56 | 2.87 | % | 61.54 | % | $ | 6,095 | 9.40 | % | 8.57 | % | 0.23 | % | 0.58 | % | 6.04 | % | 0.71% | 7.36% | ||||||||||||||||||||||||||||||||||||||||||||
| ESBK |
Elmira Savings Bank |
NY | $ | 20.80 | $ | 68.72 | $ | 1.28 | $ | 16.82 | 16.38x | 123.67 | % | 10.48 | % | 168.51 | % | 16.29x | $ | 0.92 | 4.42 | % | 72.44 | % | $ | 557 | 10.08 | % | 8.04 | % | NA | 0.77 | % | 7.82 | % | 0.78% | 7.88% | |||||||||||||||||||||||||||||||||||||||||||||
| FSBC |
FSB Bancorp, Inc. |
NY | $ | 15.02 | $ | 29.16 | NA | $ | 16.43 | 33.00x | 91.44 | % | 10.19 | % | 91.44 | % | NM | NA | NA | NM | $ | 286 | 11.14 | % | 11.14 | % | NA | 0.33 | % | 3.14 | % | NA | NA | |||||||||||||||||||||||||||||||||||||||||||||||||
| NYCB |
New York Community Bancorp, Inc. |
NY | $ | 13.24 | $ | 6,475.16 | NA | $ | 12.57 | 13.79x | 105.36 | % | 13.40 | % | 174.59 | % | NM | $ | 0.68 | 5.14 | % | 70.83 | % | $ | 48,825 | 13.61 | % | 9.08 | % | NA | 0.96 | % | 7.67 | % | NA | NA | ||||||||||||||||||||||||||||||||||||||||||||||
| PBHC |
Pathfinder Bancorp, Inc. |
NY | $ | 15.04 | $ | 63.87 | NA | $ | 13.98 | 18.34x | 107.57 | % | 7.97 | % | 116.88 | % | NM | $ | 0.20 | 1.33 | % | 24.39 | % | $ | 802 | 7.46 | % | 6.91 | % | NA | 0.49 | % | 5.90 | % | NA | NA | ||||||||||||||||||||||||||||||||||||||||||||||
| PCSB |
PCSB Financial Corporation |
NY | $ | 16.46 | $ | 299.00 | NA | NA | NM | NA | NA | NA | NM | NA | NA | NM | $ | 1,407 | 8.33 | % | 7.89 | % | NA | NA | NA | NA | NA | |||||||||||||||||||||||||||||||||||||||||||||||||||||||
| TRST |
TrustCo Bank Corp NY |
NY | $ | 7.95 | $ | 763.18 | $ | 0.44 | $ | 4.57 | 17.67x | 173.82 | % | 15.60 | % | 174.04 | % | 17.97x | $ | 0.26 | 3.30 | % | 58.33 | % | $ | 4,887 | 8.98 | % | 8.97 | % | 0.85 | % | 0.89 | % | 9.97 | % | 0.88% | 9.80% | ||||||||||||||||||||||||||||||||||||||||||||
| Comparable Group |
||||||||||||||||||||||||||||||||||||||||||||||||||||||||||||||||||||||||||||||||||
| Averages |
$ | 17.16 | $ | 117.56 | $ | 0.67 | $ | 14.69 | 20.41x | 116.81 | % | 14.11 | % | 125.10 | % | 20.02x | $ | 0.18 | 1.00 | % | 46.26 | % | $ | 753 | 12.34 | % | 11.68 | % | 1.26 | % | 0.49 | % | 4.53 | % | 0.57% | 4.85% | ||||||||||||||||||||||||||||||||||||||||||||||
| Medians |
$ | 17.03 | $ | 77.93 | $ | 0.26 | $ | 14.83 | 19.64x | 121.33 | % | 12.88 | % | 121.50 | % | 20.31x | $ | 0.14 | 0.63 | % | 18.40 | % | $ | 669 | 10.76 | % | 10.34 | % | 0.93 | % | 0.47 | % | 4.56 | % | 0.53% | 4.62% | ||||||||||||||||||||||||||||||||||||||||||||||
| Comparable Group |
||||||||||||||||||||||||||||||||||||||||||||||||||||||||||||||||||||||||||||||||||
| BYBK |
Bay Bancorp, Inc. |
MD | $ | 7.05 | $ | 74.33 | $ | 0.26 | $ | 6.38 | 30.65x | 110.48 | % | 11.74 | % | 115.27 | % | 27.35x | $ | 0.00 | 0.00 | % | 0.00 | % | $ | 633 | 10.62 | % | 10.23 | % | 1.93 | % | 0.47 | % | 4.16 | % | 0.53% | 4.62% | ||||||||||||||||||||||||||||||||||||||||||||
| CSBK |
Clifton Bancorp Inc. |
NJ | $ | 16.31 | $ | 375.52 | $ | 0.20 | $ | 13.15 | NM | 124.02 | % | 27.41 | % | 124.02 | % | NM | $ | 0.24 | 1.47 | % | 120.00 | % | $ | 1,371 | 22.10 | % | 22.10 | % | 0.39 | % | 0.34 | % | 1.40 | % | 0.34% | 1.38% | ||||||||||||||||||||||||||||||||||||||||||||
| CWAY |
Coastway Bancorp, Inc. |
RI | $ | 20.20 | $ | 88.73 | $ | 0.83 | $ | 15.68 | 24.34x | 128.82 | % | 14.03 | % | 128.82 | % | 24.34x | $ | 0.00 | 0.00 | % | 0.00 | % | $ | 633 | 10.89 | % | 10.89 | % | 2.14 | % | 0.55 | % | 4.95 | % | 0.55% | 4.95% | ||||||||||||||||||||||||||||||||||||||||||||
| ESBK |
Elmira Savings Bank |
NY | $ | 20.80 | $ | 68.72 | $ | 1.28 | $ | 16.82 | 16.38x | 123.67 | % | 10.48 | % | 168.51 | % | 16.29x | $ | 0.92 | 4.42 | % | 72.44 | % | $ | 557 | 10.08 | % | 8.04 | % | 0.93 | % | 0.77 | % | 7.82 | % | 0.78% | 7.88% | ||||||||||||||||||||||||||||||||||||||||||||
| HBK |
Hamilton Bancorp, Inc. |
MD | $ | 15.12 | $ | 51.55 | $ | 0.17 | $ | 17.77 | NM | 85.07 | % | 10.33 | % | 100.65 | % | NM | $ | 0.00 | 0.00 | % | 0.00 | % | $ | 500 | 12.14 | % | 10.46 | % | 0.93 | % | 0.03 | % | 0.27 | % | 0.11% | 0.90% | ||||||||||||||||||||||||||||||||||||||||||||
| MLVF |
Malvern Bancorp, Inc. |
PA | $ | 21.95 | $ | 144.27 | $ | 1.82 | $ | 14.83 | 11.80x | 148.02 | % | 15.00 | % | 148.02 | % | 12.09x | $ | 0.00 | 0.00 | % | 0.00 | % | $ | 962 | 10.13 | % | 10.13 | % | 0.33 | % | 1.43 | % | 13.01 | % | 1.40% | 12.71% | ||||||||||||||||||||||||||||||||||||||||||||
| PBHC |
Pathfinder Bancorp, Inc. |
NY | $ | 15.04 | $ | 63.87 | NA | $ | 13.98 | 18.34x | 107.57 | % | 7.97 | % | 116.88 | % | NM | $ | 0.20 | 1.33 | % | 24.39 | % | $ | 802 | 7.46 | % | 6.91 | % | 1.46 | % | 0.49 | % | 5.90 | % | NA | NA | |||||||||||||||||||||||||||||||||||||||||||||
| PBBI |
PB Bancorp, Inc. |
CT | $ | 10.35 | $ | 81.52 | $ | 0.17 | $ | 10.86 | NM | 95.22 | % | 15.66 | % | 103.59 | % | NM | $ | 0.16 | 1.55 | % | 61.90 | % | $ | 521 | 16.45 | % | 15.32 | % | 1.32 | % | 0.31 | % | 1.90 | % | 0.25% | 1.53% | ||||||||||||||||||||||||||||||||||||||||||||
| PBIP |
Prudential Bancorp, Inc. |
PA | $ | 17.75 | $ | 160.03 | NA | NA | NM | 126.25 | % | 18.96 | % | 126.25 | % | NM | $ | 0.12 | 0.68 | % | 171.43 | % | $ | 844 | 15.49 | % | 14.69 | % | 3.17 | % | 0.06 | % | 0.30 | % | NA | NA | ||||||||||||||||||||||||||||||||||||||||||||||
| WEBK |
Wellesley Bancorp, Inc. |
MA | $ | 27.00 | $ | 67.09 | NA | $ | 22.69 | 20.93x | 118.99 | % | 9.53 | % | 118.99 | % | NM | $ | 0.16 | 0.59 | % | 12.40 | % | $ | 704 | 8.01 | % | 8.01 | % | 0.09 | % | 0.46 | % | 5.59 | % | NA | NA | |||||||||||||||||||||||||||||||||||||||||||||
| (1) | Core income, on a diluted per-share basis. Core income is net income after taxes and before extraordinary items, less net income attributable to noncontrolling interest, gain on the sale of securities, amortization of intangibles, goodwill and nonrecurring items. Assumed tax rate is 35%. |
| (2) | P/E = Price to earnings; P/B = Price to book; P/A = Price to assets; P/TB = Price to tangible book value; and P/Core = Price to core earnings. P/E and P/Core =NM if the ratio is negative or above 35x. |
| (3) | Indicated 12 month dividend, based on last quarterly dividend declared. |
| (4) | Indicated 12 month dividend as a percent of trailing 12 month earnings. |
| (5) | Equity and tangible equity equal common equity and tangible common equity, respectively. ROAA (return on average assets) and ROAE (return on average equity) are indicated ratios based on trailing 12 month earnings and average equity and assets balances. |
| (6) | Excludes from averages and medians those companies the subject of actual or rumored acquisition activities or unusual operating characteristics. |
Source: SNL Financial, LC. and RP Financial, LC. calculations. The information provided in this report has been obtained from sources we believe are reliable, but we cannot guarantee the accuracy or completeness of such information.
Copyright (c) 2017 by RP® Financial, LC.
| RP® Financial, LC. | VALUATION ANALYSIS | |
| IV.22 |
2. Price-to-Book (“P/B”). The application of the P/B valuation method requires calculating the Bank’s pro forma market value by applying a valuation P/B ratio, as derived from the Peer Group’s P/B ratio, to Ponce Bank’s pro forma book value (fully-converted basis). Based on the $139.6 million midpoint valuation, Ponce Bank’s pro forma P/B and P/TB ratios (fully-converted basis) both equaled 67.07%, respectively. In comparison to the average P/B and P/TB ratios for the Peer Group of 116.81% and 125.10%, respectively, the Bank’s ratios reflected a discount of 42.58% on a P/B basis and a discount of 46.39% on a P/TB basis. In comparison to the Peer Group’s median P/B and P/TB ratios of 121.33% and 121.50%, respectively, the Bank’s pro forma P/B and P/TB ratios (fully-converted basis) at the midpoint value reflected discounts of 44.72% and 44.80%, respectively. At the top of the super range, the Bank’s P/B and P/TB ratios (fully-converted basis) both equaled 75.13%. In comparison to the Peer Group’s average P/B and P/TB ratios, the Bank’s P/B and P/TB ratios at the top of the super range reflected discounts of 35.68% and 39.94%, respectively. In comparison to the Peer Group’s median P/B and P/TB ratios, the Bank’s P/B and P/TB ratios at the top of the super range reflected discounts of 38.08% and 38.16%, respectively. RP Financial considered the discounts under the P/B approach to be reasonable, given the nature of the calculation of the P/B ratio which mathematically results in a ratio discounted to book value. The discounts reflected under the P/B approach were also supported by the significant premiums reflected in the Bank’s P/E multiples.
On an MHC reported basis, the Bank’s P/B and P/TB ratios at the $139.6 million midpoint value both equaled 96.34%. In comparison to the average P/B and P/TB ratios indicated for the Peer Group of 116.81% and 125.10%, respectively, Ponce Bank’s ratios were discounted by 17.52% on a P/B basis and 22.99% on a P/TB basis. In comparison to the Peer Group’s median P/B and P/TB ratios of 121.33% and 121.50%, respectively, the Bank’s pro forma P/B and P/TB ratios (MHC basis) at the midpoint value reflected discounts of 20.60% and 20.71%, respectively. At the top of the super range, the Bank’s P/B and P/TB ratios (MHC basis) both equaled 113.38%. In comparison to the Peer Group’s average P/B and P/TB ratios, the Bank’s P/B and P/TB ratios at the top of the super range reflected discounts of 2.94% and 9.37%, respectively. In comparison to the Peer Group’s median P/B and P/TB ratios, the Bank’s P/B and P/TB ratios at the top of the super range reflected discounts of 6.55% and 6.68%, respectively.
| RP® Financial, LC. | VALUATION ANALYSIS | |
| IV.23 |
3. Price-to-Assets (“P/A”). The P/A valuation methodology determines market value by applying a valuation P/A ratio (fully-converted basis) to the Bank’s pro forma asset base, conservatively assuming no deposit withdrawals are made to fund stock purchases. In all likelihood there will be deposit withdrawals, which results in understating the pro forma P/A ratio which is computed herein. At the $139.6 million midpoint of the valuation range, Ponce Bank’s pro forma P/A ratio (fully-converted basis) equaled 15.50% of pro forma assets. Comparatively, the Peer Group companies exhibited an average P/A ratio of 14.11%, which implies a premium of 9.85% has been applied to the Bank’s pro forma P/A ratio. In comparison to the Peer Group’s median P/A ratio of 12.88%, the Bank’s pro forma P/A ratio (fully-converted basis) at the midpoint value reflects a premium of 20.34%.
On an MHC reported basis, Ponce Bank’s pro forma P/A ratio at the $139.6 million midpoint value equaled 16.66%. In comparison to the Peer Group’s average P/A ratio of 14.11%, Ponce Bank’s P/A ratio (MHC basis) indicated a premium of 18.07%. In comparison to the Peer Group’s median P/A ratio of 12.88%, the Bank’s pro forma P/A ratio (MHC basis) at the midpoint value reflects a premium of 29.35%.
Comparison to Publicly-Traded MHCs
As indicated in Chapter III, we believe there are a number of characteristics of MHC shares that make them different from the shares of fully-converted companies. These factors include: (1) lower aftermarket liquidity in the MHC shares since less than 50% of the shares are available for trading; (2) no opportunity for public shareholders to exercise voting control; (3) the potential pro forma impact of second-step conversions on the pricing of MHC institutions; and (4) the regulatory policies regarding the accounting for net assets held by the MHC in a second-step conversion and, thereby, lessening the attractiveness of paying cash dividends. The above characteristics of MHC shares have provided MHC stocks with different trading characteristics versus fully-converted companies. To account for the unique trading characteristics of MHC shares, RP Financial has placed the financial data and pricing ratios of the publicly-traded MHCs on a fully-converted basis to make them comparable for valuation purposes. Using the per share and pricing information of the publicly-traded MHCs on a fully-converted basis accomplishes a number of objectives. First, such figures eliminate distortions that result when
| RP® Financial, LC. | VALUATION ANALYSIS | |
| IV.24 |
trying to compare institutions that have different public ownership interests outstanding. Secondly, such an analysis provides ratios that are comparable to the pricing information of fully-converted public companies and are directly applicable to determining the pro forma market value range of the 100% ownership interest in Ponce Bank as an MHC. This technique is validated by the investment community’s evaluation of MHC pricing, which also incorporates the pro forma impact of a second-step conversion based on the current market price.
To calculate the fully-converted pricing information for MHCs, the reported financial information for the public MHCs incorporates the following assumptions: (1) all shares owned by the MHC are assumed to be sold at the current trading price in a second step-conversion; (2) the gross proceeds from such a sale are adjusted to reflect reasonable offering expenses and standard stock based benefit plan parameters that would be factored into a second-step conversion of an MHC institution; and (3) net proceeds are assumed to be reinvested at market rates on a tax effected basis. Book value per share and earnings per share figures for the public MHCs were adjusted by the impact of the assumed second step-conversion, resulting in an estimation of book value per share and earnings per share figures on a fully-converted basis. Table 4.6 on the following page shows the calculation of per share financial data (fully-converted basis) for each of the eight publicly-traded MHC institutions.
The table below shows a comparative pricing analysis of the publicly-traded MHCs on a fully-converted basis versus the Bank’s Peer Group. In comparison to the Peer Group’s P/TB ratio, the P/TB ratio of the publicly-traded MHCs reflected a discount of 23.38%. In comparison to the Peer Group’s core P/E multiple, the core P/E multiple of the publicly-traded MHCs reflected a premium of 158.79%. Detailed pricing characteristics of the fully-converted MHCs is shown in Table 4.7.
| Publicly-Traded MHCs |
Peer Group | |||||||
| Pricing Ratios (Averages)(1) |
||||||||
| Core price/earnings (x) |
51.81x | 20.02x | ||||||
| Price/tangible book (%) |
95.85 | % | 125.10 | % | ||||
| Price/assets (%) |
21.90 | 14.11 | ||||||
| (1) | Based on market prices as of May 5, 2017. |
In comparison to the publicly-traded MHCs, the Bank’s pro forma P/TB ratio (fully-converted basis) of 67.07% at the midpoint of the valuation range reflected a discount of
| RP® Financial, LC. | Valuation Analysis IV.25 |
Table 4.6
Calculation of Implied Per Share Data - Incorporating MHC Second Step Conversion
Publicly Traded MHC Institutions
| Per Share | Net Capital Increase(2) |
Net Income Increase(3) |
Pro Forma | |||||||||||||||||||||||||||||||||||||||||||||||||||||||||||||||||||||||||
| Current Ownership | TTM Net Income | Book Value |
Tang. Bk Value |
Share Price |
Gross Proceeds(1) |
Net Inc./ Share |
Core Net Inc./ Share |
Bk Value/ Share |
Tang. Bk. Value/Share |
Assets/ Share |
||||||||||||||||||||||||||||||||||||||||||||||||||||||||||||||||||
| Ticker |
Name |
City | State | Exhange | Public | MHC Shares | Total Shares | Reported | Core | Assets | ||||||||||||||||||||||||||||||||||||||||||||||||||||||||||||||||||
| GCBC |
Greene County Bncp Inc. (MHC) |
Catskill | NY | NASDAQ | 3,893,350 | 4,609,264 | 8,502,614 | $ | 1.17 | $ | 1.17 | $ | 9.22 | $ | 9.22 | $ | 109.61 | $ | 23.20 | $ | 106,934,925 | $ | 90,894,686 | ($ | 145,036 | ) | $ | 1.15 | $ | 1.15 | $ | 19.91 | $ | 19.91 | $ | 120.30 | ||||||||||||||||||||||||||||||||||||||||
| HONE |
HarborOne Bancorp Inc (MHC) |
Brockton | MA | NASDAQ | 14,839,846 | 17,281,034 | 32,120,880 | $ | 0.18 | $ | 0.28 | $ | 10.25 | $ | 9.83 | $ | 76.22 | $ | 21.12 | $ | 364,975,438 | $ | 310,229,122 | ($ | 495,016 | ) | $ | 0.17 | $ | 0.26 | $ | 19.91 | $ | 19.49 | $ | 85.88 | ||||||||||||||||||||||||||||||||||||||||
| KFFB |
Kentucky First Federal (MHC) |
Frankfort | KY | NASDAQ | 3,755,563 | 4,727,938 | 8,483,501 | $ | 0.13 | $ | 0.13 | $ | 7.95 | $ | 6.24 | $ | 36.05 | $ | 9.51 | $ | 44,953,707 | $ | 38,210,651 | ($ | 60,971 | ) | $ | 0.12 | $ | 0.12 | $ | 12.46 | $ | 10.75 | $ | 40.56 | ||||||||||||||||||||||||||||||||||||||||
| LSBK |
Lake Shore Bancorp Inc. (MHC) |
Dunkirk | NY | NASDAQ | 2,451,799 | 3,636,875 | 6,088,674 | $ | 0.58 | $ | 0.39 | $ | 12.49 | $ | 12.49 | $ | 80.34 | $ | 15.70 | $ | 57,098,938 | $ | 48,534,097 | ($ | 77,443 | ) | $ | 0.56 | $ | 0.37 | $ | 20.46 | $ | 20.46 | $ | 88.31 | ||||||||||||||||||||||||||||||||||||||||
| MGYR |
Magyar Bancorp Inc. (MHC) |
New Brunswick |
NJ | NASDAQ | 2,620,296 | 3,200,450 | 5,820,746 | $ | 0.19 | $ | 0.19 | $ | 8.23 | $ | 8.23 | $ | 100.97 | $ | 12.97 | $ | 41,509,837 | $ | 35,283,361 | ($ | 56,300 | ) | $ | 0.18 | $ | 0.18 | $ | 14.29 | $ | 14.29 | $ | 107.03 | ||||||||||||||||||||||||||||||||||||||||
| OFED |
Oconee Federal Financial Corp. |
Seneca | SC | NASDAQ | 1,635,369 | 4,155,596 | 5,790,965 | $ | 0.94 | $ | 0.93 | $ | 14.49 | $ | 13.93 | $ | 83.25 | $ | 26.00 | $ | 108,045,509 | $ | 91,838,682 | ($ | 146,542 | ) | $ | 0.92 | $ | 0.90 | $ | 30.35 | $ | 29.79 | $ | 99.11 | ||||||||||||||||||||||||||||||||||||||||
| PVBC |
Provident Bancorp Inc (MHC) |
Amesbury | MA | NASDAQ | 4,618,125 | 5,034,323 | 9,652,448 | $ | 0.66 | $ | 0.66 | $ | 11.31 | $ | 11.31 | $ | 82.42 | $ | 20.75 | $ | 104,462,202 | $ | 88,792,872 | ($ | 141,682 | ) | $ | 0.64 | $ | 0.64 | $ | 20.51 | $ | 20.51 | $ | 91.62 | ||||||||||||||||||||||||||||||||||||||||
| TFSL |
TFS Financial Corp (MHC) |
Cleveland | OH | NASDAQ | 56,392,835 | 227,119,132 | 283,511,967 | $ | 0.29 | $ | 0.29 | $ | 5.87 | $ | 5.84 | $ | 46.52 | $ | 16.90 | $ | 3,838,313,331 | $ | 3,262,566,331 | ($ | 5,205,904 | ) | $ | 0.27 | $ | 0.27 | $ | 17.38 | $ | 17.35 | $ | 58.03 | ||||||||||||||||||||||||||||||||||||||||
| (1) | Gross proceeds calculated as stock price multiplied by the number of shares owned by the MHC (i.e. non-public shares). |
| (2) | Net increase in capital reflects gross proceeds less offering expenses, contra-equity account for leveraged ESOP and Restricted Stock Plan. For MHC’s with assets at the MHC level, the net increase in capital also includes consolidation of MHC assets with the capital of the institution concurrent with hypothetical second step. |
| Offering Expense Percent: |
3.00 | % | ||||
| ESOP Percent Purchase: |
8.00 | % | ||||
| RRP Percent Purchase: |
4.00 | % | ||||
| (3) | Net increase in earnings reflects after-tax reinvestment income (assumes ESOP and RRP do not generate reinvestment income), less after-tax ESOP amortization and RRP vesting. |
| After-Tax Reinvestment Rate: |
1.17 | % | ||||
| ESOP Loan Term (Yrs.): |
20 | |||||
| Recognition Plan Vesting (Yrs.): |
5 | |||||
| Effective Tax Rate: |
34.00 | % | ||||
Source: SNL Financial, LC and RP Financial, LC. calculations.
| RP® Financial, LC. | Valuation Analysis | |
| IV.26 |
Table 4.7
MHC Institutions, Implied Pricing Ratios, Full Conversion Basis
Financial Data as of the Most Recent Quarter or Twelve Month Period Available
Prices as of May 5, 2017
| Key Financial Data | ||||||||||||||||||||||||||||||||||||||||||||||||||||||||||||||||||||||||||||||||||||
| Per Share Data | Pricing Ratios |
Dividends |
LTM | |||||||||||||||||||||||||||||||||||||||||||||||||||||||||||||||||||||||||||||||||
| Stock Price |
Mkt Value |
LTM EPS |
LTM Cr EPS |
BV/ Shr |
Tang. BV/Sh |
P/E LTM |
P/E Cre LTM |
Price/ Book |
Price/ TBk |
Price/ Assts |
Ann Div Rate |
Div. Yield |
Div Pay Ratio |
Total Assets |
E/A | Tang. E/A |
Reported | Core | ||||||||||||||||||||||||||||||||||||||||||||||||||||||||||||||||||
| Ticker |
Company Name |
City |
State |
Exchange |
ROAA | ROAE | ROAA | ROAE | ||||||||||||||||||||||||||||||||||||||||||||||||||||||||||||||||||||||||||||
| ($) | ($M) | ($) | ($) | ($) | ($) | (x) | (x) | (%) | (%) | (%) | ($) | (%) | (%) | ($000) | (%) | (%) | (%) | (%) | (%) | (%) | ||||||||||||||||||||||||||||||||||||||||||||||||||||||||||||||||
| Publicly Traded MHCs, Full Conversion Basis - Averages |
18.27 | 783.7 | 0.50 | 0.49 | 19.41 | 19.07 | 55.37 | 51.81 | 93.81 | 95.85 | 21.90 | 0.26 | 0.90 | 63.42 | 2,899,606 | 23.74 | 23.07 | 0.55 | 2.42 | 0.53 | 2.36 | |||||||||||||||||||||||||||||||||||||||||||||||||||||||||||||||
| Publicly Traded MHCs, Full Conversion Basis - Medians |
18.83 | 173.9 | 0.42 | 0.32 | 19.91 | 19.70 | 47.23 | 52.02 | 93.99 | 94.08 | 23.05 | 0.38 | 0.00 | 0.00 | 753,656 | 23.18 | 22.93 | 0.55 | 2.16 | 0.45 | 1.70 | |||||||||||||||||||||||||||||||||||||||||||||||||||||||||||||||
| Publicly Traded MHCs, Full Conversion Basis |
||||||||||||||||||||||||||||||||||||||||||||||||||||||||||||||||||||||||||||||||||||
| GCBC |
Greene County Bncp Inc. (MHC) |
Catskill | NY | NASDAQ | 23.20 | 197.3 | 1.15 | 1.15 | 19.91 | 19.91 | 20.17 | 20.17 | 116.53 | 116.53 | 19.28 | 0.38 | 0.00 | 0.0 | 1,022,876 | 16.55 | 16.55 | 0.96 | 5.78 | 0.96 | 5.78 | |||||||||||||||||||||||||||||||||||||||||||||||||||||||||||
| HONE |
HarborOne Bancorp Inc (MHC) |
Brockton | MA | NASDAQ | 21.12 | 678.4 | 0.17 | 0.26 | 19.91 | 19.49 | 124.80 | 80.35 | 106.06 | 108.36 | 24.59 | NA | 0.00 | 0.0 | 2,758,539 | 23.19 | 22.69 | 0.20 | 0.85 | 0.31 | 1.32 | |||||||||||||||||||||||||||||||||||||||||||||||||||||||||||
| KFFB |
Kentucky First Federal (MHC) |
Frankfort | KY | NASDAQ | 9.51 | 80.7 | 0.12 | 0.12 | 12.46 | 10.75 | 76.89 | 76.89 | 76.33 | 88.48 | 23.44 | 0.40 | 4.21 | 323.5 | 344,057 | 30.71 | 26.50 | 0.30 | 0.99 | 0.30 | 0.99 | |||||||||||||||||||||||||||||||||||||||||||||||||||||||||||
| LSBK |
Lake Shore Bancorp Inc. (MHC) |
Dunkirk | NY | NASDAQ | 15.70 | 95.6 | 0.56 | 0.37 | 20.46 | 20.46 | 27.81 | 41.90 | 76.74 | 76.74 | 17.78 | 0.00 | 0.00 | 0.0 | 537,708 | 23.17 | 23.17 | 0.64 | 2.76 | 0.42 | 1.83 | |||||||||||||||||||||||||||||||||||||||||||||||||||||||||||
| MGYR |
Magyar Bancorp Inc. (MHC) |
New Brunswick | NJ | NASDAQ | 12.97 | 75.5 | 0.18 | 0.18 | 14.29 | 14.29 | 70.44 | 71.92 | 90.75 | 90.75 | 12.12 | NA | 0.00 | 0.0 | 622,976 | 13.35 | 13.35 | 0.17 | 1.29 | 0.17 | 1.26 | |||||||||||||||||||||||||||||||||||||||||||||||||||||||||||
| OFED |
Oconee Federal Financial Corp. |
Seneca | SC | NASDAQ | 26.00 | 150.6 | 0.92 | 0.90 | 30.35 | 29.79 | 28.40 | 28.76 | 85.67 | 87.29 | 26.23 | 0.00 | 0.00 | 0.0 | 573,917 | 30.62 | 30.05 | 0.92 | 3.02 | 0.91 | 2.98 | |||||||||||||||||||||||||||||||||||||||||||||||||||||||||||
| PVBC |
Provident Bancorp Inc (MHC) |
Amesbury | MA | NASDAQ | 20.75 | 200.3 | 0.64 | 0.64 | 20.51 | 20.51 | 32.32 | 32.32 | 101.19 | 101.19 | 22.65 | NA | 0.00 | 0.0 | 884,336 | 22.38 | 22.38 | 0.70 | 3.13 | 0.70 | 3.13 | |||||||||||||||||||||||||||||||||||||||||||||||||||||||||||
| TFSL |
TFS Financial Corp (MHC) |
Cleveland | OH | NASDAQ | 16.90 | 4,791.4 | 0.27 | 0.27 | 17.38 | 17.35 | 62.14 | 62.14 | 97.23 | 97.42 | 29.12 | 0.50 | 2.96 | 183.8 | 16,452,441 | 29.95 | 29.89 | 0.47 | 1.56 | 0.47 | 1.56 | |||||||||||||||||||||||||||||||||||||||||||||||||||||||||||
Source: SNL Financial, LC and RP Financial, LC. calculations.
| RP® Financial, LC. | VALUATION ANALYSIS | |
| IV.27 |
30.03%. At the top of the super range, the Bank’s P/TB ratio (fully-converted basis) of 75.13% reflected a discount of 21.62%. In comparison to the publicly-traded MHCs, the Bank’s pro forma core P/E multiple (fully-converted basis) of 200.51 times at the midpoint of the valuation range reflected a premium of 287.01%. At the top of the super range, the Bank’s core P/E multiple (fully-converted basis) of 337.02 times reflected a premium of 550.49%.
It should be noted that in a comparison of the publicly-traded MHCs to Ponce Bank, the publicly-traded MHCs maintain certain inherit characteristics in support of increasing the attractiveness of their stocks relative to Ponce Bank’s stock as an MHC that will just be completing an IPO: (1) the seasoned publicly-traded MHCs are viewed as potential candidates to complete a second-step offering; and (2) some of the publicly-traded MHCs have been grandfathered to waive dividend payments to the MHC pursuant to receiving an annual majority vote by the depositors to approve the waiver of dividends.
Comparison to Recent MHC Offerings
As indicated at the beginning of this chapter, RP Financial’s analysis of recent conversion offering pricing characteristics at closing and in the aftermarket has been limited to a “technical” analysis and, thus, the pricing characteristics of recent conversion offerings can not be a primary determinate of value. Particular focus was placed on the P/TB approach in this analysis, since the P/E multiples do not reflect the actual impact of reinvestment and the source of the stock proceeds (i.e., external funds vs. deposit withdrawals). The most recent first-step MHC offering that is comparable to Ponce Bank’s first-step MHC offering was completed by Community First Bancshares of Covington, Georgia. Community First Bancshares’ offering, which closed in April 2017, raised gross proceeds of $34.7 million through the sale of 46.0% of its stock in a public offering. Community First Bancshares’ offering closed at the top of the super range at a fully-converted pro forma price/tangible book ratio of 68.50%. In comparison, the Bank’s pro forma fully-converted price/tangible book ratio at the midpoint value reflects an implied discount of 2.09% and at the top of the range reflects an implied premium of 9.68%.
Valuation Conclusion
Based on the foregoing, it is our opinion that, as of May 5, 2017, the estimated aggregate pro forma market value of the shares to be issued immediately following the conversion, both shares issued publicly as well as to the MHC, equaled $139,607,030 at the
| RP® Financial, LC. | VALUATION ANALYSIS | |
| IV.28 |
midpoint, equal to 13,960,703 shares offered at a per share value of $10.00. Pursuant to conversion guidelines, the 15% offering range indicates a minimum value of $118,665,980 and a maximum value of $160,548,080. Based on the $10.00 per share offering price determined by the Board, this valuation range equates to total shares outstanding of 11,866,598 at the minimum and 16,054,808 at the maximum. In the event the appraised value is subject to an increase, the aggregate pro forma market value may be increased up to a super maximum value of $184,630,290 without a resolicitation. Based on the $10.00 per share offering price, the super maximum value would result in total shares outstanding of 18,463,029. The Board of Directors has established a public offering range such that the public ownership of the Bank will constitute a 45.0% ownership interest prior to the issuance of shares to the Foundation. Accordingly, the offering to the public of the minority stock will equal $53,399,690 at the minimum, $62,823,160 at the midpoint, $72,246,630 at the maximum and $83,083,620 at the super maximum of the valuation range. Based on the public offering range and inclusive of the shares issued to the Foundation, equal to 3.3% of the shares issued in the stock issuance, the public ownership of shares will represent 48.3% of the shares issued throughout the valuation range. The pro forma valuation calculations relative to the Peer Group (fully-converted basis) are shown in Table 4.4 and are detailed in Exhibit IV-7 and Exhibit IV-8; the pro forma valuation calculations relative to the Peer Group based on reported financials are shown in Table 4.5 and are detailed in Exhibits IV-9 and IV-10.
EXHIBITS
LIST OF EXHIBITS
| Exhibit |
Description | |
| I-1 | Map of Office Locations | |
| I-2 | Audited Financial Statements | |
| I-3 | Key Operating Ratios | |
| I-4 | Investment Portfolio Composition | |
| I-5 | Yields and Costs | |
| I-6 | Loan Loss Allowance Activity | |
| I-7 | Interest Rate Risk Analysis | |
| I-8 | Fixed and Adjustable Rate Loans | |
| I-9 | Loan Portfolio Composition | |
| I-10 | Contractual Maturity by Loan Type | |
| I-11 | Loan Originations, Purchases, Sales and Repayments | |
| I-12 | Non-Performing Assets | |
| I-13 | Deposit Composition | |
| I-14 | Maturity of Time Deposits | |
| I-15 | Borrowing Activity | |
| II-1 | Description of Office Properties | |
| II-2 | Historical Interest Rates | |
LIST OF EXHIBITS (continued)
| Exhibit Number |
Description | |
| III-1 | General Characteristics of Publicly-Traded Institutions | |
| III-2 | Public Market Pricing of Mid-Atlantic Thrift Institutions | |
| III-3 | Public Market Pricing of New England Thrift Institutions | |
| III-4 | Peer Group Market Area Comparative Analysis | |
| IV-1 | Stock Prices: As of May 5, 2017 | |
| IV-2 | Historical Stock Price Indices | |
| IV-3 | Stock Indices as of May 5, 2017 | |
| IV-4 | New York Thrift Acquisitions 2013 - Present | |
| IV-5 | Director and Senior Management Summary Resumes | |
| IV-6 | Pro Forma Regulatory Capital Ratios | |
| IV-7 | Pro Forma Analysis Sheet – Fully Converted Basis | |
| IV-8 | Pro Forma Effect of Conversion Proceeds – Fully Converted Basis | |
| IV-9 | Pro Forma Analysis Sheet – Minority Stock Offering | |
| IV-10 | Pro Forma Effect of Conversion Proceeds – Minority Stock Offering | |
| V-1 | Firm Qualifications Statement | |
EXHIBIT I-1
Ponce Bank
Map of Office Locations
Exhibit I-1
Ponce Bank
Map of Office Locations
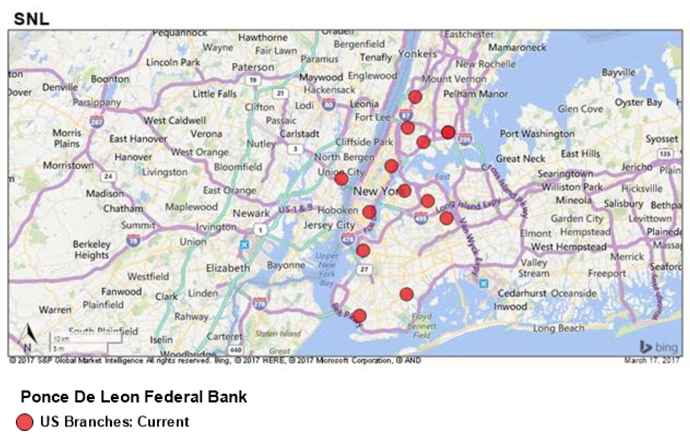
Source: SNL Financial, LC.
EXHIBIT I-2
Ponce Bank
Audited Financial Statements
[Incorporated by Reference]
EXHIBIT I-3
Ponce Bank
Key Operating Ratios
Exhibit I-3
Ponce Bank
Key Operating Ratios
| At or For the Three Months Ended March 31, |
At or For the Years Ended December 31, | |||||||||||||||||||||||||||
| 2017 (1) | 2016 (1) | 2016 | 2015 | 2014 | 2013 | 2012 | ||||||||||||||||||||||
| Performance Ratios: |
||||||||||||||||||||||||||||
| Return on average assets |
0.30 | % | 0.46 | % | 0.20 | % | 0.35 | % | 0.35 | % | 0.33 | % | 0.53 | % | ||||||||||||||
| Return on average equity |
2.43 | % | 3.46 | % | 1.53 | % | 2.76 | % | 2.80 | % | 2.79 | % | 4.68 | % | ||||||||||||||
| Interest rate spread (2) |
3.88 | % | 4.08 | % | 3.82 | % | 3.96 | % | 4.26 | % | 3.98 | % | 4.16 | % | ||||||||||||||
| Net interest margin (3) |
4.09 | % | 4.28 | % | 4.02 | % | 4.14 | % | 4.42 | % | 4.17 | % | 4.36 | % | ||||||||||||||
| Noninterest expense to average assets |
3.80 | % | 3.95 | % | 3.84 | % | 3.67 | % | 3.59 | % | 3.30 | % | 3.13 | % | ||||||||||||||
| Efficiency ratio (4) |
88.08 | % | 90.26 | % | 92.15 | % | 86.23 | % | 79.34 | % | 75.75 | % | 69.25 | % | ||||||||||||||
| Average interest-earning assets to average interest-bearing liabilities |
124.86 | % | 122.55 | % | 123.84 | % | 121.66 | % | 119.27 | % | 117.72 | % | 115.75 | % | ||||||||||||||
| Average equity to average assets |
12.38 | % | 12.99 | % | 12.81 | % | 12.78 | % | 12.58 | % | 11.79 | % | 11.41 | % | ||||||||||||||
| Capital Ratios: |
||||||||||||||||||||||||||||
| Total capital to risk weighted assets (bank only) |
18.16 | % | 20.65 | % | 19.21 | % | 20.72 | % | 20.32 | % | 18.85 | % | 17.97 | % | ||||||||||||||
| Tier 1 capital to risk weighted assets (bank only) |
16.91 | % | 19.40 | % | 17.96 | % | 19.46 | % | 19.06 | % | 17.59 | % | 16.71 | % | ||||||||||||||
| Common equity Tier 1 capital to risk-weighted assets (bank only) |
16.91 | % | 19.40 | % | 17.96 | % | 19.46 | % | N/A | N/A | N/A | |||||||||||||||||
| Tier 1 capital to average assets (bank only) |
13.08 | % | 13.80 | % | 13.32 | % | 13.67 | % | 13.46 | % | 12.65 | % | 11.86 | % | ||||||||||||||
| Asset Quality Ratios: |
||||||||||||||||||||||||||||
| Allowance for loan losses, as a percentage of total loans |
1.51 | % | 1.61 | % | 1.57 | % | 1.64 | % | 1.71 | % | 1.74 | % | 1.69 | % | ||||||||||||||
| Allowance for loan losses as a percentage of nonperforming loans |
134.92 | % | 117.15 | % | 132.15 | % | 99.78 | % | 58.77 | % | 21.63 | % | 18.02 | % | ||||||||||||||
| Net (charge-offs) recoveries to average outstanding loans during the year |
0.02 | % | 0.09 | % | 0.13 | % | (0.06 | %) | (0.30 | %) | (0.61 | %) | (0.48 | %) | ||||||||||||||
| Non-performing loans as a percentage of total loans |
1.19 | % | 1.38 | % | 1.18 | % | 1.65 | % | 2.91 | % | 7.98 | % | 9.73 | % | ||||||||||||||
| Non-performing loans as a percentage of total assets |
0.98 | % | 1.12 | % | 1.04 | % | 1.35 | % | 2.28 | % | 6.29 | % | 7.59 | % | ||||||||||||||
| Total non-performing assets as a percentage of total assets |
0.98 | % | 1.12 | % | 1.04 | % | 1.36 | % | 2.30 | % | 6.38 | % | 7.75 | % | ||||||||||||||
| Total non-performing assets, accruing loans past due 90 days or more, and accruing troubled debt restructured loans as a percentage of total assets |
3.29 | % | 3.84 | % | 3.50 | % | 4.19 | % | 5.27 | % | 7.50 | % | 9.25 | % | ||||||||||||||
| Other: |
||||||||||||||||||||||||||||
| Number of offices |
14 | 14 | 14 | 14 | 14 | 14 | 13 | |||||||||||||||||||||
| Number of full-time equivalent employees |
177 | 172 | 174 | 175 | 164 | 168 | 168 | |||||||||||||||||||||
| (1) | Ratios are annualized where appropriate. |
| (2) | Represents the difference between the weighted average yield on average interest-earning assets and the weighted average cost of average interest-bearing liabilities. |
| (3) | Represents net interest income as a percentage of average interest-earning assets. |
| (4) | Represents noninterest expense divided by the sum of net interest income and noninterest income. |
Source: Ponce Bank’s prospectus.
EXHIBIT I-4
Ponce Bank
Investment Portfolio Composition
Exhibit I-4
Ponce Bank
Investment Portfolio Composition
| At March 31, 2017 |
At December 31, | |||||||||||||||||||||||||||||||||||||||||||||||
| 2016 | 2015 | 2014 | 2013 | 2012 | ||||||||||||||||||||||||||||||||||||||||||||
| Amortized Cost |
Estimated Fair Value |
Amortized Cost |
Estimated Fair Value |
Amortized Cost |
Estimated Fair Value |
Amortized Cost |
Estimated Fair Value |
Amortized Cost |
Estimated Fair Value |
Amortized Cost |
Estimated Fair Value |
|||||||||||||||||||||||||||||||||||||
| (In thousands) | ||||||||||||||||||||||||||||||||||||||||||||||||
| U.S. Government and Federal Agencies |
$ | 41,907 | $ | 41,484 | $ | 41,906 | $ | 41,559 | $ | 71,899 | $ | 71,166 | $ | 88,828 | $ | 87,088 | $ | 90,823 | $ | 86,662 | $ | 96,022 | $ | 95,894 | ||||||||||||||||||||||||
| Certificates of Deposit |
500 | 500 | 500 | 500 | — | — | — | — | — | — | — | — | ||||||||||||||||||||||||||||||||||||
| Mortgage-Backed Securities |
||||||||||||||||||||||||||||||||||||||||||||||||
| FHLMC Certificates |
190 | 213 | 192 | 216 | 202 | 222 | 212 | 234 | 222 | 238 | 332 | 355 | ||||||||||||||||||||||||||||||||||||
| FNMA Certificates |
3,374 | 3,365 | 3,600 | 3,606 | 4,411 | 4,432 | 5,732 | 5,872 | 6,536 | 6,548 | 872 | 948 | ||||||||||||||||||||||||||||||||||||
| GNMA Certificates |
6,310 | 6,375 | 6,744 | 6,809 | 6,084 | 6,214 | 7,211 | 7,380 | 8,668 | 8,857 | 11,158 | 11,496 | ||||||||||||||||||||||||||||||||||||
|
|
|
|
|
|
|
|
|
|
|
|
|
|
|
|
|
|
|
|
|
|
|
|
|
|||||||||||||||||||||||||
| Total |
$ | 52,281 | $ | 51,937 | $ | 52,942 | $ | 52,690 | $ | 82,596 | $ | 82,034 | $ | 101,983 | $ | 100,574 | $ | 106,249 | $ | 102,305 | $ | 108,384 | $ | 108,693 | ||||||||||||||||||||||||
|
|
|
|
|
|
|
|
|
|
|
|
|
|
|
|
|
|
|
|
|
|
|
|
|
|||||||||||||||||||||||||
Source: Ponce Bank’s prospectus.
EXHIBIT I-5
Ponce Bank
Yields and Costs
Exhibit I-5
Ponce Bank
Yields and Costs
| At March 31, 2017 |
For the Three Months Ended March 31, | |||||||||||||||||||||||||||
| 2017 | 2016 | |||||||||||||||||||||||||||
| Yield/Rate | Average Outstanding Balance |
Interest | Average Yield/Rate (1) |
Average Outstanding Balance |
Interest | Average Yield/Rate (1) |
||||||||||||||||||||||
| (Dollars in thousands) | ||||||||||||||||||||||||||||
| Interest-earning assets: |
||||||||||||||||||||||||||||
| Loans |
5.18 | % | $ | 662,174 | 8,592 | 5.26 | % | $ | 580,106 | 8,279 | 5.74 | % | ||||||||||||||||
| Available-for-sale securities |
1.44 | % | 52,341 | 183 | 1.42 | % | 80,645 | 304 | 1.52 | % | ||||||||||||||||||
| Other (2) |
0.47 | % | 9,963 | 19 | 0.77 | % | 12,774 | 16 | 0.50 | % | ||||||||||||||||||
|
|
|
|
|
|
|
|
|
|||||||||||||||||||||
| Total interest-earning assets |
724,478 | 8,794 | 4.92 | % | 673,525 | 8,599 | 5.13 | % | ||||||||||||||||||||
| Non-interest-earning assets |
32,887 | 34,733 | ||||||||||||||||||||||||||
|
|
|
|
|
|||||||||||||||||||||||||
| Total assets |
$ | 757,365 | $ | 708,258 | ||||||||||||||||||||||||
|
|
|
|
|
|||||||||||||||||||||||||
| Interest-bearing liabilities: |
||||||||||||||||||||||||||||
| Savings accounts |
0.10 | % | 128,859 | 122 | 0.38 | % | 124,413 | 67 | 0.22 | % | ||||||||||||||||||
| Interest-bearing demand |
0.28 | % | 71,043 | 27 | 0.15 | % | 51,175 | 22 | 0.17 | % | ||||||||||||||||||
| Certificates of deposit |
1.51 | % | 362,470 | 1,316 | 1.47 | % | 366,145 | 1,336 | 1.47 | % | ||||||||||||||||||
|
|
|
|
|
|
|
|
|
|||||||||||||||||||||
| Total deposits |
562,372 | 1,465 | 1.06 | % | 541,733 | 1,425 | 1.06 | % | ||||||||||||||||||||
| Advance payments by borrowers |
1.25 | % | 4,928 | 1 | 0.08 | % | 3,814 | 1 | 0.11 | % | ||||||||||||||||||
| Borrowings |
1.04 | % | 12,955 | 29 | 0.91 | % | 4,066 | 6 | 0.59 | % | ||||||||||||||||||
|
|
|
|
|
|
|
|
|
|||||||||||||||||||||
| Total interest-bearing liabilities |
580,255 | 1,495 | 1.04 | % | 549,613 | 1,432 | 1.05 | % | ||||||||||||||||||||
| Non-interest-bearing liabilities: |
||||||||||||||||||||||||||||
| Non-interest-bearing demand |
80,066 | — | 63,474 | — | ||||||||||||||||||||||||
| Other non-interest-bearing liabilities |
3,247 | — | 3,198 | — | ||||||||||||||||||||||||
|
|
|
|
|
|
|
|
|
|||||||||||||||||||||
| Total non-interest-bearing liabilities |
83,313 | — | 66,672 | — | ||||||||||||||||||||||||
|
|
|
|
|
|
|
|
|
|||||||||||||||||||||
| Total liabilities |
663,568 | 1,495 | 616,285 | 1,432 | ||||||||||||||||||||||||
| Total equity |
93,797 | 91,973 | ||||||||||||||||||||||||||
|
|
|
|
|
|||||||||||||||||||||||||
| Total liabilities and total equity |
$ | 757,365 | 1.04 | % | $ | 708,258 | 1.05 | % | ||||||||||||||||||||
|
|
|
|
|
|
|
|
|
|||||||||||||||||||||
| Net interest income |
$ | 7,299 | $ | 7,167 | ||||||||||||||||||||||||
|
|
|
|
|
|||||||||||||||||||||||||
| Net interest rate spread(3) |
3.88 | % | 4.09 | % | ||||||||||||||||||||||||
|
|
|
|
|
|||||||||||||||||||||||||
| Net interest-earning assets (4) |
$ | 144,223 | $ | 123,912 | ||||||||||||||||||||||||
|
|
|
|
|
|||||||||||||||||||||||||
| Net interest margin (5) |
4.09 | % | 4.28 | % | ||||||||||||||||||||||||
| Average interest-earning assets to interest-bearing liabilities |
124.86 | % | 122.55 | % | ||||||||||||||||||||||||
Exhibit I-5 (continued)
Ponce Bank
Yields and Costs
| At December 31, 2016 |
2016 | For the Years Ended December 31, 2015 |
2014 | |||||||||||||||||||||||||||||||||||||
| Average Yield/Rate |
Average Outstanding Balance |
Interest | Average Yield/Rate |
Average Outstanding Balance |
Interest | Average Yield/Rate |
Average Outstanding Balance |
Interest | Average Yield/Rate |
|||||||||||||||||||||||||||||||
| (Dollars in thousands) | ||||||||||||||||||||||||||||||||||||||||
| Interest-earning assets: |
||||||||||||||||||||||||||||||||||||||||
| Loans |
5.23 | % | $ | 605,878 | 32,660 | 5.39 | % | $ | 569,032 | 32,100 | 5.64 | % | $ | 558,761 | 33,867 | 6.06 | % | |||||||||||||||||||||||
| Available-for-sale securities |
1.45 | % | 70,142 | 1,012 | 1.44 | % | 96,777 | 1,429 | 1.48 | % | 102,715 | 1,567 | 1.53 | % | ||||||||||||||||||||||||||
| Other (1) |
0.42 | % | 15,365 | 69 | 0.45 | % | 9,465 | 61 | 0.64 | % | 11,788 | 61 | 0.52 | % | ||||||||||||||||||||||||||
|
|
|
|
|
|
|
|
|
|
|
|
|
|||||||||||||||||||||||||||||
| Total interest-earning assets |
691,385 | 33,741 | 4.88 | % | 675,274 | 33,590 | 4.97 | % | 673,264 | 35,495 | 5.27 | % | ||||||||||||||||||||||||||||
| Non-interest-earning assets |
33,759 | 38,769 | 46,058 | |||||||||||||||||||||||||||||||||||||
|
|
|
|
|
|
|
|||||||||||||||||||||||||||||||||||
| Total assets |
$ | 725,144 | $ | 714,043 | $ | 719,322 | ||||||||||||||||||||||||||||||||||
|
|
|
|
|
|
|
|||||||||||||||||||||||||||||||||||
| Interest-bearing liabilities: |
||||||||||||||||||||||||||||||||||||||||
| Savings accounts |
0.10 | % | 126,573 | 327 | 0.26 | % | 122,538 | 240 | 0.20 | % | 127,200 | 248 | 0.19 | % | ||||||||||||||||||||||||||
| Interest-bearing demand |
0.28 | % | 54,493 | 96 | 0.18 | % | 46,692 | 77 | 0.16 | % | 44,546 | 60 | 0.13 | % | ||||||||||||||||||||||||||
| Certificates of deposit |
1.48 | % | 371,313 | 5,502 | 1.48 | % | 366,958 | 5,268 | 1.44 | % | 379,860 | 5,376 | 1.42 | % | ||||||||||||||||||||||||||
|
|
|
|
|
|
|
|
|
|
|
|
|
|||||||||||||||||||||||||||||
| Total deposits |
552,379 | 5,925 | 1.07 | % | 536,188 | 5,585 | 1.04 | % | 551,606 | 5,684 | 1.03 | % | ||||||||||||||||||||||||||||
| Advance payments by borrowers |
1.25 | % | 4,770 | 4 | 0.09 | % | 3,815 | 4 | 0.10 | % | 3,740 | 3 | 0.08 | % | ||||||||||||||||||||||||||
| Borrowings |
0.78 | % | 1,145 | 7 | 0.61 | % | 15,050 | 61 | 0.41 | % | 9,129 | 43 | 0.47 | % | ||||||||||||||||||||||||||
|
|
|
|
|
|
|
|
|
|
|
|
|
|||||||||||||||||||||||||||||
| Total interest-bearing liabilities |
558,294 | 5,936 | 1.06 | % | 555,053 | 5,650 | 1.02 | % | 564,475 | 5,730 | 1.02 | % | ||||||||||||||||||||||||||||
| Non-interest-bearing liabilities: |
||||||||||||||||||||||||||||||||||||||||
| Non-interest-bearing demand |
70,407 | — | 61,524 | — | 60,318 | — | ||||||||||||||||||||||||||||||||||
| Other non-interest bearing liabilities |
3,519 | — | 6,195 | — | 4,024 | — | ||||||||||||||||||||||||||||||||||
|
|
|
|
|
|
|
|
|
|
|
|
|
|||||||||||||||||||||||||||||
| Total non-interest-bearing liabilities |
73,926 | — | 67,719 | — | 64,342 | — | ||||||||||||||||||||||||||||||||||
|
|
|
|
|
|
|
|
|
|
|
|
|
|||||||||||||||||||||||||||||
| Total liabilities |
632,220 | 5,936 | 622,773 | 5,650 | 628,817 | 5,730 | ||||||||||||||||||||||||||||||||||
| Total equity |
92,924 | 91,270 | 90,505 | |||||||||||||||||||||||||||||||||||||
|
|
|
|
|
|
|
|||||||||||||||||||||||||||||||||||
| Total liabilities and total equity |
$ | 725,144 | 1.06 | % | $ | 714,043 | 1.02 | % | $ | 719,322 | 1.02 | % | ||||||||||||||||||||||||||||
|
|
|
|
|
|
|
|
|
|
|
|
|
|||||||||||||||||||||||||||||
| Net interest income |
$ | 27,805 | $ | 27,940 | $ | 29,765 | ||||||||||||||||||||||||||||||||||
|
|
|
|
|
|
|
|||||||||||||||||||||||||||||||||||
| Net interest rate spread(2) |
3.82 | % | 3.96 | % | 4.26 | % | ||||||||||||||||||||||||||||||||||
|
|
|
|
|
|
|
|||||||||||||||||||||||||||||||||||
| Net interest-earning assets (3) |
$ | 133,091 | $ | 120,221 | $ | 108,789 | ||||||||||||||||||||||||||||||||||
|
|
|
|
|
|
|
|||||||||||||||||||||||||||||||||||
| Net interest margin (4) |
4.02 | % | 4.14 | % | 4.42 | % | ||||||||||||||||||||||||||||||||||
| Average interest-earning assets to interest-bearing liabilities |
123.84 | % | 121.66 | % | 119.27 | % | ||||||||||||||||||||||||||||||||||
| (1) | Annualized where appropriate. |
| (2) | Includes FHLB demand accounts and FHLB stock dividends. |
| (3) | Net interest rate spread represents the difference between the weighted average yield on interest-earning assets and the weighted average rate of interest-bearing liabilities. |
| (4) | Net interest-earning assets represent total interest-earning assets less total interest-bearing liabilities. |
| (5) | Net interest margin represents net interest income divided by average total interest-earning assets. |
Source: Ponce Bank’s prospectus.
EXHIBIT I-6
Ponce Bank
Loan Loss Allowance Activity
Exhibit I-6
Ponce Bank
Loan Loss Allowance Activity
| Three Months Ended March 31 | Years Ended December 31, | |||||||||||||||||||||||||||
| 2017 | 2016 | 2016 | 2015 | 2014 | 2013 | 2012 | ||||||||||||||||||||||
| (Dollars in thousands) | ||||||||||||||||||||||||||||
| Allowance at beginning of year |
$ | 10,205 | $ | 9,484 | $ | 9,484 | $ | 9,449 | $ | 9,940 | $ | 10,056 | $ | 7,872 | ||||||||||||||
| Provision for loan losses |
52 | (547 | ) | (57 | ) | 353 | 1,184 | 3,426 | 5,132 | |||||||||||||||||||
| Charge offs: |
||||||||||||||||||||||||||||
| Mortgage loans: |
||||||||||||||||||||||||||||
| 1-4 family residences |
||||||||||||||||||||||||||||
| Investor owned |
— | — | (38 | ) | (142 | ) | (494 | ) | (1,042 | ) | (376 | ) | ||||||||||||||||
| Owner occupied |
— | — | — | (140 | ) | (207 | ) | (491 | ) | (128 | ) | |||||||||||||||||
| Multifamily residences |
— | — | (3 | ) | (257 | ) | (252 | ) | (254 | ) | (26 | ) | ||||||||||||||||
| Nonresidential properties |
— | — | — | (19 | ) | (268 | ) | (184 | ) | — | ||||||||||||||||||
| Construction and land |
— | (85 | ) | (85 | ) | (77 | ) | (32 | ) | (434 | ) | (467 | ) | |||||||||||||||
| Nonmortgage loans: |
||||||||||||||||||||||||||||
| Business |
(10 | ) | — | — | — | (945 | ) | (1,440 | ) | (1,954 | ) | |||||||||||||||||
| Consumer |
— | — | (13 | ) | (8 | ) | (19 | ) | (18 | ) | (56 | ) | ||||||||||||||||
|
|
|
|
|
|
|
|
|
|
|
|
|
|
|
|||||||||||||||
| Total charge offs |
(10 | ) | (85 | ) | (139 | ) | (643 | ) | (2,217 | ) | (3,863 | ) | (3,007 | ) | ||||||||||||||
| Recoveries: |
||||||||||||||||||||||||||||
| Mortgage loans: |
||||||||||||||||||||||||||||
| 1-4 family residences |
||||||||||||||||||||||||||||
| Investor owned |
5 | 3 | 18 | 53 | 198 | 4 | 2 | |||||||||||||||||||||
| Owner occupied |
1 | 134 | 142 | 10 | 37 | — | — | |||||||||||||||||||||
| Multifamily residences |
1 | — | 1 | — | 61 | 32 | 11 | |||||||||||||||||||||
| Nonresidential properties |
2 | 2 | 9 | 31 | 10 | — | 6 | |||||||||||||||||||||
| Construction and land |
— | — | 5 | — | — | 133 | — | |||||||||||||||||||||
| Nonmortgage loans: |
||||||||||||||||||||||||||||
| Business |
113 | 470 | 733 | 224 | 231 | 147 | 34 | |||||||||||||||||||||
| Consumer |
1 | 1 | 9 | 7 | 5 | 5 | 6 | |||||||||||||||||||||
|
|
|
|
|
|
|
|
|
|
|
|
|
|
|
|||||||||||||||
| Total recoveries |
123 | 610 | 917 | 325 | 542 | 321 | 59 | |||||||||||||||||||||
| Net (chargeoffs) recoveries |
113 | 525 | 778 | (318 | ) | (1,675 | ) | (3,542 | ) | (2,948 | ) | |||||||||||||||||
|
|
|
|
|
|
|
|
|
|
|
|
|
|
|
|||||||||||||||
| Allowance at end of year |
$ | 10,370 | $ | 9,462 | $ | 10,205 | $ | 9,484 | $ | 9,449 | $ | 9,940 | $ | 10,056 | ||||||||||||||
|
|
|
|
|
|
|
|
|
|
|
|
|
|
|
|||||||||||||||
| Allowance for loan losses as a percentage for nonperforming loans |
134.92 | % | 117.15 | % | 132.15 | % | 99.78 | % | 58.79 | % | 21.80 | % | 17.39 | % | ||||||||||||||
| Allowance for loan losses as a percentage of total loans |
1.51 | % | 1.61 | % | 1.57 | % | 1.64 | % | 1.71 | % | 1.74 | % | 1.69 | % | ||||||||||||||
| Net (chargeoffs) recoveries to average loans outstanding during the year |
0.02 | % | 0.09 | % | 0.13 | % | (0.06 | %) | (0.30 | %) | (0.61 | %) | (0.48 | %) | ||||||||||||||
Source: Ponce Bank’s prospectus.
EXHIBIT I-7
Ponce Bank
Interest Rate Risk Analysis
Exhibit I-7
Ponce Bank
Interest Rate Risk Analysis
The table below sets forth, as of March 31, 2017, the calculation of the estimated changes in our net interest income that would result from the designated immediate changes in the United States Treasury yield curve.
| Rate Shift (1) |
Net Interest Income Year 1 Forecast |
Year 1 Change from Level |
||||||
| (Dollars in thousands) | ||||||||
| +400 |
$ | 25,713 | -11.74 | % | ||||
| +300 |
26,690 | -8.39 | % | |||||
| +200 |
27,624 | -5.18 | % | |||||
| +100 |
28,460 | -2.31 | % | |||||
| Level |
29,134 | — | ||||||
| -100 |
29,159 | 0.09 | % | |||||
| (1) | Assumes an immediate uniform change in interest rates at all maturities. |
The table below sets forth, as of March 31, 2017, the calculation of the estimated changes in our NEV that would result from the designated immediate changes in the United States Treasury yield curve.
| Value of Assets (3) | ||||||||||||||||||||
| Estimated | Estimated Increase (Decrease) in NPV |
NPV | Increase (Decrease) |
|||||||||||||||||
| Change in Interest Rates (basis points) (1) |
NPV (2) | Amount | Percent | Ratio (4) | (basis points) | |||||||||||||||
| (Dollars in thousands) | ||||||||||||||||||||
| +400 |
$ | 92,175 | $ | (32,196 | ) | -25.89 | % | 12.48 | % | (283 | ) | |||||||||
| +300 |
101,594 | (22,778 | ) | -18.31 | % | 13.41 | % | (190 | ) | |||||||||||
| +200 |
110,373 | (13,999 | ) | -11.26 | % | 14.22 | % | (110 | ) | |||||||||||
| +100 |
118,239 | (6,132 | ) | -4.93 | % | 14.88 | % | (44 | ) | |||||||||||
| — |
124,372 | — | 0.00 | % | 15.31 | % | — | |||||||||||||
| -100 |
129,134 | 4,762 | 3.83 | % | 15.60 | % | 29 | |||||||||||||
| (1) | Assumes an immediate uniform change in interest rates at all maturities. |
| (2) | NPV is the discounted present value of expected cash flows from assets, liabilities and off-balance sheet contracts. |
| (3) | Present value of assets represents the discounted present value of incoming cash flows on interest-earning assets. |
| (4) | NPV Ratio represents NPV divided by the present value of assets. |
Source: Ponce Bank’s prospectus.
EXHIBIT I-8
Ponce Bank
Fixed and Adjustable Rate Loans
Exhibit I-8
Ponce Bank
Fixed and Adjustable Rate Loans
The following tables set forth our fixed and adjustable-rate loans at March 31, 2017 that are contractually due after March 31, 2018 and at December 31, 2016 that are contractually due after December 31, 2017.
| Due After March 31, 2018 | ||||||||||||
| Fixed | Adjustable | Total | ||||||||||
| (In thousands) | ||||||||||||
| Mortgage loans: |
||||||||||||
| 1-4 family residences |
||||||||||||
| Investor Owned |
$ | 25,670 | $ | 209,127 | $ | 234,797 | ||||||
| Owner Occupied |
37,690 | 55,706 | 93,396 | |||||||||
| Multifamily residences |
8,913 | 149,319 | 158,232 | |||||||||
| Nonresidential properties |
10,802 | 127,904 | 138,706 | |||||||||
| Construction and land |
13,691 | — | 13,691 | |||||||||
|
|
|
|
|
|
|
|||||||
| Total mortgage loans |
96,766 | 542,056 | 638,822 | |||||||||
| Nonmortgage loans: |
||||||||||||
| Business |
4,550 | 1,983 | 6,533 | |||||||||
| Consumer |
671 | — | 671 | |||||||||
|
|
|
|
|
|
|
|||||||
| Total nonmortgage loans |
5,221 | 1,983 | 7,204 | |||||||||
|
|
|
|
|
|
|
|||||||
| Total |
$ | 101,987 | $ | 544,039 | $ | 646,026 | ||||||
|
|
|
|
|
|
|
|||||||
| Due After December 31, 2017 | ||||||||||||
| Fixed | Adjustable | Total | ||||||||||
| (In thousands) | ||||||||||||
| Mortgage loans: |
||||||||||||
| 1-4 family residences |
||||||||||||
| Investor owned |
$ | 33,225 | $ | 189,254 | $ | 222,479 | ||||||
| Owner occupied |
42,087 | 54,079 | 96,166 | |||||||||
| Multifamily residences |
15,126 | 140,877 | 156,003 | |||||||||
| Nonresidential properties |
24,170 | 95,517 | 119,687 | |||||||||
| Construction and land |
8,004 | — | 8,004 | |||||||||
|
|
|
|
|
|
|
|||||||
| Total mortgage loans |
122,612 | 479,727 | 602,339 | |||||||||
| Nonmortgage loans: |
||||||||||||
| Business |
4,623 | 2,093 | 6,716 | |||||||||
| Consumer |
717 | — | 717 | |||||||||
|
|
|
|
|
|
|
|||||||
| Total nonmortgage loans |
5,340 | 2,093 | 7,433 | |||||||||
|
|
|
|
|
|
|
|||||||
| Total |
$ | 127,952 | $ | 481,820 | $ | 609,772 | ||||||
|
|
|
|
|
|
|
|||||||
Source: Ponce Bank’s prospectus.
EXHIBIT I-9
Ponce Bank
Loan Portfolio Composition
Exhibit I-9
Ponce Bank
Loan Portfolio Composition
| At March 31, | At December 31, | |||||||||||||||||||||||||||||||||||||||||||||||
| 2017 | 2016 | 2015 | 2014 | 2013 | 2012 | |||||||||||||||||||||||||||||||||||||||||||
| Amount | Percent | Amount | Percent | Amount | Percent | Amount | Percent | Amount | Percent | Amount | Percent | |||||||||||||||||||||||||||||||||||||
| (Dollars in thousands) | ||||||||||||||||||||||||||||||||||||||||||||||||
| Mortgage loans: |
||||||||||||||||||||||||||||||||||||||||||||||||
| 1-4 family residences |
||||||||||||||||||||||||||||||||||||||||||||||||
| Investor Owned |
$ | 237,904 | 34.62 | % | $ | 227,409 | 34.90 | % | $ | 203,239 | 35.25 | % | $ | 190,726 | 34.54 | % | $ | 195,762 | 34.27 | % | $ | 207,981 | 34.99 | % | ||||||||||||||||||||||||
| Owner-Occupied |
96,085 | 13.98 | % | 97,631 | 14.98 | % | 106,053 | 18.39 | % | 105,222 | 19.05 | % | 111,252 | 19.47 | % | 105,084 | 17.68 | % | ||||||||||||||||||||||||||||||
| Multifamily residences |
161,833 | 23.55 | % | 158,200 | 24.28 | % | 122,836 | 21.30 | % | 110,978 | 20.10 | % | 107,541 | 18.82 | % | 107,949 | 18.16 | % | ||||||||||||||||||||||||||||||
| Nonresidential properties |
140,501 | 20.45 | % | 121,500 | 18.64 | % | 106,462 | 18.46 | % | 111,806 | 20.24 | % | 109,603 | 19.19 | % | 115,614 | 19.45 | % | ||||||||||||||||||||||||||||||
| Construction and land |
37,610 | 5.47 | % | 30,340 | 4.66 | % | 22,883 | 3.97 | % | 18,707 | 3.39 | % | 25,567 | 4.48 | % | 29,708 | 5.00 | % | ||||||||||||||||||||||||||||||
|
|
|
|
|
|
|
|
|
|
|
|
|
|
|
|
|
|
|
|
|
|
|
|
|
|||||||||||||||||||||||||
| Total mortgage loans |
673,933 | 98.07 | % | 635,080 | 97.46 | % | 561,473 | 97.37 | % | 537,439 | 97.32 | % | 549,725 | 96.23 | % | 566,336 | 95.28 | % | ||||||||||||||||||||||||||||||
| Nonmortgage loans: |
||||||||||||||||||||||||||||||||||||||||||||||||
| Business |
12,434 | 1.81 | % | 15,719 | 2.41 | % | 14,350 | 2.49 | % | 14,206 | 2.57 | % | 20,349 | 3.56 | % | 26,545 | 4.47 | % | ||||||||||||||||||||||||||||||
| Consumer |
796 | 0.12 | % | 843 | 0.13 | % | 788 | 0.14 | % | 614 | 0.11 | % | 1,210 | 0.21 | % | 1,537 | 0.25 | % | ||||||||||||||||||||||||||||||
|
|
|
|
|
|
|
|
|
|
|
|
|
|
|
|
|
|
|
|
|
|
|
|
|
|||||||||||||||||||||||||
| Total nonmortgage loans |
13,230 | 1.93 | % | 16,562 | 2.54 | % | 15,138 | 2.63 | % | 14,820 | 2.68 | % | 21,559 | 3.77 | % | 28,082 | 4.72 | % | ||||||||||||||||||||||||||||||
|
|
|
|
|
|
|
|
|
|
|
|
|
|
|
|
|
|
|
|
|
|
|
|
|
|||||||||||||||||||||||||
| 687,163 | 100.00 | % | 651,642 | 100.00 | % | 576,611 | 100.00 | % | 552,259 | 100.00 | % | 571,284 | 100.00 | % | 594,418 | 100.00 | % | |||||||||||||||||||||||||||||||
|
|
|
|
|
|
|
|
|
|
|
|
|
|||||||||||||||||||||||||||||||||||||
| Net deferred loan origination costs |
732 | 711 | 535 | 479 | 279 | 244 | ||||||||||||||||||||||||||||||||||||||||||
| Allowance for losses on loans |
(10,370 | ) | (10,205 | ) | (9,484 | ) | (9,449 | ) | (9,940 | ) | (10,056 | ) | ||||||||||||||||||||||||||||||||||||
|
|
|
|
|
|
|
|
|
|
|
|
|
|||||||||||||||||||||||||||||||||||||
| Loans, net |
$ | 677,525 | $ | 642,148 | $ | 567,662 | $ | 543,289 | $ | 561,623 | $ | 584,606 | ||||||||||||||||||||||||||||||||||||
|
|
|
|
|
|
|
|
|
|
|
|
|
|||||||||||||||||||||||||||||||||||||
Source: Ponce Bank’s prospectus.
EXHIBIT I-10
Ponce Bank
Contractual Maturity by Loan Type
Exhibit I-10
Ponce Bank
Contractual Maturity by Loan Type
| March 31, 2017 |
1-4 family residences - Investor Owned |
1-4 family residences - Owner Occupied |
Multifamily Residences |
Nonresidential properties |
||||||||||||
| (In thousands) | ||||||||||||||||
| Amounts due in: |
||||||||||||||||
| One year or less |
$ | 3,107 | $ | 2,689 | $ | 3,601 | $ | 1,794 | ||||||||
| More than one to five years |
12,917 | 3,270 | 5,225 | 10,286 | ||||||||||||
| More than five years |
221,880 | 90,126 | 153,007 | 128,420 | ||||||||||||
|
|
|
|
|
|
|
|
|
|||||||||
| Total |
$ | 237,904 | $ | 96,085 | $ | 161,833 | $ | 140,500 | ||||||||
|
|
|
|
|
|
|
|
|
|||||||||
| March 31, 2017 |
Construction and Land |
Business | Consumer | Total | ||||||||||||
| (In thousands) | ||||||||||||||||
| Amounts due in |
||||||||||||||||
| One year or less |
$ | 23,920 | $ | 5,901 | $ | 125 | $ | 41,137 | ||||||||
| More than one to five years |
13,691 | 6,533 | 671 | 52,593 | ||||||||||||
| More than five years |
— | — | — | 593,433 | ||||||||||||
|
|
|
|
|
|
|
|
|
|||||||||
| Total |
$ | 37,611 | $ | 12,434 | $ | 796 | $ | 687,163 | ||||||||
|
|
|
|
|
|
|
|
|
|||||||||
| December 31, 2016 |
1-4 family residences - Investor Owned |
1-4 family residences - Owner Occupied |
Multifamily Residences |
Nonresidential properties |
||||||||||||
| (In thousands) | ||||||||||||||||
| Amounts due in: |
||||||||||||||||
| One year or less |
$ | 4,930 | $ | 1,465 | $ | 2,197 | $ | 1,813 | ||||||||
| More than one to five years |
13,915 | 4,078 | 6,593 | 9,598 | ||||||||||||
| More than five years |
208,564 | 92,088 | 149,410 | 110,089 | ||||||||||||
|
|
|
|
|
|
|
|
|
|||||||||
| Total |
$ | 227,409 | $ | 97,631 | $ | 158,200 | $ | 121,500 | ||||||||
|
|
|
|
|
|
|
|
|
|||||||||
| December 31, 2016 |
Construction and Land |
Business | Consumer | Total | ||||||||||||
| (In thousands) | ||||||||||||||||
| Amounts due in: |
||||||||||||||||
| One year or less |
$ | 22,336 | $ | 9,003 | $ | 126 | $ | 41,870 | ||||||||
| More than one to five years |
8,004 | 6,716 | 717 | 49,621 | ||||||||||||
| More than five years |
— | — | — | 560,151 | ||||||||||||
|
|
|
|
|
|
|
|
|
|||||||||
| Total |
$ | 30,340 | $ | 15,719 | $ | 843 | $ | 651,642 | ||||||||
|
|
|
|
|
|
|
|
|
|||||||||
Source: Ponce Bank’s prospectus.
EXHIBIT I-11
Ponce Bank
Loan Originations, Purchases, Sales and Repayments
Exhibit I-11
Ponce Bank
Loan Originations, Purchases, Sales and Repayments
| Three Months Ended March 31, | Years Ended December 31, | |||||||||||||||||||||||||||
| 2017 | 2016 | 2016 | 2015 | 2014 | 2013 | 2012 | ||||||||||||||||||||||
| (In thousands) | ||||||||||||||||||||||||||||
| Total loans at beginning of year |
$ | 651,642 | $ | 576,611 | $ | 576,611 | $ | 552,259 | $ | 571,284 | $ | 594,418 | $ | 622,359 | ||||||||||||||
| Loans originated: |
||||||||||||||||||||||||||||
| Mortgage loans: |
||||||||||||||||||||||||||||
| 1-4 family residences |
||||||||||||||||||||||||||||
| Investor owned |
19,379 | 9,471 | 57,167 | 39,309 | 34,603 | 31,508 | 20,544 | |||||||||||||||||||||
| Owner occupied |
4,374 | 2,747 | 14,741 | 12,555 | 11,625 | 23,001 | 10,171 | |||||||||||||||||||||
| Multifamily residences |
9,030 | 18,763 | 51,876 | 34,048 | 28,965 | 21,986 | 19,955 | |||||||||||||||||||||
| Nonresidential properties |
24,746 | 2,764 | 31,408 | 18,365 | 15,972 | 13,850 | 9,902 | |||||||||||||||||||||
| Construction and land |
15,675 | 6,850 | 5,693 | 3,497 | 15,485 | 10,389 | 13,589 | |||||||||||||||||||||
|
|
|
|
|
|
|
|
|
|
|
|
|
|
|
|||||||||||||||
| Total mortgage loans |
73,204 | 40,595 | 160,885 | 107,774 | 106,650 | 100,734 | 74,161 | |||||||||||||||||||||
| Nonmortgage loans: |
||||||||||||||||||||||||||||
| Business |
1,555 | 414 | 1,222 | 7,451 | 4,540 | 5,084 | 1,924 | |||||||||||||||||||||
| Consumer |
67 | 149 | 718 | 692 | 277 | 516 | 782 | |||||||||||||||||||||
|
|
|
|
|
|
|
|
|
|
|
|
|
|
|
|||||||||||||||
| Total nonmortgage loans |
1,622 | 563 | 1,940 | 8,143 | 4,817 | 5,600 | 2,706 | |||||||||||||||||||||
|
|
|
|
|
|
|
|
|
|
|
|
|
|
|
|||||||||||||||
| Total loans |
74,826 | 41,158 | 162,825 | 115,917 | 111,467 | 106,334 | 76,867 | |||||||||||||||||||||
| Loans purchased: |
||||||||||||||||||||||||||||
| Mortgage loans: |
||||||||||||||||||||||||||||
| 1-4 family residences |
— | — | — | — | — | — | — | |||||||||||||||||||||
| Investor owned |
— | — | — | — | — | — | — | |||||||||||||||||||||
| Owner occupied |
— | — | — | — | — | — | — | |||||||||||||||||||||
| Multifamily residences |
— | — | — | — | — | — | — | |||||||||||||||||||||
| Nonresidential properties |
— | — | — | — | — | — | — | |||||||||||||||||||||
| Construction and land |
— | — | — | — | — | — | — | |||||||||||||||||||||
|
|
|
|
|
|
|
|
|
|
|
|
|
|
|
|||||||||||||||
| Total mortgage loans |
— | — | — | — | — | — | — | |||||||||||||||||||||
| Nonmortgage loans: |
||||||||||||||||||||||||||||
| Business |
— | — | — | — | — | — | — | |||||||||||||||||||||
| Consumer |
— | — | — | — | — | — | — | |||||||||||||||||||||
|
|
|
|
|
|
|
|
|
|
|
|
|
|
|
|||||||||||||||
| Total nonmortgage loans |
— | — | — | — | — | — | — | |||||||||||||||||||||
|
|
|
|
|
|
|
|
|
|
|
|
|
|
|
|||||||||||||||
| Total loans |
— | — | — | — | — | — | — | |||||||||||||||||||||
| Loans sold: |
||||||||||||||||||||||||||||
| Mortgage loans: |
||||||||||||||||||||||||||||
| 1-4 family residences |
— | — | — | — | — | — | — | |||||||||||||||||||||
| Investor owned |
— | — | — | — | — | — | — | |||||||||||||||||||||
| Owner occupied |
— | — | — | — | — | — | (275 | ) | ||||||||||||||||||||
| Multifamily residences |
— | — | — | — | (838 | ) | — | (991 | ) | |||||||||||||||||||
| Nonresidential properties |
— | — | — | — | — | — | — | |||||||||||||||||||||
| Construction and land |
— | — | — | — | — | — | (1,163 | ) | ||||||||||||||||||||
|
|
|
|
|
|
|
|
|
|
|
|
|
|
|
|||||||||||||||
| Total mortgage loans |
— | — | — | — | (838 | ) | — | (2,429 | ) | |||||||||||||||||||
| Nonmortgage loans: |
||||||||||||||||||||||||||||
| Business |
— | — | — | — | — | — | — | |||||||||||||||||||||
| Consumer |
— | — | — | — | — | — | — | |||||||||||||||||||||
|
|
|
|
|
|
|
|
|
|
|
|
|
|
|
|||||||||||||||
| Total nonmortgage loans |
— | — | — | — | — | — | — | |||||||||||||||||||||
|
|
|
|
|
|
|
|
|
|
|
|
|
|
|
|||||||||||||||
| Total loans |
— | — | — | — | (838 | ) | — | (2,429 | ) | |||||||||||||||||||
| Principal repayments and other |
(39,305 | ) | (30,493 | ) | (87,794 | ) | (91,565 | ) | (131,330 | ) | (129,468 | ) | (107,237 | ) | ||||||||||||||
|
|
|
|
|
|
|
|
|
|
|
|
|
|
|
|||||||||||||||
| Net loan activity |
35,521 | 10,665 | 75,031 | 24,352 | (19,025 | ) | (23,134 | ) | (27,941 | ) | ||||||||||||||||||
|
|
|
|
|
|
|
|
|
|
|
|
|
|
|
|||||||||||||||
| Total loans at end of year |
$ | 687,163 | $ | 587,276 | $ | 651,642 | $ | 576,611 | $ | 552,259 | $ | 571,284 | $ | 594,418 | ||||||||||||||
|
|
|
|
|
|
|
|
|
|
|
|
|
|
|
|||||||||||||||
Source: Ponce Bank’s prospectus.
EXHIBIT I-12
Ponce Bank
Non-Performing Assets
Exhibit I-12
Ponce Bank
Non-Performing Assets
| At March 31, |
At December 31, | |||||||||||||||||||||||
| 2017 | 2016 | 2015 | 2014 | 2013 | 2012 | |||||||||||||||||||
| (Dollars in thousands) | ||||||||||||||||||||||||
| Nonaccrual loans: |
||||||||||||||||||||||||
| Mortgage loans: |
||||||||||||||||||||||||
| 1-4 family residences |
||||||||||||||||||||||||
| Investor owned |
$ | 573 | $ | 809 | $ | 1,635 | $ | 2,721 | $ | 7,365 | $ | 12,504 | ||||||||||||
| Owner occupied |
1,723 | 1,463 | 1,078 | 1,036 | 4,983 | 6,762 | ||||||||||||||||||
| Multifamily residences |
— | — | — | 2,957 | 4,040 | 4,320 | ||||||||||||||||||
| Nonresidential properties |
1,606 | 1,614 | 1,660 | 72 | 1,579 | 3,232 | ||||||||||||||||||
| Construction and land |
1,142 | 1,145 | 637 | 259 | 3,019 | 7,143 | ||||||||||||||||||
| Nonmortgage loans: |
||||||||||||||||||||||||
| Business |
12 | 22 | 13 | 14 | 236 | 1,686 | ||||||||||||||||||
| Consumer |
— | — | — | — | 29 | 40 | ||||||||||||||||||
|
|
|
|
|
|
|
|
|
|
|
|
|
|||||||||||||
| Total nonaccrual loans (not including nonaccruing troubled debt restructured loans) |
5,056 | 5,053 | 5,023 | 7,059 | 21,251 | 35,687 | ||||||||||||||||||
| Nonaccruing troubled debt restructured loans: |
||||||||||||||||||||||||
| Mortgage loans: |
||||||||||||||||||||||||
| 1-4 family residences |
||||||||||||||||||||||||
| Investor owned |
1,214 | 1,240 | 2,599 | 4,585 | 10,059 | 7,666 | ||||||||||||||||||
| Owner occupied |
636 | 646 | 1,055 | 1,923 | 7,471 | 7,534 | ||||||||||||||||||
| Multifamily residences |
— | — | — | — | 396 | 450 | ||||||||||||||||||
| Nonresidential properties |
780 | 783 | 828 | 2,427 | 5,658 | 5,508 | ||||||||||||||||||
| Construction and land |
— | — | — | — | — | 154 | ||||||||||||||||||
| Nonmortgage loans: |
||||||||||||||||||||||||
| Business |
— | — | — | 79 | 751 | 824 | ||||||||||||||||||
| Consumer |
— | — | — | — | — | — | ||||||||||||||||||
|
|
|
|
|
|
|
|
|
|
|
|
|
|||||||||||||
| Total nonaccruing troubled debt restructured loans |
2,630 | 2,669 | 4,482 | 9,014 | 24,335 | 22,136 | ||||||||||||||||||
| Total nonaccrual loans |
7,686 | 7,722 | 9,505 | 16,073 | 45,586 | 57,823 | ||||||||||||||||||
|
|
|
|
|
|
|
|
|
|
|
|
|
|||||||||||||
| Real estate owned: |
||||||||||||||||||||||||
| Mortgage loans: |
||||||||||||||||||||||||
| 1-4 family residences |
||||||||||||||||||||||||
| Investor owned |
— | — | — | — | — | — | ||||||||||||||||||
| Owner occupied |
— | — | — | — | — | — | ||||||||||||||||||
| Multifamily residences |
— | — | — | — | — | — | ||||||||||||||||||
| Nonresidential properties |
— | — | — | — | — | — | ||||||||||||||||||
| Construction and land |
— | — | 76 | 162 | 1,059 | 1,200 | ||||||||||||||||||
| Nonmortgage loans: |
||||||||||||||||||||||||
| Business |
— | — | — | — | — | — | ||||||||||||||||||
| Consumer |
— | — | — | — | — | — | ||||||||||||||||||
|
|
|
|
|
|
|
|
|
|
|
|
|
|||||||||||||
| Total real estate owned |
— | — | 76 | 162 | 1,059 | 1,200 | ||||||||||||||||||
|
|
|
|
|
|
|
|
|
|
|
|
|
|||||||||||||
| Total nonperforming assets |
$ | 7,686 | $ | 7,722 | $ | 9,581 | $ | 16,235 | $ | 46,645 | $ | 59,023 | ||||||||||||
|
|
|
|
|
|
|
|
|
|
|
|
|
|||||||||||||
| Accruing loans past due 90 days or more: |
||||||||||||||||||||||||
| Mortgage loans: |
||||||||||||||||||||||||
| 1-4 family residences |
||||||||||||||||||||||||
| Investor owned |
— | — | — | — | — | — | ||||||||||||||||||
| Owner occupied |
— | — | — | — | — | — | ||||||||||||||||||
| Multifamily residences |
— | — | — | — | — | — | ||||||||||||||||||
| Nonresidential properties |
— | — | — | 126 | 127 | 299 | ||||||||||||||||||
| Construction and land |
— | — | — | 1,257 | 894 | — | ||||||||||||||||||
| Nonmortgage loans: |
||||||||||||||||||||||||
| Business |
— | — | — | 600 | — | 3,511 | ||||||||||||||||||
| Consumer |
— | — | — | — | — | — | ||||||||||||||||||
|
|
|
|
|
|
|
|
|
|
|
|
|
|||||||||||||
| Total accruing loans past due 90 days or more |
— | — | — | 1,983 | 1,021 | 3,810 | ||||||||||||||||||
| Accruing troubled debt restructured loans: |
||||||||||||||||||||||||
| Mortgage loans: |
||||||||||||||||||||||||
| 1-4 family residences |
||||||||||||||||||||||||
| Investor owned |
6,385 | 6,422 | 6,579 | 5,179 | 2,371 | 4,134 | ||||||||||||||||||
| Owner occupied |
7,232 | 7,271 | 8,326 | 9,661 | 2,476 | 2,209 | ||||||||||||||||||
| Multifamily residences |
— | — | — | — | — | — | ||||||||||||||||||
| Nonresidential properties |
4,036 | 4,066 | 4,186 | 3,590 | 2,262 | 1,256 | ||||||||||||||||||
| Construction and land |
— | — | — | — | — | — | ||||||||||||||||||
| Nonmortgage loans: |
||||||||||||||||||||||||
| Business |
546 | 593 | 814 | 970 | — | — | ||||||||||||||||||
| Consumer |
— | — | — | — | — | — | ||||||||||||||||||
|
|
|
|
|
|
|
|
|
|
|
|
|
|||||||||||||
| Total accruing troubled debt restructured loans |
$ | 18,199 | $ | 18,352 | $ | 19,905 | $ | 19,400 | $ | 7,109 | $ | 7,599 | ||||||||||||
|
|
|
|
|
|
|
|
|
|
|
|
|
|||||||||||||
| Total nonperforming assets, accruing loans past due 90 days or more and accruing troubled debt restructured loans |
$ | 25,885 | $ | 26,074 | $ | 29,486 | $ | 37,618 | $ | 54,775 | $ | 70,432 | ||||||||||||
| Total nonperforming loans to total loans |
1.12 | % | 1.19 | % | 1.65 | % | 2.91 | % | 7.98 | % | 9.73 | % | ||||||||||||
| Total nonperforming assets to total assets |
0.98 | % | 1.04 | % | 1.35 | % | 2.28 | % | 6.24 | % | 7.59 | % | ||||||||||||
| Total nonperforming assets, accruing loans past due 90 days or more and accruing troubled debt restructured loans to total assets |
3.29 | % | 3.50 | % | 4.19 | % | 5.33 | % | 7.50 | % | 9.25 | % | ||||||||||||
Source: Ponce Bank’s prospectus.
EXHIBIT I-13
Ponce Bank
Deposit Composition
Exhibit I-13
Ponce Bank
Deposit Composition
| For the Three Months Ended | For the Years Ended December 31, | |||||||||||||||||||||||||||||||||||||||||||||||
| March 31, 2017 | 2016 | 2015 | 2014 | |||||||||||||||||||||||||||||||||||||||||||||
| Average Balance |
Percent | Weighted Average Rate |
Average Balance |
Percent | Weighted Average Rate |
Average Balance |
Percent | Weighted Average Rate |
Average Balance |
Percent | Weighted Average Rate |
|||||||||||||||||||||||||||||||||||||
| (Dollars in thousands) | ||||||||||||||||||||||||||||||||||||||||||||||||
| Deposit type: |
||||||||||||||||||||||||||||||||||||||||||||||||
| Savings |
$ | 128,859 | 20.06 | % | 0.38 | % | $ | 126,573 | 20.32 | % | 0.26 | % | $ | 122,538 | 20.50 | % | 0.20 | % | $ | 127,200 | 20.79 | % | 0.20 | % | ||||||||||||||||||||||||
| Interest-bearing demand |
71,043 | 11.06 | % | 0.15 | % | 54,493 | 8.75 | % | 0.18 | % | 46,692 | 7.81 | % | 0.16 | % | 44,546 | 7.28 | % | 0.13 | % | ||||||||||||||||||||||||||||
| Certificates of deposit |
362,470 | 56.42 | % | 1.47 | % | 371,313 | 59.62 | % | 1.48 | % | 366,958 | 61.40 | % | 1.44 | % | 379,860 | 62.07 | % | 1.42 | % | ||||||||||||||||||||||||||||
|
|
|
|
|
|
|
|
|
|
|
|
|
|
|
|
|
|||||||||||||||||||||||||||||||||
| Interest-bearing deposits |
562,372 | 87.54 | % | 1.06 | % | 552,379 | 88.69 | % | 1.07 | % | 536,188 | 89.71 | % | 1.04 | % | 551,606 | 90.14 | % | 1.03 | % | ||||||||||||||||||||||||||||
| Non-interest bearing demand |
80,066 | 12.46 | % | 70,407 | 11.31 | % | — | 61,524 | 10.29 | % | — | 60,318 | 9.86 | % | — | |||||||||||||||||||||||||||||||||
|
|
|
|
|
|
|
|
|
|
|
|
|
|
|
|
|
|||||||||||||||||||||||||||||||||
| Total deposits |
$ | 642,438 | 100.00 | % | 0.92 | % | $ | 622,786 | 100.00 | % | 0.95 | % | $ | 597,712 | 100.00 | % | 0.93 | % | $ | 611,924 | 100.00 | % | 0.93 | % | ||||||||||||||||||||||||
|
|
|
|
|
|
|
|
|
|
|
|
|
|
|
|
|
|||||||||||||||||||||||||||||||||
| Source: | Ponce Bank’s prospectus. |
EXHIBIT I-14
Ponce Bank
Maturity of Time Deposits
Exhibit I-14
Ponce Bank
Maturity of Time Deposits
The following table sets forth the amount and maturities of our certificates of deposit by interest rate at March 31, 2017.
| Period to Maturity | ||||||||||||||||||||||||
| Less Than or Equal to One Year |
More Than One to Two Years |
More Than Two to Three Years |
More Than Three Years |
Total | Percent of Total |
|||||||||||||||||||
| (Dollars in thousands) | ||||||||||||||||||||||||
| Interest Rate Range: |
||||||||||||||||||||||||
| 0.05% - 0.99% |
$ | 53,275 | $ | 52 | $ | — | $ | — | $ | 53,327 | 14.59 | % | ||||||||||||
| 1.00% - 1.49% |
76,280 | 59,232 | 7,242 | 515 | 143,269 | 39.21 | % | |||||||||||||||||
| 1.50% - 1.99% |
23,311 | 13,722 | 12,285 | 21,811 | 71,129 | 19.47 | % | |||||||||||||||||
| 2.00% - 2.49% |
4,854 | 9,345 | 15,049 | 63,597 | 92,845 | 25.41 | % | |||||||||||||||||
| 2.50% - 2.99% |
— | 1,355 | 211 | 3,271 | 4,837 | 1.32 | % | |||||||||||||||||
|
|
|
|
|
|
|
|
|
|
|
|
|
|||||||||||||
| Total |
$ | 157,720 | $ | 83,706 | $ | 34,787 | $ | 89,194 | $ | 365,407 | 100.00 | % | ||||||||||||
|
|
|
|
|
|
|
|
|
|
|
|
|
|||||||||||||
| Source: | Ponce Bank’s prospectus. |
EXHIBIT I-15
Ponce Bank
Borrowing Activity
Exhibit I-15
Ponce Bank
Borrowing Activity
| Months Ended March 31, |
At or For the Years December 31, |
|||||||||||||||||||
| 2017 | 2016 | 2016 | 2015 | 2014 | ||||||||||||||||
| (Dollars in Thousands) | ||||||||||||||||||||
| FHLB Advances: |
||||||||||||||||||||
| Balance outstanding at end of period |
$ | 28,000 | $ | — | $ | 3,000 | $ | 8,000 | $ | 10,000 | ||||||||||
| Average amount outstanding during the period |
12,955 | 4,066 | 1,145 | 15,050 | 9,129 | |||||||||||||||
| Maximum outstanding at any month end during the period |
31,000 | 12,000 | 12,000 | 24,000 | 18,000 | |||||||||||||||
| Weighted average interest rate during the period |
0.91 | % | 0.59 | % | 0.61 | % | 0.41 | % | 0.47 | % | ||||||||||
| Weighted average interest rate at the end of the period |
1.04 | % | 0.00 | % | 0.78 | % | 0.56 | % | 0.45 | % | ||||||||||
| Source: | Ponce Bank’s prospectus. |
EXHIBIT II-1
Description of Office Properties
Exhibit II-1
Ponce Bank
Description of Office Properties
| Location |
Leased or Owned |
Year Acquired or Leased |
Net Book Value of Real Property |
|||||||||
| (In thousands) | ||||||||||||
| Main Office: |
||||||||||||
| 2244 Westchester Avenue Bronx, NY 10462 |
Owned | 1995 | $ | 6,505 | ||||||||
| Other Properties: |
||||||||||||
| 980 Southern Blvd. Bronx, NY 10459 |
Leased | Pre 1990 | $ | 1,254 | ||||||||
| 37-60 82nd Street Jackson Heights, NY 11372 |
Owned | 2006 | $ | 8,631 | ||||||||
| 30 East 170th Street Bronx, NY 10452 |
Owned | 1987 | $ | 129 | ||||||||
| 169-174 Smith Street Brooklyn, NY 11201 |
Owned | 1988 | $ | 45 | ||||||||
| 1925 Third Avenue New York, NY 1996 |
Leased | 1996 | $ | 16 | ||||||||
| 2244 Westchester Avenue Bronx, NY 10462 |
Owned | 1995 | $ | 587 | ||||||||
| 5560 Broadway Bronx, NY 10463 |
Owned | 1998 | $ | 1,127 | ||||||||
| 3405-3407 Broadway Astoria, NY 11106 |
Leased | 2001 | $ | 0 | ||||||||
| 3821 Bergenline Avenue Union City, NJ 07087 |
Owned | 2001 | $ | 1,799 | ||||||||
| 1900-1960 Ralph Avenue Brooklyn, NY 11234 |
Leased | 2007 | $ | 346 | ||||||||
| 20-47 86th Street Brooklyn, NY 11214 |
Owned | 2010 | $ | 1,966 | ||||||||
| 100-20 Queens Blvd Forest Hills, NY 11375 |
Leased | 2010 | $ | 677 | ||||||||
| 319 First Avenue New York, NY 10003 |
Leased | 2010 | $ | 1,200 | ||||||||
| Source: | Ponce Bank’s prospectus. |
EXHIBIT II-2
Historical Interest Rates
Exhibit II-2
Historical Interest Rates(1)
| Prime | 90 Day | One Year | 10 Year | |||||||||||||||
| Year/Qtr. Ended |
Rate | T-Note | T-Note | T-Note | ||||||||||||||
| 2004: |
Quarter 1 |
4.00 | % | 0.95 | % | 1.20 | % | 3.86 | % | |||||||||
| Quarter 2 |
4.00 | % | 1.33 | % | 2.09 | % | 4.62 | % | ||||||||||
| Quarter 3 |
4.75 | % | 1.70 | % | 2.16 | % | 4.12 | % | ||||||||||
| Quarter 4 |
5.25 | % | 2.22 | % | 2.75 | % | 4.24 | % | ||||||||||
| 2005: |
Quarter 1 |
5.75 | % | 2.80 | % | 3.43 | % | 4.51 | % | |||||||||
| Quarter 2 |
6.00 | % | 3.12 | % | 3.51 | % | 3.98 | % | ||||||||||
| Quarter 3 |
6.75 | % | 3.55 | % | 4.01 | % | 4.34 | % | ||||||||||
| Quarter 4 |
7.25 | % | 4.08 | % | 4.38 | % | 4.39 | % | ||||||||||
| 2006: |
Quarter 1 |
7.75 | % | 4.63 | % | 4.82 | % | 4.86 | % | |||||||||
| Quarter 2 |
8.25 | % | 5.01 | % | 5.21 | % | 5.15 | % | ||||||||||
| Quarter 3 |
8.25 | % | 4.88 | % | 4.91 | % | 4.64 | % | ||||||||||
| Quarter 4 |
8.25 | % | 5.02 | % | 5.00 | % | 4.71 | % | ||||||||||
| 2007: |
Quarter 1 |
8.25 | % | 5.04 | % | 4.90 | % | 4.65 | % | |||||||||
| Quarter 2 |
8.25 | % | 4.82 | % | 4.91 | % | 5.03 | % | ||||||||||
| Quarter 3 |
7.75 | % | 3.82 | % | 4.05 | % | 4.59 | % | ||||||||||
| Quarter 4 |
7.25 | % | 3.36 | % | 3.34 | % | 3.91 | % | ||||||||||
| 2008: |
Quarter 1 |
5.25 | % | 1.38 | % | 1.55 | % | 3.45 | % | |||||||||
| Quarter 2 |
5.00 | % | 1.90 | % | 2.36 | % | 3.99 | % | ||||||||||
| Quarter 3 |
5.00 | % | 0.92 | % | 1.78 | % | 3.85 | % | ||||||||||
| Quarter 4 |
3.25 | % | 0.11 | % | 0.37 | % | 2.25 | % | ||||||||||
| 2009: |
Quarter 1 |
3.25 | % | 0.21 | % | 0.57 | % | 2.71 | % | |||||||||
| Quarter 2 |
3.25 | % | 0.19 | % | 0.56 | % | 3.53 | % | ||||||||||
| Quarter 3 |
3.25 | % | 0.14 | % | 0.40 | % | 3.31 | % | ||||||||||
| Quarter 4 |
3.25 | % | 0.06 | % | 0.47 | % | 3.85 | % | ||||||||||
| 2010: |
Quarter 1 |
3.25 | % | 0.16 | % | 0.41 | % | 3.84 | % | |||||||||
| Quarter 2 |
3.25 | % | 0.18 | % | 0.32 | % | 2.97 | % | ||||||||||
| Quarter 3 |
3.25 | % | 0.18 | % | 0.32 | % | 2.97 | % | ||||||||||
| Quarter 4 |
3.25 | % | 0.12 | % | 0.29 | % | 3.30 | % | ||||||||||
| 2011: |
Quarter 1 |
3.25 | % | 0.09 | % | 0.30 | % | 3.47 | % | |||||||||
| Quarter 2 |
3.25 | % | 0.03 | % | 0.19 | % | 3.18 | % | ||||||||||
| Quarter 3 |
3.25 | % | 0.02 | % | 0.13 | % | 1.92 | % | ||||||||||
| Quarter 4 |
3.25 | % | 0.02 | % | 0.12 | % | 1.89 | % | ||||||||||
| 2012: |
Quarter 1 |
3.25 | % | 0.07 | % | 0.19 | % | 2.23 | % | |||||||||
| Quarter 2 |
3.25 | % | 0.09 | % | 0.21 | % | 1.67 | % | ||||||||||
| Quarter 3 |
3.25 | % | 0.10 | % | 0.17 | % | 1.65 | % | ||||||||||
| Quarter 4 |
3.25 | % | 0.05 | % | 0.16 | % | 1.78 | % | ||||||||||
| 2013: |
Quarter 1 |
3.25 | % | 0.07 | % | 0.14 | % | 1.87 | % | |||||||||
| Quarter 2 |
3.25 | % | 0.04 | % | 0.15 | % | 2.52 | % | ||||||||||
| Quarter 3 |
3.25 | % | 0.02 | % | 0.10 | % | 2.64 | % | ||||||||||
| Quarter 4 |
3.25 | % | 0.07 | % | 0.13 | % | 3.04 | % | ||||||||||
| 2014: |
Quarter 1 |
3.25 | % | 0.05 | % | 0.13 | % | 2.73 | % | |||||||||
| Quarter 2 |
3.25 | % | 0.04 | % | 0.11 | % | 2.53 | % | ||||||||||
| Quarter 3 |
3.25 | % | 0.02 | % | 0.13 | % | 2.52 | % | ||||||||||
| Quarter 4 |
3.25 | % | 0.04 | % | 0.25 | % | 2.17 | % | ||||||||||
| 2015: |
Quarter 1 |
3.25 | % | 0.03 | % | 0.26 | % | 1.94 | % | |||||||||
| Quarter 2 |
3.25 | % | 0.01 | % | 0.28 | % | 2.35 | % | ||||||||||
| Quarter 3 |
3.25 | % | 0.00 | % | 0.33 | % | 2.06 | % | ||||||||||
| Quarter 4 |
3.50 | % | 0.16 | % | 0.65 | % | 2.27 | % | ||||||||||
| 2016: |
Quarter 1 |
3.50 | % | 0.21 | % | 0.59 | % | 1.78 | % | |||||||||
| Quarter 2 |
3.50 | % | 0.26 | % | 0.45 | % | 1.49 | % | ||||||||||
| Quarter 3 |
3.50 | % | 0.29 | % | 0.59 | % | 1.60 | % | ||||||||||
| Quarter 4 |
3.75 | % | 0.51 | % | 0.85 | % | 2.45 | % | ||||||||||
| 2017: |
Quarter 1 |
4.00 | % | 0.76 | % | 1.03 | % | 2.40 | % | |||||||||
| As of May 5, 2017 |
4.00 | % | 0.90 | % | 1.10 | % | 2.36 | % | ||||||||||
| (1) | End of period data. |
| Sources: | Federal Reserve and The Wall Street Journal. |
EXHIBIT III-1
General Characteristics of Publicly-Traded Institutions
Exhibit III-1
Characteristics of Publicly-Traded Thrifts
May 5, 2017
| As of May 5, 2017 |
||||||||||||||||||||||||||||||
| Ticker |
Financial Institution |
Exchange |
Region |
City |
State |
Total Assets |
Offices | Fiscal |
Conv. Date |
Stock Price |
Market Value |
|||||||||||||||||||
| ($Mil) | ($) | ($Mil) | ||||||||||||||||||||||||||||
| BCTF |
Bancorp 34, Inc. |
NASDAQ |
SW |
Alamogordo |
NM |
$ | 329 | 4 | Dec | 5/16/00 | $ | 12.93 | $ | 44 | ||||||||||||||||
| BKMU |
Bank Mutual Corporation |
NASDAQ |
MW |
Milwaukee |
WI |
2,668 | 66 | Dec | 10/30/03 | 9.40 | 432 | |||||||||||||||||||
| BYBK |
Bay Bancorp, Inc. |
NASDAQ |
MA |
Columbia |
MD |
633 | 14 | Dec | 1/0/00 | 7.05 | 74 | |||||||||||||||||||
| BNCL |
Beneficial Bancorp, Inc. |
NASDAQ |
MA |
Philadelphia |
PA |
5,862 | 63 | Dec | 7/16/07 | 15.80 | 1,209 | |||||||||||||||||||
| BHBK |
Blue Hills Bancorp, Inc. |
NASDAQ |
NE |
Norwood |
MA |
2,497 | 11 | Dec | 7/22/14 | 18.45 | 496 | |||||||||||||||||||
| BOFI |
BofI Holding, Inc. |
NASDAQ |
WE |
San Diego |
CA |
8,700 | 2 | Jun | 3/14/05 | 24.03 | 1,523 | |||||||||||||||||||
| BYFC |
Broadway Financial Corporation |
NASDAQ |
WE |
Los Angeles |
CA |
454 | 3 | Dec | 1/9/96 | 1.89 | 35 | |||||||||||||||||||
| BLMT |
BSB Bancorp, Inc. |
NASDAQ |
NE |
Belmont |
MA |
2,287 | 7 | Dec | 10/5/11 | 29.05 | 281 | |||||||||||||||||||
| CFFN |
Capitol Federal Financial, Inc. |
NASDAQ |
MW |
Topeka |
KS |
9,246 | 47 | Sep | 12/22/10 | 14.65 | 2,024 | |||||||||||||||||||
| CARV |
Carver Bancorp, Inc. |
NASDAQ |
MA |
New York |
NY |
699 | 9 | Mar | 10/25/94 | 4.00 | 15 | |||||||||||||||||||
| CHFN |
Charter Financial Corporation |
NASDAQ |
SE |
West Point |
GA |
1,485 | 21 | Sep | 4/8/13 | 19.15 | 288 | |||||||||||||||||||
| CSBK |
Clifton Bancorp Inc. |
NASDAQ |
MA |
Clifton |
NJ |
1,371 | 12 | Mar | 4/2/14 | 16.31 | 376 | |||||||||||||||||||
| CWAY |
Coastway Bancorp, Inc. |
NASDAQ |
NE |
Warwick |
RI |
633 | 11 | Dec | 1/15/14 | 20.20 | 89 | |||||||||||||||||||
| DCOM |
Dime Community Bancshares, Inc. |
NASDAQ |
MA |
Brooklyn |
NY |
6,095 | 27 | Dec | 6/26/96 | 19.50 | 733 | |||||||||||||||||||
| ESBK |
Elmira Savings Bank |
NASDAQ |
MA |
Elmira |
NY |
557 | 13 | Dec | 3/1/85 | 20.80 | 69 | |||||||||||||||||||
| EQFN |
Equitable Financial Corp. |
NASDAQ |
MW |
Grand Island |
NE |
231 | 6 | Jun | 11/9/05 | 10.50 | 36 | |||||||||||||||||||
| ESSA |
ESSA Bancorp, Inc. |
NASDAQ |
MA |
Stroudsburg |
PA |
1,759 | 27 | Sep | 4/4/07 | 14.76 | 171 | |||||||||||||||||||
| FCAP |
First Capital, Inc. |
NASDAQ |
MW |
Corydon |
IN |
762 | 17 | Dec | 1/4/99 | 33.00 | 110 | |||||||||||||||||||
| FBNK |
First Connecticut Bancorp, Inc. |
NASDAQ |
NE |
Farmington |
CT |
2,904 | 27 | Dec | 6/30/11 | 26.40 | 420 | |||||||||||||||||||
| FDEF |
First Defiance Financial Corp. |
NASDAQ |
MW |
Defiance |
OH |
2,929 | 43 | Dec | 10/2/95 | 54.82 | 556 | |||||||||||||||||||
| FNWB |
First Northwest Bancorp |
NASDAQ |
WE |
Port Angeles |
WA |
1,081 | 11 | Jun | 1/30/15 | 16.77 | 203 | |||||||||||||||||||
| FBC |
Flagstar Bancorp, Inc. |
NYSE |
MW |
Troy |
MI |
15,361 | 99 | Dec | 4/30/97 | 30.44 | 1,736 | |||||||||||||||||||
| FSBW |
FS Bancorp, Inc. |
NASDAQ |
WE |
Mountlake Terrace |
WA |
878 | 12 | Dec | 7/10/12 | 44.11 | 135 | |||||||||||||||||||
| FSBC |
FSB Bancorp, Inc. |
NASDAQ |
MA |
Fairport |
NY |
286 | 5 | Dec | 8/15/07 | 15.02 | 29 | |||||||||||||||||||
| HBK |
Hamilton Bancorp, Inc. |
NASDAQ |
MA |
Towson |
MD |
500 | 7 | Mar | 10/10/12 | 15.12 | 52 | |||||||||||||||||||
| HIFS |
Hingham Institution for Savings |
NASDAQ |
NE |
Hingham |
MA |
2,039 | 13 | Dec | 12/13/88 | 180.60 | 385 | |||||||||||||||||||
| HMNF |
HMN Financial, Inc. |
NASDAQ |
MW |
Rochester |
MN |
681 | 13 | Dec | 6/30/94 | 17.55 | 79 | |||||||||||||||||||
| HFBL |
Home Federal Bancorp, Inc. of Louisiana |
NASDAQ |
SW |
Shreveport |
LA |
416 | 7 | Jun | 12/22/10 | 29.89 | 58 | |||||||||||||||||||
| HVBC |
HV Bancorp, Inc. |
NASDAQ |
MA |
Huntingdon Valley |
PA |
239 | 6 | Jun | 1/12/17 | 14.10 | 31 | |||||||||||||||||||
| IROQ |
IF Bancorp, Inc. |
NASDAQ |
MW |
Watseka |
IL |
591 | 6 | Jun | 7/8/11 | 20.00 | 79 | |||||||||||||||||||
| ISBC |
Investors Bancorp, Inc. |
NASDAQ |
MA |
Short Hills |
NJ |
23,889 | 154 | Dec | 5/8/14 | 13.45 | 4,174 | |||||||||||||||||||
| JXSB |
Jacksonville Bancorp, Inc. |
NASDAQ |
MW |
Jacksonville |
IL |
318 | 6 | Dec | 7/15/10 | 30.50 | 55 | |||||||||||||||||||
| KRNY |
Kearny Financial Corp. |
NASDAQ |
MA |
Fairfield |
NJ |
4,796 | 42 | Jun | 2/24/05 | 14.60 | 1,274 | |||||||||||||||||||
| MLVF |
Malvern Bancorp, Inc. |
NASDAQ |
MA |
Paoli |
PA |
962 | 9 | Sep | 10/12/12 | 21.95 | 144 | |||||||||||||||||||
| MELR |
Melrose Bancorp, Inc. |
NASDAQ |
NE |
Melrose |
MA |
269 | 1 | Dec | 10/22/14 | 16.75 | 44 | |||||||||||||||||||
| EBSB |
Meridian Bancorp, Inc. |
NASDAQ |
NE |
Peabody |
MA |
4,639 | 32 | Dec | 7/29/14 | 17.25 | 925 | |||||||||||||||||||
| CASH |
Meta Financial Group, Inc. |
NASDAQ |
MW |
Sioux Falls |
SD |
3,986 | 10 | Sep | 9/20/93 | 86.60 | 810 | |||||||||||||||||||
| MSBF |
MSB Financial Corp. |
NASDAQ |
MA |
Millington |
NJ |
482 | 5 | Dec | 1/5/07 | 17.00 | 97 | |||||||||||||||||||
| NYCB |
New York Community Bancorp, Inc. |
NYSE |
MA |
Westbury |
NY |
48,825 | 259 | Dec | 11/23/93 | 13.24 | 6,475 | |||||||||||||||||||
| NFBK |
Northfield Bancorp, Inc. |
NASDAQ |
MA |
Woodbridge |
NJ |
3,844 | 38 | Dec | 1/25/13 | 17.96 | 877 | |||||||||||||||||||
| NWBI |
Northwest Bancshares, Inc. |
NASDAQ |
MA |
Warren |
PA |
9,732 | 177 | Dec | 12/18/09 | 16.08 | 1,640 | |||||||||||||||||||
| OCFC |
OceanFirst Financial Corp. |
NASDAQ |
MA |
Toms River |
NJ |
5,196 | 62 | Dec | 7/3/96 | 28.10 | 909 | |||||||||||||||||||
| ORIT |
Oritani Financial Corp. |
NASDAQ |
MA |
Township of Washington |
NJ |
4,126 | 27 | Jun | 6/24/10 | 16.85 | 773 | |||||||||||||||||||
| OTTW |
Ottawa Bancorp, Inc. |
NASDAQ |
MW |
Ottawa |
IL |
236 | 3 | Dec | 7/14/05 | 13.41 | 46 | |||||||||||||||||||
| PBHC |
Pathfinder Bancorp, Inc. |
NASDAQ |
MA |
Oswego |
NY |
802 | 17 | Dec | 10/17/14 | 15.04 | 64 | |||||||||||||||||||
| PBBI |
PB Bancorp, Inc. |
NASDAQ |
NE |
Putnam |
CT |
521 | 8 | Jun | 10/5/04 | 10.35 | 82 | |||||||||||||||||||
| PCSB |
PCSB Financial Corporation |
NASDAQ |
MA |
Yorktown Heights |
NY |
1,407 | 16 | Jun | 4/21/17 | 16.46 | 299 | |||||||||||||||||||
| PBSK |
Poage Bankshares, Inc. |
NASDAQ |
MW |
Ashland |
KY |
458 | 10 | Dec | 9/13/11 | 19.45 | 72 | |||||||||||||||||||
| PROV |
Provident Financial Holdings, Inc. |
NASDAQ |
WE |
Riverside |
CA |
1,199 | 15 | Jun | 6/28/96 | 19.00 | 150 | |||||||||||||||||||
| PFS |
Provident Financial Services, Inc. |
NYSE |
MA |
Iselin |
NJ |
9,510 | 87 | Dec | 1/16/03 | 25.65 | 1,702 | |||||||||||||||||||
| PBIP |
Prudential Bancorp, Inc. |
NASDAQ |
MA |
Philadelphia |
PA |
844 | 11 | Sep | 10/10/13 | 17.75 | 160 | |||||||||||||||||||
Exhibit III-1
Characteristics of Publicly-Traded Thrifts
May 5, 2017
| As of May 5, 2017 |
||||||||||||||||||||||||||||||
| Ticker |
Financial Institution |
Exchange |
Region |
City |
State |
Total Assets |
Offices | Fiscal |
Conv. Date |
Stock Price |
Market Value |
|||||||||||||||||||
| ($Mil) | ($) | ($Mil) | ||||||||||||||||||||||||||||
| RNDB |
Randolph Bancorp, Inc. |
NASDAQ |
NE |
Stoughton |
MA |
482 | 6 | Dec | 7/1/16 | 15.20 | 89 | |||||||||||||||||||
| RVSB |
Riverview Bancorp, Inc. |
NASDAQ |
WE |
Vancouver |
WA |
1,134 | 19 | Mar | 10/1/97 | 7.11 | 160 | |||||||||||||||||||
| SVBI |
Severn Bancorp, Inc. |
NASDAQ |
MA |
Annapolis |
MD |
799 | 5 | Dec | 1/0/00 | 7.11 | 86 | |||||||||||||||||||
| SIFI |
SI Financial Group, Inc. |
NASDAQ |
NE |
Willimantic |
CT |
1,593 | 24 | Dec | 1/13/11 | 14.95 | 182 | |||||||||||||||||||
| SBCP |
Sunshine Bancorp, Inc. |
NASDAQ |
SE |
Plant City |
FL |
956 | 18 | Dec | 7/15/14 | 22.31 | 179 | |||||||||||||||||||
| TBNK |
Territorial Bancorp Inc. |
NASDAQ |
WE |
Honolulu |
HI |
1,936 | 29 | Dec | 7/13/09 | 30.85 | 303 | |||||||||||||||||||
| TSBK |
Timberland Bancorp, Inc. |
NASDAQ |
WE |
Hoquiam |
WA |
947 | 22 | Sep | 1/13/98 | 21.92 | 161 | |||||||||||||||||||
| TRST |
TrustCo Bank Corp NY |
NASDAQ |
MA |
Glenville |
NY |
4,887 | 144 | Dec | 1/0/00 | 7.95 | 763 | |||||||||||||||||||
| UCBA |
United Community Bancorp |
NASDAQ |
MW |
Lawrenceburg |
IN |
546 | 8 | Jun | 1/10/13 | 18.00 | 76 | |||||||||||||||||||
| UBNK |
United Financial Bancorp, Inc. |
NASDAQ |
NE |
Glastonbury |
CT |
6,697 | 54 | Dec | 3/4/11 | 17.31 | 878 | |||||||||||||||||||
| WSBF |
Waterstone Financial, Inc. |
NASDAQ |
MW |
Wauwatosa |
WI |
1,727 | 13 | Dec | 1/23/14 | 19.55 | 576 | |||||||||||||||||||
| WAYN |
Wayne Savings Bancshares, Inc. |
NASDAQ |
MW |
Wooster |
OH |
449 | 11 | Dec | 1/9/03 | 17.79 | 49 | |||||||||||||||||||
| WCFB |
WCF Bancorp, Inc. |
NASDAQ |
MW |
Webster City |
IA |
124 | 2 | Dec | 8/15/94 | 10.00 | 26 | |||||||||||||||||||
| WEBK |
Wellesley Bancorp, Inc. |
NASDAQ |
NE |
Wellesley |
MA |
704 | 6 | Dec | 1/26/12 | 27.00 | 67 | |||||||||||||||||||
| WBB |
Westbury Bancorp, Inc. |
NASDAQ |
MW |
West Bend |
WI |
756 | 8 | Sep | 4/10/13 | 20.30 | 82 | |||||||||||||||||||
| WNEB |
Western New England Bancorp, Inc. |
NASDAQ |
NE |
Westfield |
MA |
2,087 | 23 | Dec | 1/4/07 | 10.35 | 319 | |||||||||||||||||||
| WBKC |
Wolverine Bancorp, Inc. |
NASDAQ |
MW |
Midland |
MI |
434 | 3 | Dec | 1/20/11 | 32.00 | 67 | |||||||||||||||||||
| WSFS |
WSFS Financial Corporation |
NASDAQ |
MA |
Wilmington |
DE |
6,853 | 64 | Dec | 11/26/86 | 47.15 | 1,483 | |||||||||||||||||||
| WVFC |
WVS Financial Corp. |
NASDAQ |
MA |
Pittsburgh |
PA |
345 | 6 | Jun | 11/29/93 | 15.20 | 31 | |||||||||||||||||||
| HONE |
HarborOne Bancorp, Inc. (MHC) |
NASDAQ |
NE |
Brockton |
MA |
2,566 | 17 | Dec | 6/30/16 | 21.18 | 680 | |||||||||||||||||||
| PVBC |
Provident Bancorp, Inc. (MHC) |
NASDAQ |
NE |
Amesbury |
MA |
833 | 8 | Dec | 7/16/15 | 20.50 | 198 | |||||||||||||||||||
| OFED |
Oconee Federal Financial Corp. (MHC) |
NASDAQ |
SE |
Seneca |
SC |
482 | 7 | Jun | 1/14/11 | 26.33 | 152 | |||||||||||||||||||
| LSBK |
Lake Shore Bancorp, Inc. (MHC) |
NASDAQ |
MA |
Dunkirk |
NY |
494 | 11 | Dec | 4/4/06 | 15.83 | 97 | |||||||||||||||||||
| MGYR |
Magyar Bancorp, Inc. (MHC) |
NASDAQ |
MA |
New Brunswick |
NJ |
583 | 6 | Sep | 1/24/06 | 13.00 | 76 | |||||||||||||||||||
| KFFB |
Kentucky First Federal Bancorp (MHC) |
NASDAQ |
MW |
Frankfort |
KY |
306 | 7 | Jun | 3/3/05 | 9.63 | 81 | |||||||||||||||||||
| TFSL |
TFS Financial Corporation (MHC) |
NASDAQ |
MW |
Cleveland |
OH |
13,406 | 38 | Sep | 4/23/07 | 16.79 | 4,747 | |||||||||||||||||||
| GCBC |
Greene County Bancorp, Inc. (MHC) |
NASDAQ |
MA |
Catskill |
NY |
958 | 15 | Jun | 12/30/98 | 23.75 | 202 | |||||||||||||||||||
| Source: | SNL Financial, LC. |
EXHIBIT III-2
Public Market Pricing of Mid-Atlantic Thrift Institutions
Exhibit III-2
Public Market Pricing of Mid-Atlantic Institutions
As of May 5, 2017
| Market | Per Share Data | |||||||||||||||||||||||||||||||||||||||||||||||||||||||||||||||||||||||||||||||||||||
| Capitalization | Core | Book | Dividends(3) | Financial Characteristics(5) | ||||||||||||||||||||||||||||||||||||||||||||||||||||||||||||||||||||||||||||||||||
| Price/ | Market | 12 Month | Value/ | Pricing Ratios(2) | Amount/ | Payout | Total | Equity/ | Tang. Eq./ | NPAs/ | Reported | Core | ||||||||||||||||||||||||||||||||||||||||||||||||||||||||||||||||||||||||||
| Share | Value | EPS(1) | Share | P/E | P/B | P/A | P/TB | P/Core | Share | Yield | Ratio(4) | Assets | Assets | T. Assets | Assets | ROAA | ROAE | ROAA |
ROAE | |||||||||||||||||||||||||||||||||||||||||||||||||||||||||||||||||||
| ($) | ($Mil) | ($) | ($) | (x) | (%) | (%) | (%) | (x) | ($) | (%) | (%) | ($Mil) | (%) | (%) | (%) | (%) | (%) | (%) | (%) | |||||||||||||||||||||||||||||||||||||||||||||||||||||||||||||||||||
| All Non-MHC Public Companies(6) |
||||||||||||||||||||||||||||||||||||||||||||||||||||||||||||||||||||||||||||||||||||||
| Averages |
$ | 22.35 | $ | 546.69 | $ | 1.03 | $ | 16.64 | 20.24x | 131.15 | % | 15.96 | % | 145.09 | % | 20.83x | $ | 0.37 | 1.66 | % | 56.54 | % | $ | 3,327 | 12.60 | % | 11.54 | % | 0.96 | % | 0.74 | % | 6.30 | % | 0.74% | 6.12% | ||||||||||||||||||||||||||||||||||||||||||||||||||
| Median |
$ | 17.55 | $ | 161.01 | $ | 0.77 | $ | 14.81 | 18.98x | 126.65 | % | 15.60 | % | 130.77 | % | 20.11x | $ | 0.26 | 1.36 | % | 45.58 | % | $ | 1,081 | 11.57 | % | 10.67 | % | 0.84 | % | 0.63 | % | 5.99 | % | 0.64% | 5.68% | ||||||||||||||||||||||||||||||||||||||||||||||||||
| Comparable Group |
||||||||||||||||||||||||||||||||||||||||||||||||||||||||||||||||||||||||||||||||||||||
| Averages |
$ | 16.81 | $ | 878.15 | $ | 0.80 | $ | 13.51 | 20.41x | 130.49 | % | 15.45 | % | 150.10 | % | 20.40x | $ | 0.33 | 1.89 | % | 66.48 | % | $ | 5,381 | 12.19 | % | 10.78 | % | 1.02 | % | 0.67 | % | 5.63 | % | 0.71% | 5.85% | ||||||||||||||||||||||||||||||||||||||||||||||||||
| Medians |
$ | 15.80 | $ | 299.00 | $ | 0.69 | $ | 13.46 | 19.36x | 126.25 | % | 15.60 | % | 138.86 | % | 18.42x | $ | 0.26 | 1.58 | % | 56.03 | % | $ | 1,407 | 11.14 | % | 9.77 | % | 0.85 | % | 0.53 | % | 5.57 | % | 0.82% | 7.24% | ||||||||||||||||||||||||||||||||||||||||||||||||||
| Comparable Group |
||||||||||||||||||||||||||||||||||||||||||||||||||||||||||||||||||||||||||||||||||||||
| BYBK |
Bay Bancorp, Inc. |
MD | $ | 7.05 | $ | 74.33 | $ | 0.26 | $ | 6.38 | 30.65x | 110.48 | % | 11.74 | % | 115.27 | % | 27.35x | $ | 0.00 | 0.00 | % | NM | $ | 633 | 10.62 | % | 10.23 | % | NA | 0.47 | % | 4.16 | % | 0.53% | 4.62% | ||||||||||||||||||||||||||||||||||||||||||||||||||
| BNCL |
Beneficial Bancorp, Inc. |
PA | $ | 15.80 | $ | 1,209.49 | $ | 0.47 | $ | 13.46 | NM | 117.36 | % | 20.62 | % | 141.03 | % | 33.67x | $ | 0.24 | 1.52 | % | 61.54 | % | $ | 5,862 | 17.57 | % | 15.07 | % | NA | 0.51 | % | 2.82 | % | 0.61% | 3.36% | |||||||||||||||||||||||||||||||||||||||||||||||||
| CARV |
Carver Bancorp, Inc. |
(7 | ) | NY | $ | 4.00 | $ | 14.78 | ($ | 0.64 | ) | $ | 1.71 | NM | 234.56 | % | 2.26 | % | 234.56 | % | NM | $ | 0.00 | 0.00 | % | NM | $ | 699 | 7.36 | % | 7.36 | % | 2.41 | % | -0.28 | % | -3.76 | % | -0.30% | -3.91% | ||||||||||||||||||||||||||||||||||||||||||||||
| CSBK |
Clifton Bancorp Inc. |
(7 | ) | NJ | $ | 16.31 | $ | 375.52 | $ | 0.20 | $ | 13.15 | NM | 124.02 | % | 27.41 | % | 124.02 | % | NM | $ | 0.24 | 1.47 | % | 120.00 | % | $ | 1,371 | 22.10 | % | 22.10 | % | 0.39 | % | 0.34 | % | 1.40 | % | 0.34% | 1.38% | ||||||||||||||||||||||||||||||||||||||||||||||
| DCOM |
Dime Community Bancshares, Inc. |
NY | $ | 19.50 | $ | 732.60 | $ | 1.12 | $ | 15.26 | 21.43x | 127.80 | % | 12.02 | % | 141.54 | % | 17.44x | $ | 0.56 | 2.87 | % | 61.54 | % | $ | 6,095 | 9.40 | % | 8.57 | % | 0.23 | % | 0.58 | % | 6.04 | % | 0.71% | 7.36% | ||||||||||||||||||||||||||||||||||||||||||||||||
| ESBK |
Elmira Savings Bank |
NY | $ | 20.80 | $ | 68.72 | $ | 1.28 | $ | 16.82 | 16.38x | 123.67 | % | 10.48 | % | 168.51 | % | 16.29x | $ | 0.92 | 4.42 | % | 72.44 | % | $ | 557 | 10.08 | % | 8.04 | % | NA | 0.77 | % | 7.82 | % | 0.78% | 7.88% | |||||||||||||||||||||||||||||||||||||||||||||||||
| ESSA |
ESSA Bancorp, Inc. |
PA | $ | 14.76 | $ | 170.84 | $ | 0.66 | $ | 15.44 | 22.03x | 95.57 | % | 9.71 | % | 104.94 | % | 22.43x | $ | 0.36 | 2.44 | % | 53.73 | % | $ | 1,759 | 10.16 | % | 9.34 | % | NA | 0.41 | % | 4.09 | % | 0.40% | 4.02% | |||||||||||||||||||||||||||||||||||||||||||||||||
| FSBC |
FSB Bancorp, Inc. |
NY | $ | 15.02 | $ | 29.16 | NA | $ | 16.43 | 33.00x | 91.44 | % | 10.19 | % | 91.44 | % | NM | NA | NA | NM | $ | 286 | 11.14 | % | 11.14 | % | NA | 0.33 | % | 3.14 | % | NA | NA | |||||||||||||||||||||||||||||||||||||||||||||||||||||
| HBK |
Hamilton Bancorp, Inc. |
(7 | ) | MD | $ | 15.12 | $ | 51.55 | $ | 0.17 | $ | 17.77 | NM | 85.07 | % | 10.33 | % | 100.65 | % | NM | NA | NA | NM | $ | 500 | 12.14 | % | 10.46 | % | 1.08 | % | 0.03 | % | 0.27 | % | 0.11% | 0.90% | |||||||||||||||||||||||||||||||||||||||||||||||||
| HVBC |
HV Bancorp, Inc. |
(7 | ) | PA | $ | 14.10 | $ | 30.77 | NA | NA | NM | NA | NA | NA | NM | NA | NA | NM | $ | 239 | 5.41 | % | 5.41 | % | 0.64 | % | NA | 7.53 | % | NA | 7.42% | |||||||||||||||||||||||||||||||||||||||||||||||||||||||
| ISBC |
Investors Bancorp, Inc. |
NJ | $ | 13.45 | $ | 4,174.41 | $ | 0.66 | $ | 10.18 | 20.38x | 132.16 | % | 17.47 | % | 137.08 | % | 20.38x | $ | 0.32 | 2.38 | % | 45.45 | % | $ | 23,889 | 13.22 | % | NA | 0.44 | % | 0.86 | % | 6.16 | % | 0.86% | 6.11% | |||||||||||||||||||||||||||||||||||||||||||||||||
| KRNY |
Kearny Financial Corp. |
NJ | $ | 14.60 | $ | 1,273.94 | $ | 0.21 | $ | 12.54 | NM | 116.45 | % | 26.56 | % | 129.46 | % | NM | $ | 0.12 | 0.82 | % | 42.86 | % | $ | 4,796 | 22.81 | % | NA | NA | 0.42 | % | 1.69 | % | 0.42% | 1.69% | ||||||||||||||||||||||||||||||||||||||||||||||||||
| MLVF |
Malvern Bancorp, Inc. |
PA | $ | 21.95 | $ | 144.27 | $ | 1.82 | $ | 14.83 | 11.80x | 148.02 | % | 15.00 | % | 148.02 | % | 12.09x | $ | 0.11 | 0.00 | % | NM | $ | 962 | 10.13 | % | 10.13 | % | 0.33 | % | 1.43 | % | 13.01 | % | 1.40% | 12.71% | |||||||||||||||||||||||||||||||||||||||||||||||||
| MSBF |
MSB Financial Corp. |
NJ | $ | 17.00 | $ | 97.40 | NA | $ | 12.93 | NM | 131.50 | % | 20.21 | % | 131.50 | % | NM | $ | 0.00 | 0.00 | % | NM | $ | 482 | 15.37 | % | 15.37 | % | NA | 0.37 | % | 2.08 | % | NA | NA | |||||||||||||||||||||||||||||||||||||||||||||||||||
| NYCB |
New York Community Bancorp, Inc. |
NY | $ | 13.24 | $ | 6,475.16 | NA | $ | 12.57 | 13.79x | 105.36 | % | 13.40 | % | 174.59 | % | NM | $ | 0.68 | 5.14 | % | 70.83 | % | $ | 48,825 | 13.61 | % | 9.08 | % | NA | 0.96 | % | 7.67 | % | NA | NA | ||||||||||||||||||||||||||||||||||||||||||||||||||
| NFBK |
Northfield Bancorp, Inc. |
NJ | $ | 17.96 | $ | 877.24 | $ | 0.72 | $ | 12.91 | 25.66x | 139.16 | % | 22.82 | % | 148.60 | % | 25.12x | $ | 0.32 | 1.78 | % | 45.71 | % | $ | 3,844 | 16.40 | % | 15.52 | % | 0.71 | % | 0.85 | % | 5.24 | % | 0.87% | 5.36% | ||||||||||||||||||||||||||||||||||||||||||||||||
| NWBI |
Northwest Bancshares, Inc. |
PA | $ | 16.08 | $ | 1,639.97 | $ | 0.86 | $ | 11.55 | 33.50x | 139.27 | % | 16.85 | % | 195.36 | % | 18.72x | $ | 0.64 | 3.98 | % | 129.17 | % | $ | 9,732 | 12.10 | % | 8.94 | % | 1.08 | % | 0.53 | % | 4.26 | % | 0.94% | 7.54% | ||||||||||||||||||||||||||||||||||||||||||||||||
| OCFC |
OceanFirst Financial Corp. |
NJ | $ | 28.10 | $ | 908.88 | $ | 1.55 | $ | 17.95 | 25.78x | 156.57 | % | 17.56 | % | 214.92 | % | 18.13x | $ | 0.60 | 2.14 | % | 53.21 | % | $ | 5,196 | 11.21 | % | 8.43 | % | 1.11 | % | 0.70 | % | 6.66 | % | 0.98% | 9.22% | ||||||||||||||||||||||||||||||||||||||||||||||||
| ORIT |
Oritani Financial Corp. |
NJ | $ | 16.85 | $ | 773.01 | $ | 0.96 | $ | 12.13 | 13.06x | 138.86 | % | 18.73 | % | 138.86 | % | 17.58x | $ | 0.70 | 4.15 | % | 93.02 | % | $ | 4,126 | 13.49 | % | 13.49 | % | NA | 1.50 | % | 10.60 | % | 1.11% | 7.85% | |||||||||||||||||||||||||||||||||||||||||||||||||
| PBHC |
Pathfinder Bancorp, Inc. |
NY | $ | 15.04 | $ | 63.87 | NA | $ | 13.98 | 18.34x | 107.57 | % | 7.97 | % | 116.88 | % | NM | $ | 0.20 | 1.33 | % | 24.39 | % | $ | 802 | 7.46 | % | 6.91 | % | NA | 0.49 | % | 5.90 | % | NA | NA | ||||||||||||||||||||||||||||||||||||||||||||||||||
| PCSB |
PCSB Financial Corporation |
NY | $ | 16.46 | $ | 299.00 | NA | NA | NM | NA | NA | NA | NM | NA | NA | NM | $ | 1,407 | 8.33 | % | 7.89 | % | NA | NA | NA | NA | NA | |||||||||||||||||||||||||||||||||||||||||||||||||||||||||||
| PFS |
Provident Financial Services, Inc. |
NJ | $ | 25.65 | $ | 1,701.99 | $ | 1.44 | $ | 19.10 | 18.06x | 134.32 | % | 17.90 | % | 204.30 | % | 17.79x | $ | 0.76 | 2.96 | % | 52.11 | % | $ | 9,510 | 13.32 | % | NA | NA | 0.97 | % | 7.25 | % | 0.97% | 7.24% | ||||||||||||||||||||||||||||||||||||||||||||||||||
| PBIP |
Prudential Bancorp, Inc. |
PA | $ | 17.75 | $ | 160.03 | NA | NA | NM | 126.25 | % | NA | 126.25 | % | NM | $ | 0.12 | 0.68 | % | 171.43 | % | $ | 844 | 15.49 | % | 14.69 | % | NA | 0.06 | % | 0.30 | % | NA | NA | ||||||||||||||||||||||||||||||||||||||||||||||||||||
| SVBI |
Severn Bancorp, Inc. |
MD | $ | 7.11 | $ | 86.15 | NA | NA | 5.92x | 101.72 | % | NA | 102.12 | % | NM | $ | 0.00 | 0.00 | % | NM | $ | 799 | 11.12 | % | 11.09 | % | 3.15 | % | 1.98 | % | 17.19 | % | NA | NA | ||||||||||||||||||||||||||||||||||||||||||||||||||||
| TRST |
TrustCo Bank Corp NY |
NY | $ | 7.95 | $ | 763.18 | $ | 0.44 | $ | 4.57 | 17.67x | 173.82 | % | 15.60 | % | 174.04 | % | 17.97x | $ | 0.26 | 3.30 | % | 58.33 | % | $ | 4,887 | 8.98 | % | 8.97 | % | 0.85 | % | 0.89 | % | 9.97 | % | 0.88% | 9.80% | ||||||||||||||||||||||||||||||||||||||||||||||||
| WSFS |
WSFS Financial Corporation |
DE | $ | 47.15 | $ | 1,483.24 | $ | 2.29 | $ | 22.38 | 22.03x | 210.69 | % | 21.64 | % | 297.96 | % | 20.61x | $ | 0.28 | 0.59 | % | 12.62 | % | $ | 6,853 | 10.27 | % | NA | 0.88 | % | 1.06 | % | 10.11 | % | 1.12% | 10.66% | |||||||||||||||||||||||||||||||||||||||||||||||||
| WVFC |
WVS Financial Corp. |
PA | $ | 15.20 | $ | 30.52 | NA | $ | 16.78 | 17.88x | 90.58 | % | 8.85 | % | 90.58 | % | NM | $ | 0.24 | 1.58 | % | 28.24 | % | $ | 345 | 9.77 | % | 9.77 | % | NA | 0.48 | % | 4.86 | % | NA | NA | ||||||||||||||||||||||||||||||||||||||||||||||||||
| (1) | Core income, on a diluted per-share basis. Core income is net income after taxes and before extraordinary items, less net income attributable to noncontrolling interest, gain on the sale of securities, amortization of intangibles, goodwill and nonrecurring items. Assumed tax rate is 35%. |
| (2) | P/E = Price to earnings; P/B = Price to book; P/A = Price to assets; P/TB = Price to tangible book value; and P/Core = Price to core earnings. P/E and P/Core =NM if the ratio is negative or above 35x. |
| (3) | Indicated 12 month dividend, based on last quarterly dividend declared. |
| (4) | Indicated 12 month dividend as a percent of trailing 12 month earnings. |
| (5) | ROAA (return on average assets) and ROAE (return on average equity) are indicated ratios based on trailing 12 month earnings and average equity and assets balances. |
| (6) | Excludes from averages and medians those companies the subject of actual or rumored acquisition activities or unusual operating characteristics. |
| Source: | SNL Financial, LC. and RP Financial, LC. calculations. The information provided in this report has been obtained from sources we believe are reliable, but we cannot guarantee the accuracy or completeness of such information. |
Copyright (c) 2017 by RP® Financial, LC.
EXHIBIT III-3
Public Market Pricing of New England Thrift Institutions
Exhibit III-3
Public Market Pricing of New England Institutions
As of May 5, 2017
| Market | Per Share Data | |||||||||||||||||||||||||||||||||||||||||||||||||||||||||||||||||||||||||||||||||||||
| Capitalization | Core | Book | Dividends(3) | Financial Characteristics(5) | ||||||||||||||||||||||||||||||||||||||||||||||||||||||||||||||||||||||||||||||||||
| Price/ | Market | 12 Month | Value/ | Pricing Ratios(2) | Amount/ | Payout | Total | Equity/ | Tang. Eq./ | NPAs/ | Reported | Core | ||||||||||||||||||||||||||||||||||||||||||||||||||||||||||||||||||||||||||
| Share | Value | EPS(1) | Share | P/E | P/B | P/A | P/TB | P/Core | Share | Yield | Ratio(4) | Assets | Assets | T. Assets | Assets | ROAA | ROAE | ROAA |
ROAE | |||||||||||||||||||||||||||||||||||||||||||||||||||||||||||||||||||
| ($) | ($Mil) | ($) | ($) | (x) | (%) | (%) | (%) | (x) | ($) | (%) | (%) | ($Mil) | (%) | (%) | (%) | (%) | (%) | (%) | (%) | |||||||||||||||||||||||||||||||||||||||||||||||||||||||||||||||||||
| All Non-MHC Public Companies(6) |
||||||||||||||||||||||||||||||||||||||||||||||||||||||||||||||||||||||||||||||||||||||
| Averages |
$ | 22.35 | $ | 546.69 | $ | 1.03 | $ | 16.64 | 20.24x | 131.15 | % | 15.96 | % | 145.09 | % | 20.83x | $ | 0.37 | 1.66 | % | 56.54 | % | $ | 3,327 | 12.60 | % | 11.54 | % | 0.96 | % | 0.74 | % | 6.30 | % | 0.74% | 6.12% | ||||||||||||||||||||||||||||||||||||||||||||||||||
| Median |
$ | 17.55 | $ | 161.01 | $ | 0.77 | $ | 14.81 | 18.98x | 126.65 | % | 15.60 | % | 130.77 | % | 20.11x | $ | 0.26 | 1.36 | % | 45.58 | % | $ | 1,081 | 11.57 | % | 10.67 | % | 0.84 | % | 0.63 | % | 5.99 | % | 0.64% | 5.68% | ||||||||||||||||||||||||||||||||||||||||||||||||||
| Comparable Group |
||||||||||||||||||||||||||||||||||||||||||||||||||||||||||||||||||||||||||||||||||||||
| Averages |
$ | 30.36 | $ | 352.65 | $ | 0.71 | $ | 19.17 | 23.35x | 140.12 | % | 15.94 | % | 148.45 | % | 22.78x | $ | 0.36 | 1.31 | % | 29.84 | % | $ | 2,137 | 11.96 | % | 11.13 | % | 0.76 | % | 0.59 | % | 5.56 | % | 0.53% | 4.60% | ||||||||||||||||||||||||||||||||||||||||||||||||||
| Medians |
$ | 17.88 | $ | 300.00 | $ | 0.63 | $ | 14.78 | 24.34x | 129.21 | % | 15.27 | % | 139.13 | % | 24.39x | $ | 0.20 | 1.16 | % | 23.33 | % | $ | 2,063 | 11.34 | % | 10.89 | % | 0.53 | % | 0.58 | % | 5.27 | % | 0.55% | 4.95% | ||||||||||||||||||||||||||||||||||||||||||||||||||
| Comparable Group |
||||||||||||||||||||||||||||||||||||||||||||||||||||||||||||||||||||||||||||||||||||||
| BHBK |
Blue Hills Bancorp, Inc. |
MA | $ | 18.45 | $ | 495.54 | $ | 0.44 | $ | 14.78 | 30.75x | 124.84 | % | 19.85 | % | 128.17 | % | NM | $ | 0.20 | 1.08 | % | 23.33 | % | $ | 2,497 | 15.90 | % | 15.55 | % | 0.53 | % | 0.62 | % | 3.69 | % | 0.46% | 2.73% | ||||||||||||||||||||||||||||||||||||||||||||||||
| BLMT |
BSB Bancorp, Inc. |
MA | $ | 29.05 | $ | 281.45 | $ | 1.44 | $ | 17.03 | 20.03x | 170.62 | % | 12.31 | % | 170.62 | % | 20.11x | NA | NA | NM | $ | 2,287 | 7.21 | % | 7.21 | % | 0.30 | % | 0.63 | % | 8.32 | % | 0.63% | 8.29% | |||||||||||||||||||||||||||||||||||||||||||||||||||
| CWAY |
Coastway Bancorp, Inc. |
RI | $ | 20.20 | $ | 88.73 | $ | 0.83 | $ | 15.68 | 24.34x | 128.82 | % | 14.03 | % | 128.82 | % | 24.34x | NA | NA | NM | $ | 633 | 10.89 | % | 10.89 | % | 2.14 | % | 0.55 | % | 4.95 | % | 0.55% | 4.95% | |||||||||||||||||||||||||||||||||||||||||||||||||||
| FBNK |
First Connecticut Bancorp, Inc. |
CT | $ | 26.40 | $ | 420.40 | $ | 1.08 | $ | 16.62 | 24.44x | 158.83 | % | 14.47 | % | 158.83 | % | 24.44x | $ | 0.44 | 1.67 | % | 32.41 | % | $ | 2,904 | 9.11 | % | 9.11 | % | 0.83 | % | 0.60 | % | 6.45 | % | 0.60% | 6.45% | ||||||||||||||||||||||||||||||||||||||||||||||||
| HIFS |
Hingham Institution for Savings |
MA | $ | 180.60 | $ | 385.17 | NA | $ | 78.29 | 16.07x | 230.69 | % | 18.89 | % | 230.69 | % | NM | $ | 1.28 | 0.71 | % | 14.06 | % | $ | 2,039 | 8.19 | % | 8.19 | % | NA | 1.23 | % | 15.53 | % | NA | NA | ||||||||||||||||||||||||||||||||||||||||||||||||||
| MELR |
Melrose Bancorp, Inc. |
(7 | ) | MA | $ | 16.75 | $ | 43.59 | $ | 0.32 | $ | 16.64 | 28.39x | 100.65 | % | 16.22 | % | 100.65 | % | NM | NA | NA | NM | $ | 269 | 16.12 | % | 16.12 | % | 0.00 | % | 0.56 | % | 3.23 | % | 0.30% | 1.75% | |||||||||||||||||||||||||||||||||||||||||||||||||
| EBSB |
Meridian Bancorp, Inc. |
MA | $ | 17.25 | $ | 925.14 | $ | 0.63 | $ | 11.49 | 25.00x | 150.14 | % | 19.94 | % | 153.55 | % | 27.26x | $ | 0.16 | 0.93 | % | 18.84 | % | $ | 4,639 | 13.28 | % | 13.03 | % | NA | 0.86 | % | 6.00 | % | 0.79% | 5.51% | |||||||||||||||||||||||||||||||||||||||||||||||||
| PBBI |
PB Bancorp, Inc. |
(7 | ) | CT | $ | 10.35 | $ | 81.52 | $ | 0.17 | $ | 10.86 | NM | 95.22 | % | 15.66 | % | 103.59 | % | NM | $ | 0.16 | 1.55 | % | 61.90 | % | $ | 521 | 16.45 | % | 15.32 | % | NA | 0.31 | % | 1.90 | % | 0.25% | 1.53% | |||||||||||||||||||||||||||||||||||||||||||||||
| RNDB |
Randolph Bancorp, Inc. |
MA | $ | 15.20 | $ | 89.21 | NA | NA | NM | 107.09 | % | NA | NA | NM | NA | NA | NM | $ | 482 | 17.19 | % | NA | NA | 0.00 | % | 0.02 | % | 0.21% | 1.38% | |||||||||||||||||||||||||||||||||||||||||||||||||||||||||
| SIFI |
SI Financial Group, Inc. |
CT | $ | 14.95 | $ | 182.41 | NA | $ | 13.61 | 15.41x | 109.85 | % | 11.45 | % | 122.66 | % | NM | $ | 0.20 | 1.34 | % | 18.56 | % | $ | 1,593 | 10.43 | % | 9.44 | % | NA | 0.75 | % | 7.10 | % | NA | NA | ||||||||||||||||||||||||||||||||||||||||||||||||||
| UBNK |
United Financial Bancorp, Inc. |
CT | $ | 17.31 | $ | 878.00 | $ | 1.09 | $ | 13.13 | 16.97x | 131.84 | % | 13.11 | % | 161.05 | % | 15.92x | $ | 0.48 | 2.77 | % | 47.06 | % | $ | 6,697 | 9.95 | % | 8.29 | % | NA | 0.80 | % | 7.96 | % | 0.85% | 8.49% | |||||||||||||||||||||||||||||||||||||||||||||||||
| WEBK |
Wellesley Bancorp, Inc. |
MA | $ | 27.00 | $ | 67.09 | NA | $ | 22.69 | 20.93x | 118.99 | % | 9.53 | % | 118.99 | % | NM | $ | 0.16 | 0.59 | % | 12.40 | % | $ | 704 | 8.01 | % | 8.01 | % | NA | 0.46 | % | 5.59 | % | NA | NA | ||||||||||||||||||||||||||||||||||||||||||||||||||
| WNEB |
Western New England Bancorp, Inc. |
MA | $ | 10.35 | $ | 318.56 | $ | 0.42 | $ | 7.99 | 34.50x | 129.60 | % | 15.27 | % | 139.13 | % | 24.59x | $ | 0.12 | 1.16 | % | 40.00 | % | $ | 2,087 | 11.78 | % | 11.06 | % | NA | 0.48 | % | 4.21 | % | 0.64% | 5.61% | |||||||||||||||||||||||||||||||||||||||||||||||||
| HONE |
HarborOne Bancorp, Inc. (MHC) |
MA | $ | 21.18 | $ | 680.32 | NA | $ | 10.36 | NM | 204.46 | % | 26.51 | % | 213.15 | % | NM | NA | NA | NM | $ | 2,566 | 12.97 | % | 12.50 | % | NA | 0.36 | % | 2.88 | % | 0.50% | 3.95% | |||||||||||||||||||||||||||||||||||||||||||||||||||||
| (1) | Core income, on a diluted per-share basis. Core income is net income after taxes and before extraordinary items, less net income attributable to noncontrolling interest, gain on the sale of securities, amortization of intangibles, goodwill and nonrecurring items. Assumed tax rate is 35%. |
| (2) | P/E = Price to earnings; P/B = Price to book; P/A = Price to assets; P/TB = Price to tangible book value; and P/Core = Price to core earnings. P/E and P/Core =NM if the ratio is negative or above 35x. |
| (3) | Indicated 12 month dividend, based on last quarterly dividend declared. |
| (4) | Indicated 12 month dividend as a percent of trailing 12 month earnings. |
| (5) | ROAA (return on average assets) and ROAE (return on average equity) are indicated ratios based on trailing 12 month earnings and average equity and assets balances. |
| (6) | Excludes from averages and medians those companies the subject of actual or rumored acquisition activities or unusual operating characteristics. |
| Source: | SNL Financial, LC. and RP Financial, LC. calculations. The information provided in this report has been obtained from sources we believe are reliable, but we cannot guarantee the accuracy or completeness of such information. |
Copyright (c) 2017 by RP® Financial, LC.
EXHIBIT III-4
Peer Group Market Area Comparative Analysis
Exhibit III-4
Peer Group Market Area Comparative Analysis
| Proj. | Per Capita Income | Deposit | ||||||||||||||||||||||||||||||||
| Population | Pop. | 2010-2017 | 2017-2022 | 2017 | % State | Market | ||||||||||||||||||||||||||||
| Institution |
County |
2010 | 2017 | 2022 | % Change | % Change | . | Average | Share(1) | |||||||||||||||||||||||||
| Bay Bancorp, Inc. - MD |
Howard |
287,085 | 320,499 | 340,706 | 1.6 | % | 1.2 | % | 53,069 | 134.6 | % | 0.34 | % | |||||||||||||||||||||
| Clifton Bancorp, Inc. - NJ |
Passaic |
501,226 | 513,394 | 523,070 | 0.3 | % | 0.4 | % | 30,738 | 76.4 | % | 4.56 | % | |||||||||||||||||||||
| Coastway Bancorp, Inc. - RI |
Kent |
166,158 | 164,657 | 164,480 | -0.1 | % | 0.0 | % | 36,695 | 107.5 | % | 5.54 | % | |||||||||||||||||||||
| Elmira Savings Bank - NY |
Chemung |
88,830 | 86,282 | 85,256 | -0.4 | % | -0.2 | % | 29,868 | 83.6 | % | 26.23 | % | |||||||||||||||||||||
| Hamilton Bancorp, Inc. -MD |
Baltimore |
805,029 | 837,393 | 864,191 | 0.6 | % | 0.6 | % | 37,687 | 95.6 | % | 3.85 | % | |||||||||||||||||||||
| Malvern Bancorp, Inc. - PA |
Chester |
498,886 | 520,584 | 533,821 | 0.6 | % | 0.5 | % | 47,548 | 148.5 | % | 24.36 | % | |||||||||||||||||||||
| Pathfinder Bancorp, Inc. - NY |
Oswego |
122,109 | 119,387 | 118,576 | -0.3 | % | -0.1 | % | 25,871 | 72.4 | % | 18.61 | % | |||||||||||||||||||||
| PB Bancorp, Inc. - CT |
Windham |
118,428 | 115,983 | 114,922 | -0.3 | % | -0.2 | % | 29,250 | 69.8 | % | 0.98 | % | |||||||||||||||||||||
| Prudential Bancorp, Inc. - PA |
Philadelphia |
1,526,006 | 1,577,265 | 1,608,752 | 0.5 | % | 0.4 | % | 24,834 | 77.6 | % | 1.78 | % | |||||||||||||||||||||
| Wellesley Bancorp, Inc. - MA |
Norfolk |
670,850 | 702,290 | 726,490 | 0.7 | % | 0.7 | % | 52,193 | 125.5 | % | 14.47 | % | |||||||||||||||||||||
| Averages: |
478,461 | 495,773 | 508,026 | 0.3 | % | 0.3 | % | 36,775 | 99.2 | % | 10.07 | % | ||||||||||||||||||||||
| Medians: |
392,986 | 416,947 | 431,888 | 0.4 | % | 0.4 | % | 33,717 | 89.6 | % | 5.05 | % | ||||||||||||||||||||||
| Ponce Bank - NY |
Bronx |
1,385,108 | 1,475,915 | 1,534,568 | 0.9 | % | 0.8 | % | 18,469 | 51.7 | % | 1.95 | % | |||||||||||||||||||||
| (1) | Total institution deposits in headquarters county as percent of total county deposits as of June 30, 2016. |
| Sources: | SNL Financial LC, FDIC. |
EXHIBIT IV-1
Stock Prices:
As of May 5, 2017
RP® Financial, LC.
Exhibit IV-1A
Weekly Thrift Market Line - Part One
Prices As of May 5, 2017
| Market Capitalization | Price Change Data | Current Per Share Financials | ||||||||||||||||||||||||||||||||||||||||||||||||||||||||||
| Price/ | Shares | Market | 52 Week (1) | % Change From | LTM | LTM Core | BV/ | TBV/ | Assets/ | |||||||||||||||||||||||||||||||||||||||||||||||||||
| Share(1) | Outstanding | Capitalization | High | Low | Last Wk | Last Wk | 52 Wks (2) | MRY (2) | EPS (3) | EPS (3) | Share | Share (4) | Share | |||||||||||||||||||||||||||||||||||||||||||||||
| ($) | (000) | ($Mil) | ($) | ($) | ($) | (%) | (%) | (%) | ($) | ($) | ($) | ($) | ($) | |||||||||||||||||||||||||||||||||||||||||||||||
| Companies |
||||||||||||||||||||||||||||||||||||||||||||||||||||||||||||
| BCTF |
Bancorp 34, Inc. |
WA | 12.93 | 3,438 | 44.5 | 13.45 | 10.26 | 12.62 | 2.45 | 20.33 | 2.70 | 1.57 | 1.59 | 14.77 | 14.69 | 95.65 | ||||||||||||||||||||||||||||||||||||||||||||
| BKMU |
Bank Mutual Corporation |
NC | 9.40 | 45,932 | 431.8 | 10.20 | 7.31 | 9.20 | 2.17 | 17.79 | -0.53 | 0.36 | 0.36 | 6.28 | 6.28 | 58.09 | ||||||||||||||||||||||||||||||||||||||||||||
| BYBK |
Bay Bancorp, Inc. |
NM | 7.05 | 10,544 | 74.3 | 8.25 | 4.87 | 7.25 | -2.69 | 39.60 | 6.82 | NA | 0.26 | 6.38 | 6.12 | 60.07 | ||||||||||||||||||||||||||||||||||||||||||||
| BNCL |
Beneficial Bancorp, Inc. |
WI | 15.80 | 76,550 | 1,209.5 | 19.00 | 12.34 | 16.00 | -1.25 | 14.83 | -14.13 | 0.39 | 0.47 | 13.46 | 11.20 | 76.58 | ||||||||||||||||||||||||||||||||||||||||||||
| BHBK |
Blue Hills Bancorp, Inc. |
MD | 18.45 | 26,858 | 495.5 | 19.73 | 13.78 | 18.10 | 1.93 | 27.77 | -1.60 | 0.60 | 0.44 | 14.78 | 14.40 | 92.95 | ||||||||||||||||||||||||||||||||||||||||||||
| BOFI |
BofI Holding, Inc. |
PA | 24.03 | 63,390 | 1,523.3 | 32.57 | 15.29 | 23.89 | 0.59 | 26.94 | -15.83 | 2.04 | 2.03 | 12.55 | 12.55 | 137.25 | ||||||||||||||||||||||||||||||||||||||||||||
| BYFC |
Broadway Financial Corporation |
MA | 1.89 | 27,301 | 51.6 | 2.50 | 1.42 | 1.77 | 6.78 | -4.55 | 15.60 | 0.15 | NA | 1.71 | 1.71 | 16.63 | ||||||||||||||||||||||||||||||||||||||||||||
| BLMT |
BSB Bancorp, Inc. |
CA | 29.05 | 9,688 | 281.4 | 30.05 | 21.66 | 29.15 | -0.34 | 27.92 | 0.35 | 1.45 | 1.44 | 17.03 | 17.03 | 236.04 | ||||||||||||||||||||||||||||||||||||||||||||
| CFFN |
Capitol Federal Financial, Inc. |
CA | 14.65 | 138,188 | 2,024.5 | 17.04 | 12.97 | 14.63 | 0.14 | 11.15 | -11.00 | 0.62 | 0.62 | 10.00 | 10.00 | 66.91 | ||||||||||||||||||||||||||||||||||||||||||||
| CARV |
Carver Bancorp, Inc. |
MA | 4.00 | 3,696 | 14.8 | 6.61 | 2.87 | 4.37 | -8.47 | 15.27 | 24.05 | -0.62 | -0.64 | 1.71 | 1.71 | 189.09 | ||||||||||||||||||||||||||||||||||||||||||||
| CHFN |
Charter Financial Corporation |
KS | 19.15 | 15,061 | 288.4 | 21.11 | 12.36 | 18.35 | 4.36 | 52.71 | 14.88 | 0.90 | 1.10 | 13.84 | 11.70 | 98.59 | ||||||||||||||||||||||||||||||||||||||||||||
| CSBK |
Clifton Bancorp Inc. |
NY | 16.31 | 23,024 | 375.5 | 17.49 | 14.11 | 16.70 | -2.34 | 10.13 | -3.61 | 0.20 | 0.20 | 13.15 | 13.15 | 59.56 | ||||||||||||||||||||||||||||||||||||||||||||
| CWAY |
Coastway Bancorp, Inc. |
GA | 20.20 | 4,392 | 88.7 | 20.25 | 12.25 | 19.21 | 5.15 | 65.98 | 29.07 | 0.83 | 0.83 | 15.68 | 15.68 | 144.11 | ||||||||||||||||||||||||||||||||||||||||||||
| DCOM |
Dime Community Bancshares, Inc. |
NJ | 19.50 | 37,569 | 732.6 | 22.48 | 16.10 | 19.45 | 0.26 | 11.11 | -2.99 | 0.91 | 1.12 | 15.26 | 13.78 | 162.24 | ||||||||||||||||||||||||||||||||||||||||||||
| ESBK |
Elmira Savings Bank |
RI | 20.80 | 3,304 | 68.7 | 22.25 | 18.42 | 21.46 | -3.09 | 12.62 | 1.71 | 1.27 | 1.28 | 16.82 | 12.34 | 168.48 | ||||||||||||||||||||||||||||||||||||||||||||
| EQFN |
Equitable Financial Corp. |
NY | 10.50 | 3,391 | 35.6 | 10.50 | 8.16 | 10.50 | -0.05 | 25.19 | 6.01 | 0.33 | 0.34 | 10.54 | 10.54 | 68.18 | ||||||||||||||||||||||||||||||||||||||||||||
| ESSA |
ESSA Bancorp, Inc. |
NY | 14.76 | 11,575 | 170.8 | 16.91 | 12.93 | 15.13 | -2.45 | 8.53 | -6.11 | 0.67 | 0.66 | 15.44 | 14.07 | 151.94 | ||||||||||||||||||||||||||||||||||||||||||||
| FCAP |
First Capital, Inc. |
NE | 33.00 | 3,338 | 110.1 | 35.00 | 26.58 | 32.00 | 3.13 | 13.60 | 1.79 | 2.04 | NA | 23.09 | 20.79 | 228.29 | ||||||||||||||||||||||||||||||||||||||||||||
| FBNK |
First Connecticut Bancorp, Inc. |
PA | 26.40 | 15,924 | 420.4 | 27.50 | 15.74 | 26.70 | -1.12 | 58.94 | 16.56 | 1.08 | 1.08 | 16.62 | 16.62 | 182.38 | ||||||||||||||||||||||||||||||||||||||||||||
| FDEF |
First Defiance Financial Corp. |
IN | 54.82 | 10,145 | 556.2 | 56.20 | 35.90 | 53.64 | 2.20 | 39.85 | 8.04 | 2.93 | 3.14 | 34.92 | 25.35 | 288.75 | ||||||||||||||||||||||||||||||||||||||||||||
| FNWB |
First Northwest Bancorp |
CT | 16.77 | 12,078 | 202.5 | 17.24 | 12.42 | 16.46 | 1.88 | 27.43 | 7.50 | 0.47 | 0.41 | 14.78 | 14.78 | 89.53 | ||||||||||||||||||||||||||||||||||||||||||||
| FBC |
Flagstar Bancorp, Inc. |
OH | 30.44 | 57,044 | 1,736.4 | 30.70 | 21.78 | 29.24 | 4.10 | 31.32 | 12.99 | 2.57 | NA | 24.03 | 24.03 | 269.29 | ||||||||||||||||||||||||||||||||||||||||||||
| FSBW |
FS Bancorp, Inc. |
WA | 44.11 | 3,065 | 135.2 | 44.98 | 24.32 | 43.55 | 1.29 | 79.97 | 22.70 | 3.85 | NA | 27.39 | 26.11 | 286.40 | ||||||||||||||||||||||||||||||||||||||||||||
| FSBC |
FSB Bancorp, Inc. |
MI | 15.02 | 1,942 | 29.2 | 15.10 | 11.50 | 15.00 | 0.13 | 22.64 | 5.77 | 0.46 | NA | 16.43 | 16.43 | 147.44 | ||||||||||||||||||||||||||||||||||||||||||||
| HBK |
Hamilton Bancorp, Inc. |
WA | 15.12 | 3,409 | 51.5 | 15.60 | 13.33 | 15.00 | 0.80 | 11.92 | 6.11 | 0.05 | 0.17 | 17.77 | 15.02 | 146.61 | ||||||||||||||||||||||||||||||||||||||||||||
| HIFS |
Hingham Institution for Savings |
NY | 180.60 | 2,133 | 385.2 | 203.01 | 120.25 | 179.49 | 0.62 | 41.03 | -8.22 | 11.24 | NA | 78.29 | 78.29 | 956.28 | ||||||||||||||||||||||||||||||||||||||||||||
| HMNF |
HMN Financial, Inc. |
MD | 17.55 | 4,495 | 78.9 | 18.70 | 12.15 | 17.40 | 0.86 | 41.70 | 0.29 | 1.21 | NA | 17.22 | 16.94 | 151.49 | ||||||||||||||||||||||||||||||||||||||||||||
| HFBL |
Home Federal Bancorp, Inc. of Louisiana |
MA | 29.89 | 1,954 | 58.4 | 29.89 | 21.20 | 29.20 | 2.36 | 34.16 | 11.28 | 1.89 | 1.89 | 23.12 | 23.12 | 212.90 | ||||||||||||||||||||||||||||||||||||||||||||
| HVBC |
HV Bancorp, Inc. |
MN | 14.10 | 2,182 | 30.8 | 14.58 | 13.08 | 14.24 | -0.98 | NA | NA | NA | NA | NA | NA | 109.59 | ||||||||||||||||||||||||||||||||||||||||||||
| IROQ |
IF Bancorp, Inc. |
LA | 20.00 | 3,940 | 78.8 | 20.75 | 17.85 | 20.00 | 0.00 | 6.84 | 8.11 | 1.18 | NA | 21.12 | 21.12 | 150.10 | ||||||||||||||||||||||||||||||||||||||||||||
| ISBC |
Investors Bancorp, Inc. |
PA | 13.45 | 310,365 | 4,174.4 | 15.11 | 10.67 | 13.85 | -2.89 | 17.57 | -3.58 | 0.66 | 0.66 | 10.18 | NA | 76.97 | ||||||||||||||||||||||||||||||||||||||||||||
| JXSB |
Jacksonville Bancorp, Inc. |
IL | 30.50 | 1,806 | 55.1 | 37.20 | 26.00 | 30.50 | 0.00 | 16.63 | 1.67 | 1.66 | 1.50 | 26.32 | 24.81 | 175.76 | ||||||||||||||||||||||||||||||||||||||||||||
| KRNY |
Kearny Financial Corp. |
NJ | 14.60 | 87,256 | 1,273.9 | 16.10 | 12.14 | 14.60 | 0.00 | 17.46 | -6.11 | 0.21 | 0.21 | 12.54 | NA | 54.97 | ||||||||||||||||||||||||||||||||||||||||||||
| MLVF |
Malvern Bancorp, Inc. |
IL | 21.95 | 6,573 | 144.3 | 22.00 | 15.00 | 21.70 | 1.15 | 38.75 | 3.78 | 1.86 | 1.82 | 14.83 | 14.83 | 146.34 | ||||||||||||||||||||||||||||||||||||||||||||
| MELR |
Melrose Bancorp, Inc. |
NJ | 16.75 | 2,602 | 43.6 | 18.10 | 14.60 | 17.10 | -2.04 | 11.60 | -6.68 | 0.59 | 0.32 | 16.64 | 16.64 | 103.24 | ||||||||||||||||||||||||||||||||||||||||||||
| EBSB |
Meridian Bancorp, Inc. |
PA | 17.25 | 53,631 | 925.1 | 20.55 | 13.41 | 17.55 | -1.71 | 18.88 | -8.73 | 0.69 | 0.63 | 11.49 | 11.23 | 86.49 | ||||||||||||||||||||||||||||||||||||||||||||
| CASH |
Meta Financial Group, Inc. |
MA | 86.60 | 9,350 | 809.7 | 106.90 | 47.36 | 84.90 | 2.00 | 78.67 | -15.84 | 5.30 | 6.41 | 44.04 | 26.35 | 426.27 | ||||||||||||||||||||||||||||||||||||||||||||
| MSBF |
MSB Financial Corp. |
MA | 17.00 | 5,729 | 97.4 | 17.70 | 12.82 | 17.60 | -3.41 | 29.57 | 15.65 | 0.28 | NA | 12.93 | 12.93 | 84.11 | ||||||||||||||||||||||||||||||||||||||||||||
| NYCB |
New York Community Bancorp, Inc. |
SD | 13.24 | 489,061 | 6,475.2 | 17.68 | 12.97 | 13.29 | -0.38 | -8.31 | -16.78 | 0.96 | NA | 12.57 | 7.58 | 99.83 | ||||||||||||||||||||||||||||||||||||||||||||
| NFBK |
Northfield Bancorp, Inc. |
NJ | 17.96 | 48,844 | 877.2 | 20.59 | 14.31 | 18.38 | -2.29 | 15.13 | -10.07 | 0.70 | 0.72 | 12.91 | 12.09 | 78.70 | ||||||||||||||||||||||||||||||||||||||||||||
| NWBI |
Northwest Bancshares, Inc. |
NY | 16.08 | 101,988 | 1,640.0 | 19.10 | 13.83 | 16.14 | -0.37 | 15.19 | -10.82 | 0.48 | 0.86 | 11.55 | 8.23 | 95.42 | ||||||||||||||||||||||||||||||||||||||||||||
| OCFC |
OceanFirst Financial Corp. |
NJ | 28.10 | 32,344 | 908.9 | 30.70 | 16.77 | 27.65 | 1.63 | 56.02 | -6.43 | 1.09 | 1.55 | 17.95 | 13.07 | 160.66 | ||||||||||||||||||||||||||||||||||||||||||||
| ORIT |
Oritani Financial Corp. |
PA | 16.85 | 45,876 | 773.0 | 19.00 | 15.27 | 16.95 | -0.59 | 1.02 | -10.13 | 1.29 | 0.96 | 12.13 | 12.13 | 89.94 | ||||||||||||||||||||||||||||||||||||||||||||
| OTTW |
Ottawa Bancorp, Inc. |
NJ | 13.41 | 3,467 | 46.5 | 13.99 | 9.06 | 13.51 | -0.74 | 37.22 | 5.34 | 0.40 | 0.41 | 15.06 | 14.77 | 68.19 | ||||||||||||||||||||||||||||||||||||||||||||
| PBHC |
Pathfinder Bancorp, Inc. |
NJ | 15.04 | 4,247 | 63.9 | 15.19 | 11.12 | 15.00 | 0.27 | 30.90 | 11.49 | 0.82 | NA | 13.98 | 12.87 | 188.92 | ||||||||||||||||||||||||||||||||||||||||||||
| PBBI |
PB Bancorp, Inc. |
IL | 10.35 | 7,880 | 81.5 | 10.85 | 8.36 | 10.45 | -1.00 | 21.28 | 4.54 | 0.21 | 0.17 | 10.86 | 9.99 | 66.05 | ||||||||||||||||||||||||||||||||||||||||||||
| PCSB |
PCSB Financial Corporation |
NY | 16.46 | 18,165 | 299.0 | 16.80 | 15.76 | 16.31 | 0.92 | NA | NA | NA | NA | NA | NA | 77.47 | ||||||||||||||||||||||||||||||||||||||||||||
| PBSK |
Poage Bankshares, Inc. |
CT | 19.45 | 3,684 | 71.7 | 20.90 | 15.50 | 19.75 | -1.52 | 22.79 | 3.46 | 0.50 | 0.58 | 18.54 | 17.93 | 124.45 | ||||||||||||||||||||||||||||||||||||||||||||
| PROV |
Provident Financial Holdings, Inc. |
KY | 19.00 | 7,886 | 149.8 | 20.66 | 17.20 | 19.23 | -1.20 | 5.38 | -6.03 | 0.83 | NA | 16.69 | 16.69 | 152.11 | ||||||||||||||||||||||||||||||||||||||||||||
| PFS |
Provident Financial Services, Inc. |
CA | 25.65 | 66,354 | 1,702.0 | 28.92 | 18.59 | 25.69 | -0.16 | 30.80 | -9.36 | 1.42 | 1.44 | 19.10 | NA | 143.32 | ||||||||||||||||||||||||||||||||||||||||||||
| PBIP |
Prudential Bancorp, Inc. |
NJ | 17.75 | 9,016 | 160.0 | 18.74 | 13.80 | 17.92 | -0.95 | 20.09 | 3.68 | 0.07 | NA | NA | NA | 93.64 | ||||||||||||||||||||||||||||||||||||||||||||
| RNDB |
Randolph Bancorp, Inc. |
PA | 15.20 | 5,869 | 89.2 | 16.50 | 12.06 | 15.22 | -0.15 | NA | -5.70 | NA | NA | NA | NA | 82.21 | ||||||||||||||||||||||||||||||||||||||||||||
| RVSB |
Riverview Bancorp, Inc. |
MA | 7.11 | 22,511 | 160.1 | 8.16 | 4.25 | 7.26 | -2.07 | 63.45 | 1.57 | 0.33 | NA | 4.94 | 3.68 | 50.37 | ||||||||||||||||||||||||||||||||||||||||||||
| SVBI |
Severn Bancorp, Inc. |
WA | 7.11 | 12,125 | 86.1 | 8.08 | 5.66 | 7.10 | 0.07 | 22.08 | -10.06 | 1.20 | NA | NA | NA | 65.88 | ||||||||||||||||||||||||||||||||||||||||||||
| SIFI |
SI Financial Group, Inc. |
MD | 14.95 | 12,202 | 182.4 | 16.23 | 12.30 | 14.95 | 0.00 | 6.94 | -2.92 | 0.97 | NA | 13.61 | 12.19 | 130.55 | ||||||||||||||||||||||||||||||||||||||||||||
| SBCP |
Sunshine Bancorp, Inc. |
CT | 22.31 | 8,039 | 179.3 | 22.39 | 13.92 | 21.49 | 3.82 | 58.79 | 30.16 | 0.17 | 0.49 | 14.19 | 11.44 | 118.97 | ||||||||||||||||||||||||||||||||||||||||||||
| TBNK |
Territorial Bancorp Inc. |
FL | 30.85 | 9,808 | 302.6 | 34.00 | 25.39 | 30.95 | -0.32 | 18.65 | -6.06 | 1.80 | 1.77 | 23.72 | 23.72 | 197.38 | ||||||||||||||||||||||||||||||||||||||||||||
| TSBK |
Timberland Bancorp, Inc. |
HI | 21.92 | 7,345 | 161.0 | 23.43 | 13.95 | 22.06 | -0.63 | 56.68 | 6.10 | 1.59 | 1.58 | 14.27 | 13.50 | 128.88 | ||||||||||||||||||||||||||||||||||||||||||||
| TRST |
TrustCo Bank Corp NY |
WA | 7.95 | 95,997 | 763.2 | 9.00 | 6.00 | 7.95 | 0.00 | 26.79 | -9.14 | 0.45 | 0.44 | 4.57 | 4.57 | 50.91 | ||||||||||||||||||||||||||||||||||||||||||||
| UCBA |
United Community Bancorp |
NY | 18.00 | 4,205 | 75.7 | 18.00 | 13.86 | 17.75 | 1.41 | 24.14 | 7.78 | 0.80 | 0.80 | 16.64 | 15.99 | 129.75 | ||||||||||||||||||||||||||||||||||||||||||||
| UBNK |
United Financial Bancorp, Inc. |
IN | 17.31 | 50,722 | 878.0 | 18.66 | 12.42 | 17.27 | 0.23 | 36.08 | -4.68 | 1.02 | 1.09 | 13.13 | 10.75 | 132.03 | ||||||||||||||||||||||||||||||||||||||||||||
| WSBF |
Waterstone Financial, Inc. |
CT | 19.55 | 29,459 | 575.9 | 20.40 | 13.83 | 19.00 | 2.89 | 38.36 | 6.25 | 1.03 | 1.03 | 14.09 | 14.07 | 58.63 | ||||||||||||||||||||||||||||||||||||||||||||
| WAYN |
Wayne Savings Bancshares, Inc. |
WI | 17.79 | 2,782 | 49.5 | 18.75 | 12.15 | 18.24 | -2.47 | 34.25 | 7.82 | 0.77 | 0.77 | 14.88 | 14.26 | 161.27 | ||||||||||||||||||||||||||||||||||||||||||||
| WCFB |
WCF Bancorp, Inc. |
OH | 10.00 | 2,562 | 25.6 | 10.30 | 8.15 | 9.84 | 1.63 | -1.64 | 0.00 | 0.05 | 0.01 | 11.26 | NA | 48.27 | ||||||||||||||||||||||||||||||||||||||||||||
| WEBK |
Wellesley Bancorp, Inc. |
IA | 27.00 | 2,485 | 67.1 | 28.25 | 19.60 | 27.70 | -2.53 | 33.67 | -2.70 | 1.29 | NA | 22.69 | 22.69 | 283.42 | ||||||||||||||||||||||||||||||||||||||||||||
| WBB |
Westbury Bancorp, Inc. |
MA | 20.30 | 4,038 | 82.0 | 23.00 | 18.80 | 20.70 | -1.93 | 2.22 | -1.93 | 0.82 | 0.72 | 19.58 | 19.58 | 187.13 | ||||||||||||||||||||||||||||||||||||||||||||
| WNEB |
Western New England Bancorp, Inc. |
WI | 10.35 | 30,779 | 318.6 | 10.75 | 7.35 | 10.50 | -1.43 | 37.09 | 10.70 | 0.30 | 0.42 | 7.99 | 7.44 | 67.79 | ||||||||||||||||||||||||||||||||||||||||||||
| WBKC |
Wolverine Bancorp, Inc. |
MA | 32.00 | 2,106 | 67.4 | 35.00 | 25.37 | 29.91 | 6.98 | 23.93 | 1.27 | 2.16 | 2.16 | 28.95 | 28.95 | 206.27 | ||||||||||||||||||||||||||||||||||||||||||||
| WSFS |
WSFS Financial Corporation |
MI | 47.15 | 31,458 | 1,483.2 | 50.55 | 30.56 | 47.20 | -0.11 | 41.04 | 1.73 | 2.14 | 2.29 | 22.38 | NA | 217.84 | ||||||||||||||||||||||||||||||||||||||||||||
| WVFC |
WVS Financial Corp. |
DE | 15.20 | 2,008 | 30.5 | 15.50 | 10.73 | 15.12 | 0.50 | 29.03 | 3.23 | 0.85 | NA | 16.78 | 16.78 | 171.80 | ||||||||||||||||||||||||||||||||||||||||||||
RP® Financial, LC.
Exhibit IV-1A
Weekly Thrift Market Line - Part One
Prices As of May 5, 2017
| Market Capitalization | Price Change Data | Current Per Share Financials | ||||||||||||||||||||||||||||||||||||||||||||||||||||||||||||
| Price/ | Shares | Market | 52 Week (1) | % Change From | LTM | LTM Core | BV/ | TBV/ | Assets/ | |||||||||||||||||||||||||||||||||||||||||||||||||||||
| Share(1) | Outstanding | Capitalization | High | Low | Last Wk | Last Wk | 52 Wks (2) | MRY (2) | EPS (3) | EPS (3) | Share | Share (4) | Share | |||||||||||||||||||||||||||||||||||||||||||||||||
| ($) | (000) | ($Mil) | ($) | ($) | ($) | (%) | (%) | (%) | ($) | ($) | ($) | ($) | ($) | |||||||||||||||||||||||||||||||||||||||||||||||||
| Companies |
||||||||||||||||||||||||||||||||||||||||||||||||||||||||||||||
| MHCs |
||||||||||||||||||||||||||||||||||||||||||||||||||||||||||||||
| HONE |
HarborOne Bancorp, Inc. (MHC) |
PA | 21.18 | 32,121 | 680.3 | 21.44 | 12.53 | 20.82 | 1.73 | NA | 9.51 | NA | NA | 10.36 | 9.94 | 79.89 | ||||||||||||||||||||||||||||||||||||||||||||||
| PVBC |
Provident Bancorp, Inc. (MHC) |
NY | 20.50 | 9,641 | 197.6 | 22.90 | 13.72 | 21.30 | -3.76 | 48.66 | 14.53 | 0.73 | 0.65 | 11.54 | 11.54 | 86.40 | ||||||||||||||||||||||||||||||||||||||||||||||
| OFED |
Oconee Federal Financial Corp. (MHC) |
MA | 26.33 | 5,791 | 152.4 | 27.00 | 19.25 | 25.74 | 2.27 | 38.12 | 12.02 | 0.94 | 0.93 | 14.49 | 13.93 | 83.25 | ||||||||||||||||||||||||||||||||||||||||||||||
| LSBK |
Lake Shore Bancorp, Inc. (MHC) |
KY | 15.83 | 6,116 | 96.8 | 16.59 | 12.97 | 15.79 | 0.25 | 5.53 | -2.69 | 0.38 | 0.37 | NA | NA | 80.75 | ||||||||||||||||||||||||||||||||||||||||||||||
| MGYR |
Magyar Bancorp, Inc. (MHC) |
NY | 13.00 | 5,821 | 75.7 | 14.95 | 9.65 | 12.56 | 3.50 | 27.08 | 8.33 | 0.21 | NA | 8.29 | 8.29 | 100.10 | ||||||||||||||||||||||||||||||||||||||||||||||
| KFFB |
Kentucky First Federal Bancorp (MHC) |
NJ | 9.63 | 8,440 | 81.2 | 10.15 | 8.00 | 9.70 | -0.77 | 7.07 | 7.12 | 0.14 | 0.14 | 7.95 | 6.24 | 36.24 | ||||||||||||||||||||||||||||||||||||||||||||||
| TFSL |
TFS Financial Corporation (MHC) |
SC | 16.79 | 282,734 | 4,747.1 | 19.89 | 15.93 | 16.54 | 1.51 | -7.19 | -11.82 | 0.30 | NA | 5.93 | 5.89 | 47.42 | ||||||||||||||||||||||||||||||||||||||||||||||
| GCBC |
Greene County Bancorp, Inc. (MHC) |
MA | 23.75 | 8,503 | 201.9 | 25.30 | 15.40 | 24.75 | -4.04 | 29.08 | 3.71 | 1.26 | NA | 9.52 | 9.52 | 112.73 | ||||||||||||||||||||||||||||||||||||||||||||||
| Under Acquisition |
||||||||||||||||||||||||||||||||||||||||||||||||||||||||||||||
| ANCB |
Anchor Bancorp |
OH | 25.10 | 2,504 | 62.9 | 27.50 | 22.61 | 25.10 | 0.00 | 0.74 | -7.72 | 0.83 | 0.83 | 25.95 | 25.95 | 185.85 | ||||||||||||||||||||||||||||||||||||||||||||||
| ASBB |
ASB Bancorp, Inc. |
NY | 41.60 | 3,788 | 157.6 | 42.00 | 24.31 | 35.04 | 18.74 | 63.78 | 39.83 | 0.46 | 1.75 | 24.75 | 24.75 | 212.12 | ||||||||||||||||||||||||||||||||||||||||||||||
| AF |
Astoria Financial Corporation |
FL | 20.42 | 101,726 | 2,077.2 | 21.66 | 14.11 | 20.39 | 0.15 | 39.58 | 9.49 | 0.58 | 0.62 | 15.67 | 13.85 | 140.99 | ||||||||||||||||||||||||||||||||||||||||||||||
| EVER |
EverBank Financial Corp |
MA | 19.50 | 127,880 | 2,493.7 | 19.52 | 13.37 | 19.50 | 0.00 | 36.65 | 0.26 | 1.13 | NA | 14.94 | 14.56 | 217.21 | ||||||||||||||||||||||||||||||||||||||||||||||
| (1) | Average of High/Low or Bid/Ask price per share. |
| (2) | Or since offering price if converted of first listed in the past 52 weeks. Percent change figures are actual year-to-date and are not annualized. |
| (3) | EPS (earnings per share) is based on actual trailing 12 month data and is not shown on a pro forma basis. |
| (4) | Excludes intangibles (such as goodwill, value of core deposits, etc.). |
| (5) | ROA (return on assets) and ROE (return on equity) are indicated ratios based on trailing 12 month common earnings and average common equity and total assets balances. |
| (6) | Annualized based on last regular quarterly cash dividend announcement. |
| (7) | Indicated dividend as a percent of trailing 12 month earnings. |
| (8) | Excluded from averages due to actual or rumored acquisition activities or unusual operating characteristics. |
| (9) | For MHC institutions, market value reflects share price multiplied by public (non-MHC) shares. |
| Source: | SNL Financial, LC. and RP® Financial, LC. calculations. The information provided in this table has been obtained from sources we believe are reliable, but we cannot guarantee the accuracy or completeness of such information. |
Copyright (c) 2017 by RP® Financial, LC.
RP® Financial, LC.
Exhibit IV-1B
Weekly Thrift Market Line - Part Two
Prices As of May 5, 2017
| Key Financial Ratios | Asset Quality Ratios | Pricing Ratios | Dividend Data (6) | |||||||||||||||||||||||||||||||||||||||||||||||||||||||||||||||||
| Equity/ | Tang Equity/ | Reported Earnings | Core Earnings | NPAs/ | Rsvs/ | Price/ | Price/ | Price/ | Price/ | Price/ | Div/ | Dividend | Payout | |||||||||||||||||||||||||||||||||||||||||||||||||||||||
| Assets(1) | Assets(1) | ROA(5) | ROE(5) | ROA(5) | ROE(5) | Assets | NPLs | Earnings | Book | Assets | Tang Book | Core Earnings | Share | Yield | Ratio (7) | |||||||||||||||||||||||||||||||||||||||||||||||||||||
| (%) | (%) | (%) | (%) | (%) | (%) | (%) | (%) | (x) | (%) | (%) | (%) | (x) | ($) | (%) | (%) | |||||||||||||||||||||||||||||||||||||||||||||||||||||
| Companies |
||||||||||||||||||||||||||||||||||||||||||||||||||||||||||||||||||||
| BCTF |
Bancorp 34, Inc. |
WA | 13.96 | 13.96 | 0.46 | 3.18 | 0.46 | 3.18 | NA | NA | 30.24 | 96.74 | 13.51 | 96.74 | 30.24 | NA | NA | NM | ||||||||||||||||||||||||||||||||||||||||||||||||||
| BKMU |
Bank Mutual Corporation |
NC | 11.67 | 11.67 | 0.24 | 2.09 | 0.79 | 6.81 | 1.28 | 130.70 | NM | 168.11 | 19.61 | 168.11 | 23.81 | NA | NA | NM | ||||||||||||||||||||||||||||||||||||||||||||||||||
| BYBK |
Bay Bancorp, Inc. |
NM | 15.44 | 15.37 | 1.78 | 16.31 | 1.80 | 16.47 | 1.81 | 41.99 | 8.24 | 87.55 | 13.52 | 88.04 | 8.16 | 0.59 | 0.00 | NM | ||||||||||||||||||||||||||||||||||||||||||||||||||
| BNCL |
Beneficial Bancorp, Inc. |
WI | 10.81 | 10.81 | 0.61 | 5.61 | 0.62 | 5.63 | 0.50 | 181.63 | 26.11 | 149.67 | 16.18 | 149.67 | 26.04 | 0.22 | 2.34 | 61.11 | ||||||||||||||||||||||||||||||||||||||||||||||||||
| BHBK |
Blue Hills Bancorp, Inc. |
MD | 10.62 | 10.23 | 0.47 | 4.16 | 0.53 | 4.62 | NA | NA | 30.65 | 110.48 | 11.74 | 115.27 | 27.35 | 0.00 | 0.00 | NM | ||||||||||||||||||||||||||||||||||||||||||||||||||
| BOFI |
BofI Holding, Inc. |
PA | 17.57 | 15.07 | 0.51 | 2.82 | 0.61 | 3.36 | NA | NA | 40.51 | 117.36 | 20.62 | 141.03 | 33.67 | 0.24 | 1.52 | 61.54 | ||||||||||||||||||||||||||||||||||||||||||||||||||
| BYFC |
Broadway Financial Corporation |
MA | 15.90 | 15.55 | 0.62 | 3.69 | 0.46 | 2.73 | 0.53 | 142.51 | 30.75 | 124.84 | 19.85 | 128.17 | 41.53 | 0.20 | 1.08 | 23.33 | ||||||||||||||||||||||||||||||||||||||||||||||||||
| BLMT |
BSB Bancorp, Inc. |
CA | 9.20 | 9.20 | 1.68 | 18.26 | 1.67 | 18.15 | 0.39 | 138.09 | 11.78 | 191.55 | 17.52 | 191.55 | 11.85 | NA | NA | NM | ||||||||||||||||||||||||||||||||||||||||||||||||||
| CFFN |
Capitol Federal Financial, Inc. |
CA | 10.32 | 10.32 | 0.98 | 8.72 | NA | NA | NA | NA | 12.60 | 110.53 | 11.41 | 110.53 | NA | 0.04 | 0.00 | NM | ||||||||||||||||||||||||||||||||||||||||||||||||||
| CARV |
Carver Bancorp, Inc. |
MA | 7.21 | 7.21 | 0.63 | 8.32 | 0.63 | 8.29 | 0.30 | 210.14 | 20.03 | 170.62 | 12.31 | 170.62 | 20.11 | NA | NA | NM | ||||||||||||||||||||||||||||||||||||||||||||||||||
| CHFN |
Charter Financial Corporation |
KS | 14.95 | 14.95 | 0.74 | 5.99 | 0.74 | 5.99 | 0.60 | 16.12 | 23.63 | 146.46 | 21.89 | 146.46 | 23.63 | 0.34 | 2.32 | 141.94 | ||||||||||||||||||||||||||||||||||||||||||||||||||
| CSBK |
Clifton Bancorp Inc. |
NY | 7.36 | 7.36 | -0.28 | -3.76 | -0.30 | -3.91 | 2.41 | 29.47 | NM | 234.56 | 2.26 | 234.56 | NM | 0.00 | 0.00 | NM | ||||||||||||||||||||||||||||||||||||||||||||||||||
| CWAY |
Coastway Bancorp, Inc. |
GA | 14.04 | 12.14 | 0.94 | 6.63 | 1.15 | 8.05 | 0.58 | 157.19 | 21.28 | 138.38 | 19.42 | 163.61 | 17.39 | 0.26 | 1.36 | 25.56 | ||||||||||||||||||||||||||||||||||||||||||||||||||
| DCOM |
Dime Community Bancshares, Inc. |
NJ | 22.10 | 22.10 | 0.34 | 1.40 | 0.34 | 1.38 | 0.39 | 120.28 | NM | 124.02 | 27.41 | 124.02 | 82.44 | 0.24 | 1.47 | 120.00 | ||||||||||||||||||||||||||||||||||||||||||||||||||
| ESBK |
Elmira Savings Bank |
RI | 10.89 | 10.89 | 0.55 | 4.95 | 0.55 | 4.95 | 2.14 | 19.48 | 24.34 | 128.82 | 14.03 | 128.82 | 24.34 | NA | NA | NM | ||||||||||||||||||||||||||||||||||||||||||||||||||
| EQFN |
Equitable Financial Corp. |
NY | 9.40 | 8.57 | 0.58 | 6.04 | 0.71 | 7.36 | 0.23 | 168.45 | 21.43 | 127.80 | 12.02 | 141.54 | 17.44 | 0.56 | 2.87 | 61.54 | ||||||||||||||||||||||||||||||||||||||||||||||||||
| ESSA |
ESSA Bancorp, Inc. |
NY | 10.08 | 8.04 | 0.77 | 7.82 | 0.78 | 7.88 | NA | NA | 16.38 | 123.67 | 10.48 | 168.51 | 16.29 | 0.92 | 4.42 | 72.44 | ||||||||||||||||||||||||||||||||||||||||||||||||||
| FCAP |
First Capital, Inc. |
NE | 15.45 | 15.45 | 0.49 | 3.15 | 0.50 | 3.22 | NA | NA | 31.80 | 99.60 | 15.39 | 99.60 | 31.02 | NA | NA | NM | ||||||||||||||||||||||||||||||||||||||||||||||||||
| FBNK |
First Connecticut Bancorp, Inc. |
PA | 10.16 | 9.34 | 0.41 | 4.09 | 0.40 | 4.02 | NA | NA | 22.03 | 95.57 | 9.71 | 104.94 | 22.43 | 0.36 | 2.44 | 53.73 | ||||||||||||||||||||||||||||||||||||||||||||||||||
| FDEF |
First Defiance Financial Corp. |
IN | NA | NA | 0.92 | NA | NA | NA | 1.07 | 91.91 | 16.18 | 142.91 | NA | 158.76 | NA | 0.84 | 2.55 | 41.18 | ||||||||||||||||||||||||||||||||||||||||||||||||||
| FNWB |
First Northwest Bancorp |
CT | 9.11 | 9.11 | 0.60 | 6.45 | 0.60 | 6.45 | 0.83 | 88.68 | 24.44 | 158.83 | 14.47 | 158.83 | 24.44 | 0.44 | 1.67 | 32.41 | ||||||||||||||||||||||||||||||||||||||||||||||||||
| FBC |
Flagstar Bancorp, Inc. |
OH | 12.09 | 9.08 | 1.08 | 9.11 | 1.16 | 9.78 | 0.87 | 103.46 | 18.71 | 156.99 | 18.98 | 216.27 | 17.44 | 1.00 | 1.82 | 32.08 | ||||||||||||||||||||||||||||||||||||||||||||||||||
| FSBW |
FS Bancorp, Inc. |
WA | 16.51 | 16.51 | 0.50 | 2.78 | 0.43 | 2.41 | NA | NA | 35.68 | 113.45 | 18.73 | 113.45 | 41.19 | NA | NA | NM | ||||||||||||||||||||||||||||||||||||||||||||||||||
| FSBC |
FSB Bancorp, Inc. |
MI | 8.93 | 8.93 | 1.13 | 11.27 | NA | NA | 0.72 | 145.36 | 11.84 | 126.65 | 11.30 | 126.65 | NA | 0.00 | 0.00 | NM | ||||||||||||||||||||||||||||||||||||||||||||||||||
| HBK |
Hamilton Bancorp, Inc. |
WA | 9.56 | 9.16 | 1.40 | 14.58 | NA | NA | NA | NA | 11.46 | 161.03 | 15.40 | 168.94 | NA | 0.44 | 1.00 | 10.65 | ||||||||||||||||||||||||||||||||||||||||||||||||||
| HIFS |
Hingham Institution for Savings |
NY | 11.14 | 11.14 | 0.33 | 3.14 | NA | NA | NA | NA | 33.00 | 91.44 | 10.19 | 91.44 | NA | NA | NA | NM | ||||||||||||||||||||||||||||||||||||||||||||||||||
| HMNF |
HMN Financial, Inc. |
MD | 12.14 | 10.46 | 0.03 | 0.27 | 0.11 | 0.90 | 1.08 | 41.90 | NM | 85.07 | 10.33 | 100.65 | 87.95 | NA | NA | NM | ||||||||||||||||||||||||||||||||||||||||||||||||||
| HFBL |
Home Federal Bancorp, Inc. of Louisiana |
MA | 8.19 | 8.19 | 1.23 | 15.53 | NA | NA | NA | NA | 16.07 | 230.69 | 18.89 | 230.69 | NA | 1.28 | 0.71 | 14.06 | ||||||||||||||||||||||||||||||||||||||||||||||||||
| HVBC |
HV Bancorp, Inc. |
MN | 11.37 | 11.21 | 0.87 | 7.74 | NA | NA | NA | NA | 14.50 | 101.93 | 11.59 | 103.57 | NA | 0.00 | 0.00 | NM | ||||||||||||||||||||||||||||||||||||||||||||||||||
| IROQ |
IF Bancorp, Inc. |
LA | 10.86 | 10.86 | 0.91 | 7.91 | 0.91 | 7.91 | NA | NA | 15.81 | 129.28 | 14.04 | 129.28 | 15.81 | 0.36 | 1.20 | 19.05 | ||||||||||||||||||||||||||||||||||||||||||||||||||
| ISBC |
Investors Bancorp, Inc. |
PA | 5.41 | 5.41 | NA | 7.53 | NA | 7.42 | 0.64 | 42.44 | NA | NA | NA | NA | NA | NA | NA | NA | ||||||||||||||||||||||||||||||||||||||||||||||||||
| JXSB |
Jacksonville Bancorp, Inc. |
IL | 14.07 | 14.07 | 0.75 | 5.27 | NA | NA | NA | NA | 16.95 | 94.72 | 13.32 | 94.72 | NA | 0.16 | 0.80 | 13.56 | ||||||||||||||||||||||||||||||||||||||||||||||||||
| KRNY |
Kearny Financial Corp. |
NJ | 13.22 | NA | 0.86 | 6.16 | 0.86 | 6.11 | 0.44 | 232.54 | 20.38 | 132.16 | 17.47 | 137.08 | 20.38 | 0.32 | 2.38 | 45.45 | ||||||||||||||||||||||||||||||||||||||||||||||||||
| MLVF |
Malvern Bancorp, Inc. |
IL | 14.94 | 14.20 | 0.94 | 6.32 | 0.86 | 5.73 | 1.11 | 91.09 | 18.37 | 115.88 | 17.31 | 122.95 | 20.27 | 0.40 | 1.31 | 24.10 | ||||||||||||||||||||||||||||||||||||||||||||||||||
| MELR |
Melrose Bancorp, Inc. |
NJ | 22.81 | NA | 0.42 | 1.69 | 0.42 | 1.69 | NA | NA | 69.52 | 116.45 | 26.56 | 129.46 | 69.26 | 0.12 | 0.82 | 42.86 | ||||||||||||||||||||||||||||||||||||||||||||||||||
| EBSB |
Meridian Bancorp, Inc. |
PA | 10.13 | 10.13 | 1.43 | 13.01 | 1.40 | 12.71 | 0.33 | 225.18 | 11.80 | 148.02 | 15.00 | 148.02 | 12.09 | 0.11 | 0.00 | NM | ||||||||||||||||||||||||||||||||||||||||||||||||||
| CASH |
Meta Financial Group, Inc. |
MA | 16.12 | 16.12 | 0.56 | 3.23 | 0.30 | 1.75 | 0.00 | NM | 28.39 | 100.65 | 16.22 | 100.65 | 52.50 | NA | NA | NM | ||||||||||||||||||||||||||||||||||||||||||||||||||
| MSBF |
MSB Financial Corp. |
MA | 13.28 | 13.03 | 0.86 | 6.00 | 0.79 | 5.51 | NA | NA | 25.00 | 150.14 | 19.94 | 153.55 | 27.26 | 0.16 | 0.93 | 18.84 | ||||||||||||||||||||||||||||||||||||||||||||||||||
| NYCB |
New York Community Bancorp, Inc. |
SD | 10.33 | 6.45 | 1.36 | 13.82 | 1.64 | 16.70 | NA | NA | 16.34 | 196.65 | 20.32 | 328.63 | 13.50 | 0.52 | 0.60 | 9.81 | ||||||||||||||||||||||||||||||||||||||||||||||||||
| NFBK |
Northfield Bancorp, Inc. |
NJ | 15.37 | 15.37 | 0.37 | 2.08 | NA | NA | NA | NA | 60.71 | 131.50 | 20.21 | 131.50 | NA | 0.00 | 0.00 | NM | ||||||||||||||||||||||||||||||||||||||||||||||||||
| NWBI |
Northwest Bancshares, Inc. |
NY | 13.61 | 9.08 | 0.96 | 7.67 | NA | NA | NA | NA | 13.79 | 105.36 | 13.40 | 174.59 | NA | 0.68 | 5.14 | 70.83 | ||||||||||||||||||||||||||||||||||||||||||||||||||
| OCFC |
OceanFirst Financial Corp. |
NJ | 16.40 | 15.52 | 0.85 | 5.24 | 0.87 | 5.36 | 0.71 | 95.80 | 25.66 | 139.16 | 22.82 | 148.60 | 25.12 | 0.32 | 1.78 | 45.71 | ||||||||||||||||||||||||||||||||||||||||||||||||||
| ORIT |
Oritani Financial Corp. |
PA | 12.10 | 8.94 | 0.53 | 4.26 | 0.94 | 7.54 | 1.08 | 61.97 | 33.50 | 139.27 | 16.85 | 195.36 | 18.72 | 0.64 | 3.98 | 129.17 | ||||||||||||||||||||||||||||||||||||||||||||||||||
| OTTW |
Ottawa Bancorp, Inc. |
NJ | 11.21 | 8.43 | 0.70 | 6.66 | 0.98 | 9.22 | 1.11 | 33.20 | 25.78 | 156.57 | 17.56 | 214.92 | 18.13 | 0.60 | 2.14 | 53.21 | ||||||||||||||||||||||||||||||||||||||||||||||||||
| PBHC |
Pathfinder Bancorp, Inc. |
NJ | 13.49 | 13.49 | 1.50 | 10.60 | 1.11 | 7.85 | NA | NA | 13.06 | 138.86 | 18.73 | 138.86 | 17.58 | 0.70 | 4.15 | 93.02 | ||||||||||||||||||||||||||||||||||||||||||||||||||
| PBBI |
PB Bancorp, Inc. |
IL | 22.08 | 21.76 | 0.58 | 3.44 | 0.60 | 3.58 | NA | NA | 33.93 | 89.05 | 19.67 | 90.77 | 32.64 | 0.16 | 1.19 | 10.12 | ||||||||||||||||||||||||||||||||||||||||||||||||||
| PCSB |
PCSB Financial Corporation |
NY | 7.46 | 6.91 | 0.49 | 5.90 | NA | NA | NA | NA | 18.34 | 107.57 | 7.97 | 116.88 | NA | 0.20 | 1.33 | 24.39 | ||||||||||||||||||||||||||||||||||||||||||||||||||
| PBSK |
Poage Bankshares, Inc. |
CT | 16.45 | 15.32 | 0.31 | 1.90 | 0.25 | 1.53 | NA | NA | 49.26 | 95.22 | 15.66 | 103.59 | 61.13 | 0.16 | 1.55 | 61.90 | ||||||||||||||||||||||||||||||||||||||||||||||||||
| PROV |
Provident Financial Holdings, Inc. |
KY | 14.99 | 14.56 | 0.40 | 2.54 | 0.47 | 2.94 | 1.85 | 30.30 | 38.90 | 104.88 | 15.72 | 108.49 | 33.49 | 0.24 | 1.23 | 56.00 | ||||||||||||||||||||||||||||||||||||||||||||||||||
| PFS |
Provident Financial Services, Inc. |
CA | 10.97 | 10.97 | 0.57 | 5.10 | NA | NA | NA | NA | 22.89 | 113.86 | 12.49 | 113.86 | NA | 0.52 | 2.74 | 62.65 | ||||||||||||||||||||||||||||||||||||||||||||||||||
| PBIP |
Prudential Bancorp, Inc. |
NJ | 13.32 | NA | 0.97 | 7.25 | 0.97 | 7.24 | NA | NA | 18.06 | 134.32 | 17.90 | 204.30 | 17.79 | 0.76 | 2.96 | 52.11 | ||||||||||||||||||||||||||||||||||||||||||||||||||
| RNDB |
Randolph Bancorp, Inc. |
PA | 15.49 | 14.69 | 0.06 | 0.30 | NA | NA | NA | NA | NM | 126.25 | NA | 126.25 | NA | 0.12 | 0.68 | 171.43 | ||||||||||||||||||||||||||||||||||||||||||||||||||
| RVSB |
Riverview Bancorp, Inc. |
MA | 17.19 | NA | 0.00 | 0.02 | 0.21 | 1.38 | NA | NA | NA | 107.09 | NA | NA | NA | NA | NA | NA | ||||||||||||||||||||||||||||||||||||||||||||||||||
| SVBI |
Severn Bancorp, Inc. |
WA | 9.81 | 7.49 | 0.75 | 6.66 | NA | NA | NA | NA | 21.55 | 143.85 | 14.11 | 193.18 | NA | 0.08 | 1.13 | 24.24 | ||||||||||||||||||||||||||||||||||||||||||||||||||
| SIFI |
SI Financial Group, Inc. |
MD | 11.12 | 11.09 | 1.98 | 17.19 | NA | NA | 3.15 | 34.89 | 5.92 | 101.72 | NA | 102.12 | NA | 0.00 | 0.00 | NM | ||||||||||||||||||||||||||||||||||||||||||||||||||
| SBCP |
Sunshine Bancorp, Inc. |
CT | 10.43 | 9.44 | 0.75 | 7.10 | NA | NA | NA | NA | 15.41 | 109.85 | 11.45 | 122.66 | NA | 0.20 | 1.34 | 18.56 | ||||||||||||||||||||||||||||||||||||||||||||||||||
| TBNK |
Territorial Bancorp Inc. |
FL | 11.93 | 9.85 | 0.21 | 1.64 | 0.42 | 3.28 | NA | NA | NM | 157.25 | 18.75 | 194.98 | 45.76 | NA | NA | NM | ||||||||||||||||||||||||||||||||||||||||||||||||||
| TSBK |
Timberland Bancorp, Inc. |
HI | 12.02 | 12.02 | 0.90 | 7.38 | 0.89 | 7.25 | NA | NA | 17.14 | 130.03 | 15.63 | 130.03 | 17.45 | 0.80 | 2.59 | 53.33 | ||||||||||||||||||||||||||||||||||||||||||||||||||
| TRST |
TrustCo Bank Corp NY |
WA | 11.07 | 10.54 | 1.29 | 11.87 | 1.28 | 11.80 | 1.26 | 115.24 | 13.79 | 153.60 | 17.01 | 162.35 | 13.88 | 0.44 | 2.01 | 25.16 | ||||||||||||||||||||||||||||||||||||||||||||||||||
| UCBA |
United Community Bancorp |
NY | 8.98 | 8.97 | 0.89 | 9.97 | 0.88 | 9.80 | 0.85 | 114.94 | 17.67 | 173.82 | 15.60 | 174.04 | 17.97 | 0.26 | 3.30 | 58.33 | ||||||||||||||||||||||||||||||||||||||||||||||||||
| UBNK |
United Financial Bancorp, Inc. |
IN | 12.83 | 12.39 | 0.62 | 4.68 | 0.62 | 4.65 | NA | NA | 22.50 | 108.14 | 13.87 | 112.56 | 22.62 | 0.24 | 1.33 | 30.00 | ||||||||||||||||||||||||||||||||||||||||||||||||||
| WSBF |
Waterstone Financial, Inc. |
CT | 9.95 | 8.29 | 0.80 | 7.96 | 0.85 | 8.49 | NA | NA | 16.97 | 131.84 | 13.11 | 161.05 | 15.92 | 0.48 | 2.77 | 47.06 | ||||||||||||||||||||||||||||||||||||||||||||||||||
| WAYN |
Wayne Savings Bancshares, Inc. |
WI | 24.03 | 24.00 | 1.60 | 6.94 | 1.60 | 6.94 | 1.11 | 103.85 | 18.98 | 138.72 | 33.34 | 138.92 | 18.98 | 0.48 | 2.46 | 87.38 | ||||||||||||||||||||||||||||||||||||||||||||||||||
| WCFB |
WCF Bancorp, Inc. |
OH | 9.23 | 8.88 | 0.47 | 5.12 | 0.47 | 5.12 | 0.92 | 73.53 | 23.10 | 119.54 | 11.03 | 124.72 | 23.10 | 0.36 | 2.02 | 46.75 | ||||||||||||||||||||||||||||||||||||||||||||||||||
| WEBK |
Wellesley Bancorp, Inc. |
IA | 23.33 | NA | 0.09 | 0.51 | 0.01 | 0.07 | 0.78 | 53.40 | NM | 88.80 | 20.72 | 86.85 | NM | 0.20 | 2.00 | 400.00 | ||||||||||||||||||||||||||||||||||||||||||||||||||
| WBB |
Westbury Bancorp, Inc. |
MA | 8.01 | 8.01 | 0.46 | 5.59 | NA | NA | NA | NA | 20.93 | 118.99 | 9.53 | 118.99 | NA | 0.16 | 0.59 | 12.40 | ||||||||||||||||||||||||||||||||||||||||||||||||||
| WNEB |
Western New England Bancorp, Inc. |
WI | 10.47 | 10.47 | 0.44 | 3.99 | 0.38 | 3.52 | 0.42 | 173.42 | 24.76 | 103.70 | 10.85 | 103.70 | 28.00 | NA | NA | NM | ||||||||||||||||||||||||||||||||||||||||||||||||||
| WBKC |
Wolverine Bancorp, Inc. |
MA | 11.78 | 11.06 | 0.48 | 4.21 | 0.64 | 5.61 | NA | NA | 34.50 | 129.60 | 15.27 | 139.13 | 24.59 | 0.12 | 1.16 | 40.00 | ||||||||||||||||||||||||||||||||||||||||||||||||||
| WSFS |
WSFS Financial Corporation |
MI | 14.04 | 14.04 | 1.14 | 7.00 | 1.14 | 7.00 | 1.49 | 146.34 | 14.81 | 110.53 | 15.51 | 110.53 | 14.81 | 1.60 | 5.00 | 74.07 | ||||||||||||||||||||||||||||||||||||||||||||||||||
| WVFC |
WVS Financial Corp. |
DE | 10.27 | NA | 1.06 | 10.11 | 1.12 | 10.66 | 0.88 | 69.95 | 22.03 | 210.69 | 21.64 | 297.96 | 20.61 | 0.28 | 0.59 | 12.62 | ||||||||||||||||||||||||||||||||||||||||||||||||||
RP® Financial, LC.
Exhibit IV-1B
Weekly Thrift Market Line - Part Two
Prices As of May 5, 2017
| Key Financial Ratios | Asset Quality Ratios | Pricing Ratios | Dividend Data (6) | |||||||||||||||||||||||||||||||||||||||||||||||||||||||||||||||||||
| Equity/ | Tang Equity/ | Reported Earnings | Core Earnings | NPAs/ | Rsvs/ | Price/ | Price/ | Price/ | Price/ | Price/ | Div/ | Dividend | Payout | |||||||||||||||||||||||||||||||||||||||||||||||||||||||||
| Assets(1) | Assets(1) | ROA(5) | ROE(5) | ROA(5) | ROE(5) | Assets | NPLs | Earnings | Book | Assets | Tang Book | Core Earnings | Share | Yield | Ratio (7) | |||||||||||||||||||||||||||||||||||||||||||||||||||||||
| (%) | (%) | (%) | (%) | (%) | (%) | (%) | (%) | (x) | (%) | (%) | (%) | (x) | ($) | (%) | (%) | |||||||||||||||||||||||||||||||||||||||||||||||||||||||
| Companies |
||||||||||||||||||||||||||||||||||||||||||||||||||||||||||||||||||||||
| MHCs |
||||||||||||||||||||||||||||||||||||||||||||||||||||||||||||||||||||||
| HONE |
HarborOne Bancorp, Inc. (MHC) |
PA | 9.77 | 9.77 | 0.48 | 4.86 | NA | NA | NA | NA | 17.88 | 90.58 | 8.85 | 90.58 | NA | 0.24 | 1.58 | 28.24 | ||||||||||||||||||||||||||||||||||||||||||||||||||||
| PVBC |
Provident Bancorp, Inc. (MHC) |
NY | 8.45 | 8.45 | 1.20 | 13.94 | NA | NA | NA | NA | 18.85 | 249.47 | 21.07 | 249.47 | NA | 0.38 | 1.60 | 30.16 | ||||||||||||||||||||||||||||||||||||||||||||||||||||
| OFED |
Oconee Federal Financial Corp. (MHC) |
MA | 12.97 | 12.50 | 0.36 | 2.88 | 0.50 | 3.95 | NA | NA | NA | 204.46 | 26.51 | 213.15 | NA | NA | NA | NA | ||||||||||||||||||||||||||||||||||||||||||||||||||||
| LSBK |
Lake Shore Bancorp, Inc. (MHC) |
KY | 22.06 | 18.18 | 0.37 | 1.64 | 0.37 | 1.64 | NA | NA | 68.75 | 121.05 | 26.70 | 154.21 | 68.75 | 0.40 | 4.16 | 285.71 | ||||||||||||||||||||||||||||||||||||||||||||||||||||
| MGYR |
Magyar Bancorp, Inc. (MHC) |
NY | 15.51 | 15.51 | 0.47 | 2.97 | 0.45 | 2.85 | NA | NA | 41.66 | 126.77 | NA | 126.77 | 43.22 | 0.32 | 2.02 | 78.95 | ||||||||||||||||||||||||||||||||||||||||||||||||||||
| KFFB |
Kentucky First Federal Bancorp (MHC) |
NJ | 8.28 | 8.28 | 0.22 | 2.62 | NA | NA | NA | NA | 61.90 | 156.77 | 12.99 | 156.77 | NA | NA | NA | NM | ||||||||||||||||||||||||||||||||||||||||||||||||||||
| TFSL |
TFS Financial Corporation (MHC) |
SC | 17.41 | 16.84 | 1.13 | 6.63 | 1.12 | 6.55 | 1.02 | 23.84 | 28.01 | 181.69 | 31.62 | 189.02 | 28.36 | 0.40 | 1.52 | 42.55 | ||||||||||||||||||||||||||||||||||||||||||||||||||||
| GCBC |
Greene County Bancorp, Inc. (MHC) |
MA | 13.35 | 13.35 | 0.86 | 6.16 | 0.76 | 5.47 | NA | NA | 28.08 | 177.68 | 23.73 | 177.68 | 31.64 | NA | NA | NM | ||||||||||||||||||||||||||||||||||||||||||||||||||||
| Under Acquisition |
||||||||||||||||||||||||||||||||||||||||||||||||||||||||||||||||||||||
| ANCB |
Anchor Bancorp |
OH | 12.52 | 12.46 | 0.67 | 5.14 | NA | NA | 1.45 | 30.16 | 55.97 | 283.17 | 35.45 | 284.82 | NA | 0.50 | 2.98 | 158.33 | ||||||||||||||||||||||||||||||||||||||||||||||||||||
| ASBB |
ASB Bancorp, Inc. |
NY | 12.02 | 10.87 | 0.46 | 3.95 | 0.48 | 4.17 | NA | NA | 35.21 | 130.31 | 14.62 | 147.43 | 33.07 | 0.16 | 0.78 | 27.59 | ||||||||||||||||||||||||||||||||||||||||||||||||||||
| AF |
Astoria Financial Corporation |
FL | 7.41 | 7.25 | 0.56 | 8.04 | NA | NA | 0.66 | 54.79 | 17.26 | 130.54 | 9.02 | 133.88 | NA | 0.24 | 1.23 | 21.24 | ||||||||||||||||||||||||||||||||||||||||||||||||||||
| EVER |
EverBank Financial Corp |
MA | 10.07 | 10.07 | 0.13 | 1.25 | NA | NA | NA | NA | NM | 145.92 | 14.69 | 145.92 | NA | 0.20 | 0.78 | 90.91 | ||||||||||||||||||||||||||||||||||||||||||||||||||||
| (1) | Average of High/Low or Bid/Ask price per share. |
| (2) | Or since offering price if converted of first listed in the past 52 weeks. Percent change figures are actual year-to-date and are not annualized. |
| (3) | EPS (earnings per share) is based on actual trailing 12 month data and is not shown on a pro forma basis. |
| (4) | Exludes intangibles (such as goodwill, value of core deposits, etc.). |
| (5) | ROA (return on assets) and ROE (return on equity) are indicated ratios based on trailing 12 month common earnings and average common equity and total assets balances. |
| (6) | Annualized based on last regular quarterly cash dividend announcement. |
| (7) | Indicated dividend as a percent of trailing 12 month earnings. |
| (8) | Excluded from averages due to actual or rumored acquisition activities or unusual operating characteristics. |
| (9) | For MHC institutions, market value reflects share price multiplied by public (non-MHC) shares. |
| Source: | SNL Financial, LC. and RP® Financial, LC. calculations. The information provided in this table has been obtained from sources we believe are reliable, but we cannot guarantee the accuracy or completeness of such information. |
Copyright (c) 2017 by RP® Financial, LC.
EXHIBIT IV-2
Historical Stock Price Indices
Exhibit IV-2
Historical Stock Price Indices(1)
| Year/Qtr. Ended |
DJIA | S&P 500 |
NASDAQ Composite |
SNL Thrift Index |
SNL Bank Index |
|||||||||||||||||
| 2004: |
Quarter 1 |
10357.7 | 1126.2 | 1994.2 | 1585.3 | 562.20 | ||||||||||||||||
| Quarter 2 |
10435.5 | 1140.8 | 2047.8 | 1437.8 | 546.62 | |||||||||||||||||
| Quarter 3 |
10080.3 | 1114.6 | 1896.8 | 1495.1 | 556.00 | |||||||||||||||||
| Quarter 4 |
10783.0 | 1211.9 | 2175.4 | 1605.6 | 595.10 | |||||||||||||||||
| 2005: |
Quarter 1 |
10503.8 | 1180.6 | 1999.2 | 1516.6 | 551.00 | ||||||||||||||||
| Quarter 2 |
10275.0 | 1191.3 | 2057.0 | 1577.1 | 563.27 | |||||||||||||||||
| Quarter 3 |
10568.7 | 1228.8 | 2151.7 | 1527.2 | 546.30 | |||||||||||||||||
| Quarter 4 |
10717.5 | 1248.3 | 2205.3 | 1616.4 | 582.80 | |||||||||||||||||
| 2006: |
Quarter 1 |
11109.3 | 1294.8 | 2339.8 | 1661.1 | 595.50 | ||||||||||||||||
| Quarter 2 |
11150.2 | 1270.2 | 2172.1 | 1717.9 | 601.14 | |||||||||||||||||
| Quarter 3 |
11679.1 | 1335.9 | 2258.4 | 1727.1 | 634.00 | |||||||||||||||||
| Quarter 4 |
12463.2 | 1418.3 | 2415.3 | 1829.3 | 658.60 | |||||||||||||||||
| 2007: |
Quarter 1 |
12354.4 | 1420.9 | 2421.6 | 1703.6 | 634.40 | ||||||||||||||||
| Quarter 2 |
13408.6 | 1503.4 | 2603.2 | 1645.9 | 622.63 | |||||||||||||||||
| Quarter 3 |
13895.6 | 1526.8 | 2701.5 | 1523.3 | 595.80 | |||||||||||||||||
| Quarter 4 |
13264.8 | 1468.4 | 2652.3 | 1058.0 | 492.85 | |||||||||||||||||
| 2008: |
Quarter 1 |
12262.9 | 1322.7 | 2279.1 | 1001.5 | 442.5 | ||||||||||||||||
| Quarter 2 |
11350.0 | 1280.0 | 2293.0 | 822.6 | 332.2 | |||||||||||||||||
| Quarter 3 |
10850.7 | 1166.4 | 2082.3 | 760.1 | 414.8 | |||||||||||||||||
| Quarter 4 |
8776.4 | 903.3 | 1577.0 | 653.9 | 268.3 | |||||||||||||||||
| 2009: |
Quarter 1 |
7608.9 | 797.9 | 1528.6 | 542.8 | 170.1 | ||||||||||||||||
| Quarter 2 |
8447.0 | 919.3 | 1835.0 | 538.8 | 227.6 | |||||||||||||||||
| Quarter 3 |
9712.3 | 1057.1 | 2122.4 | 561.4 | 282.9 | |||||||||||||||||
| Quarter 4 |
10428.1 | 1115.1 | 2269.2 | 587.0 | 260.8 | |||||||||||||||||
| 2010: |
Quarter 1 |
10856.6 | 1169.4 | 2398.0 | 626.3 | 301.1 | ||||||||||||||||
| Quarter 2 |
9744.0 | 1030.7 | 2109.2 | 564.5 | 257.2 | |||||||||||||||||
| Quarter 3 |
9744.0 | 1030.7 | 2109.2 | 564.5 | 257.2 | |||||||||||||||||
| Quarter 4 |
11577.5 | 1257.6 | 2652.9 | 592.2 | 290.1 | |||||||||||||||||
| 2011: |
Quarter 1 |
12319.7 | 1325.8 | 2781.1 | 578.1 | 293.1 | ||||||||||||||||
| Quarter 2 |
12414.3 | 1320.6 | 2773.5 | 540.8 | 266.8 | |||||||||||||||||
| Quarter 3 |
10913.4 | 1131.4 | 2415.4 | 443.2 | 198.9 | |||||||||||||||||
| Quarter 4 |
12217.6 | 1257.6 | 2605.2 | 481.4 | 221.3 | |||||||||||||||||
| 2012: |
Quarter 1 |
13212.0 | 1408.5 | 3091.6 | 529.3 | 284.9 | ||||||||||||||||
| Quarter 2 |
12880.1 | 1362.2 | 2935.1 | 511.6 | 257.3 | |||||||||||||||||
| Quarter 3 |
13437.1 | 1440.7 | 3116.2 | 557.6 | 276.8 | |||||||||||||||||
| Quarter 4 |
13104.1 | 1426.2 | 3019.5 | 565.8 | 292.7 | |||||||||||||||||
| 2013: |
Quarter 1 |
14578.5 | 1569.2 | 3267.5 | 602.3 | 318.9 | ||||||||||||||||
| Quarter 2 |
14909.6 | 1606.3 | 3404.3 | 625.3 | 346.7 | |||||||||||||||||
| Quarter 3 |
15129.7 | 1681.6 | 3771.5 | 650.8 | 354.4 | |||||||||||||||||
| Quarter 4 |
16576.7 | 1848.4 | 4176.6 | 706.5 | 394.4 | |||||||||||||||||
| 2014: |
Quarter 1 |
16457.7 | 1872.3 | 4199.0 | 718.9 | 410.8 | ||||||||||||||||
| Quarter 2 |
16826.6 | 1960.2 | 4408.2 | 723.9 | 405.2 | |||||||||||||||||
| Quarter 3 |
17042.9 | 1972.3 | 4493.4 | 697.7 | 411.0 | |||||||||||||||||
| Quarter 4 |
17823.1 | 2058.9 | 4736.1 | 738.7 | 432.8 | |||||||||||||||||
| 2015: |
Quarter 1 |
17776.1 | 2067.9 | 4900.9 | 749.3 | 418.8 | ||||||||||||||||
| Quarter 2 |
17619.5 | 2063.1 | 4986.9 | 795.7 | 448.4 | |||||||||||||||||
| Quarter 3 |
16284.7 | 1920.0 | 4620.2 | 811.7 | 409.4 | |||||||||||||||||
| Quarter 4 |
17425.0 | 2043.9 | 5007.4 | 809.1 | 431.5 | |||||||||||||||||
| 2016: |
Quarter 1 |
17685.1 | 2059.7 | 4869.9 | 788.1 | 381.4 | ||||||||||||||||
| Quarter 2 |
17930.0 | 2098.9 | 4842.7 | 780.9 | 385.6 | |||||||||||||||||
| Quarter 3 |
18308.2 | 2168.3 | 5312.0 | 827.2 | 413.7 | |||||||||||||||||
| Quarter 4 |
19762.6 | 2238.8 | 5383.1 | 966.7 | 532.7 | |||||||||||||||||
| 2017: |
Quarter 1 |
20663.2 | 2362.7 | 5911.7 | 918.9 | 535.8 | ||||||||||||||||
| As of May 5, 2017 |
21006.9 | 2399.3 | 6100.8 | 911.9 | 536.8 | |||||||||||||||||
| (1) | End of period data. |
| Sources: | SNL Financial and The Wall Street Journal. |
EXHIBIT IV-3
Stock Indices as of May 5, 2017
| SNL DataCenter : Indexes - Current | Page 1 of 3 |

Current Values
Industry: Banking
Geography: United States and Canada
| Day’s | Market Breadth | |||||||||||||||||||||||||||
| Index Value |
Last Update |
Day’s Change |
Change (%) |
£ | ¤ | — | ||||||||||||||||||||||
| SNL Custom** Indexes |
||||||||||||||||||||||||||||
| SNL Banking Indexes |
||||||||||||||||||||||||||||
| SNL U.S. Bank and Thrift |
513.86 | * | 5/5/2017 | (1.31 | )* | (0.25 | )* | 136 | * | 229 | * | 41 | * | |||||||||||||||
| SNL U.S. Bank |
536.81 | * | 5/5/2017 | (1.40 | )* | (0.26 | )* | 103 | * | 189 | * | 30 | * | |||||||||||||||
| SNL U.S. Thrift |
911.87 | * | 5/5/2017 | (0.21 | )* | (0.02 | )* | 33 | * | 40 | * | 11 | * | |||||||||||||||
| SNL TARP Participants |
85.34 | * | 5/5/2017 | (0.98 | )* | (1.13 | )* | 3 | * | 3 | * | 3 | * | |||||||||||||||
| KBW Nasdaq Bank |
92.64 | * | 5/5/2017 | (0.27 | )* | (0.29 | )* | NA | * | NA | * | NA | * | |||||||||||||||
| KBW Nasdaq Regional Bank |
106.52 | * | 5/5/2017 | (0.31 | )* | (0.29 | )* | NA | * | NA | * | NA | * | |||||||||||||||
| S&P 500 Bank |
289.26 | * | 5/5/2017 | (0.80 | )* | (0.28 | )* | NA | * | NA | * | NA | * | |||||||||||||||
| NASDAQ Bank |
3,730.27 | * | 5/5/2017 | (8.72 | )* | (0.23 | )* | NA | * | NA | * | NA | * | |||||||||||||||
| S&P 500 Commercial Banks |
413.26 | * | 5/5/2017 | (1.14 | )* | (0.28 | )* | NA | * | NA | * | NA | * | |||||||||||||||
| S&P 500 Diversified Banks |
491.59 | * | 5/5/2017 | (1.21 | )* | (0.25 | )* | NA | * | NA | * | NA | * | |||||||||||||||
| S&P 500 Regional Banks |
103.59 | * | 5/5/2017 | (0.42 | )* | (0.40 | )* | NA | * | NA | * | NA | * | |||||||||||||||
| S&P 500 Thrifts & Mortgage Finance |
4.56 | * | 11/2/2015 | (0.01 | )* | (0.31 | )* | NA | * | NA | * | NA | * | |||||||||||||||
| SNL Asset Size Indexes |
||||||||||||||||||||||||||||
| SNL U.S. Bank < $250M |
22.81 | * | 5/5/2017 | 2.37 | * | 11.58 | * | 1 | * | 0 | * | 0 | * | |||||||||||||||
| SNL U.S. Bank $250M-$500M |
419.04 | * | 5/5/2017 | 2.88 | * | 0.69 | * | 5 | * | 2 | * | 1 | * | |||||||||||||||
| SNL U.S. Thrift < $250M |
1,247.80 | * | 5/5/2017 | (0.65 | )* | (0.05 | )* | 2 | * | 3 | * | 0 | * | |||||||||||||||
| SNL U.S. Thrift $250M-$500M |
6,145.03 | * | 5/5/2017 | (0.16 | )* | 0.00 | * | 8 | * | 6 | * | 4 | * | |||||||||||||||
| SNL U.S. Bank < $500M |
796.03 | * | 5/5/2017 | 6.07 | * | 0.77 | * | 6 | * | 2 | * | 1 | * | |||||||||||||||
| SNL U.S. Thrift < $500M |
2,093.36 | * | 5/5/2017 | (0.23 | )* | (0.01 | )* | 10 | * | 9 | * | 4 | * | |||||||||||||||
| SNL U.S. Bank $500M-$1B |
989.45 | * | 5/5/2017 | (1.70 | )* | (0.17 | )* | 17 | * | 14 | * | 10 | * | |||||||||||||||
| SNL U.S. Thrift $500M-$1B |
3,057.29 | * | 5/5/2017 | (12.37 | )* | (0.40 | )* | 9 | * | 8 | * | 5 | * | |||||||||||||||
| SNL U.S. Bank $1B-$5B |
1,152.82 | * | 5/5/2017 | (2.51 | )* | (0.22 | )* | 52 | * | 86 | * | 14 | * | |||||||||||||||
| SNL U.S. Thrift $1B-$5B |
3,562.96 | * | 5/5/2017 | (12.16 | )* | (0.34 | )* | 8 | * | 15 | * | 1 | * | |||||||||||||||
| SNL U.S. Bank $5B-$10B |
1,342.69 | * | 5/5/2017 | (4.47 | )* | (0.33 | )* | 9 | * | 34 | * | 3 | * | |||||||||||||||
| SNL U.S. Thrift $5B-$10B |
988.74 | * | 5/5/2017 | (1.03 | )* | (0.10 | )* | 3 | * | 6 | * | 0 | * | |||||||||||||||
| SNL U.S. Bank > $10B |
464.23 | * | 5/5/2017 | (1.21 | )* | (0.26 | )* | 19 | * | 53 | * | 2 | * | |||||||||||||||
| SNL U.S. Thrift > $10B |
159.40 | * | 5/5/2017 | 0.37 | * | 0.23 | * | 3 | * | 2 | * | 1 | * | |||||||||||||||
| SNL Market Cap Indexes |
||||||||||||||||||||||||||||
| SNL Micro Cap U.S. Bank |
638.02 | * | 5/5/2017 | 0.45 | * | 0.07 | * | 104 | * | 86 | * | 358 | * | |||||||||||||||
| SNL Micro Cap U.S. Thrift |
1,072.49 | * | 5/5/2017 | (1.69 | )* | (0.16 | )* | 30 | * | 30 | * | 63 | * | |||||||||||||||
| SNL Micro Cap U.S. Bank & Thrift |
739.76 | * | 5/5/2017 | 0.25 | * | 0.03 | * | 134 | * | 116 | * | 421 | * | |||||||||||||||
| SNL Small Cap U.S. Bank |
661.18 | * | 5/5/2017 | (1.55 | )* | (0.23 | )* | 37 | * | 73 | * | 19 | * | |||||||||||||||
| SNL Small Cap U.S. Thrift |
784.39 | * | 5/5/2017 | (3.74 | )* | (0.47 | )* | 7 | * | 14 | * | 1 | * | |||||||||||||||
| SNL Small Cap U.S. Bank & Thrift |
684.87 | * | 5/5/2017 | (1.86 | )* | (0.27 | )* | 44 | * | 87 | * | 20 | * | |||||||||||||||
| SNL Mid Cap U.S. Bank |
418.31 | * | 5/5/2017 | (1.52 | )* | (0.36 | )* | 17 | * | 62 | * | 7 | * | |||||||||||||||
| SNL Mid Cap U.S. Thrift |
356.25 | * | 5/5/2017 | (0.30 | )* | (0.09 | )* | 4 | * | 7 | * | 1 | * | |||||||||||||||
| SNL Mid Cap U.S. Bank & Thrift |
415.87 | * | 5/5/2017 | (1.38 | )* | (0.33 | )* | 21 | * | 69 | * | 8 | * | |||||||||||||||
| SNL Large Cap U.S. Bank |
331.25 | * | 5/5/2017 | (0.83 | )* | (0.25 | )* | 9 | * | 23 | * | 0 | * | |||||||||||||||
https://www.snl.com/interactivex/indexes.aspx?GeographyGlobalRegion=4&Form_Name=UserInputs&Printable=1&Inde... 5/5/2017
| SNL DataCenter : Indexes - Current | Page 2 of 3 |
| SNL Large Cap U.S. Thrift |
135.94 | * | 5/5/2017 | 1.33 | * | 0.99 | * | 1 | * | 0 | * | 0 | * | |||||||||||||
| SNL Large Cap U.S. Bank & Thrift |
333.16 | * | 5/5/2017 | (0.82 | )* | (0.24 | )* | 10 | * | 23 | * | 0 | * | |||||||||||||
| SNL Geographic Indexes |
||||||||||||||||||||||||||
| SNL Mid-Atlantic U.S. Bank |
490.94 | * | 5/5/2017 | (0.44 | )* | (0.09 | )* | 21 | * | 39 | * | 7 | * | |||||||||||||
| SNL Mid-Atlantic U.S. Thrift |
3,383.61 | * | 5/5/2017 | (0.68 | )* | (0.02 | )* | 12 | * | 15 | * | 4 | * | |||||||||||||
| SNL Midwest U.S. Bank |
634.34 | * | 5/5/2017 | (3.73 | )* | (0.58 | )* | 28 | * | 44 | * | 3 | * | |||||||||||||
| SNL Midwest U.S. Thrift |
3,180.80 | * | 5/5/2017 | 3.69 | * | 0.12 | * | 9 | * | 9 | * | 2 | * | |||||||||||||
| SNL New England U.S. Bank |
596.06 | * | 5/5/2017 | (2.72 | )* | (0.45 | )* | 5 | * | 13 | * | 2 | * | |||||||||||||
| SNL New England U.S. Thrift |
3,054.09 | * | 5/5/2017 | (13.16 | )* | (0.43 | )* | 6 | * | 8 | * | 2 | * | |||||||||||||
| SNL Southeast U.S. Bank |
332.52 | * | 5/5/2017 | (1.44 | )* | (0.43 | )* | 24 | * | 49 | * | 10 | * | |||||||||||||
| SNL Southeast U.S. Thrift |
425.14 | * | 5/5/2017 | (0.64 | )* | (0.15 | )* | 1 | * | 3 | * | 2 | * | |||||||||||||
| SNL Southwest U.S. Bank |
1,106.12 | * | 5/5/2017 | (2.34 | )* | (0.21 | )* | 8 | * | 15 | * | 5 | * | |||||||||||||
| SNL Southwest U.S. Thrift |
845.06 | * | 5/5/2017 | 3.69 | * | 0.44 | * | 1 | * | 0 | * | 1 | * | |||||||||||||
| SNL Western U.S. Bank |
1,428.88 | * | 5/5/2017 | (1.86 | )* | (0.13 | )* | 17 | * | 29 | * | 3 | * | |||||||||||||
| SNL Western U.S. Thrift |
131.48 | * | 5/5/2017 | 0.35 | * | 0.26 | * | 4 | * | 5 | * | 0 | * | |||||||||||||
| SNL Stock Exchange Indexes |
||||||||||||||||||||||||||
| SNL U.S. Bank NYSE |
459.53 | * | 5/5/2017 | (1.23 | )* | (0.27 | )* | 7 | * | 38 | * | 2 | * | |||||||||||||
| SNL U.S. Thrift NYSE |
139.60 | * | 5/5/2017 | 0.69 | * | 0.50 | * | 3 | * | 1 | * | 1 | * | |||||||||||||
| SNL U.S. Bank NYSE MKT |
840.58 | * | 5/5/2017 | (2.61 | )* | (0.31 | )* | 3 | * | 3 | * | 0 | * | |||||||||||||
| SNL U.S. Bank NASDAQ |
898.37 | * | 5/5/2017 | (2.06 | )* | (0.23 | )* | 93 | * | 148 | * | 28 | * | |||||||||||||
| SNL U.S. Thrift NASDAQ |
2,726.34 | * | 5/5/2017 | (6.51 | )* | (0.24 | )* | 30 | * | 39 | * | 10 | * | |||||||||||||
| SNL U.S. Bank Pink |
388.52 | * | 5/5/2017 | 0.01 | * | 0.00 | * | 64 | * | 56 | * | 360 | * | |||||||||||||
| SNL U.S. Thrift Pink |
312.44 | * | 5/5/2017 | (1.99 | )* | (0.63 | )* | 9 | * | 11 | * | 54 | * | |||||||||||||
| SNL Bank TSX |
1,090.41 | * | 5/5/2017 | 14.32 | * | 1.33 | * | 9 | * | 2 | * | 0 | * | |||||||||||||
| SNL Other Indexes |
||||||||||||||||||||||||||
| SNL U.S. Thrift MHCs |
5,965.24 | * | 5/5/2017 | (16.68 | )* | (0.28 | )* | 2 | * | 6 | * | 1 | * | |||||||||||||
| SNL Pink Asset Size Indexes |
||||||||||||||||||||||||||
| SNL U.S. Bank Pink < $100M |
209.26 | * | 5/5/2017 | 2.37 | * | 1.14 | * | 1 | * | 1 | * | 22 | * | |||||||||||||
| SNL U.S. Bank Pink $100M-$500M |
462.17 | * | 5/5/2017 | 0.53 | * | 0.11 | * | 35 | * | 25 | * | 217 | * | |||||||||||||
| SNL U.S. Bank Pink > $500M |
339.45 | * | 5/5/2017 | (0.13 | )* | (0.04 | )* | 28 | * | 30 | * | 121 | * | |||||||||||||
| Broad Market Indexes |
||||||||||||||||||||||||||
| DJIA |
21,006.94 | * | 5/5/2017 | 55.47 | * | 0.26 | * | |||||||||||||||||||
| S&P 500 |
2,399.29 | * | 5/5/2017 | 9.76 | * | 0.41 | * | |||||||||||||||||||
| S&P Mid-Cap |
1,738.52 | * | 5/5/2017 | 14.34 | * | 0.83 | * | |||||||||||||||||||
| S&P Small-Cap |
848.96 | * | 5/5/2017 | 3.97 | * | 0.47 | * | |||||||||||||||||||
| S&P 500 Financials |
395.46 | * | 5/5/2017 | (0.40 | )* | (0.10 | )* | |||||||||||||||||||
| SNL U.S. Financial Institutions |
866.61 | * | 5/5/2017 | (0.92 | )* | (0.11 | )* | |||||||||||||||||||
| MSCI US IMI Financials |
1,474.38 | * | 5/4/2017 | 3.16 | * | 0.21 | * | |||||||||||||||||||
| NASDAQ |
6,100.76 | * | 5/5/2017 | 25.42 | * | 0.42 | * | |||||||||||||||||||
| NASDAQ Finl |
4,055.31 | * | 5/5/2017 | 1.55 | * | 0.04 | * | |||||||||||||||||||
| NYSE |
11,615.59 | * | 5/5/2017 | 80.88 | * | 0.70 | * | |||||||||||||||||||
| Russell 1000 |
1,324.05 | * | 5/4/2017 | 0.19 | * | 0.01 | * | |||||||||||||||||||
| Russell 2000 |
1,388.85 | * | 5/4/2017 | (2.08 | )* | (0.15 | )* | |||||||||||||||||||
| Russell 3000 |
1,415.54 | * | 5/4/2017 | 0.03 | * | 0.00 | * | |||||||||||||||||||
| S&P TSX Composite |
15,582.04 | * | 5/5/2017 | 185.34 | * | 1.20 | * | |||||||||||||||||||
| MSCI AC World (USD) |
457.05 | * | 5/4/2017 | 0.43 | * | 0.09 | * | |||||||||||||||||||
| MSCI World (USD) |
1,886.48 | * | 5/4/2017 | 3.35 | * | 0.18 | * | |||||||||||||||||||
| Bermuda Royal Gazette/BSX |
2,073.24 | * | 5/4/2017 | 23.04 | * | 1.12 | * |
Intraday data is available for certain exchanges. In all cases, the data is at least 15 minutes delayed.
* - Intraday data is not currently available. Data is as of the previous close.
https://www.snl.com/interactivex/indexes.aspx?GeographyGlobalRegion=4&Form_Name=UserInputs&Printable=1&Inde... 5/5/2017
| SNL DataCenter : Indexes - Current | Page 3 of 3 |
** - Non-publicly traded institutions and institutions outside of your current subscription are not included in custom indexes. Custom indexes including foreign institutions do not take into account currency translations. Data is as of the previous close.
All SNL indexes are market-value weighted; i.e., an institution’s effect on an index is proportional to that institution’s market capitalization.
Source: MSCI. MSCI makes no express or implied warranties or representations and shall have no liability whatsoever with respect to any MSCI data contained herein. The MSCI data may not be further redistributed or used as a basis for other indices or any securities or financial products.
| Mid-Atlantic: DE, DC, MD, NJ, NY, PA, PR | Midwest: IA, IN, IL, KS, KY, MI, MN, MO, ND, NE, OH, SD, WI | |
| New England: CT, ME, MA, NH, RI, VT | Southeast: AL, AR, FL, GA, MS, NC, SC, TN, VA, WV | |
| Southwest: CO, LA, NM, OK, TX, UT | West: AZ, AK, CA, HI, ID, MT, NV, OR, WA, WY | |
Copyright © 2017, S&P Global Market Intelligence
Usage of this product is governed by the License Agreement.
S&P Global Market Intelligence, 55 Water Street, New York, NY 10041
https://www.snl.com/interactivex/indexes.aspx?GeographyGlobalRegion=4&Form_Name=UserInputs&Printable=1&Inde... 5/5/2017
EXHIBIT IV-4
New York Thrift Acquisitions 2013 - Present
Exhibit IV-4
New York Thrift Acquisitions 2013-Present
| Target Financials at Announcement | Deal Terms and Pricing at Announcement | |||||||||||||||||||||||||||||||||||||||||||||||||||||||||||||||||||||||||
| Announce |
Complete Date |
Buyer Short Name |
|
Target Name |
|
Total Assets ($000) |
E/A (%) |
TE/A (%) |
LTM ROAA (%) |
LTM ROAE (%) |
NPAs/ Assets (%) |
Rsrvs/ NPLs (%) |
Deal Value ($M) |
Value/ Share ($) |
P/B (%) |
P/TB (%) |
P/E (x) |
P/A (%) |
Prem/ Cdeps (%) |
|||||||||||||||||||||||||||||||||||||||||||||||||||||||
| 03/15/2017 | Def. Agrmt. | Kinderhook Bank Corp. |
NY | Patriot Federal Bank |
NY | 141,246 | 8.73 | 8.61 | 0.37 | 4.09 | 0.55 | 231.02 | 14.6 | 9.945 | 118.10 | 119.86 | 28.65 | 10.30 | 2.61 | |||||||||||||||||||||||||||||||||||||||||||||||||||||||
| 03/07/2017 | Def. Agrmt. | Sterling Bancorp |
NY | Astoria Financial Corporation |
NY | 14,558,652 | 11.77 | 10.64 | 0.48 | 4.23 | 1.70 | 37.04 | 2,229.7 | 21.919 | 140.03 | 158.56 | 35.35 | 15.32 | 9.86 | |||||||||||||||||||||||||||||||||||||||||||||||||||||||
| 12/16/2016 | Def. Agrmt. | Wallkill Valley FS&LA |
NY | Hometown Bancorp, Inc. (MHC) |
NY | 122,950 | 6.73 | 6.44 | -0.03 | -0.38 | NA | NA | 7.0 | 3.010 | 84.60 | 88.68 | NM | 5.70 | -1.00 | |||||||||||||||||||||||||||||||||||||||||||||||||||||||
| 02/24/2015 | 12/04/2015 | Community Bank System Inc. |
NY | Oneida Financial Corp. |
NY | 798,169 | 12.01 | 9.01 | 0.66 | 5.44 | 0.17 | 326.98 | 142.1 | 19.986 | 146.60 | 202.07 | 27.38 | 17.80 | 11.58 | |||||||||||||||||||||||||||||||||||||||||||||||||||||||
| 09/25/2014 | 04/28/2015 | Putnam County SB |
NY | CMS Bancorp, Inc. |
NY | 273,045 | 8.72 | 8.72 | 0.25 | 2.91 | NA | NA | 25.4 | 13.250 | 110.58 | 110.58 | 40.15 | 9.29 | 1.72 | |||||||||||||||||||||||||||||||||||||||||||||||||||||||
| 01/30/2014 | 06/30/2014 | Kearny Financial Corp. (MHC) |
NJ | Atlas Bank |
NY | 110,480 | 13.68 | 13.68 | -0.93 | -6.18 | 0.60 | 109.79 | NA | NA | NA | NA | NA | NA | NA | |||||||||||||||||||||||||||||||||||||||||||||||||||||||
|
|
|
|
|
|
|
|
|
|
|
|
|
|
|
|
|
|
|
|
|
|
|
|
|
|||||||||||||||||||||||||||||||||||||||||||||||||||
| Average: |
2,667,424 | 10.27 | 9.52 | 0.13 | 1.68 | 0.75 | 176.21 | 119.98 | 135.95 | 32.88 | 11.68 | 4.95 | ||||||||||||||||||||||||||||||||||||||||||||||||||||||||||||||
| Median: |
207,146 | 10.25 | 8.87 | 0.31 | 3.50 | 0.58 | 170.40 | 118.10 | 119.86 | 32.00 | 10.30 | 2.61 | ||||||||||||||||||||||||||||||||||||||||||||||||||||||||||||||
Source: SNL Financial, LC.
EXHIBIT IV-5
Ponce Bank
Director and Senior Management Summary Resumes
Exhibit IV-5
Ponce Bank
Director and Senior Management Summary Resumes
The business experience for the past five years of each of our directors is set forth below. The biographies also contain information regarding the person’s experience, qualifications, attributes or skills that caused the board of directors to determine that the person should serve as a director. Unless otherwise indicated, directors have held their positions for the past five years.
James C. Demetriou is the President and Chief Executive Officer of First Management Corp., a property management company located in Astoria, New York, established in 1985 and which has a portfolio of over 130 residential, cooperative, condominium and commercial buildings. Mr. Demetriou is also a partner in the accounting firm, J. Demetriou & Co., established in 1970. In addition, Mr. Demetriou has been a New York licensed real estate broker and sponsoring broker of Archway Realty, Inc., in Astoria, New York since 1985. Furthermore, Mr. Demetriou is the President and Founder of Foxx Capital Funding, Inc. a New York licensed mortgage broker established in 1999.
William Feldman has been investing in and managing commercial and residential real estate properties in the New York metropolitan area for over 30 years. As the present time, Mr. Feldman is managing 13 properties, with ownership interests varying between 12.5% to 50.0%, held by The Feldman Living Trust. Mr. Feldman is also President of the Southern Boulevard Business Improvement District, a not-for-profit entity whose mission is to increase the economic growth and stability of the Southern Boulevard shopping area. Prior to 2013, Mr. Feldman owned several men’s clothing stores.
Julio Gurman is an investor in and manager of commercial and residential real estate properties in the New York metropolitan area. Mr. Gurman is a co-investor/manager of the same 13 properties as Mr. Feldman.
Nick R. Lugo is an investor in real estate properties located in the New York area and holds these investments in several limited liability companies. Mr. Lugo is also President of Nick Lugo Travel Corp., which he founded in 1980. In addition, Mr. Lugo is also the owner and publisher of LaVoz Hispana, a weekly newspaper. Mr. Lugo also founded in 2006 the New York City Hispanic Chamber of Commerce and serves as its Chairman and President. Mr. Lugo is a Director of the Southern Boulevard Business Improvement District.
Carlos P. Naudon has served as President and Chief Operating Officer of Ponce De Leon Federal Bank since 2015, having joined the Board of Directors in 2014. No later than one year after completion of the reorganization, or January 1, 2019, if earlier, Mr. Naudon will become President and Chief Executive Officer of Ponce Bank. Upon completion of the reorganization, Mr. Naudon will become President and Chief Executive Officer of PDL Community Bancorp and President and Chief Operating Officer of Ponce Bank Mutual Holding Company. Prior to becoming President of Ponce De Leon Federal Bank, Mr. Naudon served as a consultant and compliance counsel to Ponce De Leon Federal Bank. Mr. Naudon owns Banking Spectrum, Inc., now a banking publishing company, formerly a bank consulting company. Until 2015, Mr. Naudon was a partner in the law firm of Allister & Naudon. Both of the foregoing firms were established in 1984 to provide services to banking institutions. Mr. Naudon became Of Counsel to the law firm Cullen & Dykman in 2015. Mr. Naudon has also previously served in many senior management positions at other companies. Before retiring from his consulting and law firms in 2015, Mr. Naudon was a frequent lecturer and speaker on banking issues, corporate governance, quality assurance and performance incentives. Mr. Naudon has current and previous service in various healthcare and community organizations. Mr. Naudon is a member of the New York State Bar Association, the New York City Hispanic Chamber of Commerce and other professional associations.
Manuel A. Romero is President of Manuel A. Romero, P.C., a professional corporation specializing in personal injury law matters. Mr. Romero is the head trial lawyer at the law firm and has served in that capacity for over 28 years. Mr. Romero serves as a member of the Finance Committee of the New York State Bar Association and teaches trial techniques at Cornell Law School on behalf of the Trial Academy of the New York State Bar Association.
Steven Tsavaris is currently the Chairman of the Board and Chief Executive Officer of Ponce De Leon Federal Bank. No later than one year after completion of the reorganization, or January 1, 2019, if earlier, Mr. Tsavaris will become Executive Chairman, a salaried officer, of Ponce Bank. Upon completion of the reorganization, Mr. Tsavaris will become Chairman of the Board and Chief Executive Officer of Ponce Bank Mutual Holding Company and Executive Chairman, a salaried officer, of PDL Community Bancorp. Mr. Tsavaris joined Ponce De Leon Federal Bank as an Executive Vice President in 1995, became President in 1999, and was made Chief Executive Officer in 2011. In 2013, Mr. Tsavaris became Chairman of the Board.
Exhibit IV-5 (continued)
Ponce Bank
Director and Senior Management Summary Resumes
Executive Officer of Ponce De Leon Federal Bank, Ponce Bank, Ponce Bank Mutual Holding Company and PDL Community Bancorp who is Not a Director
Frank Perez, age 49, was appointed Executive Vice President and Chief Financial Officer of Ponce De Leon Federal Bank in January 2017. Upon completion of the reorganization, Mr. Perez will become Executive Vice President and Chief Financial Officer of Ponce Bank, Ponce Bank Mutual Holding Company and PDL Community Bancorp. Mr. Perez is a certified public accountant and has over 20 years of experience in the banking industry. Until recently, Mr. Perez was the sole employee of Tennessee Commerce Bancorp, Inc., Franklin, Tennessee, a former bank holding company in the process of winding down its residual operations. Prior to joining Ponce De Leon Federal Bank, Mr. Perez was, from January 2015 until July 2016, Executive Vice President and Chief Financial Officer of First Volunteer Bank, Chattanooga, Tennessee, a privately held bank. From May 2012 until January 2015, Mr. Perez was the Executive Vice President and Chief Financial Officer of First Financial Service Corporation, the bank holding company for First Federal Savings Bank of Elizabethtown, Elizabethtown, Kentucky. From August 2008 to February 2012 Mr. Perez was the Chief Financial Officer and Investment Relations Officer of Tennessee Commerce Bancorp, Inc. and its subsidiary, Tennessee Commerce Bank. On January 27, 2012, Tennessee Commerce Bank was closed by the Tennessee Department of Financial Institutions, which appointed the FDIC as receiver. Subsequent to this receivership, Mr. Perez assumed his positions at First Financial Service Corporation and First Federal Savings Bank of Elizabethtown. As a consequence of First Federal Savings Bank of Elizabethtown being designated at that time as a troubled bank by the FDIC, First Federal Savings Bank of Elizabethtown had to file a notice of change of a senior executive officer as required by federal law and regulation. Upon completion of its review, the FDIC issued a notice that it did not object to Mr. Perez’s appointment as Chief Financial Officer of First Federal Savings Bank of Elizabethtown.
Executive Officers of Ponce De Leon Federal Bank and Ponce Bank who are Not Directors
The following sets forth information regarding our executive officers who are not directors. Age information is as of December 31, 2016. The executive officers of PDL Community Bancorp and Ponce Bank are elected annually.
Ioannis Kouzilos, age 38, is currently our Senior Vice President, Chief Lending Officer, a position he assumed in March, 2017. Prior to assuming his current position, Mr. Kouzilos was our Senior Vice President, Asset Management. Mr. Kouzilos has been employed by Ponce De Leon Federal Bank since July 2013 and has managed a number of departments, primarily focusing on asset quality, credit risk, asset recovery and lending operations. From April 2011 to June 2013, Mr. Kouzilos was Vice President, Credit Administrator for Alma Bank, New York, New York.
Elizabeth Macias, age 60, is currently our Senior Vice President and Chief Information Systems Officer. In this position, Ms. Macias manages our Information Technology, Vendor Management, Loan Servicing Systems and Facilities Management. Ms. Macias joined Ponce De Leon Federal Bank in August 2015. Prior to this time, Ms. Macias served as Vice President of Information Technology at Intervest National Bank for ten years and has held senior management positions in information technology, management information systems and information security for over 30 years.
Madeline V. Marquez, age 59, is currently our Senior Vice President of SBA/CDFI Initiatives and assumed this position on February 1, 2017. Prior to that time, Ms. Marquez served as Executive Vice President of the Business Initiative Corporation of New York (“BICNY”) which is a Certified SBA 504 Lender in New York State. Ms. Marquez held various positions of increasing responsibility with BICNY starting in 1998. In October 2012, Ms. Marquez became Chief Operating Officer of BICNY and Executive Vice President in January 2016.
David Rodriguez, age 61, has been employed by Ponce De Leon Federal Bank since April 2005. Mr. Rodriquez is currently Senior Vice President, Chief Relationship Manager and was, until March 2017, Senior Vice President and Chief Lending Officer and had held this position since 2007.
Rafael Sanchez, age 43, was appointed our Senior Vice President of Retail and Commercial Banking in November 2016. Mr. Sanchez is responsible for the oversight of the Sales and Marketing Department, Branch Operations Control Department, Regional Commercial Relationship Officers and Retail Banking. Prior to joining Ponce De Leon Federal Bank, Mr. Sanchez has held various positions in retail banking, most recently as Senior Vice President and Regional Manager at Popular Community Bank, Bronx, New York from February 2012 until joining Ponce De Leon Federal Bank.
| Source: | Ponce Bank’s prospectus. |
EXHIBIT IV-6
Ponce Bank
Pro Forma Regulatory Capital Ratios
Exhibit IV-6
Ponce Bank
Pro Forma Regulatory Capital Ratios
| Pro Forma at March 31, 2017, Based Upon the Sale in the Offering of (1) | ||||||||||||||||||||||||||||||||||||||||
| Ponce De Leon Federal Bank Historical at March 31, 2017 |
5,339,969 Shares | 6,282,316 Shares | 7,224,663 Shares | 8,308,362 Shares(2) | ||||||||||||||||||||||||||||||||||||
| Amount | Percent of Assets(3) |
Amount | Percent of Assets(3) |
Amount | Percent of Assets(3) |
Amount | Percent of Assets(3) |
Amount | Percent of Assets(3) |
|||||||||||||||||||||||||||||||
| (Dollars in thousands) | ||||||||||||||||||||||||||||||||||||||||
| Equity |
$ | 93,474 | 11.89 | % | $ | 111,696 | 13.76 | % | $ | 115,133 | 14.11 | % | $ | 118,571 | 14.45 | % | $ | 122,523 | 14.83 | % | ||||||||||||||||||||
| Tier 1 leverage capital |
$ | 99,803 | 13.08 | % | $ | 118,025 | 14.97 | % | $ | 121,462 | 15.32 | % | $ | 124,900 | 15.66 | % | $ | 128,852 | 16.05 | % | ||||||||||||||||||||
| Tier 1 leverage capital requirement |
38,153 | 5.00 | % | 39,413 | 5.00 | % | 39,647 | 5.00 | % | 39,880 | 5.00 | % | 40,148 | 5.00 | % | |||||||||||||||||||||||||
|
|
|
|
|
|
|
|
|
|
|
|
|
|
|
|
|
|
|
|
|
|||||||||||||||||||||
| Excess |
$ | 61,650 | 8.08 | % | $ | 78,612 | 9.97 | % | $ | 81,815 | 10.32 | % | $ | 85,020 | 10.66 | % | $ | 88,704 | 11.05 | % | ||||||||||||||||||||
|
|
|
|
|
|
|
|
|
|
|
|
|
|
|
|
|
|
|
|
|
|||||||||||||||||||||
| Tier 1 risk-based capital(4) |
$ | 99,803 | 16.91 | % | $ | 118,025 | 19.82 | % | $ | 121,462 | 20.37 | % | $ | 124,900 | 20.91 | % | $ | 128,852 | 21.54 | % | ||||||||||||||||||||
| Tier 1 risk-based requirement |
$ | 47,224 | 8.00 | % | 47,627 | 8.00 | % | 47,701 | 8.00 | % | 47,776 | 8.00 | % | 47,862 | 8.00 | % | ||||||||||||||||||||||||
|
|
|
|
|
|
|
|
|
|
|
|
|
|
|
|
|
|
|
|
|
|||||||||||||||||||||
| Excess |
$ | 52,579 | 8.91 | % | $ | 70,398 | 11.82 | % | $ | 73,761 | 12.37 | % | $ | 77,124 | 12.91 | % | $ | 80,990 | 13.54 | % | ||||||||||||||||||||
|
|
|
|
|
|
|
|
|
|
|
|
|
|
|
|
|
|
|
|
|
|||||||||||||||||||||
| Total risk-based capital(4) |
$ | 107,219 | 18.16 | % | $ | 125,441 | 21.07 | % | $ | 128,878 | 21.61 | % | $ | 132,316 | 22.16 | % | $ | 136,268 | 22.78 | % | ||||||||||||||||||||
| Total risk-based requirement |
$ | 59,029 | 10.00 | % | $ | 59,533 | 10.00 | % | $ | 59,627 | 10.00 | % | $ | 59,720 | 10.00 | % | $ | 59,828 | 10.00 | % | ||||||||||||||||||||
|
|
|
|
|
|
|
|
|
|
|
|
|
|
|
|
|
|
|
|
|
|||||||||||||||||||||
| Excess |
$ | 48,190 | 8.16 | % | $ | 65,908 | 11.07 | % | $ | 69,251 | 11.61 | % | $ | 72,596 | 12.16 | % | $ | 76,440 | 12.78 | % | ||||||||||||||||||||
|
|
|
|
|
|
|
|
|
|
|
|
|
|
|
|
|
|
|
|
|
|||||||||||||||||||||
| Common equity tier 1 risk-based capital(4) |
$ | 99,803 | 16.91 | % | $ | 118,025 | 19.82 | % | $ | 121,462 | 20.37 | % | $ | 124,900 | 20.91 | % | $ | 128,852 | 21.54 | % | ||||||||||||||||||||
| Common equity tier 1 risk-based requirement |
38,369 | 6.50 | % | 38,697 | 6.50 | % | 38,757 | 6.50 | % | 38,818 | 6.50 | % | 38,888 | 6.50 | % | |||||||||||||||||||||||||
|
|
|
|
|
|
|
|
|
|
|
|
|
|
|
|
|
|
|
|
|
|||||||||||||||||||||
| Excess |
$ | 61,434 | 10.41 | % | $ | 79,328 | 13.32 | % | $ | 82,705 | 13.87 | % | $ | 86,082 | 14.41 | % | $ | 89,964 | 15.04 | % | ||||||||||||||||||||
|
|
|
|
|
|
|
|
|
|
|
|
|
|
|
|
|
|
|
|
|
|||||||||||||||||||||
| Reconciliation of capital infused into Ponce Bank: |
||||||||||||||||||||||||||||||||||||||||
| Net offering proceeds to Ponce Bank |
$ | 25,400 | $ | 30,068 | $ | 34,737 | $ | 40,106 | ||||||||||||||||||||||||||||||||
| Less: Common stock acquired by employee stock ownership plan |
(4,652 | ) | (5,473 | ) | (6,293 | ) | (7,238 | ) | ||||||||||||||||||||||||||||||||
| Less: Common stock acquired by stock-based benefit plans |
(2,326 | ) | (2,736 | ) | (3,147 | ) | (3,619 | ) | ||||||||||||||||||||||||||||||||
| Less: Assets retained by Ponce Bank Mutual Holding Company adjustment |
(200 | ) | (200 | ) | (200 | ) | (200 | ) | ||||||||||||||||||||||||||||||||
|
|
|
|
|
|
|
|
|
|||||||||||||||||||||||||||||||||
| Pro forma increase |
$ | 18,222 | $ | 21,659 | $ | 25,097 | $ | 29,049 | ||||||||||||||||||||||||||||||||
| (1) | Pro forma capital levels assume that the employee stock ownership plan purchases 3.92% of our total outstanding shares (including shares issued to Ponce Bank Mutual Holding Company and our charitable foundation) with funds we lend and that one or more stock-based benefit plans purchases 1.96% of our total outstanding shares (including shares issued to Ponce Bank Mutual Holding Company and our charitable foundation) for restricted stock awards. Pro forma capital calculated under generally accepted accounting principles (“GAAP”) and regulatory capital have been reduced by the amount required to fund these plans. See “Management - Employee Stock Ownership Plan”. |
| (2) | As adjusted to give effect to an increase in the number of shares, which could occur due to a 15% increase in the offering range to reflect demand for the shares or changes in market conditions following the commencement of the offering. |
| (3) | Tier 1 leverage capital levels are shown as a percentage of total adjusted assets. Risk-based capital levels are shown as a percentage of risk-weighted assets. |
| (4) | Pro forma amounts and percentages assume net proceeds are invested in assets that carry a 20% risk weighting. |
| Source: | Ponce Bank’s prospectus. |
EXHIBIT IV-7
Ponce Bank
Pro Forma Analysis Sheet – Fully Converted Basis
Exhibit IV-7
PRO FORMA ANALYSIS SHEET - FULLY CONVERTED BASIS
Ponce Bank
Prices as of May 5, 2017
| Peer Group | New York Companies | All Publicly-Traded | ||||||||||||||||||||||||||||||||
| Price Multiple |
Symbol | Subject (1) | Average | Median | Average | Median | Average | Median | ||||||||||||||||||||||||||
| Price-earnings ratio (x) |
P/E | 200.51 | x | 20.41x | 19.64x | 20.10x | 18.00x | 20.24x | 18.96x | |||||||||||||||||||||||||
| Price-core earnings ratio (x) |
P/Core | 200.51 | x | 20.02x | 20.31x | 17.24x | 17.44x | 20.83x | 20.11x | |||||||||||||||||||||||||
| Price-book ratio (%) |
= | P/B | 67.07 | % | 116.81 | % | 121.33 | % | 137.75 | % | 123.67 | % | 131.15 | % | 126.65 | % | ||||||||||||||||||
| Price-tangible book ratio (%) |
= | P/TB | 67.07 | % | 125.10 | % | 121.50 | % | 157.37 | % | 168.51 | % | 145.09 | % | 130.77 | % | ||||||||||||||||||
| Price-assets ratio (%) |
= | P/A | 15.50 | % | 14.11 | % | 12.88 | % | 10.27 | % | 10.48 | % | 15.96 | % | 16.06 | % | ||||||||||||||||||
Valuation Parameters
| Pre-Conversion Earnings (Y)(2) |
$ | 1,159,000 | ESOP Stock Purchases (E) | 8.00 | % (6) | |||||
| Pre-Conversion Earnings (CY)(2) |
$ | 1,159,000 | Cost of ESOP Borrowings (S) | 0.00 | % (5) | |||||
| Pre-Conversion Book Value (B)(2) |
$ | 91,835,000 | ESOP Amortization (T) | 15.00 | years | |||||
| Pre-Conv. Tang. Book Val. (TB)(2) |
$ | 91,832,000 | RRP Amount (M) | 4.00 | % | |||||
| Pre-Conversion Assets (A)(2) |
$ | 784,614,000 | RRP Vesting (N) | 5.00 | years (6) | |||||
| Reinvestment Rate (3)(R) |
1.93 | % | Foundation (F) | 3.56 | % | |||||
| Est. Conversion Expenses (4)(X) |
2.50 | % | Tax Benefit (Z) | 1,634,390 | ||||||
| Tax Rate (TAX) |
34.00 | % | Percentage Sold (PCT) | 100.00 | % | |||||
| Shares Tax |
$ | 0 | Option (O1) | 10.00 | % (7) | |||||
| Estimated Option Value (O2) | 27.20 | % (7) | ||||||||
| Option vesting (O3) | 5.00 | (7) | ||||||||
| Option pct taxable (O4) | 25.00 | % (7) |
Calculation of Pro Forma Value After Conversion
| 1. V= | P/E * (Y) |
V= | $139,607,030 | |||||
| 1 - P/E * PCT * ((1-X-E-M-F)*R*(1-TAX) - (1-TAX)*E/T - (1-TAX)*M/N) - (1-(TAX*O4))*(O1*O2)/O3) | ||||||||
| 2. V= | P/Core * (Y) |
V= | $139,607,030 | |||||
| 1 - P/core * PCT * ((1-X-E-M-F)*R*(1-TAX) - (1-TAX)*E/T - (1-TAX)*M/N) - (1-(TAX*O4))*(O1*O2)/O3) | ||||||||
| 3. V= | P/B * (B+Z) |
V= | $139,607,030 | |||||
| 1 - P/B * PCT * (1-X-E-M-F) | ||||||||
| 4. V= | P/TB * (TB+Z) |
V= | $139,607,030 | |||||
| 1 - P/TB * PCT * (1-X-E-M-F) | ||||||||
| 5. V= | P/A * (A+Z) |
V= | $139,607,030 | |||||
| 1 - P/A * PCT * (1-X-E-M-F) | ||||||||
| Conclusion |
Shares Issued To the Public |
Price Per Share |
Gross Offering Proceeds |
Shares Issued To Foundation |
Total Shares Issued |
Aggregate Market Value of Shares Issued |
||||||||||||||||||
| Supermaximum |
17,853,750 | 10.00 | $ | 178,537,500 | 609,279 | 18,463,029 | $ | 184,630,290 | ||||||||||||||||
| Maximum |
15,525,000 | 10.00 | 155,250,000 | 529,808 | 16,054,808 | 160,548,080 | ||||||||||||||||||
| Midpoint |
13,500,000 | 10.00 | 135,000,000 | 460,703 | 13,960,703 | 139,607,030 | ||||||||||||||||||
| Minimum |
11,475,000 | 10.00 | 114,750,000 | 391,598 | 11,866,598 | 118,665,980 | ||||||||||||||||||
| (1) | Pricing ratios shown reflect the midpoint value. |
| (2) | Adjusted for $1.6 million expense of funding termination of pension plan. |
| (3) | Net return reflects a reinvestment rate of 1.93 percent and a tax rate of 34.0 percent. |
| (4) | Offering expenses shown at estimated midpoint value. |
| (5) | No cost is applicable since holding company will fund the ESOP loan. |
| (6) | ESOP and MRP amortize over 15 years and 5 years, respectively; amortization expenses tax effected at 34.0 percent. |
| (7) | 10 percent option plan with an estimated Black-Scholes valuation of 2.72 percent of the exercise price, including a 5 year vesting with 25 percent of the options (granted to directors) tax effected at 34.0 percent. |
EXHIBIT IV-8
Ponce Bank
Pro Forma Effect of Conversion Proceeds – Fully Converted Basis
Exhibit IV-8
PRO FORMA EFFECT OF CONVERSION PROCEEDS
Ponce Bank
At the Minimum
| 1. |
Pro Forma Market Capitalization |
$ | 118,665,980 | |||||||||||||||
| Less: Foundation Shares |
3,915,980 | |||||||||||||||||
|
|
|
|||||||||||||||||
| 2. |
Offering Proceeds |
$ | 114,750,000 | |||||||||||||||
| Less: Estimated Offering Expenses |
2,868,750 | |||||||||||||||||
|
|
|
|||||||||||||||||
| Net Conversion Proceeds |
$ | 111,881,250 | ||||||||||||||||
| 3. |
Estimated Additional Income from Conversion Proceeds |
|||||||||||||||||
| Net Conversion Proceeds |
$ | 111,881,250 | ||||||||||||||||
| Less: Cash Contribution to Foundation |
200,000 | |||||||||||||||||
| Less: Non-Cash Stock Purchases (1) |
14,239,918 | |||||||||||||||||
|
|
|
|||||||||||||||||
| Net Proceeds Reinvested |
$ | 97,441,332 | ||||||||||||||||
| Estimated net incremental rate of return |
1.27 | % | ||||||||||||||||
|
|
|
|||||||||||||||||
| Reinvestment Income |
$ | 1,241,208 | ||||||||||||||||
| Less: Shares Tax |
0 | |||||||||||||||||
| Less: Estimated cost of ESOP borrowings (2) |
0 | |||||||||||||||||
| Less: Amortization of ESOP borrowings (3) |
417,704 | |||||||||||||||||
| Less: Amortization of Options (4) |
590,672 | |||||||||||||||||
| Less: Recognition Plan Vesting (5) |
626,556 | |||||||||||||||||
|
|
|
|||||||||||||||||
| Net Earnings Impact |
($ | 393,725 | ) | |||||||||||||||
| Before Conversion |
Net Earnings Increase |
After Conversion |
||||||||||||||||
| 4. | Pro Forma Earnings | |||||||||||||||||
| 12 Months ended March 31, 2017 (reported) | $ | 1,159,000 | ($ | 393,725 | ) | $ | 765,275 | |||||||||||
| 12 Months ended March 31, 2017 (core) | $ | 1,159,000 | ($ | 393,725 | ) | $ | 765,275 | |||||||||||
| Before Conversion |
Net Cash Proceeds |
Tax Benefit Of Contribution |
After Conversion |
|||||||||||||||
| 5. | Pro Forma Net Worth | |||||||||||||||||
| March 31, 2017 |
$ | 91,835,000 | $ | 97,441,332 | $ | 1,399,433 | $ | 190,675,766 | ||||||||||
| March 31, 2017 (Tangible) | $ | 91,832,000 | $ | 97,441,332 | $ | 1,399,433 | $ | 190,672,766 | ||||||||||
| Before Conversion |
Net Cash Proceeds |
Tax Benefit Of Contribution |
After Conversion |
|||||||||||||||
| 6. | Pro Forma Assets | |||||||||||||||||
| March 31, 2017 | $ | 784,614,000 | $ | 97,441,332 | $ | 1,399,433 | $ | 883,454,766 | ||||||||||
| (1) | Includes ESOP and RRP stock purchases equal to 8.0 and 4.0 percent of total shares issued, respectively. |
| (2) | ESOP stock purchases are internally financed by a loan from the holding company. |
| (3) | ESOP borrowings are amortized over 15 years, amortization expense is tax-effected at a 34.0 percent rate. |
| (4) | Option valuation based on Black-Scholes model, 5 year vesting, and assumes 25 percent is taxable. |
| (5) | RRP is amortized over 5 years, and amortization expense is tax effected at 34.0 percent. |
Exhibit IV-8
PRO FORMA EFFECT OF CONVERSION PROCEEDS
Ponce Bank
At the Midpoint
| 1. |
Pro Forma Market Capitalization |
$ | 139,607,030 | |||||||||||||||
| Less: Foundation Shares |
4,607,030 | |||||||||||||||||
|
|
|
|||||||||||||||||
| 2. |
Offering Proceeds |
$ | 135,000,000 | |||||||||||||||
| Less: Estimated Offering Expenses |
3,375,000 | |||||||||||||||||
|
|
|
|||||||||||||||||
| Net Conversion Proceeds |
$ | 131,625,000 | ||||||||||||||||
| 3. |
Estimated Additional Income from Conversion Proceeds |
|||||||||||||||||
| Net Conversion Proceeds |
$ | 131,625,000 | ||||||||||||||||
| Less: Cash Contribution to Foundation |
200,000 | |||||||||||||||||
| Less: Non-Cash Stock Purchases (1) |
16,752,844 | |||||||||||||||||
|
|
|
|||||||||||||||||
| Net Proceeds Reinvested |
$ | 114,672,156 | ||||||||||||||||
| Estimated net incremental rate of return |
1.27 | % | ||||||||||||||||
|
|
|
|||||||||||||||||
| Reinvestment Income |
$ | 1,460,694 | ||||||||||||||||
| Less: Shares Tax |
0 | |||||||||||||||||
| Less: Estimated cost of ESOP borrowings (2) |
0 | |||||||||||||||||
| Less: Amortization of ESOP borrowings (3) |
491,417 | |||||||||||||||||
| Less: Amortization of Options (4) |
694,908 | |||||||||||||||||
| Less: Recognition Plan Vesting (5) |
737,125 | |||||||||||||||||
|
|
|
|||||||||||||||||
| Net Earnings Impact |
($ | 462,756 | ) | |||||||||||||||
| Before Conversion |
Net Earnings Increase |
After Conversion |
||||||||||||||||
| 4. | Pro Forma Earnings | |||||||||||||||||
| 12 Months ended March 31, 2017 (reported) | $ | 1,159,000 | ($ | 462,756 | ) | $ | 696,244 | |||||||||||
| 12 Months ended March 31, 2017 (core) | $ | 1,159,000 | ($ | 462,756 | ) | $ | 696,244 | |||||||||||
| Before Conversion |
Net Cash Proceeds |
Tax Benefit Of Contribution |
After Conversion |
|||||||||||||||
| 5. | Pro Forma Net Worth | |||||||||||||||||
| March 31, 2017 |
$ | 91,835,000 | $ | 114,672,156 | $ | 1,634,390 | $ | 208,141,547 | ||||||||||
| March 31, 2017 (Tangible) |
$ | 91,832,000 | $ | 114,672,156 | $ | 1,634,390 | $ | 208,138,547 | ||||||||||
| Before Conversion |
Net Cash Proceeds |
Tax Benefit Of Contribution |
After Conversion |
|||||||||||||||
| 6. | Pro Forma Assets | |||||||||||||||||
| March 31, 2017 |
$ | 784,614,000 | $ | 114,672,156 | $ | 1,634,390 | $ | 900,920,547 | ||||||||||
| (1) | Includes ESOP and RRP stock purchases equal to 8.0 and 4.0 percent of total shares issued, respectively. |
| (2) | ESOP stock purchases are internally financed by a loan from the holding company. |
| (3) | ESOP borrowings are amortized over 15 years, amortization expense is tax-effected at a 34.0 percent rate. |
| (4) | Option valuation based on Black-Scholes model, 5 year vesting, and assumes 25 percent is taxable. |
| (5) | RRP is amortized over 5 years, and amortization expense is tax effected at 34.0 percent. |
Exhibit IV-8
PRO FORMA EFFECT OF CONVERSION PROCEEDS
Ponce Bank
At the Maximum Value
| 1. |
Pro Forma Market Capitalization |
$ | 160,548,080 | |||||||||||||||
| Less: Foundation Shares |
5,298,080 | |||||||||||||||||
|
|
|
|||||||||||||||||
| 2. |
Offering Proceeds |
$ | 155,250,000 | |||||||||||||||
| Less: Estimated Offering Expenses |
3,881,250 | |||||||||||||||||
|
|
|
|||||||||||||||||
| Net Conversion Proceeds |
$ | 151,368,750 | ||||||||||||||||
| 3. |
Estimated Additional Income from Conversion Proceeds |
|||||||||||||||||
| Net Conversion Proceeds |
$ | 151,368,750 | ||||||||||||||||
| Less: Cash Contribution to Foundation |
200,000 | |||||||||||||||||
| Less: Non-Cash Stock Purchases (1) |
19,265,770 | |||||||||||||||||
|
|
|
|||||||||||||||||
| Net Proceeds Reinvested |
$ | 131,902,980 | ||||||||||||||||
| Estimated net incremental rate of return |
1.27 | % | ||||||||||||||||
|
|
|
|||||||||||||||||
| Reinvestment Income |
$ | 1,680,180 | ||||||||||||||||
| Less: Shares Tax |
0 | |||||||||||||||||
| Less: Estimated cost of ESOP borrowings (2) |
0 | |||||||||||||||||
| Less: Amortization of ESOP borrowings (3) |
565,129 | |||||||||||||||||
| Less: Amortization of Options (4) |
799,144 | |||||||||||||||||
| Less: Recognition Plan Vesting (5) |
847,694 | |||||||||||||||||
|
|
|
|||||||||||||||||
| Net Earnings Impact |
($ | 531,787 | ) | |||||||||||||||
| Before Conversion |
Net Earnings Increase |
After Conversion |
||||||||||||||||
| 4. | Pro Forma Earnings | |||||||||||||||||
| 12 Months ended March 31, 2017 (reported) |
$ | 1,159,000 | ($ | 531,787 | ) | $ | 627,213 | |||||||||||
| 12 Months ended March 31, 2017 (core) |
$ | 1,159,000 | ($ | 531,787 | ) | $ | 627,213 | |||||||||||
| Before Conversion |
Net Cash Proceeds |
Tax Benefit Of Contribution |
After Conversion |
|||||||||||||||
| 5. | Pro Forma Net Worth | |||||||||||||||||
| March 31, 2017 |
$ | 91,835,000 | $ | 131,902,980 | $ | 1,869,347 | $ | 225,607,328 | ||||||||||
| March 31, 2017 (Tangible) |
$ | 91,832,000 | $ | 131,902,980 | $ | 1,869,347 | $ | 225,604,328 | ||||||||||
| Before Conversion |
Net Cash Proceeds |
Tax Benefit Of Contribution |
After Conversion |
|||||||||||||||
| 6. | Pro Forma Assets | |||||||||||||||||
| March 31, 2017 |
$ | 784,614,000 | $ | 131,902,980 | $ | 1,869,347 | $ | 918,386,328 | ||||||||||
| (1) | Includes ESOP and RRP stock purchases equal to 8.0 and 4.0 percent of total shares issued, respectively. |
| (2) | ESOP stock purchases are internally financed by a loan from the holding company. |
| (3) | ESOP borrowings are amortized over 15 years, amortization expense is tax-effected at a 34.0 percent rate. |
| (4) | Option valuation based on Black-Scholes model, 5 year vesting, and assumes 25 percent is taxable. |
| (5) | RRP is amortized over 5 years, and amortization expense is tax effected at 34.0 percent. |
Exhibit IV-8
PRO FORMA EFFECT OF CONVERSION PROCEEDS
Ponce Bank
At the Super Maximum Value
| 1. |
Pro Forma Market Capitalization |
$ | 184,630,290 | |||||||||||||||
| Less: Foundation Shares |
6,092,790 | |||||||||||||||||
|
|
|
|||||||||||||||||
| 2. |
Offering Proceeds |
$ | 178,537,500 | |||||||||||||||
| Less: Estimated Offering Expenses |
4,463,438 | |||||||||||||||||
|
|
|
|||||||||||||||||
| Net Conversion Proceeds |
$ | 174,074,063 | ||||||||||||||||
| 3. |
Estimated Additional Income from Conversion Proceeds |
|||||||||||||||||
| Net Conversion Proceeds |
$ | 174,074,063 | ||||||||||||||||
| Less: Cash Contribution to Foundation |
200,000 | |||||||||||||||||
| Less: Non-Cash Stock Purchases (1) |
22,155,635 | |||||||||||||||||
|
|
|
|||||||||||||||||
| Net Proceeds Reinvested |
$ | 151,718,428 | ||||||||||||||||
| Estimated net incremental rate of return |
1.27 | % | ||||||||||||||||
|
|
|
|||||||||||||||||
| Reinvestment Income |
$ | 1,932,589 | ||||||||||||||||
| Less: Shares Tax |
0 | |||||||||||||||||
| Less: Estimated cost of ESOP borrowings (2) |
0 | |||||||||||||||||
| Less: Amortization of ESOP borrowings (3) |
649,899 | |||||||||||||||||
| Less: Amortization of Options (4) |
919,016 | |||||||||||||||||
| Less: Recognition Plan Vesting (5) |
974,848 | |||||||||||||||||
|
|
|
|||||||||||||||||
| Net Earnings Impact |
($ | 611,173 | ) | |||||||||||||||
| Before Conversion |
Net Earnings Increase |
After Conversion |
||||||||||||||||
| 4. | Pro Forma Earnings | |||||||||||||||||
| 12 Months ended March 31, 2017 (reported) |
$ | 1,159,000 | ($ | 611,173 | ) | $ | 547,827 | |||||||||||
| 12 Months ended March 31, 2017 (core) |
$ | 1,159,000 | ($ | 611,173 | ) | $ | 547,827 | |||||||||||
| Before Conversion |
Net Cash Proceeds |
Tax Benefit Of Contribution |
After Conversion |
|||||||||||||||
| 5. | Pro Forma Net Worth | |||||||||||||||||
| March 31, 2017 |
$ | 91,835,000 | $ | 151,718,428 | $ | 2,139,549 | $ | 245,692,976 | ||||||||||
| March 31, 2017 (Tangible) |
$ | 91,832,000 | $ | 151,718,428 | $ | 2,139,549 | $ | 245,689,976 | ||||||||||
| Before Conversion |
Net Cash Proceeds |
Tax Benefit Of Contribution |
After Conversion |
|||||||||||||||
| 6. | Pro Forma Assets | |||||||||||||||||
| March 31, 2017 |
$ | 784,614,000 | $ | 151,718,428 | $ | 2,139,549 | $ | 938,471,976 | ||||||||||
| (1) | Includes ESOP and RRP stock purchases equal to 8.0 and 4.0 percent of total shares issued, respectively. |
| (2) | ESOP stock purchases are internally financed by a loan from the holding company. |
| (3) | ESOP borrowings are amortized over 15 years, amortization expense is tax-effected at a 34.0 percent rate. |
| (4) | Option valuation based on Black-Scholes model, 5 year vesting, and assumes 25 percent is taxable. |
| (5) | RRP is amortized over 5 years, and amortization expense is tax effected at 34.0 percent. |
EXHIBIT IV-9
Ponce Bank
Pro Forma Analysis Sheet – Minority Stock Offering
EXHIBIT IV-9
PRO FORMA ANALYSIS SHEET - MINORITY STOCK OFFERING
Ponce Bank
May 5, 2017
| Peer Group | New York Companies | All Publicly-Traded | ||||||||||||||||||||||||||||||||
| Price Multiple |
Symbol | Subject (1) | Average | Median | Average | Median | Average | Median | ||||||||||||||||||||||||||
| Price-earnings ratio (x) |
P/E | 162.59 | x | 20.41x | 19.64x | 20.10x | 18.00x | 20.24x | 18.96x | |||||||||||||||||||||||||
| Price-core earnings ratio (x) |
P/Core | 162.59 | x | 20.02x | 20.31x | 17.24x | 17.44x | 20.83x | 20.11x | |||||||||||||||||||||||||
| Price-book ratio (%) |
= | P/B | 96.34 | % | 116.81 | % | 121.33 | % | 137.75 | % | 123.67 | % | 131.15 | % | 126.65 | % | ||||||||||||||||||
| Price-tangible book ratio (%) |
= | P/TB | 96.34 | % | 125.10 | % | 121.50 | % | 157.37 | % | 168.51 | % | 145.09 | % | 130.77 | % | ||||||||||||||||||
| Price-assets ratio (%) |
= | P/A | 16.66 | % | 14.11 | % | 12.88 | % | 10.27 | % | 10.48 | % | 15.96 | % | 16.06 | % | ||||||||||||||||||
Valuation Parameters
| Pre-Conversion Earnings (Y)(2) |
$ | 1,156,000 | ESOP Stock Purchases (E) |
8.12 | % (6) | |||||||
| Pre-Conversion Earnings (CY)(2) |
$ | 1,156,000 | Cost of ESOP Borrowings (S) |
0.00 | % (5) | |||||||
| Pre-Conversion Book Value (B)(2) |
$ | 91,635,000 | ESOP Amortization (T) |
15.00 | years | |||||||
| Pre-Conv. Tang. Book Value (TB)(2) |
$ | 91,632,000 | MRP Amount (M) |
4.06 | % | |||||||
| Pre-Conversion Assets (A)(2) |
$ | 784,414,000 | MRP Vesting (N) |
5.00 | years (6) | |||||||
| Reinvestment Rate (3)(R) |
1.93 | % | Foundation (F) |
7.33 | % | |||||||
| Est. Conversion Expenses (4)(X) |
4.28 | % | Tax Benefit (Z) |
1,634,390 | ||||||||
| Tax Rate (TAX) |
34.00 | % | Percentage Sold (PCT) |
48.30 | % | |||||||
| Option (O1) |
10.14 | % (7) | ||||||||||
| Estimated Option Value (O2) |
28.30 | % (7) | ||||||||||
| Option vesting (O3) |
5.00 | (7) | ||||||||||
| Option pct taxable (O4) |
25.00 | % (7) | ||||||||||
Calculation of Pro Forma Value After Conversion
| 1. V= | P/E * (Y) |
V= | $139,607,030 | |||||
| 1 - P/E * PCT * ((1-X-E-M-F)*R*(1-TAX) - (1-TAX)*E/T - (1-TAX)*M/N) - (1-(TAX*O4))*(O1*O2)/O3) | ||||||||
| 2. V= | P/Core * (Y) |
V= | $139,607,030 | |||||
| 1 - P/core * PCT * ((1-X-E-M-F)*R*(1-TAX) - (1-TAX)*E/T - (1-TAX)*M/N) - (1-(TAX*O4))*(O1*O2)/O3) | ||||||||
| 3. V= | P/B * (B+Z) |
V= | $139,607,030 | |||||
| 1 - P/B * PCT * (1-X-E-M-F) | ||||||||
| 4. V= | P/TB * (TB+Z) |
V= | $139,607,030 | |||||
| 1 - P/TB * PCT * (1-X-E-M-F) | ||||||||
| 5. V= | P/A * (A+Z) |
V= | $139,607,030 | |||||
| 1 - P/A * PCT * (1-X-E-M-F) | ||||||||
| Conclusion |
Shares Owned by The MHC |
Shares Issued To the Public |
Price Per Share |
Gross Offering Proceeds |
Shares Issued to Foundation |
Total Shares Issued Publicly |
Aggregate Market Value of Shares Issued Publicly |
Full Value Total Shares |
||||||||||||||||||||||||
| Super Maximum |
9,545,388 | 8,308,362 | 10.00 | $ | 83,083,620 | 609,279 | 8,917,641 | $ | 89,176,410 | 18,463,029 | ||||||||||||||||||||||
| Maximum |
8,300,337 | 7,224,663 | 10.00 | $ | 72,246,630 | 529,808 | 7,754,471 | 77,544,710 | 16,054,808 | |||||||||||||||||||||||
| Midpoint |
7,217,684 | 6,282,316 | 10.00 | $ | 62,823,160 | 460,703 | 6,743,019 | 67,430,190 | 13,960,703 | |||||||||||||||||||||||
| Minimum |
6,135,031 | 5,339,969 | 10.00 | $ | 53,399,690 | 391,598 | 5,731,567 | 57,315,670 | 11,866,598 | |||||||||||||||||||||||
| (1) | Pricing ratios shown reflect the midpoint value. |
| (2) | Adjusted for capitalizing MHC with $200,000 and $1.6 million expense of funding termination of pension plan. |
| (3) | Net return reflects a reinvestment rate of 1.93 percent, and a tax rate of 34.0 percent. |
| (4) | Offering expenses shown at estimated midpoint value. |
| (5) | No cost is applicable since holding company will fund the ESOP loan. |
| (6) | ESOP and MRP amortize over 15 years and 5 years, respectively; amortization expenses tax effected at 34.0 percent. |
| (7) | 10 percent option plan with an estimated Black-Scholes valuation of 28.30 percent of the exercise price, including a 5 year vesting with 25 percent of the options (granted to directors) tax effected at 34.0 percent. |
EXHIBIT IV-10
Ponce Bank
Pro Forma Effect of Conversion Proceeds – Minority Stock Offering
Exhibit IV-10
PRO FORMA EFFECT OF CONVERSION PROCEEDS
Ponce Bank
At the Minimum
| 1. |
Pro Forma Market Capitalization |
$ | 57,315,670 | |||||||||||||||
| Less: Foundation Shares |
3,915,980 | |||||||||||||||||
|
|
|
|||||||||||||||||
| 2. |
Offering Proceeds |
$ | 53,399,690 | |||||||||||||||
| Less: Estimated Offering Expenses |
2,600,713 | |||||||||||||||||
|
|
|
|||||||||||||||||
| Net Conversion Proceeds |
$ | 50,798,977 | ||||||||||||||||
| 3. |
Estimated Additional Income from Conversion Proceeds |
|||||||||||||||||
| Net Conversion Proceeds |
$ | 50,798,977 | ||||||||||||||||
| Less: Cash Contribution to Foundation |
200,000 | |||||||||||||||||
| Less: Non-Cash Stock Purchases (1) |
6,977,566 | |||||||||||||||||
|
|
|
|||||||||||||||||
| Net Proceeds Reinvested |
$ | 43,621,411 | ||||||||||||||||
| Estimated net incremental rate of return |
1.27 | % | ||||||||||||||||
|
|
|
|||||||||||||||||
| Reinvestment Income |
$ | 555,650 | ||||||||||||||||
| Less: Estimated cost of ESOP borrowings (2) |
0 | |||||||||||||||||
| Less: Amortization of ESOP borrowings (3) |
204,675 | |||||||||||||||||
| Less: Amortization of Options (4) |
301,134 | |||||||||||||||||
| Less: Recognition Plan Vesting (5) |
307,013 | |||||||||||||||||
|
|
|
|||||||||||||||||
| Net Earnings Impact |
($ | 257,173 | ) | |||||||||||||||
| Before Conversion |
Net Earnings Increase |
After Conversion |
||||||||||||||||
| 4. |
Pro Forma Earnings | |||||||||||||||||
| 12 Months ended March 31, 2017 (reported) |
$ | 1,156,000 | ($ | 257,173 | ) | $ | 898,827 | |||||||||||
| 12 Months ended March 31, 2017 (core) |
$ | 1,156,000 | ($ | 257,173 | ) | $ | 898,827 | |||||||||||
| Before Conversion |
Net Cash Proceeds |
Tax Benefit Of Contribution |
After Conversion |
|||||||||||||||
| 5. |
Pro Forma Net Worth | |||||||||||||||||
| March 31, 2017 |
$ | 91,635,000 | $ | 43,621,411 | $ | 1,399,433 | $ | 136,655,844 | ||||||||||
| March 31, 2017 (Tangible) |
$ | 91,632,000 | $ | 43,621,411 | $ | 1,399,433 | $ | 136,652,844 | ||||||||||
| Before Conversion |
Net Cash Proceeds |
Tax Benefit Of Contribution |
After Conversion |
|||||||||||||||
| 6. |
Pro Forma Assets | |||||||||||||||||
| March 31, 2017 |
$ | 784,414,000 | $ | 43,621,411 | $ | 1,399,433 | $ | 829,434,844 | ||||||||||
| (1) | Includes ESOP and MRP stock purchases equal to 8.12 percent and 4.06 percent of the public shares, respectively. |
| (2) | ESOP stock purchases are internally financed by a loan from the holding company. |
| (3) | ESOP borrowings are amortized over 15 years, amortization expense is tax-effected at a 34.0 percent rate. |
| (4) | Option valuation based on Black-Scholes model, 5 year vesting, and assuming 25 percent taxable. |
| (5) | MRP is amortized over 5 years, and amortization expense is tax effected at 34.0 percent. |
Exhibit IV-10
PRO FORMA EFFECT OF CONVERSION PROCEEDS
Ponce Bank
At the Midpoint
| 1. |
Pro Forma Market Capitalization |
$ | 67,430,190 | |||||||||||||||
| Less: Foundation Shares |
4,607,030 | |||||||||||||||||
|
|
|
|||||||||||||||||
| 2. |
Offering Proceeds |
$ | 62,823,160 | |||||||||||||||
| Less: Estimated Offering Expenses |
2,686,739 | |||||||||||||||||
|
|
|
|||||||||||||||||
| Net Conversion Proceeds |
$ | 60,136,421 | ||||||||||||||||
| 3. |
Estimated Additional Income from Conversion Proceeds |
|||||||||||||||||
| Net Conversion Proceeds |
$ | 60,136,421 | ||||||||||||||||
| Less: Cash Contribution to Foundation |
200,000 | |||||||||||||||||
| Less: Non-Cash Stock Purchases (1) |
8,208,900 | |||||||||||||||||
|
|
|
|||||||||||||||||
| Net Proceeds Reinvested |
$ | 51,727,521 | ||||||||||||||||
| Estimated net incremental rate of return |
1.27 | % | ||||||||||||||||
|
|
|
|||||||||||||||||
| Reinvestment Income |
$ | 658,905 | ||||||||||||||||
| Less: Estimated cost of ESOP borrowings (2) |
0 | |||||||||||||||||
| Less: Amortization of ESOP borrowings (3) |
240,794 | |||||||||||||||||
| Less: Amortization of Options (4) |
354,275 | |||||||||||||||||
| Less: Recognition Plan Vesting (5) |
361,192 | |||||||||||||||||
|
|
|
|||||||||||||||||
| Net Earnings Impact |
($ | 297,356 | ) | |||||||||||||||
| Before Conversion |
Net Earnings Increase |
After Conversion |
||||||||||||||||
| 4. |
Pro Forma Earnings | |||||||||||||||||
| 12 Months ended March 31, 2017 (reported) |
$ | 1,156,000 | ($ | 297,356 | ) | $ | 858,644 | |||||||||||
| 12 Months ended March 31, 2017 (core) |
$ | 1,156,000 | ($ | 297,356 | ) | $ | 858,644 | |||||||||||
| Before Conversion |
Net Cash Proceeds |
Tax Benefit Of Contribution |
After Conversion |
|||||||||||||||
| 5. |
Pro Forma Net Worth | |||||||||||||||||
| March 31, 2017 |
$ | 91,635,000 | $ | 51,727,521 | $ | 1,634,390 | $ | 144,996,911 | ||||||||||
| March 31, 2017 (Tangible) |
$ | 91,632,000 | $ | 51,727,521 | $ | 1,634,390 | $ | 144,993,911 | ||||||||||
| Before Conversion |
Net Cash Proceeds |
Tax Benefit Of Contribution |
After Conversion |
|||||||||||||||
| 6. |
Pro Forma Assets | |||||||||||||||||
| March 31, 2017 |
$ | 784,414,000 | $ | 51,727,521 | $ | 1,634,390 | $ | 837,775,911 | ||||||||||
| (1) | Includes ESOP and MRP stock purchases equal to 8.12 percent and 4.06 percent of the public shares, respectively. |
| (2) | ESOP stock purchases are internally financed by a loan from the holding company. |
| (3) | ESOP borrowings are amortized over 15 years, amortization expense is tax-effected at a 34.0 percent rate. |
| (4) | Option valuation based on Black-Scholes model, 5 year vesting, and assuming 25 percent taxable. |
| (5) | MRP is amortized over 5 years, and amortization expense is tax effected at 34.0 percent. |
Exhibit IV-10
PRO FORMA EFFECT OF CONVERSION PROCEEDS
Ponce Bank
At the Maximum
| 1. |
Pro Forma Market Capitalization |
$ | 77,544,710 | |||||||||||||||
| Less: Foundation Shares |
5,298,080 | |||||||||||||||||
|
|
|
|||||||||||||||||
| 2. |
Offering Proceeds |
$ | 72,246,630 | |||||||||||||||
| Less: Estimated Offering Expenses |
2,772,764 | |||||||||||||||||
|
|
|
|||||||||||||||||
| Net Conversion Proceeds |
$ | 69,473,866 | ||||||||||||||||
| 3. |
Estimated Additional Income from Conversion Proceeds |
|||||||||||||||||
| Net Conversion Proceeds |
$ | 69,473,866 | ||||||||||||||||
| Less: Cash Contribution to Foundation |
200,000 | |||||||||||||||||
| Less: Non-Cash Stock Purchases (1) |
9,440,234 | |||||||||||||||||
|
|
|
|||||||||||||||||
| Net Proceeds Reinvested |
$ | 59,833,632 | ||||||||||||||||
| Estimated net incremental rate of return |
1.27 | % | ||||||||||||||||
|
|
|
|||||||||||||||||
| Reinvestment Income |
$ | 762,161 | ||||||||||||||||
| Less: Estimated cost of ESOP borrowings (2) |
0 | |||||||||||||||||
| Less: Amortization of ESOP borrowings (3) |
276,914 | |||||||||||||||||
| Less: Amortization of Options (4) |
407,417 | |||||||||||||||||
| Less: Recognition Plan Vesting (5) |
415,370 | |||||||||||||||||
|
|
|
|||||||||||||||||
| Net Earnings Impact |
($ | 337,540 | ) | |||||||||||||||
| Before Conversion |
Net Earnings Increase |
After Conversion |
||||||||||||||||
| 4. |
Pro Forma Earnings | |||||||||||||||||
| 12 Months ended March 31, 2017 (reported) |
$ | 1,156,000 | ($ | 337,540 | ) | $ | 818,460 | |||||||||||
| 12 Months ended March 31, 2017 (core) |
$ | 1,156,000 | ($ | 337,540 | ) | $ | 818,460 | |||||||||||
| Before Conversion |
Net Cash Proceeds |
Tax Benefit Of Contribution |
After Conversion |
|||||||||||||||
| 5. |
Pro Forma Net Worth | |||||||||||||||||
| March 31, 2017 |
$ | 91,635,000 | $ | 59,833,632 | $ | 1,869,347 | $ | 153,337,979 | ||||||||||
| March 31, 2017 (Tangible) |
$ | 91,632,000 | $ | 59,833,632 | $ | 1,869,347 | $ | 153,334,979 | ||||||||||
| Before Conversion |
Net Cash Proceeds |
Tax Benefit Of Contribution |
After Conversion |
|||||||||||||||
| 6. |
Pro Forma Assets | |||||||||||||||||
| March 31, 2017 |
$ | 784,414,000 | $ | 59,833,632 | $ | 1,869,347 | $ | 846,116,979 | ||||||||||
| (1) | Includes ESOP and MRP stock purchases equal to 8.12 percent and 4.06 percent of the public shares, respectively. |
| (2) | ESOP stock purchases are internally financed by a loan from the holding company. |
| (3) | ESOP borrowings are amortized over 15 years, amortization expense is tax-effected at a 34.0 percent rate. |
| (4) | Option valuation based on Black-Scholes model, 5 year vesting, and assuming 25 percent taxable. |
| (5) | MRP is amortized over 5 years, and amortization expense is tax effected at 34.0 percent. |
Exhibit IV-10
PRO FORMA EFFECT OF CONVERSION PROCEEDS
Ponce Bank
At the Super Maximum Value
| 1. |
Pro Forma Market Capitalization |
$ | 89,176,410 | |||||||||||||||
| Less: Foundation Shares |
6,092,790 | |||||||||||||||||
|
|
|
|||||||||||||||||
| 2. |
Offering Proceeds |
$ | 83,083,620 | |||||||||||||||
| Less: Estimated Offering Expenses |
2,871,694 | |||||||||||||||||
|
|
|
|||||||||||||||||
| Net Conversion Proceeds |
$ | 80,211,926 | ||||||||||||||||
| 3. |
Estimated Additional Income from Conversion Proceeds |
|||||||||||||||||
| Net Conversion Proceeds |
$ | 80,211,926 | ||||||||||||||||
| Less: Cash Contribution to Foundation |
200,000 | |||||||||||||||||
| Less: Non-Cash Stock Purchases (1) |
10,856,268 | |||||||||||||||||
|
|
|
|||||||||||||||||
| Net Proceeds Reinvested |
$ | 69,155,658 | ||||||||||||||||
| Estimated net incremental rate of return |
1.27 | % | ||||||||||||||||
|
|
|
|||||||||||||||||
| Reinvestment Income |
$ | 880,905 | ||||||||||||||||
| Less: Estimated cost of ESOP borrowings (2) |
0 | |||||||||||||||||
| Less: Amortization of ESOP borrowings (3) |
318,451 | |||||||||||||||||
| Less: Amortization of Options (4) |
468,529 | |||||||||||||||||
| Less: Recognition Plan Vesting (5) |
477,676 | |||||||||||||||||
|
|
|
|||||||||||||||||
| Net Earnings Impact |
($ | 383,751 | ) | |||||||||||||||
| Before Conversion |
Net Earnings Increase |
After Conversion |
||||||||||||||||
| 4. |
Pro Forma Earnings | |||||||||||||||||
| 12 Months ended March 31, 2017 (reported) |
$ | 1,156,000 | ($ | 383,751 | ) | $ | 772,249 | |||||||||||
| 12 Months ended March 31, 2017 (core) |
$ | 1,156,000 | ($ | 383,751 | ) | $ | 772,249 | |||||||||||
| Before Conversion |
Net Cash Proceeds |
Tax Benefit Of Contribution |
After Conversion |
|||||||||||||||
| 5. |
Pro Forma Net Worth | |||||||||||||||||
| March 31, 2017 |
$ | 91,635,000 | $ | 69,155,658 | $ | 2,139,549 | $ | 162,930,206 | ||||||||||
| March 31, 2017 (Tangible) |
$ | 91,632,000 | $ | 69,155,658 | $ | 2,139,549 | $ | 162,927,206 | ||||||||||
| Before Conversion |
Net Cash Proceeds |
Tax Benefit Of Contribution |
After Conversion |
|||||||||||||||
| 6. |
Pro Forma Assets | |||||||||||||||||
| March 31, 2017 |
$ | 784,414,000 | $ | 69,155,658 | $ | 2,139,549 | $ | 855,709,206 | ||||||||||
| (1) | Includes ESOP and MRP stock purchases equal to 8.12 percent and 4.06 percent of the public shares, respectively. |
| (2) | ESOP stock purchases are internally financed by a loan from the holding company. |
| (3) | ESOP borrowings are amortized over 15 years, amortization expense is tax-effected at a 34.0 percent rate. |
| (4) | Option valuation based on Black-Scholes model, 5 year vesting, and assuming 25 percent taxable. |
| (5) | MRP is amortized over 5 years, and amortization expense is tax effected at 34.0 percent. |
EXHIBIT V-1
RP® Financial, LC.
Firm Qualifications Statement

FIRM QUALIFICATION STATEMENT
RP® Financial (“RP®) provides financial and management consulting, merger advisory and valuation services to the financial services industry nationwide. We offer a broad array of services, high quality and prompt service, hands-on involvement by principals and senior staff, careful structuring of strategic initiatives and sophisticated valuation and other analyses consistent with industry practices and regulatory requirements. Our staff maintains extensive background in financial and management consulting, valuation and investment banking. Our clients include commercial banks, thrifts, credit unions, mortgage companies, insurance companies and other financial services companies.
STRATEGIC PLANNING SERVICES
RP®’s strategic planning services are designed to provide effective feasible plans with quantifiable results. We analyze strategic options to enhance shareholder value, achieve regulatory approval or realize other objectives. Such services involve conducting situation analyses; establishing mission/vision statements, developing strategic goals and objectives; and identifying strategies to enhance franchise and/or market value, capital management, earnings enhancement, operational matters and organizational issues. Strategic recommendations typically focus on: capital formation and management, asset/liability targets, profitability, return on equity and stock pricing. Our proprietary financial simulation models provide the basis for evaluating the impact of various strategies and assessing their feasibility and compatibility with regulations.
MERGER ADVISORY SERVICES
RP®’s merger advisory services include targeting potential buyers and sellers, assessing acquisition merit, conducting due diligence, negotiating and structuring merger transactions, preparing merger business plans and financial simulations, rendering fairness opinions, preparing mark-to-market analyses, valuing intangible assets and supporting the implementation of post-acquisition strategies. Our merger advisory services involve transactions of financially healthy companies and failed bank deals. RP® is also expert in de novo charters and shelf charters. Through financial simulations, comprehensive data bases, valuation proficiency and regulatory familiarity, RP®’s merger advisory services center on enhancing shareholder returns.
VALUATION SERVICES
RP®’s extensive valuation practice includes bank and thrift mergers, thrift mutual-to-stock conversions, goodwill impairment, insurance company demutualizations, ESOPs, subsidiary companies, merger accounting and other purposes. We are highly experienced in performing appraisals which conform to regulatory guidelines and appraisal standards. RP® is the nation’s leading valuation firm for thrift mutual-to-stock conversions, with appraised values ranging up to $4 billion.
OTHER CONSULTING SERVICES
RP® offers other consulting services including evaluating the impact of regulatory changes (TARP, etc.), branching and diversification strategies, feasibility studies and special research. We assist banks/thrifts in preparing CRA plans and evaluating wealth management activities on a de novo or merger basis. Our other consulting services are facilitated by proprietary valuation and financial simulation models.
KEY PERSONNEL (Years of Relevant Experience & Contact Information)
| Ronald S. Riggins, Managing Director (37) | (703) 647-6543 | rriggins@rpfinancial.com | ||
| William E. Pommerening, Managing Director (33) | (703) 647-6546 | wpommerening@rpfinancial.com | ||
| Marcus Faust, Managing Director (29) | (703) 647-6553 | mfaust@rpfinancial.com | ||
| Gregory E. Dunn, Director (34) | (703) 647-6548 | gdunn@rpfinancial.com | ||
| James P. Hennessey, Director (30) | (703) 647-6544 | jhennessey@rpfinancial.com | ||
| James J. Oren, Director (30) | (703) 647-6549 | joren@rpfinancial.com | ||
| Carla Pollard, Senior Vice President (27) | (703) 647-6556 | cpollard@rpfinancial.com |
| Washington Headquarters | ||
| Three Ballston Plaza | Telephone: (703) 528-1700 | |
| 1100 North Glebe Road, Suite 600 | Fax No.: (703) 528-1788 | |
| Arlington, VA 22201 | Toll-Free No.: (866) 723-0594 | |
| www.rpfinancial.com | E-Mail: mail@rpfinancial.com |