Attached files
| file | filename |
|---|---|
| 8-K - FORM 8-K - ICAHN ENTERPRISES L.P. | v467328_8k.htm |
Exhibit 99.1
Icahn Enterprises L.P. Investor Presentation May 2017
Forward - Looking Statements and Non - GAAP Financial Measures Forward - Looking Statements This presentation contains certain statements that are, or may be deemed to be, “forward - looking statements” within the meaning of Section 27 A of the Securities Act of 1933 , as amended, and Section 21 E of the Securities Exchange Act of 1934 , as amended . All statements included herein, other than statements that relate solely to historical fact, are “forward - looking statements . ” Such statements include, but are not limited to, any statement that may predict, forecast, indicate or imply future results, performance, achievements or events, or any statement that may relate to strategies, plans or objectives for, or potential results of, future operations, financial results, financial condition, business prospects, growth strategy or liquidity, and are based upon management’s current plans and beliefs or current estimates of future results or trends . Forward - looking statements can generally be identified by phrases such as “believes,” “expects,” “potential,” “continues,” “may,” “should,” “seeks,” “predicts,” “anticipates,” “intends,” “projects,” “estimates,” “plans,” “could,” “designed,” “should be” and other similar expressions that denote expectations of future or conditional events rather than statements of fact . Our expectations, beliefs and projections are expressed in good faith and we believe that there is a reasonable basis for them . However, there can be no assurance that these expectations, beliefs and projections will result or be achieved . There are a number of risks and uncertainties that could cause our actual results to differ materially from the forward - looking statements contained in this presentation . These risks and uncertainties are described in our Annual Report on Form 10 - K for the year ended December 31 , 2016 and our Quarterly Report on Form 10 - Q for the quarter ended March 31 , 2017 . There may be other factors not presently known to us or which we currently consider to be immaterial that may cause our actual results to differ materially from the forward - looking statements . All forward - looking statements attributable to us or persons acting on our behalf apply only as of the date of this presentation and are expressly qualified in their entirety by the cautionary statements included in this presentation . Except to the extent required by law, we undertake no obligation to update or revise forward - looking statements to reflect events or circumstances after the date such statements are made or to reflect the occurrence of unanticipated events . Non - GAAP Financial Measures This presentation contains certain non - GAAP financial measures, including EBITDA, Adjusted EBITDA and Indicative Net Asset Value . The non - GAAP financial measures contained herein have limitations as analytical tools and should not be considered in isolation or in lieu of an analysis of our results as reported under U . S . GAAP . These non - GAAP measures should be evaluated only on a supplementary basis in connection with our U . S . GAAP results, including those reported in our consolidated financial statements and the related notes thereto contained in our Annual Report on Form 10 - K for the year ended December 31 , 2016 and our Quarterly Report on Form 10 - Q for the quarter ended March 31 , 2017 . A reconciliation of these non - GAAP financial measures to the most directly comparable GAAP financial measures can be found in the back of this presentation .
Company Overview 3
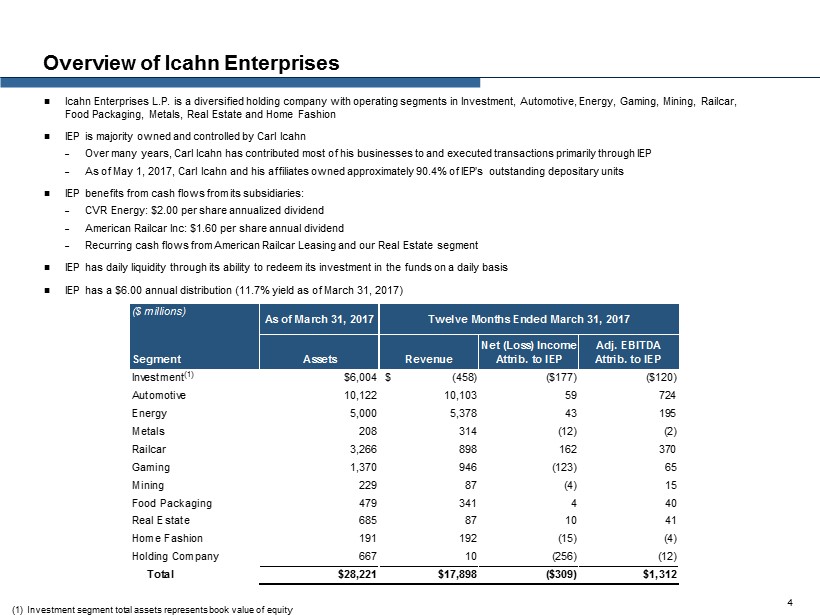
Overview of Icahn Enterprises Icahn Enterprises L.P. is a diversified holding company with operating segments in Investment, Automotive, Energy, Gaming, Mi nin g, Railcar, Food Packaging, Metals, Real Estate and Home Fashion IEP is majority owned and controlled by Carl Icahn – Over many years, Carl Icahn has contributed most of his businesses to and executed transactions primarily through IEP – As of May 1, 2017, Carl Icahn and his affiliates owned approximately 90.4% of IEP’s outstanding depositary units IEP benefits from cash flows from its subsidiaries: – CVR Energy: $2.00 per share annualized dividend – American Railcar Inc: $1.60 per share annual dividend – Recurring cash flows from American Railcar Leasing and our Real Estate segment IEP has daily liquidity through its ability to redeem its investment in the funds on a daily basis IEP has a $6.00 annual distribution (11.7 % yield as of March 31, 2017) (1) Investment segment total assets represents book value of equity 4 ($ millions) As of March 31, 2017 Segment Assets Revenue Net (Loss) Income Attrib. to IEP Adj. EBITDA Attrib. to IEP Investment (1) $6,004 $ (458) ($177) ($120) Automotive 10,122 10,103 59 724 Energy 5,000 5,378 43 195 Metals 208 314 (12) (2) Railcar 3,266 898 162 370 Gaming 1,370 946 (123) 65 Mining 229 87 (4) 15 Food Packaging 479 341 4 40 Real Estate 685 87 10 41 Home Fashion 191 192 (15) (4) Holding Company 667 10 (256) (12) Total $28,221 $17,898 ($309) $1,312 Twelve Months Ended March 31, 2017
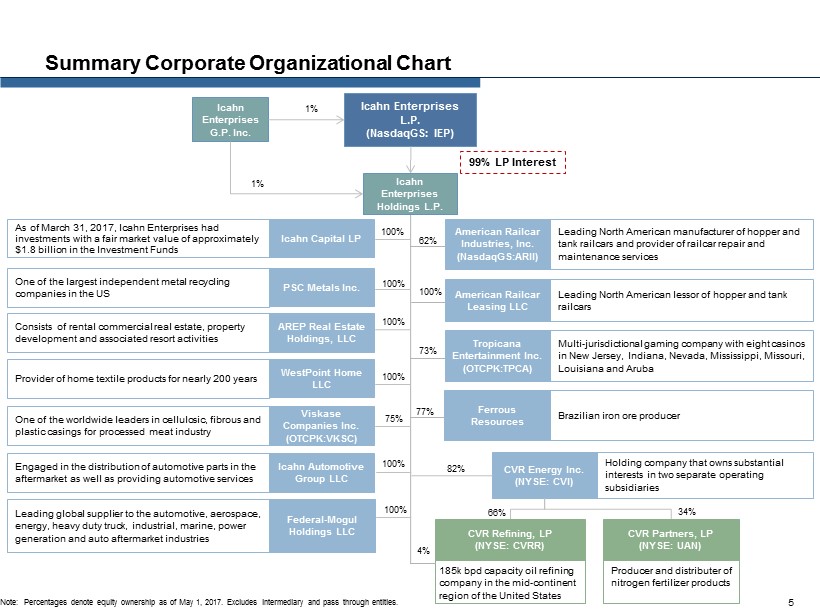
66% CVR Energy Inc. (NYSE: CVI) Summary Corporate Organizational Chart WestPoint Home LLC PSC Metals Inc. AREP Real Estate Holdings, LLC Tropicana Entertainment Inc. (OTCPK:TPCA) Federal - Mogul Holdings LLC Icahn Enterprises G.P. Inc. Icahn Enterprises L.P. (NasdaqGS: IEP) Icahn Enterprises Holdings L.P . 1% 1% 99% LP Interest 34% 75% 100% 82% American Railcar Industries, Inc. (NasdaqGS:ARII) Icahn Capital LP Viskase Companies Inc. (OTCPK:VKSC) As of March 31, 2017, Icahn Enterprises had investments with a fair market value of approximately $1.8 billion in the Investment Funds One of the largest independent metal recycling companies in the US Consists of rental commercial real estate, property development and associated resort activities Provider of home textile products for nearly 200 years One of the worldwide leaders in cellulosic, fibrous and plastic casings for processed meat industry Holding company that owns substantial interests in two separate operating subsidiaries Multi - jurisdictional gaming company with eight casinos in New Jersey, Indiana, Nevada, Mississippi, Missouri, Louisiana and Aruba Leading North American manufacturer of hopper and tank railcars and provider of railcar repair and maintenance services 73% 100% 100% 62% Producer and distributer of nitrogen fertilizer products CVR Partners, LP (NYSE: UAN) CVR Refining, LP (NYSE: CVRR) 185k bpd capacity oil refining company in the mid - continent region of the United States 100 % 100% 4% Leading global supplier to the automotive, aerospace, energy, heavy duty truck, industrial, marine, power generation and auto aftermarket industries Note : Percentages denote equity ownership as of May 1, 2017. Excludes intermediary and pass through entities. American Railcar Leasing LLC Leading North American lessor of hopper and tank railcars 100% 5 Ferrous Resources Brazilian iron ore producer Icahn Automotive Group LLC Engaged in the distribution of automotive parts in the aftermarket as well as providing automotive services 100% 77%
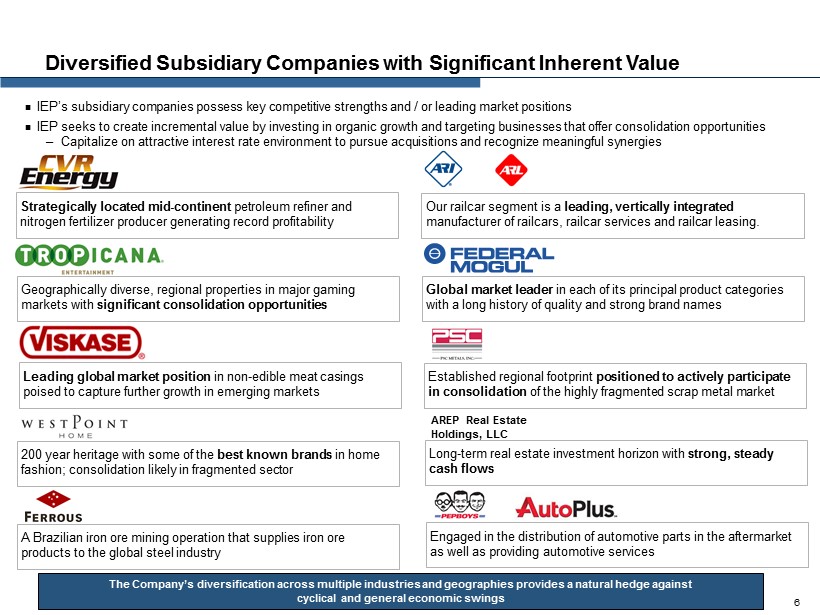
Diversified Subsidiary Companies with Significant Inherent Value The Company’s diversification across multiple industries and geographies provides a natural hedge against cyclical and general economic swings Global market leader in each of its principal product categories with a long history of quality and strong brand names Geographically diverse, regional properties in major gaming markets with significant consolidation opportunities 200 year heritage with some of the best known brands in home fashion; consolidation likely in fragmented sector Leading global market position in non - edible meat casings poised to capture further growth in emerging markets Established regional footprint positioned to actively participate in consolidation of the highly fragmented scrap metal market Our railcar segment is a leading, vertically integrated manufacturer of railcars, railcar services and railcar leasing. Strategically located mid - continent petroleum refiner and nitrogen fertilizer producer generating record profitability Long - term real estate investment horizon with strong, steady cash flows AREP Real Estate Holdings, LLC IEP’s subsidiary companies possess key competitive strengths and / or leading market positions IEP seeks to create incremental value by investing in organic growth and targeting businesses that offer consolidation opportunities ─ Capitalize on attractive interest rate environment to pursue acquisitions and recognize meaningful synergies 6 A Brazilian iron ore mining operation that supplies iron ore products to the global steel industry Engaged in the distribution of automotive parts in the aftermarket as well as providing automotive services
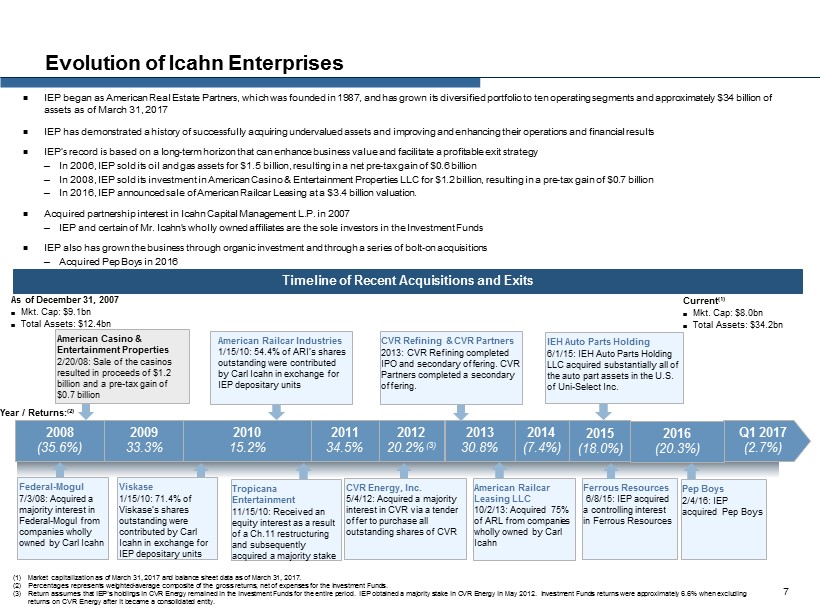
IEP began as American Real Estate Partners, which was founded in 1987, and has grown its diversified portfolio to ten operating segments and approximately $34 billion of assets as of March 31, 2017 IEP has demonstrated a history of successfully acquiring undervalued assets and improving and enhancing their operations and fin ancial results IEP’s record is based on a long - term horizon that can enhance business value and facilitate a profitable exit strategy ─ In 2006, IEP sold its oil and gas assets for $1.5 billion, resulting in a net pre - tax gain of $0.6 billion ─ In 2008, IEP sold its investment in American Casino & Entertainment Properties LLC for $1.2 billion, resulting in a pre - tax gain of $0.7 billion ─ In 2016, IEP announced sale of American Railcar Leasing at a $3.4 billion valuation. Acquired partnership interest in Icahn Capital Management L.P . in 2007 ─ IEP and certain of Mr. Icahn's wholly owned affiliates are the sole investors in the Investment Funds IEP also has grown the business through organic investment and through a series of bolt - on acquisitions ─ Acquired Pep Boys in 2016 Evolution of Icahn Enterprises Timeline of Recent Acquisitions and Exits (1) Market capitalization as of March 31, 2017 and balance sheet data as of March 31, 2017. (2) Percentages represents weighted - average composite of the gross returns, net of expenses for the Investment Funds. (3) Return assumes that IEP’s holdings in CVR Energy remained in the Investment Funds for the entire period. IEP obtained a majority stake in CVR Energy in May 2012. Investment Fu nds returns were approximately 6.6 % when excluding returns on CVR Energy after it became a consolidated entity . As of December 31, 2007 Mkt. Cap: $9.1bn Total Assets: $12.4bn Current (1) Mkt. Cap: $8.0bn Total Assets: $34.2bn American Casino & Entertainment Properties 2/20/08: Sale of the casinos resulted in proceeds of $1.2 billion and a pre - tax gain of $0.7 b illion American Railcar Industries 1/15/10: 54.4% of ARI’s shares outstanding were contributed by Carl Icahn in exchange for IEP depositary units Tropicana Entertainment 11/15/10: Received an equity interest as a result of a Ch.11 restructuring and subsequently acquired a majority stake CVR Energy, Inc. 5/4/12: Acquired a majority interest in CVR via a tender offer to purchase all outstanding shares of CVR Federal - Mogul 7/3/08: Acquired a majority interest in Federal - Mogul from companies wholly owned by Carl Icahn Viskase 1/15/10: 71.4 % of Viskase’s shares outstanding were contributed by Carl Icahn in exchange for IEP depositary units Year / Returns: (2) 7 CVR Refining & CVR Partners 2013: CVR Refining completed IPO and secondary offering. CVR Partners completed a secondary offering. Q1 2017 (2.7%) 2008 (35.6%) 2009 33.3% 2010 15.2 % 2011 34.5% 2012 20.2% (3) American Railcar Leasing LLC 10/2/13: Acquired 75% of ARL from companies wholly owned by Carl Icahn 2013 30.8 % 2014 (7.4%) IEH Auto Parts Holding 6/1/15: IEH Auto Parts Holding LLC acquired substantially all of the auto part assets in the U.S. of Uni - Select Inc. Ferrous Resources 6/8/15: IEP acquired a controlling interest in Ferrous Resources 2015 (18.0%) Pep Boys 2/4/16: IEP acquired Pep Boys 2016 (20.3%)
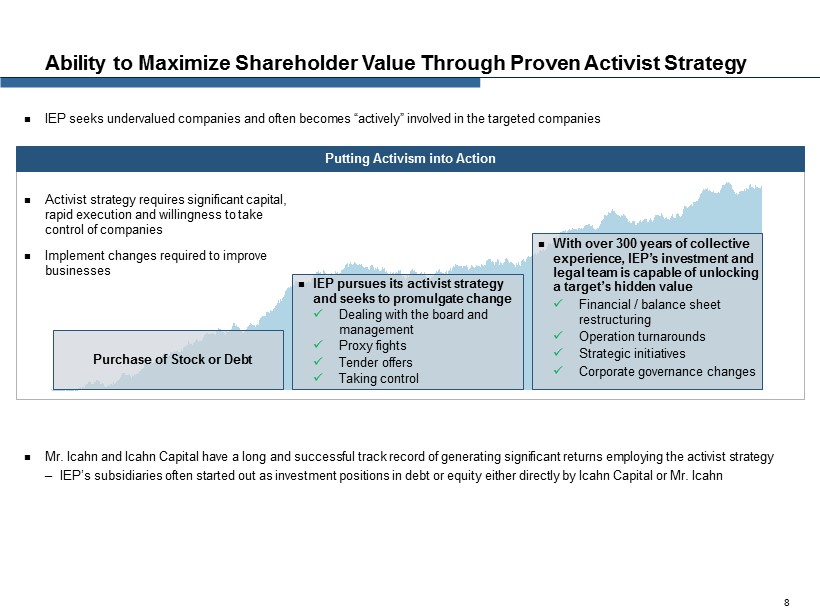
IEP seeks undervalued companies and often becomes “actively” involved in the targeted companies Activist strategy requires significant capital, rapid execution and willingness to take control of companies Implement changes required to improve businesses Ability to Maximize Shareholder Value Through Proven Activist Strategy Purchase of Stock or Debt IEP pursues its activist strategy and seeks to promulgate change x Dealing with the board and management x Proxy fights x Tender offers x Taking control With over 300 years of collective experience, IEP’s investment and legal team is capable of unlocking a target’s hidden value x Financial / balance sheet restructuring x Operation turnarounds x Strategic initiatives x Corporate governance changes Mr . Icahn and Icahn Capital have a long and successful track record of generating significant returns employing the activist st rat egy ─ IEP’s subsidiaries often started out as investment positions in debt or equity either directly by Icahn Capital or Mr. Icahn Putting Activism into Action 8
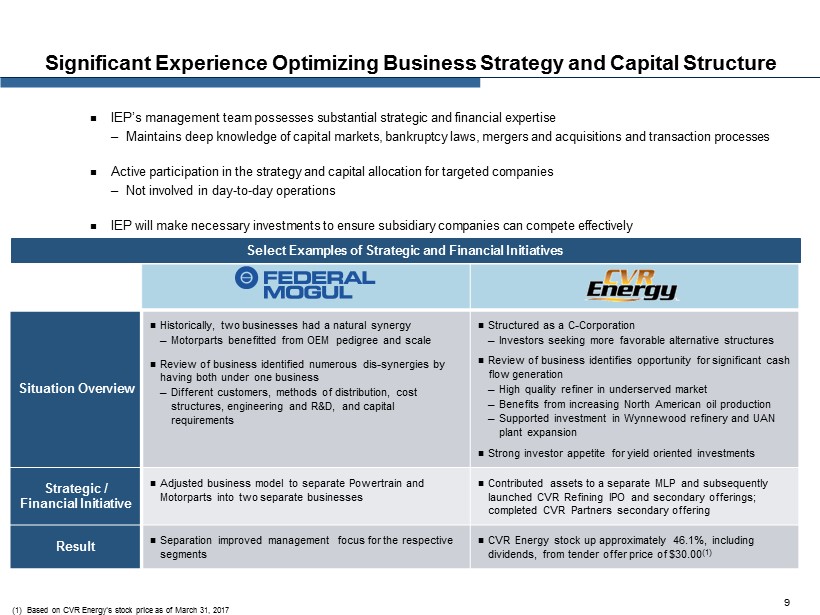
Situation Overview Historically, two businesses had a natural synergy ─ Motorparts benefitted from OEM pedigree and scale Review of business identified numerous dis - synergies by having both under one business ─ Different customers, methods of distribution, cost structures, engineering and R&D, and capital requirements Structured as a C - Corporation ─ Investors seeking more favorable alternative structures Review of business identifies opportunity for significant cash flow generation ─ High quality refiner in underserved market ─ Benefits from increasing North American oil production ─ Supported investment in Wynnewood refinery and UAN plant expansion Strong investor appetite for yield oriented investments Strategic / Financial Initiative Adjusted business model to separate Powertrain and Motorparts into two separate businesses Contributed assets to a separate MLP and subsequently launched CVR Refining IPO and secondary offerings; completed CVR Partners secondary offering Result Separation improved management focus for the respective segments CVR Energy stock up approximately 46.1%, including dividends, from tender offer price of $30.00 (1) Significant Experience Optimizing Business Strategy and Capital Structure IEP’s management team possesses substantial strategic and financial expertise ─ Maintains deep knowledge of capital markets, bankruptcy laws, mergers and acquisitions and transaction processes Active participation in the strategy and capital allocation for targeted companies ─ Not involved in day - to - day operations IEP w ill make necessary investments to ensure subsidiary companies can compete effectively Select Examples of Strategic and Financial Initiatives (1) Based on CVR Energy’s stock price as of March 31, 2017 9
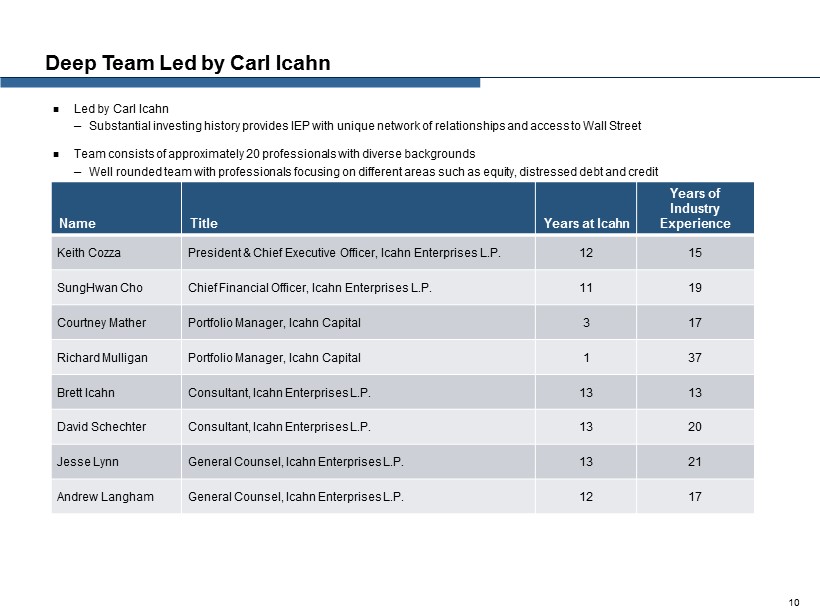
Deep Team Led by Carl Icahn Led by Carl Icahn ─ Substantial investing history provides IEP with unique network of relationships and access to Wall Street Team consists of approximately 20 professionals with diverse backgrounds ─ Well rounded team with professionals focusing on different areas such as equity, distressed debt and credit Name Title Years at Icahn Years of Industry Experience Keith Cozza President & Chief Executive Officer , Icahn Enterprises L.P. 12 15 SungHwan Cho Chief Financial Officer , Icahn Enterprises L.P. 11 19 Courtney Mather Portfolio Manager, Icahn Capital 3 17 Richard Mulligan Portfolio Manager, Icahn Capital 1 37 Brett Icahn Consultant, Icahn Enterprises L.P. 13 13 David Schechter Consultant, Icahn Enterprises L.P. 13 20 Jesse Lynn General Counsel, Icahn Enterprises L.P. 13 21 Andrew Langham General Counsel, Icahn Enterprises L.P. 12 17 10
Overview of Operating Segments 11
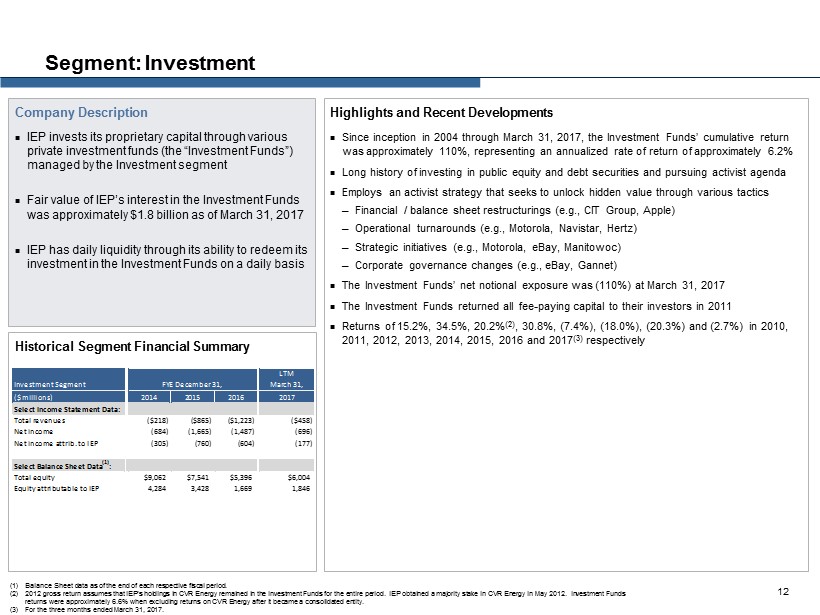
Highlights and Recent Developments Since inception in 2004 through March 31, 2017, the Investment Funds’ cumulative return was approximately 110%, representing an annualized rate of return of approximately 6.2% Long history of investing in public equity and debt securities and pursuing activist agenda Employs an activist strategy that seeks to unlock hidden value through various tactics ─ Financial / balance sheet restructurings (e.g., CIT Group, Apple) ─ Operational turnarounds (e.g., Motorola, Navistar, Hertz) ─ Strategic initiatives (e.g., Motorola, eBay, Manitowoc) ─ Corporate governance changes (e.g., eBay, Gannet) The Investment Funds’ net notional exposure was (110%) at March 31 , 2017 The Investment Funds returned all fee - paying capital to their investors in 2011 Returns of 15.2%, 34.5%, 20.2% (2) , 30.8%, (7.4%), (18.0%), (20.3%) and (2.7%) in 2010, 2011, 2012, 2013, 2014, 2015, 2016 and 2017 (3) respectively Segment: Investment Company Description IEP invests its proprietary capital through various private investment funds (the “Investment Funds”) managed by the Investment segment Fair value of IEP’s interest in the Investment Funds was approximately $1.8 billion as of March 31, 2017 IEP has daily liquidity through its ability to redeem its investment in the Investment Funds on a daily basis Historical Segment Financial Summary 12 (1) Balance Sheet data as of the end of each respective fiscal period. (2) 2012 gross return assumes that IEP’s holdings in CVR Energy remained in the Investment Funds for the entire period. IEP obta ine d a majority stake in CVR Energy in May 2012. Investment Funds returns were approximately 6.6% when excluding returns on CVR Energy after it became a consolidated entity. (3) For the three months ended March 31, 2017. Investment Segment LTM March 31, ($ millions) 2014 2015 2016 2017 Select Income Statement Data: Total revenues ($218) ($865) ($1,223) ($458) Net income (684) (1,665) (1,487) (696) Net income attrib. to IEP (305) (760) (604) (177) Select Balance Sheet Data (1) : Total equity $9,062 $7,541 $5,396 $6,004 Equity attributable to IEP 4,284 3,428 1,669 1,846 FYE December 31,
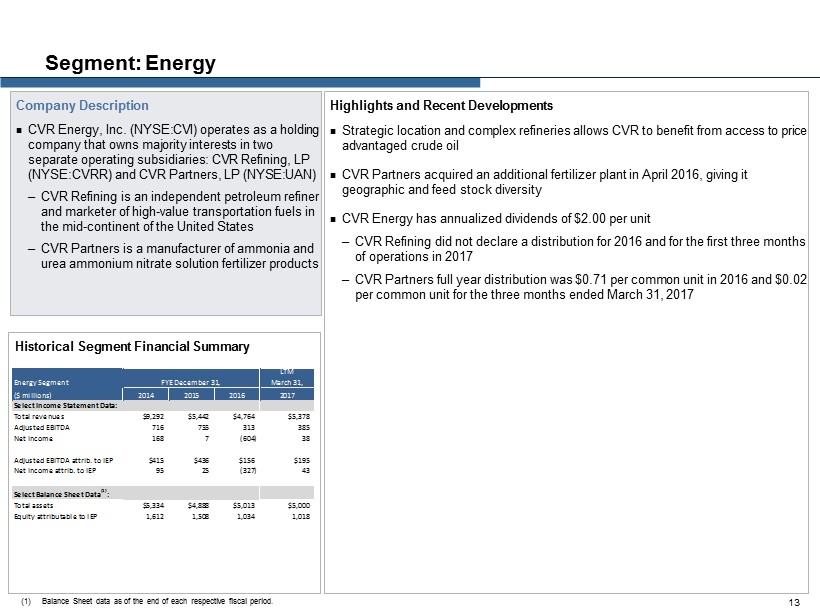
Highlights and Recent Developments Strategic location and complex refineries allows CVR to benefit from access to price advantaged crude oil CVR Partners acquired an additional fertilizer plant in April 2016, giving it geographic and feed stock diversity CVR Energy has annualized dividends of $2.00 per unit ─ CVR Refining did not declare a distribution for 2016 and for the first three months of operations in 2017 ─ CVR Partners full year distribution was $0.71 per common unit in 2016 and $0.02 per common unit for the three months ended March 31, 2017 Segment: Energy Company Description CVR Energy, Inc. (NYSE:CVI) operates as a holding company that owns majority interests in two separate operating subsidiaries: CVR Refining, LP (NYSE:CVRR) and CVR Partners, LP ( NYSE:UAN ) ─ CVR Refining is an independent petroleum refiner and marketer of high - value transportation fuels in the mid - continent of the United States ─ CVR Partners is a manufacturer of ammonia and urea ammonium nitrate solution fertilizer products Historical Segment Financial Summary 13 (1) Balance Sheet data as of the end of each respective fiscal period. Energy Segment LTM March 31, ($ millions) 2014 2015 2016 2017 Select Income Statement Data: Total revenues $9,292 $5,442 $4,764 $5,378 Adjusted EBITDA 716 755 313 385 Net income 168 7 (604) 38 Adjusted EBITDA attrib. to IEP $415 $436 $156 $195 Net income attrib. to IEP 95 25 (327) 43 Select Balance Sheet Data (1) : Total assets $5,334 $4,888 $5,013 $5,000 Equity attributable to IEP 1,612 1,508 1,034 1,018 FYE December 31,
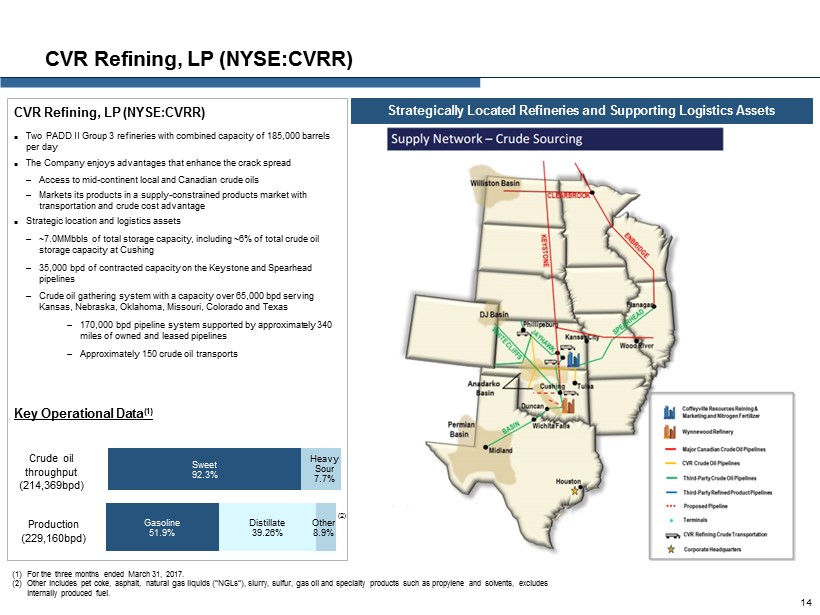
Gasoline 51.9% Distillate 39.26% Other 8.9% CVR Refining, LP (NYSE:CVRR ) Two PADD II Group 3 refineries with combined capacity of 185,000 barrels per day The Company enjoys advantages that enhance the crack spread ─ Access to mid - continent local and Canadian crude oils ─ Markets its products in a supply - constrained products market with transportation and crude cost advantage Strategic location and logistics assets ─ ~7.0MMbbls of total storage capacity, including ~6% of total crude oil storage capacity at Cushing ─ 35,000 bpd of contracted capacity on the Keystone and Spearhead pipelines ─ Crude oil gathering system with a capacity over 65,000 bpd serving Kansas, Nebraska, Oklahoma, Missouri, Colorado and Texas ─ 170,000 bpd pipeline system supported by approximately 340 miles of owned and leased pipelines ─ Approximately 150 crude oil transports Key Operational Data (1) CVR Refining, LP (NYSE:CVRR) Crude oil throughput (214,369bpd) Production (229,160bpd ) (1) For the three months ended March 31, 2017. (2) Other includes pet coke, asphalt, natural gas liquids (“NGLs”), slurry, sulfur, gas oil and specialty products such as propyl ene and solvents, excludes internally produced fuel. Strategically Located Refineries and Supporting Logistics Assets 14 (2) Sweet 92.3% Heavy Sour 7.7%
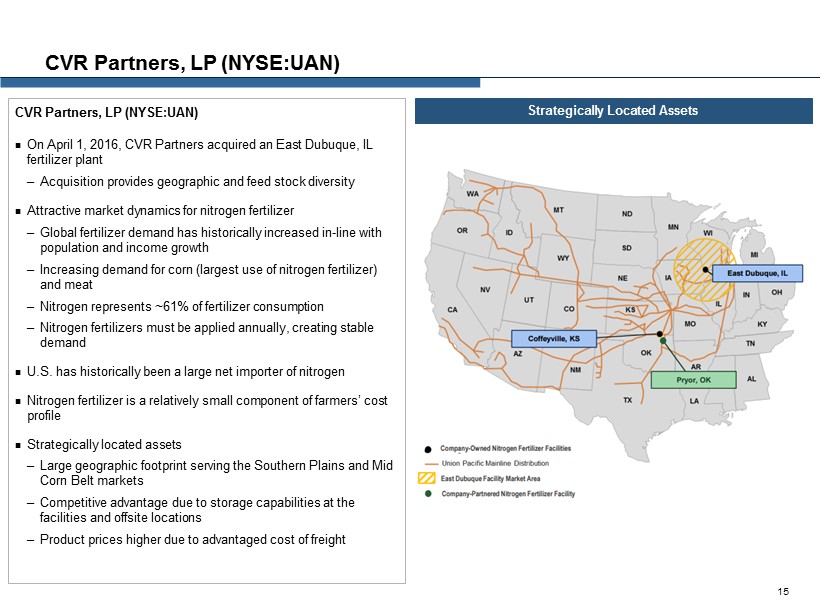
CVR Partners, LP (NYSE:UAN ) On April 1, 2016, CVR Partners acquired an East Dubuque, IL fertilizer plant ─ Acquisition provides geographic and feed stock diversity Attractive market dynamics for nitrogen fertilizer ─ Global fertilizer demand has historically increased in - line with population and income growth ─ Increasing demand for corn (largest use of nitrogen fertilizer) and meat ─ Nitrogen represents ~61% of fertilizer consumption ─ Nitrogen fertilizers must be applied annually, creating stable demand U.S. has historically been a large net importer of nitrogen Nitrogen fertilizer is a relatively small component of farmers’ cost profile Strategically located assets ─ Large geographic footprint serving the Southern Plains and Mid Corn Belt markets ─ Competitive advantage due to storage capabilities at the facilities and offsite locations ─ Product prices higher due to advantaged cost of freight CVR Partners, LP (NYSE:UAN ) Strategically Located Assets 15
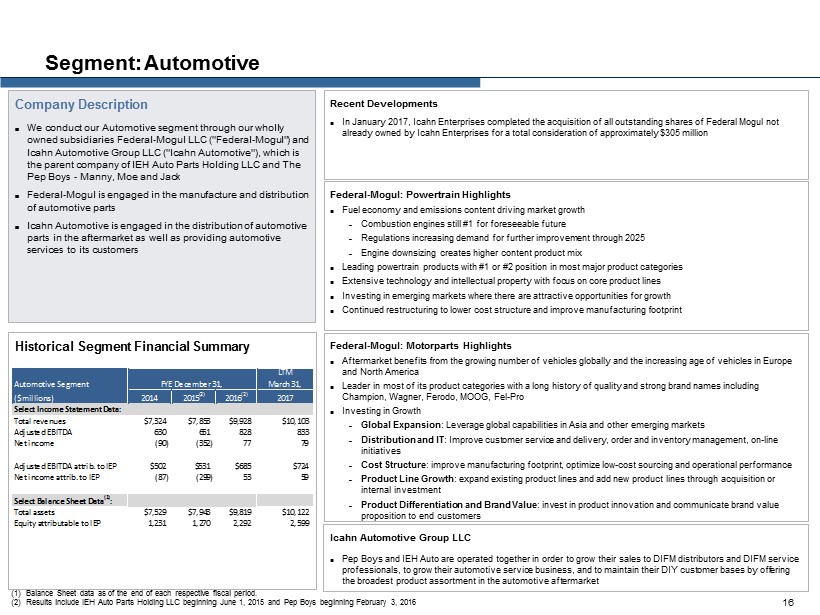
Segment: Automotive Company Description We conduct our Automotive segment through our wholly owned subsidiaries Federal - Mogul LLC ("Federal - Mogul") and Icahn Automotive Group LLC ("Icahn Automotive"), which is the parent company of IEH Auto Parts Holding LLC and The Pep Boys - Manny, Moe and Jack Federal - Mogul is engaged in the manufacture and distribution of automotive parts Icahn Automotive is engaged in the distribution of automotive parts in the aftermarket as well as providing automotive services to its customers Historical Segment Financial Summary Federal - Mogul: Powertrain Highlights Fuel economy and emissions content driving market growth – Combustion engines still #1 for foreseeable future – Regulations increasing demand for further improvement through 2025 – Engine downsizing creates higher content product mix Leading powertrain products with #1 or #2 position in most major product categories Extensive technology and intellectual property with focus on core product lines Investing in emerging markets where there are attractive opportunities for growth Continued restructuring to lower cost structure and improve manufacturing footprint Federal - Mogul: Motorparts Highlights Aftermarket benefits from the growing number of vehicles globally and the increasing age of vehicles in Europe and North America Leader in most of its product categories with a long history of quality and strong brand names including Champion, Wagner, Ferodo, MOOG, Fel - Pro Investing in Growth – Global Expansion : L everage global capabilities in Asia and other emerging markets – Distribution and IT : Improve customer service and delivery, order and inventory management, on - line initiatives – Cost Structure : improve manufacturing footprint, optimize low - cost sourcing and operational performance – Product Line Growth : expand existing product lines and add new product lines through acquisition or internal investment – Product Differentiation and Brand Value : invest in product innovation and communicate brand value proposition to end customers 16 Recent Developments In January 2017, Icahn Enterprises completed the acquisition of all outstanding shares of Federal Mogul not already owned by Icahn Enterprises for a total consideration of approximately $305 million (1) Balance Sheet data as of the end of each respective fiscal period. (2) Results include IEH Auto Parts Holding LLC beginning June 1, 2015 and Pep Boys beginning February 3, 2016 Icahn Automotive Group LLC Pep Boys and IEH Auto are operated together in order to grow their sales to DIFM distributors and DIFM service professionals, to grow their automotive service business, and to maintain their DIY customer bases by offering the broadest product assortment in the automotive aftermarket Automotive Segment LTM March 31, ($ millions) 2014 2015 (2) 2016 (2) 2017 Select Income Statement Data: Total revenues $7,324 $7,853 $9,928 $10,103 Adjusted EBITDA 630 651 828 833 Net income (90) (352) 77 79 Adjusted EBITDA attrib. to IEP $502 $531 $685 $724 Net income attrib. to IEP (87) (299) 53 59 Select Balance Sheet Data (1) : Total assets $7,529 $7,943 $9,819 $10,122 Equity attributable to IEP 1,231 1,270 2,292 2,599 FYE December 31,
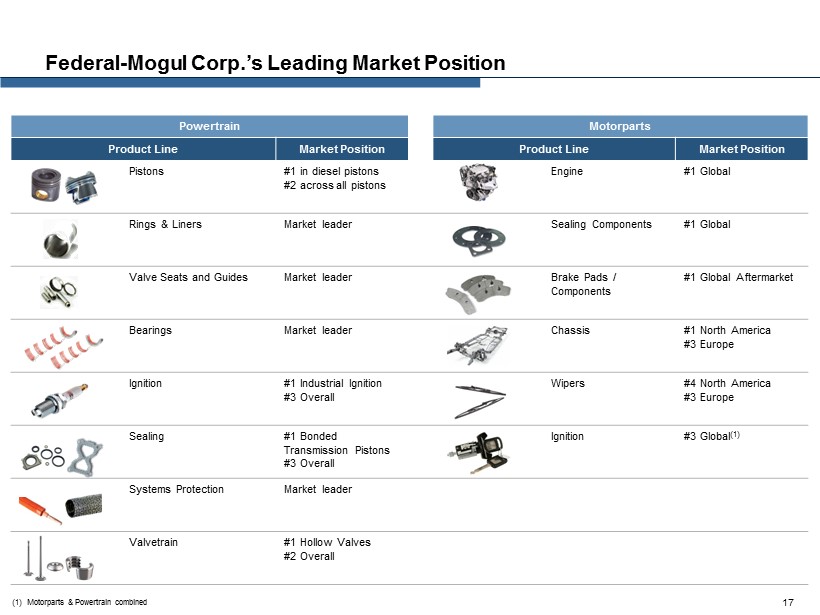
Federal - Mogul Corp.’s Leading Market Position 17 Powertrain Motorparts Product Line Market Position Product Line Market Position Pistons #1 in diesel pistons #2 a cross all pistons Engine #1 Global Rings & Liners Market leader Sealing Components #1 Global Valve Seats and Guides Market leader Brake Pads / Components #1 Global Aftermarket Bearings Market leader Chassis #1 North America #3 Europe Ignition #1 Industrial Ignition #3 Overall Wipers #4 North America #3 Europe Sealing #1 Bonded Transmission Pistons #3 Overall Ignition #3 Global (1) Systems Protection Market leader Valvetrain #1 Hollow Valves #2 Overall (1) Motorparts & Powertrain combined
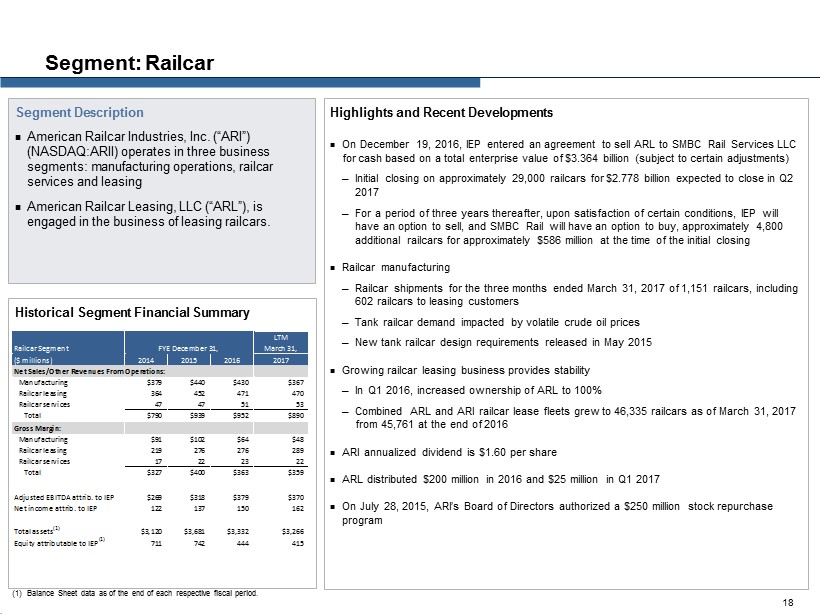
Highlights and Recent Developments On December 19, 2016, IEP entered an agreement to sell ARL to SMBC Rail Services LLC for cash based on a total enterprise value of $3.364 billion (subject to certain adjustments) ─ Initial closing on approximately 29,000 railcars for $2.778 billion expected to close in Q2 2017 ─ For a period of three years thereafter, upon satisfaction of certain conditions, IEP will have an option to sell, and SMBC Rail will have an option to buy, approximately 4,800 additional railcars for approximately $586 million at the time of the initial closing Railcar manufacturing ─ Railcar shipments for the three months ended March 31, 2017 of 1,151 railcars, including 602 railcars to leasing customers ─ Tank railcar demand impacted by volatile crude oil prices ─ New tank railcar design requirements released in May 2015 Growing railcar leasing business provides stability ─ In Q1 2016, increased ownership of ARL to 100% ─ Combined ARL and ARI railcar lease fleets grew to 46,335 railcars as of March 31, 2017 from 45,761 at the end of 2016 ARI annualized dividend is $1.60 per share ARL distributed $200 million in 2016 and $25 million in Q1 2017 On July 28, 2015, ARI’s Board of Directors authorized a $250 million stock repurchase program Segment: Railcar Segment Description American Railcar Industries, Inc. (“ARI”) (NASDAQ:ARII ) operates in three business segments: manufacturing operations, railcar services and leasing American Railcar Leasing, LLC (“ARL”), is engaged in the business of leasing railcars. Historical Segment Financial Summary . 18 (1) Balance Sheet data as of the end of each respective fiscal period. Railcar Segment LTM March 31, ($ millions) 2014 2015 2016 2017 Net Sales/Other Revenues From Operations: Manufacturing $379 $440 $430 $367 Railcar leasing 364 452 471 470 Railcar services 47 47 51 53 Total $790 $939 $952 $890 Gross Margin: Manufacturing $91 $102 $64 $48 Railcar leasing 219 276 276 289 Railcar services 17 22 23 22 Total $327 $400 $363 $359 Adjusted EBITDA attrib. to IEP $269 $318 $379 $370 Net income attrib. to IEP 122 137 150 162 Total assets (1) $3,120 $3,681 $3,332 $3,266 Equity attributable to IEP (1) 711 742 444 415 FYE December 31,
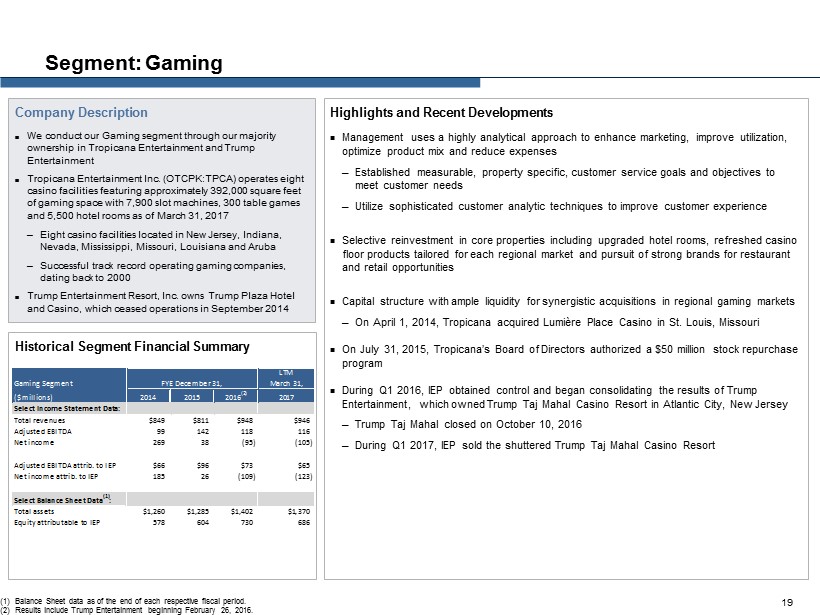
Highlights and Recent Developments Management uses a highly analytical approach to enhance marketing, improve utilization, optimize product mix and reduce expenses ─ Established measurable, property specific, customer service goals and objectives to meet customer needs ─ Utilize sophisticated customer analytic techniques to improve customer experience Selective reinvestment in core properties including upgraded hotel rooms, refreshed casino floor products tailored for each regional market and pursuit of strong brands for restaurant and retail opportunities Capital structure with ample liquidity for synergistic acquisitions in regional gaming markets ─ On April 1, 2014, Tropicana acquired Lumière Place Casino in St. Louis, Missouri On July 31, 2015, Tropicana’s Board of Directors authorized a $50 million stock repurchase program During Q1 2016, IEP obtained control and began consolidating the results of Trump Entertainment, which owned Trump Taj Mahal Casino Resort in Atlantic City, New Jersey ─ Trump Taj Mahal closed on October 10, 2016 ─ During Q1 2017, IEP sold the shuttered Trump Taj Mahal Casino Resort Segment: Gaming Company Description We conduct our Gaming segment through our majority ownership in Tropicana Entertainment and Trump Entertainment Tropicana Entertainment Inc. (OTCPK:TPCA) operates eight casino facilities featuring approximately 392,000 square feet of gaming space with 7,900 slot machines, 300 table games and 5,500 hotel rooms as of March 31, 2017 ─ Eight casino facilities located in New Jersey, Indiana, Nevada, Mississippi, Missouri, Louisiana and Aruba ─ Successful track record operating gaming companies, dating back to 2000 Trump Entertainment Resort, Inc. owns Trump Plaza Hotel and Casino, which ceased operations in September 2014 Historical Segment Financial Summary 19 (1) Balance Sheet data as of the end of each respective fiscal period. (2) Results include Trump Entertainment beginning February 26, 2016. Gaming Segment LTM March 31, ($ millions) 2014 2015 2016 (2) 2017 Select Income Statement Data: Total revenues $849 $811 $948 $946 Adjusted EBITDA 99 142 118 116 Net income 269 38 (95) (105) Adjusted EBITDA attrib. to IEP $66 $96 $73 $65 Net income attrib. to IEP 185 26 (109) (123) Select Balance Sheet Data (1) : Total assets $1,260 $1,285 $1,402 $1,370 Equity attributable to IEP 578 604 730 686 FYE December 31,
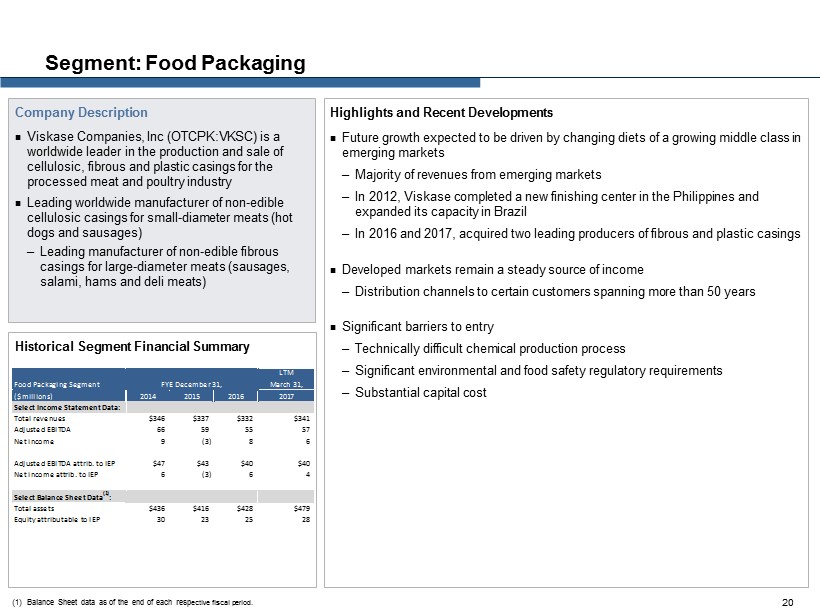
Highlights and Recent Developments Future growth expected to be driven by changing diets of a growing middle class in emerging markets ─ Majority of revenues from emerging markets ─ In 2012, Viskase completed a new finishing center in the Philippines and expanded its capacity in Brazil ─ In 2016 and 2017, acquired two leading producers of fibrous and plastic casings Developed markets remain a steady source of income ─ Distribution channels to certain customers spanning more than 50 years Significant barriers to entry ─ Technically difficult chemical production process ─ Significant environmental and food safety regulatory requirements ─ Substantial capital cost Segment: Food Packaging Company Description Viskase Companies, Inc (OTCPK:VKSC) is a worldwide leader in the production and sale of cellulosic, fibrous and plastic casings for the processed meat and poultry industry Leading worldwide manufacturer of non - edible cellulosic casings for small - diameter meats (hot dogs and sausages) ─ Leading manufacturer of non - edible fibrous casings for large - diameter meats (sausages, salami, hams and deli meats) Historical Segment Financial Summary 20 (1) Balance Sheet data as of the end of each resp ective fiscal period. Food Packaging Segment LTM March 31, ($ millions) 2014 2015 2016 2017 Select Income Statement Data: Total revenues $346 $337 $332 $341 Adjusted EBITDA 66 59 55 57 Net income 9 (3) 8 6 Adjusted EBITDA attrib. to IEP $47 $43 $40 $40 Net income attrib. to IEP 6 (3) 6 4 Select Balance Sheet Data (1) : Total assets $436 $416 $428 $479 Equity attributable to IEP 30 23 25 28 FYE December 31,
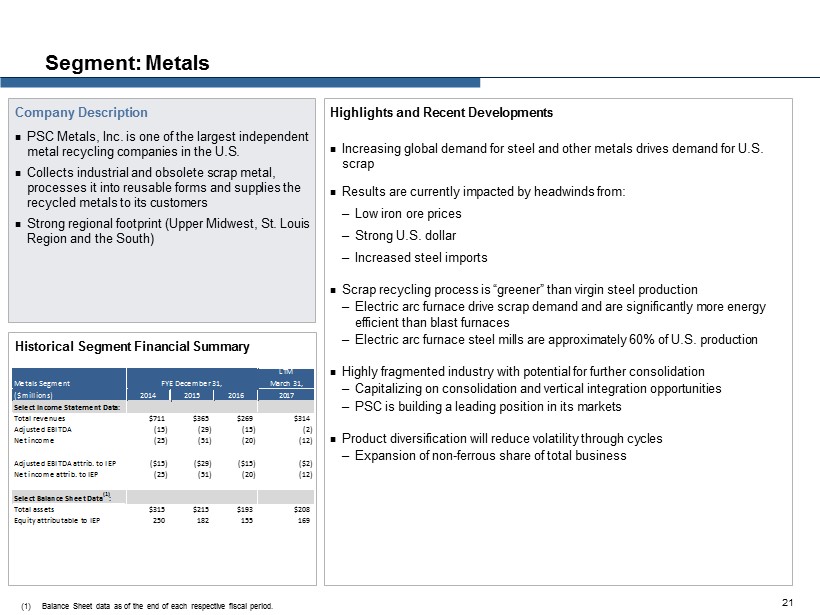
Highlights and Recent Developments Increasing global demand for steel and other metals drives demand for U.S. scrap Results are currently impacted by headwinds from: ─ Low iron ore prices ─ Strong U.S. dollar ─ Increased steel imports Scrap recycling process is “greener” than virgin steel production ─ Electric arc furnace drive scrap demand and are significantly more energy efficient than blast furnaces ─ Electric arc furnace steel mills are approximately 60% of U.S. production Highly fragmented industry with potential for further consolidation ─ Capitalizing on consolidation and vertical integration opportunities ─ PSC is building a leading position in its markets Product diversification will reduce volatility through cycles ─ Expansion of non - ferrous share of total business Segment: Metals Company Description PSC Metals, Inc. is one of the largest independent metal recycling companies in the U.S. Collects industrial and obsolete scrap metal, processes it into reusable forms and supplies the recycled metals to its customers Strong regional footprint (Upper Midwest, St. Louis Region and the South) Historical Segment Financial Summary 21 (1) Balance Sheet data as of the end of each respective fiscal period. Metals Segment LTM March 31, ($ millions) 2014 2015 2016 2017 Select Income Statement Data: Total revenues $711 $365 $269 $314 Adjusted EBITDA (15) (29) (15) (2) Net income (25) (51) (20) (12) Adjusted EBITDA attrib. to IEP ($15) ($29) ($15) ($2) Net income attrib. to IEP (25) (51) (20) (12) Select Balance Sheet Data (1) : Total assets $315 $215 $193 $208 Equity attributable to IEP 250 182 155 169 FYE December 31,
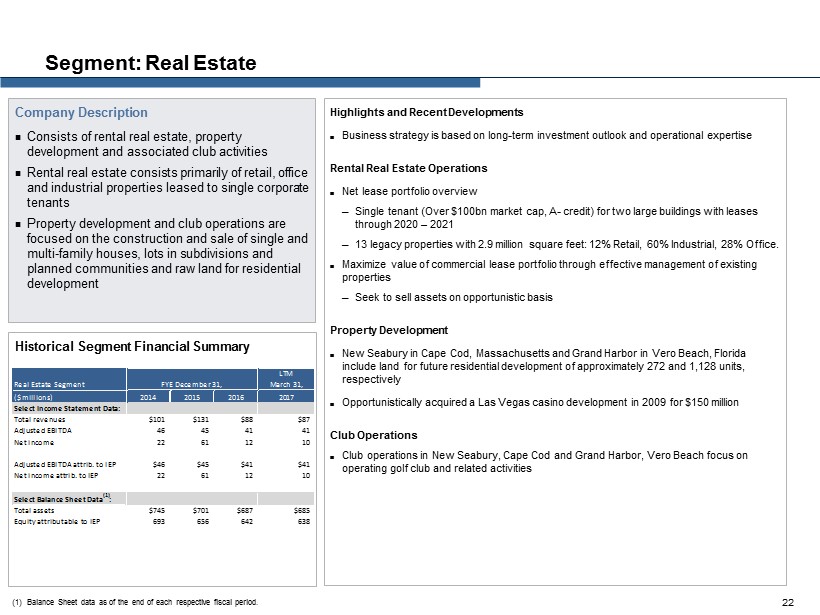
Highlights and Recent Developments Business strategy is based on long - term investment outlook and operational expertise Rental Real Estate Operations Net lease portfolio overview ─ Single tenant (Over $100bn market cap, A - credit) for two large buildings with leases through 2020 – 2021 ─ 13 legacy properties with 2.9 million square feet: 12% Retail, 60% Industrial, 28% Office. Maximize value of commercial lease portfolio through effective management of existing properties ─ Seek to sell assets on opportunistic basis Property Development New Seabury in Cape Cod, Massachusetts and Grand Harbor in Vero Beach, Florida include land for future residential development of approximately 272 and 1,128 units, respectively Opportunistically acquired a Las Vegas casino development in 2009 for $150 million Club Operations Club operations in New Seabury, Cape Cod and Grand Harbor, Vero Beach focus on operating golf club and related activities Segment: Real Estate Company Description Consists of rental real estate, property development and associated club activities Rental real estate consists primarily of retail, office and industrial properties leased to single corporate tenants Property development and club operations are focused on the construction and sale of single and multi - family houses, lots in subdivisions and planned communities and raw land for residential development Historical Segment Financial Summary 22 (1) Balance Sheet data as of the end of each respective fiscal period. Real Estate Segment LTM March 31, ($ millions) 2014 2015 2016 2017 Select Income Statement Data: Total revenues $101 $131 $88 $87 Adjusted EBITDA 46 45 41 41 Net income 22 61 12 10 Adjusted EBITDA attrib. to IEP $46 $45 $41 $41 Net income attrib. to IEP 22 61 12 10 Select Balance Sheet Data (1) : Total assets $745 $701 $687 $685 Equity attributable to IEP 693 656 642 638 FYE December 31,
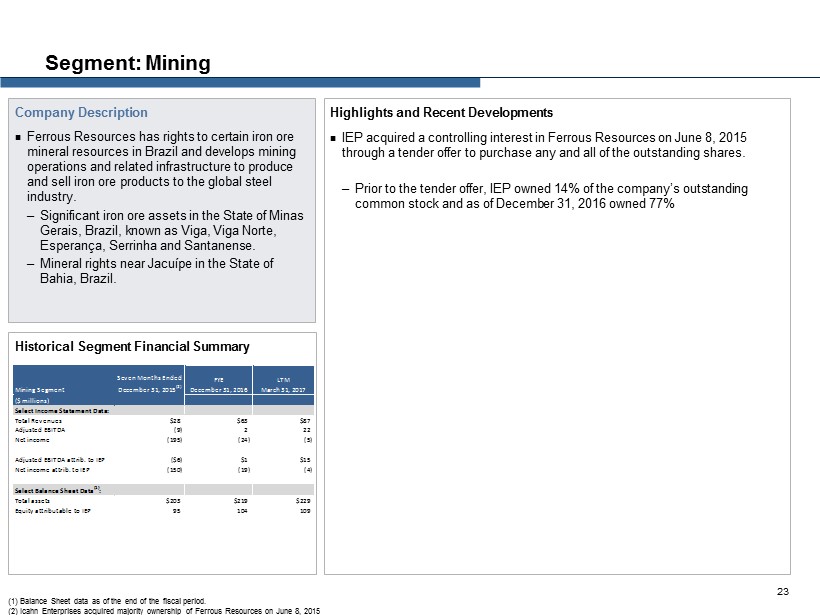
Highlights and Recent Developments IEP acquired a controlling interest in Ferrous Resources on June 8, 2015 through a tender offer to purchase any and all of the outstanding shares. ─ Prior to the tender offer, IEP owned 14% of the company’s outstanding common stock and as of December 31, 2016 owned 77% Segment: Mining Company Description Ferrous Resources has rights to certain iron ore mineral resources in Brazil and develops mining operations and related infrastructure to produce and sell iron ore products to the global steel industry. ─ Significant iron ore assets in the State of Minas Gerais , Brazil, known as Viga , Viga Norte, Esperança , Serrinha and Santanense . ─ Mineral rights near Jacuípe in the State of Bahia, Brazil. Historical Segment Financial Summary 23 (1) Balance Sheet data as of the end of the fiscal period. (2) Icahn Enterprises acquired majority ownership of Ferrous Resources on June 8, 2015 Mining Segment Seven Months Ended December 31, 2015 (2) FYE December 31, 2016 LTM March 31, 2017 ($ millions) Select Income Statement Data: Total Revenues $28 $63 $87 Adjusted EBITDA (9) 2 22 Net income (195) (24) (5) Adjusted EBITDA attrib. to IEP ($6) $1 $15 Net income attrib. to IEP (150) (19) (4) Select Balance Sheet Data (1) : Total assets $203 $219 $229 Equity attributable to IEP 95 104 109
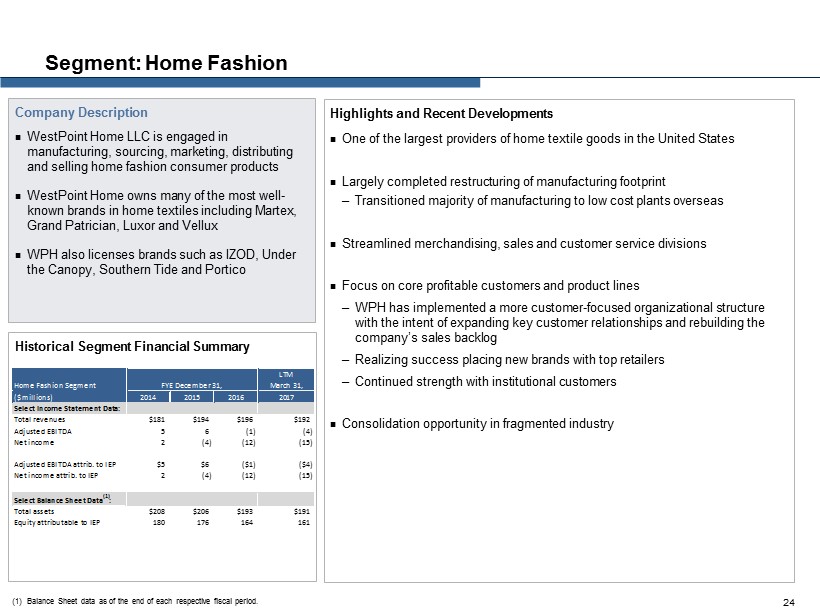
Highlights and Recent Developments One of the largest providers of home textile goods in the United States Largely completed restructuring of manufacturing footprint ─ Transitioned majority of manufacturing to low cost plants overseas Streamlined merchandising, sales and customer service divisions Focus on core profitable customers and product lines ─ WPH has implemented a more customer - focused organizational structure with the intent of expanding key customer relationships and rebuilding the company’s sales backlog ─ Realizing success placing new brands with top retailers ─ Continued strength with institutional customers Consolidation opportunity in fragmented industry Segment: Home Fashion Company Description WestPoint Home LLC is engaged in manufacturing, sourcing, marketing, distributing and selling home fashion consumer products WestPoint Home owns many of the most well - known brands in home textiles including Martex, Grand Patrician, Luxor and Vellux WPH also licenses brands such as IZOD, Under the Canopy, Southern Tide and Portico Historical Segment Financial Summary 24 (1) Balance Sheet data as of the end of each respective fiscal period. Home Fashion Segment LTM March 31, ($ millions) 2014 2015 2016 2017 Select Income Statement Data: Total revenues $181 $194 $196 $192 Adjusted EBITDA 5 6 (1) (4) Net income 2 (4) (12) (15) Adjusted EBITDA attrib. to IEP $5 $6 ($1) ($4) Net income attrib. to IEP 2 (4) (12) (15) Select Balance Sheet Data (1) : Total assets $208 $206 $193 $191 Equity attributable to IEP 180 176 164 161 FYE December 31,
Financial Performance 25
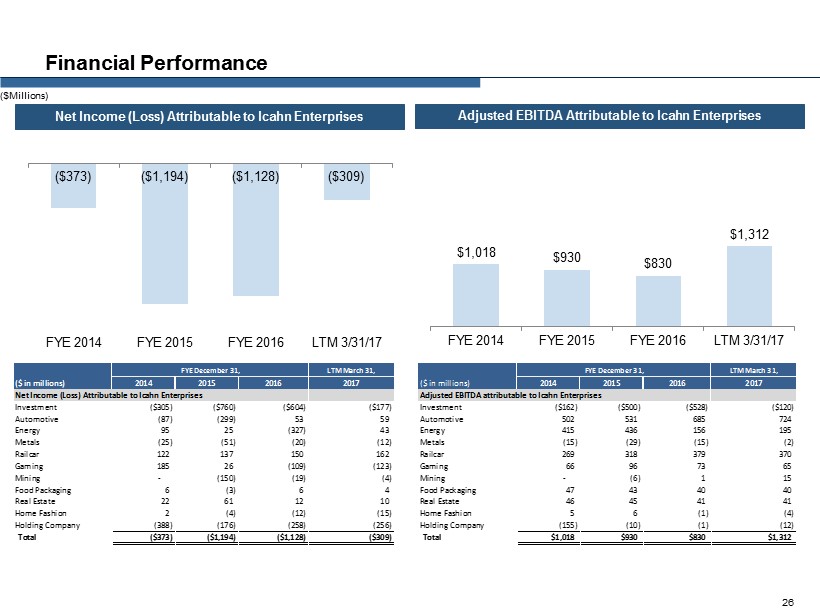
Financial Performance Net Income (Loss) Attributable to Icahn Enterprises Adjusted EBITDA Attributable to Icahn Enterprises 26 ($373) ($1,194) ($1,128) ($309) FYE 2014 FYE 2015 FYE 2016 LTM 3/31/17 $1,018 $930 $830 $1,312 FYE 2014 FYE 2015 FYE 2016 LTM 3/31/17 ($Millions) LTM March 31, LTM March 31, ($ in millions) 2014 2015 2016 2017 ($ in millions) 2014 2015 2016 2017 Net Income (Loss) Attributable to Icahn Enterprises Adjusted EBITDA attributable to Icahn Enterprises Investment ($305) ($760) ($604) ($177) Investment ($162) ($500) ($528) ($120) Automotive (87) (299) 53 59 Automotive 502 531 685 724 Energy 95 25 (327) 43 Energy 415 436 156 195 Metals (25) (51) (20) (12) Metals (15) (29) (15) (2) Railcar 122 137 150 162 Railcar 269 318 379 370 Gaming 185 26 (109) (123) Gaming 66 96 73 65 Mining - (150) (19) (4) Mining - (6) 1 15 Food Packaging 6 (3) 6 4 Food Packaging 47 43 40 40 Real Estate 22 61 12 10 Real Estate 46 45 41 41 Home Fashion 2 (4) (12) (15) Home Fashion 5 6 (1) (4) Holding Company (388) (176) (258) (256) Holding Company (155) (10) (1) (12) Total ($373) ($1,194) ($1,128) ($309) Total $1,018 $930 $830 $1,312 FYE December 31,FYE December 31,
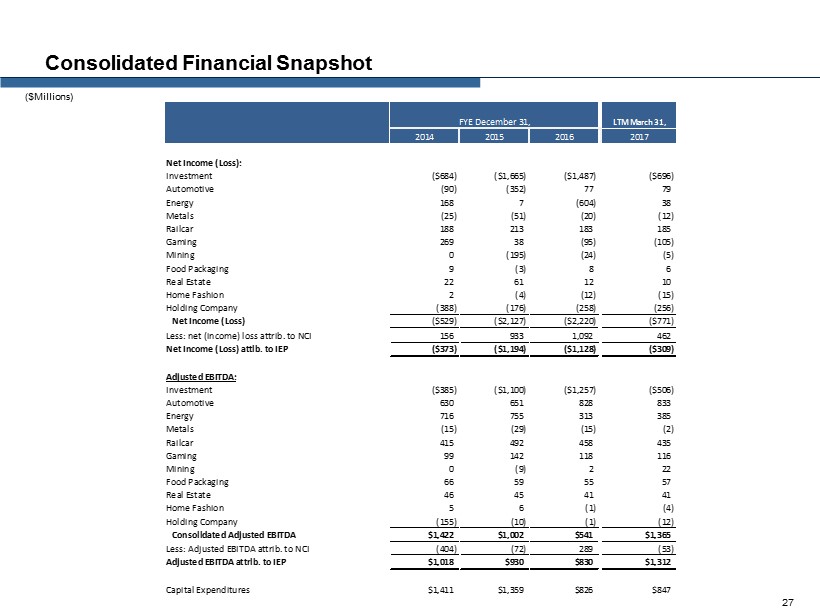
Consolidated Financial Snapshot ($Millions) 27 LTM March 31, 2014 2015 2016 2017 Net Income (Loss): Investment ($684) ($1,665) ($1,487) ($696) Automotive (90) (352) 77 79 Energy 168 7 (604) 38 Metals (25) (51) (20) (12) Railcar 188 213 183 185 Gaming 269 38 (95) (105) Mining 0 (195) (24) (5) Food Packaging 9 (3) 8 6 Real Estate 22 61 12 10 Home Fashion 2 (4) (12) (15) Holding Company (388) (176) (258) (256) Net Income (Loss) ($529) ($2,127) ($2,220) ($771) Less: net (income) loss attrib. to NCI 156 933 1,092 462 Net Income (Loss) attib. to IEP ($373) ($1,194) ($1,128) ($309) Adjusted EBITDA: Investment ($385) ($1,100) ($1,257) ($506) Automotive 630 651 828 833 Energy 716 755 313 385 Metals (15) (29) (15) (2) Railcar 415 492 458 435 Gaming 99 142 118 116 Mining 0 (9) 2 22 Food Packaging 66 59 55 57 Real Estate 46 45 41 41 Home Fashion 5 6 (1) (4) Holding Company (155) (10) (1) (12) Consolidated Adjusted EBITDA $1,422 $1,002 $541 $1,365 Less: Adjusted EBITDA attrib. to NCI (404) (72) 289 (53) Adjusted EBITDA attrib. to IEP $1,018 $930 $830 $1,312 Capital Expenditures $1,411 $1,359 $826 $847 FYE December 31,
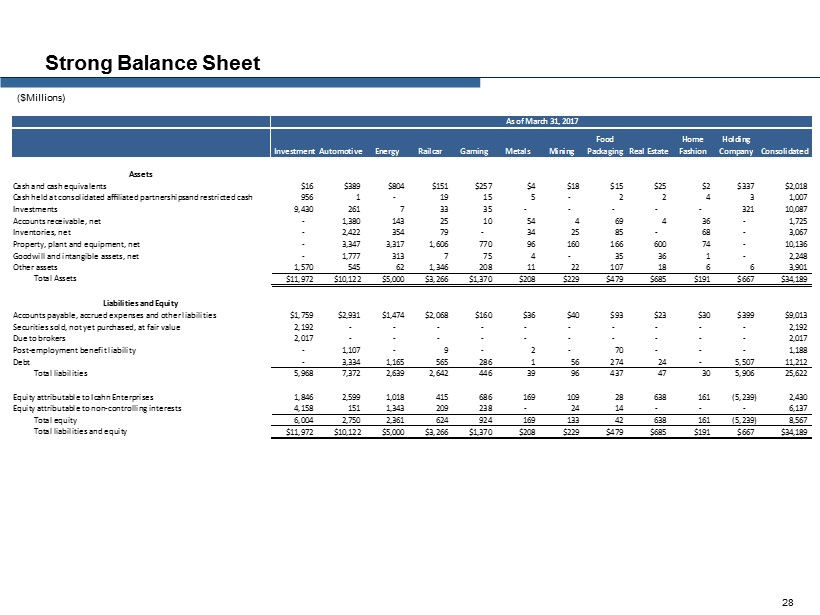
Strong Balance Sheet ($Millions) 28 InvestmentAutomotive Energy Railcar Gaming Metals Mining Food Packaging Real Estate Home Fashion Holding Company Consolidated Assets Cash and cash equivalents $16 $389 $804 $151 $257 $4 $18 $15 $25 $2 $337 $2,018 Cash held at consolidated affiliated partnerships and restricted cash 956 1 - 19 15 5 - 2 2 4 3 1,007 Investments 9,430 261 7 33 35 - - - - - 321 10,087 Accounts receivable, net - 1,380 143 25 10 54 4 69 4 36 - 1,725 Inventories, net - 2,422 354 79 - 34 25 85 - 68 - 3,067 Property, plant and equipment, net - 3,347 3,317 1,606 770 96 160 166 600 74 - 10,136 Goodwill and intangible assets, net - 1,777 313 7 75 4 - 35 36 1 - 2,248 Other assets 1,570 545 62 1,346 208 11 22 107 18 6 6 3,901 Total Assets $11,972 $10,122 $5,000 $3,266 $1,370 $208 $229 $479 $685 $191 $667 $34,189 Liabilities and Equity Accounts payable, accrued expenses and other liabilities $1,759 $2,931 $1,474 $2,068 $160 $36 $40 $93 $23 $30 $399 $9,013 Securities sold, not yet purchased, at fair value 2,192 - - - - - - - - - - 2,192 Due to brokers 2,017 - - - - - - - - - - 2,017 Post-employment benefit liability - 1,107 - 9 - 2 - 70 - - - 1,188 Debt - 3,334 1,165 565 286 1 56 274 24 - 5,507 11,212 Total liabilities 5,968 7,372 2,639 2,642 446 39 96 437 47 30 5,906 25,622 Equity attributable to Icahn Enterprises 1,846 2,599 1,018 415 686 169 109 28 638 161 (5,239) 2,430 Equity attributable to non-controlling interests 4,158 151 1,343 209 238 - 24 14 - - - 6,137 Total equity 6,004 2,750 2,361 624 924 169 133 42 638 161 (5,239) 8,567 Total liabilities and equity $11,972 $10,122 $5,000 $3,266 $1,370 $208 $229 $479 $685 $191 $667 $34,189 As of March 31, 2017
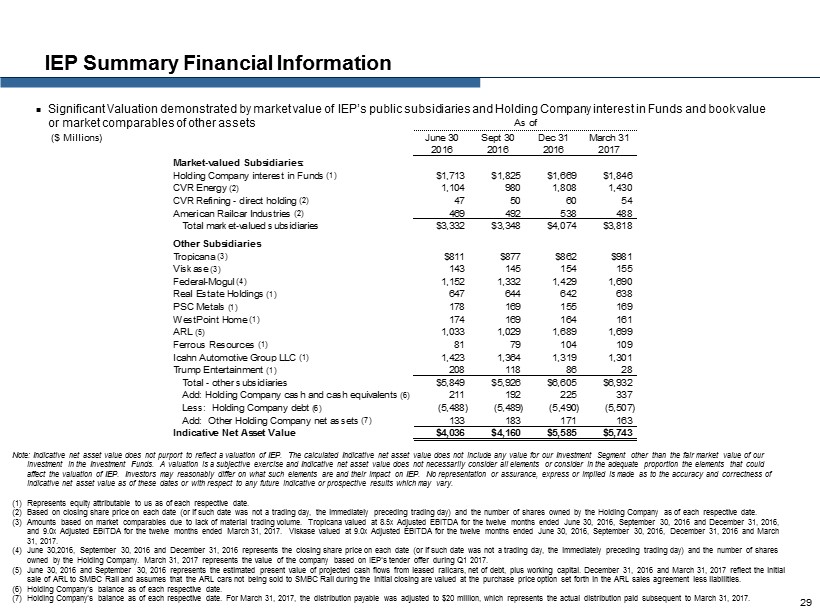
IEP Summary Financial Information Significant Valuation demonstrated by market value of IEP’s public subsidiaries and Holding Company interest in Funds and book value or market comparables of other assets 29 ($ Millions) Note: Indicative net asset value does not purport to reflect a valuation of IEP. The calculated Indicative net asset value d oes not include any value for our Investment Segment other than the fair market value of our investment in the Investment Funds. A valuation is a subjective exercise and Indicative net asset value does not necessarily co nsider all elements or consider in the adequate proportion the elements that could affect the valuation of IEP. Investors may reasonably differ on what such elements are and their impact on IEP. No represen tat ion or assurance, express or implied is made as to the accuracy and correctness of indicative net asset value as of these dates or with respect to any future indicative or prospective results which may vary. (1) Represents equity attributable to us as of each respective date. (2) Based on closing share price on each date (or if such date was not a trading day, the immediately preceding trading day) and the number of shares owned by the Holding Company as of each respective date. (3) Amounts based on market comparables due to lack of material trading volume. Tropicana valued at 8.5x Adjusted EBITDA for the twe lve months ended June 30, 2016, September 30, 2016 and December 31, 2016, and 9.0x Adjusted EBITDA for the twelve months ended March 31, 2017. Viskase valued at 9.0x Adjusted EBITDA for the twelve m ont hs ended June 30, 2016, September 30, 2016, December 31, 2016 and March 31, 2017. (4) June 30,2016, September 30, 2016 and December 31, 2016 represents the closing share price on each date (or if such date was n ot a trading day, the immediately preceding trading day) and the number of shares owned by the Holding Company. March 31, 2017 represents the value of the company based on IEP’s tender offer during Q1 2017. (5) June 30, 2016 and September 30, 2016 represents the estimated present value of projected cash flows from leased railcars, net of debt, plus working capital. December 31, 2016 and March 31, 2017 reflect the initial sale of ARL to SMBC Rail and assumes that the ARL cars not being sold to SMBC Rail during the initial closing are valued at t he purchase price option set forth in the ARL sales agreement less liabilities. (6) Holding Company’s balance as of each respective date. (7) Holding Company’s balance as of each respective date. For March 31, 2017, the distribution payable was adjusted to $20 millio n, which represents the actual distribution paid subsequent to March 31, 2017. June 30 Sept 30 Dec 31 March 31 2016 2016 2016 2017 Market-valued Subsidiaries: Holding Company interest in Funds (1) $1,713 $1,825 $1,669 $1,846 CVR Energy (2) 1,104 980 1,808 1,430 CVR Refining - direct holding (2) 47 50 60 54 American Railcar Industries (2) 469 492 538 488 Total market-valued subsidiaries $3,332 $3,348 $4,074 $3,818 Other Subsidiaries Tropicana (3) $811 $877 $862 $981 Viskase (3) 143 145 154 155 Federal-Mogul (4) 1,152 1,332 1,429 1,690 Real Estate Holdings (1) 647 644 642 638 PSC Metals (1) 178 169 155 169 WestPoint Home (1) 174 169 164 161 ARL (5) 1,033 1,029 1,689 1,699 Ferrous Resources (1) 81 79 104 109 Icahn Automotive Group LLC (1) 1,423 1,364 1,319 1,301 Trump Entertainment (1) 208 118 86 28 Total - other subsidiaries $5,849 $5,926 $6,605 $6,932 Add: Holding Company cash and cash equivalents (6) 211 192 225 337 Less: Holding Company debt (6) (5,488) (5,489) (5,490) (5,507) Add: Other Holding Company net assets (7) 133 183 171 163 Indicative Net Asset Value $4,036 $4,160 $5,585 $5,743 As of
Appendix — Adjusted EBITDA Reconciliations 30
Non - GAAP Financial Measures 31 The Company uses certain non - GAAP financial measures in evaluating its performance . These include non - GAAP EBITDA and Adjusted EBITDA . EBITDA represents earnings before interest expense, income tax (benefit) expense and depreciation and amortization . We define Adjusted EBITDA as EBITDA excluding the effects of impairment, restructuring costs, certain pension plan expenses, OPEB curtailment gains, purchase accounting inventory adjustments, certain share - based compensation, discontinued operations, gains/losses on extinguishment of debt, major scheduled turnaround expenses, FIFO adjustments and unrealized gains/losses on energy segment derivatives and certain other non - operational charges . We present EBITDA and Adjusted EBITDA a consolidated basis and attributable to Icahn Enterprises net of the effect of non - controlling interests . We conduct substantially all of our operations through subsidiaries . The operating results of our subsidiaries may not be sufficient to make distributions to us . In addition, our subsidiaries are not obligated to make funds available to us for payment of our indebtedness, payment of distributions on our depositary units or otherwise, and distributions and intercompany transfers from our subsidiaries to us may be restricted by applicable law or covenants contained in debt agreements and other agreements to which these subsidiaries currently may be subject or into which they may enter into in the future . The terms of any borrowings of our subsidiaries or other entities in which we own equity may restrict dividends, distributions or loans to us . We believe that providing EBITDA and Adjusted EBITDA to investors has economic substance as these measures provide important supplemental information of our performance to investors and permits investors and management to evaluate the core operating performance of our business without regard to interest, taxes and depreciation and amortization and the effects of impairment, restructuring costs, certain pension plan expenses, OPEB curtailment gains, purchase accounting inventory adjustments, certain share - based compensation, discontinued operations, gains/losses on extinguishment of debt, major scheduled turnaround expenses, FIFO adjustments and unrealized gains/losses on energy segment derivatives and certain other non - operational charges . Additionally, we believe this information is frequently used by securities analysts, investors and other interested parties in the evaluation of companies that have issued debt . Management uses, and believes that investors benefit from referring to these non - GAAP financial measures in assessing our operating results, as well as in planning, forecasting and analyzing future periods . Adjusting earnings for these charges allows investors to evaluate our performance from period to period, as well as our peers, without the effects of certain items that may vary depending on accounting methods and the book value of assets . Additionally, EBITDA and Adjusted EBITDA present meaningful measures of performance exclusive of our capital structure and the method by which assets were acquired and financed . EBITDA and Adjusted EBITDA have limitations as analytical tools, and you should not consider them in isolation, or as substitutes for analysis of our results as reported under generally accepted accounting principles in the United States, or U . S . GAAP . For example, EBITDA and Adjusted EBITDA : • do not reflect our cash expenditures, or future requirements for capital expenditures, or contractual commitments ; • do not reflect changes in, or cash requirements for, our working capital needs ; and • do not reflect the significant interest expense, or the cash requirements necessary to service interest or principal payments on our debt . Although depreciation and amortization are non - cash charges, the assets being depreciated or amortized often will have to be replaced in the future, and EBITDA and Adjusted EBITDA do not reflect any cash requirements for such replacements . Other companies in the industries in which we operate may calculate EBITDA and Adjusted EBITDA differently than we do, limiting their usefulness as comparative measures . In addition, EBITDA and Adjusted EBITDA do not reflect the impact of earnings or charges resulting from matters we consider not to be indicative of our ongoing operations . EBITDA and Adjusted EBITDA are not measurements of our financial performance under U . S . GAAP and should not be considered as alternatives to net income or any other performance measures derived in accordance with U . S . GAAP or as alternatives to cash flow from operating activities as a measure of our liquidity . Given these limitations, we rely primarily on our U . S . GAAP results and use EBITDA and Adjusted EBITDA only as a supplemental measure of our financial performance .
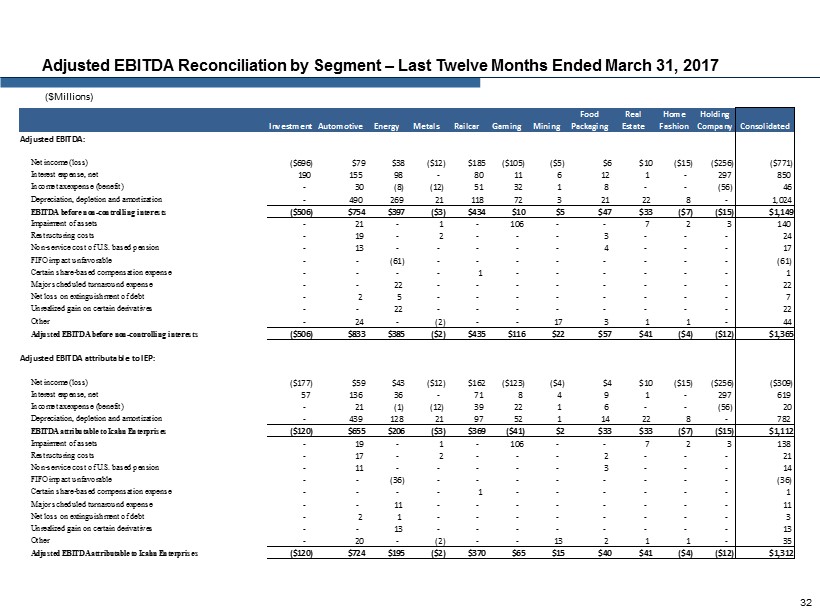
Adjusted EBITDA Reconciliation by Segment – Last Twelve Months Ended March 31, 2017 ($Millions) 32 Investment Automotive Energy Metals Railcar Gaming Mining Food Packaging Real Estate Home Fashion Holding Company Consolidated Adjusted EBITDA: Net income (loss) ($696) $79 $38 ($12) $185 ($105) ($5) $6 $10 ($15) ($256) ($771) Interest expense, net 190 155 98 - 80 11 6 12 1 - 297 850 Income tax expense (benefit) - 30 (8) (12) 51 32 1 8 - - (56) 46 Depreciation, depletion and amortization - 490 269 21 118 72 3 21 22 8 - 1,024 EBITDA before non-controlling interests ($506) $754 $397 ($3) $434 $10 $5 $47 $33 ($7) ($15) $1,149 Impairment of assets - 21 - 1 - 106 - - 7 2 3 140 Restructuring costs - 19 - 2 - - - 3 - - - 24 Non-service cost of U.S. based pension - 13 - - - - - 4 - - - 17 FIFO impact unfavorable - - (61) - - - - - - - - (61) Certain share-based compensation expense - - - - 1 - - - - - - 1 Major scheduled turnaround expense - - 22 - - - - - - - - 22 Net loss on extinguishment of debt - 2 5 - - - - - - - - 7 Unrealized gain on certain derivatives - - 22 - - - - - - - - 22 Other - 24 - (2) - - 17 3 1 1 - 44 Adjusted EBITDA before non-controlling interests ($506) $833 $385 ($2) $435 $116 $22 $57 $41 ($4) ($12) $1,365 Adjusted EBITDA attributable to IEP: Net income (loss) ($177) $59 $43 ($12) $162 ($123) ($4) $4 $10 ($15) ($256) ($309) Interest expense, net 57 136 36 - 71 8 4 9 1 - 297 619 Income tax expense (benefit) - 21 (1) (12) 39 22 1 6 - - (56) 20 Depreciation, depletion and amortization - 439 128 21 97 52 1 14 22 8 - 782 EBITDA attributable to Icahn Enterprises ($120) $655 $206 ($3) $369 ($41) $2 $33 $33 ($7) ($15) $1,112 Impairment of assets - 19 - 1 - 106 - - 7 2 3 138 Restructuring costs - 17 - 2 - - - 2 - - - 21 Non-service cost of U.S. based pension - 11 - - - - - 3 - - - 14 FIFO impact unfavorable - - (36) - - - - - - - - (36) Certain share-based compensation expense - - - - 1 - - - - - - 1 Major scheduled turnaround expense - - 11 - - - - - - - - 11 Net loss on extinguishment of debt - 2 1 - - - - - - - - 3 Unrealized gain on certain derivatives - - 13 - - - - - - - - 13 Other - 20 - (2) - - 13 2 1 1 - 35 Adjusted EBITDA attributable to Icahn Enterprises ($120) $724 $195 ($2) $370 $65 $15 $40 $41 ($4) ($12) $1,312
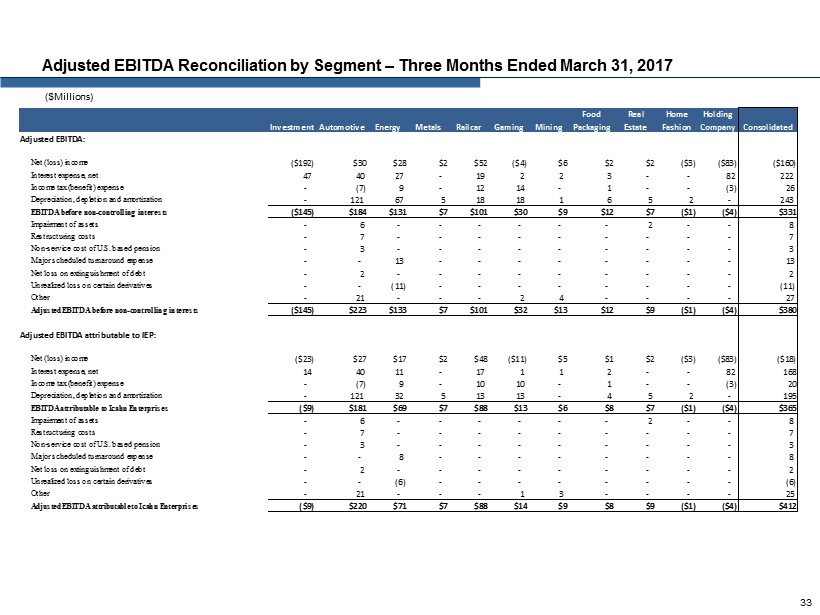
Adjusted EBITDA Reconciliation by Segment – Three Months Ended March 31, 2017 ($Millions) 33 Investment Automotive Energy Metals Railcar Gaming Mining Food Packaging Real Estate Home Fashion Holding Company Consolidated Adjusted EBITDA: Net (loss) income ($192) $30 $28 $2 $52 ($4) $6 $2 $2 ($3) ($83) ($160) Interest expense, net 47 40 27 - 19 2 2 3 - - 82 222 Income tax (benefit) expense - (7) 9 - 12 14 - 1 - - (3) 26 Depreciation, depletion and amortization - 121 67 5 18 18 1 6 5 2 - 243 EBITDA before non-controlling interests ($145) $184 $131 $7 $101 $30 $9 $12 $7 ($1) ($4) $331 Impairment of assets - 6 - - - - - - 2 - - 8 Restructuring costs - 7 - - - - - - - - - 7 Non-service cost of U.S. based pension - 3 - - - - - - - - - 3 Major scheduled turnaround expense - - 13 - - - - - - - - 13 Net loss on extinguishment of debt - 2 - - - - - - - - - 2 Unrealized loss on certain derivatives - - (11) - - - - - - - - (11) Other - 21 - - - 2 4 - - - - 27 Adjusted EBITDA before non-controlling interests ($145) $223 $133 $7 $101 $32 $13 $12 $9 ($1) ($4) $380 Adjusted EBITDA attributable to IEP: Net (loss) income ($23) $27 $17 $2 $48 ($11) $5 $1 $2 ($3) ($83) ($18) Interest expense, net 14 40 11 - 17 1 1 2 - - 82 168 Income tax (benefit) expense - (7) 9 - 10 10 - 1 - - (3) 20 Depreciation, depletion and amortization - 121 32 5 13 13 - 4 5 2 - 195 EBITDA attributable to Icahn Enterprises ($9) $181 $69 $7 $88 $13 $6 $8 $7 ($1) ($4) $365 Impairment of assets - 6 - - - - - - 2 - - 8 Restructuring costs - 7 - - - - - - - - - 7 Non-service cost of U.S. based pension - 3 - - - - - - - - - 3 Major scheduled turnaround expense - - 8 - - - - - - - - 8 Net loss on extinguishment of debt - 2 - - - - - - - - - 2 Unrealized loss on certain derivatives - - (6) - - - - - - - - (6) Other - 21 - - - 1 3 - - - - 25 Adjusted EBITDA attributable to Icahn Enterprises ($9) $220 $71 $7 $88 $14 $9 $8 $9 ($1) ($4) $412
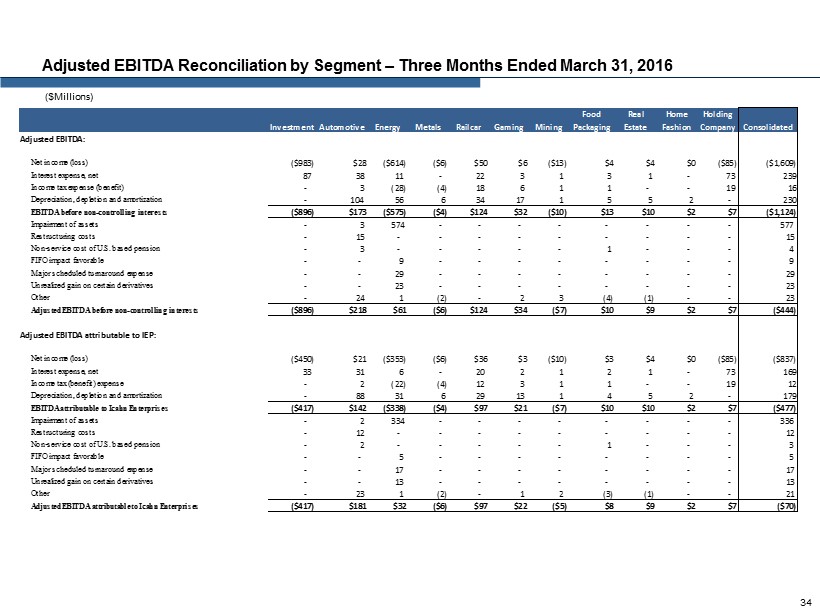
Adjusted EBITDA Reconciliation by Segment – Three Months Ended March 31, 2016 ($Millions) 34 Investment Automotive Energy Metals Railcar Gaming Mining Food Packaging Real Estate Home Fashion Holding Company Consolidated Adjusted EBITDA: Net income (loss) ($983) $28 ($614) ($6) $50 $6 ($13) $4 $4 $0 ($85) ($1,609) Interest expense, net 87 38 11 - 22 3 1 3 1 - 73 239 Income tax expense (benefit) - 3 (28) (4) 18 6 1 1 - - 19 16 Depreciation, depletion and amortization - 104 56 6 34 17 1 5 5 2 - 230 EBITDA before non-controlling interests ($896) $173 ($575) ($4) $124 $32 ($10) $13 $10 $2 $7 ($1,124) Impairment of assets - 3 574 - - - - - - - - 577 Restructuring costs - 15 - - - - - - - - - 15 Non-service cost of U.S. based pension - 3 - - - - - 1 - - - 4 FIFO impact favorable - - 9 - - - - - - - - 9 Major scheduled turnaround expense - - 29 - - - - - - - - 29 Unrealized gain on certain derivatives - - 23 - - - - - - - - 23 Other - 24 1 (2) - 2 3 (4) (1) - - 23 Adjusted EBITDA before non-controlling interests ($896) $218 $61 ($6) $124 $34 ($7) $10 $9 $2 $7 ($444) Adjusted EBITDA attributable to IEP: Net income (loss) ($450) $21 ($353) ($6) $36 $3 ($10) $3 $4 $0 ($85) ($837) Interest expense, net 33 31 6 - 20 2 1 2 1 - 73 169 Income tax (benefit) expense - 2 (22) (4) 12 3 1 1 - - 19 12 Depreciation, depletion and amortization - 88 31 6 29 13 1 4 5 2 - 179 EBITDA attributable to Icahn Enterprises ($417) $142 ($338) ($4) $97 $21 ($7) $10 $10 $2 $7 ($477) Impairment of assets - 2 334 - - - - - - - - 336 Restructuring costs - 12 - - - - - - - - - 12 Non-service cost of U.S. based pension - 2 - - - - - 1 - - - 3 FIFO impact favorable - - 5 - - - - - - - - 5 Major scheduled turnaround expense - - 17 - - - - - - - - 17 Unrealized gain on certain derivatives - - 13 - - - - - - - - 13 Other - 23 1 (2) - 1 2 (3) (1) - - 21 Adjusted EBITDA attributable to Icahn Enterprises ($417) $181 $32 ($6) $97 $22 ($5) $8 $9 $2 $7 ($70)
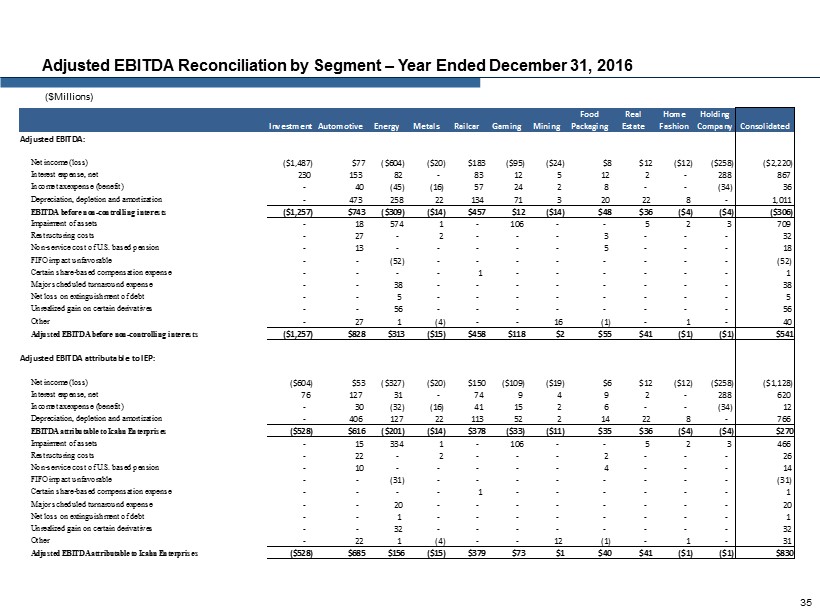
Adjusted EBITDA Reconciliation by Segment – Year Ended December 31, 2016 ($Millions) 35 Investment Automotive Energy Metals Railcar Gaming Mining Food Packaging Real Estate Home Fashion Holding Company Consolidated Adjusted EBITDA: Net income (loss) ($1,487) $77 ($604) ($20) $183 ($95) ($24) $8 $12 ($12) ($258) ($2,220) Interest expense, net 230 153 82 - 83 12 5 12 2 - 288 867 Income tax expense (benefit) - 40 (45) (16) 57 24 2 8 - - (34) 36 Depreciation, depletion and amortization - 473 258 22 134 71 3 20 22 8 - 1,011 EBITDA before non-controlling interests ($1,257) $743 ($309) ($14) $457 $12 ($14) $48 $36 ($4) ($4) ($306) Impairment of assets - 18 574 1 - 106 - - 5 2 3 709 Restructuring costs - 27 - 2 - - - 3 - - - 32 Non-service cost of U.S. based pension - 13 - - - - - 5 - - - 18 FIFO impact unfavorable - - (52) - - - - - - - - (52) Certain share-based compensation expense - - - - 1 - - - - - - 1 Major scheduled turnaround expense - - 38 - - - - - - - - 38 Net loss on extinguishment of debt - - 5 - - - - - - - - 5 Unrealized gain on certain derivatives - - 56 - - - - - - - - 56 Other - 27 1 (4) - - 16 (1) - 1 - 40 Adjusted EBITDA before non-controlling interests ($1,257) $828 $313 ($15) $458 $118 $2 $55 $41 ($1) ($1) $541 Adjusted EBITDA attributable to IEP: Net income (loss) ($604) $53 ($327) ($20) $150 ($109) ($19) $6 $12 ($12) ($258) ($1,128) Interest expense, net 76 127 31 - 74 9 4 9 2 - 288 620 Income tax expense (benefit) - 30 (32) (16) 41 15 2 6 - - (34) 12 Depreciation, depletion and amortization - 406 127 22 113 52 2 14 22 8 - 766 EBITDA attributable to Icahn Enterprises ($528) $616 ($201) ($14) $378 ($33) ($11) $35 $36 ($4) ($4) $270 Impairment of assets - 15 334 1 - 106 - - 5 2 3 466 Restructuring costs - 22 - 2 - - - 2 - - - 26 Non-service cost of U.S. based pension - 10 - - - - - 4 - - - 14 FIFO impact unfavorable - - (31) - - - - - - - - (31) Certain share-based compensation expense - - - - 1 - - - - - - 1 Major scheduled turnaround expense - - 20 - - - - - - - - 20 Net loss on extinguishment of debt - - 1 - - - - - - - - 1 Unrealized gain on certain derivatives - - 32 - - - - - - - - 32 Other - 22 1 (4) - - 12 (1) - 1 - 31 Adjusted EBITDA attributable to Icahn Enterprises ($528) $685 $156 ($15) $379 $73 $1 $40 $41 ($1) ($1) $830
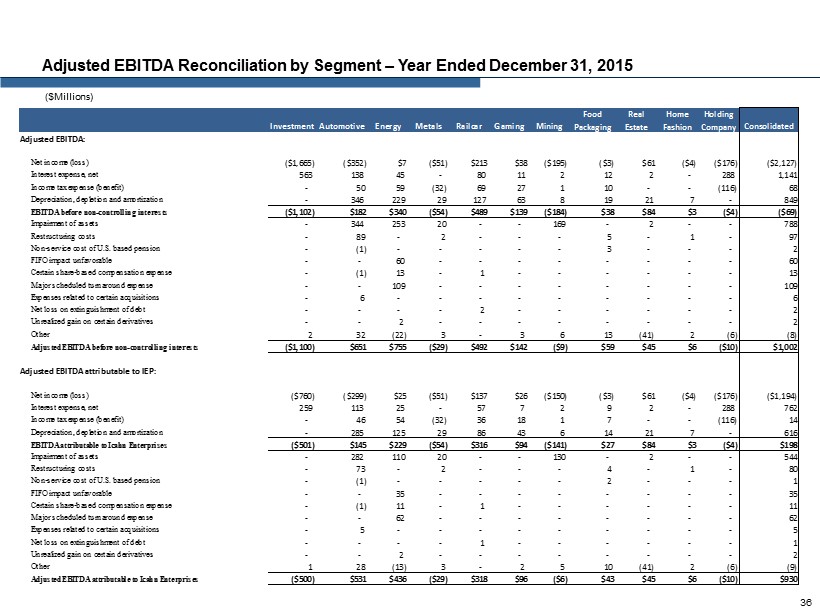
Adjusted EBITDA Reconciliation by Segment – Year Ended December 31, 2015 ($Millions) 36 Investment Automotive Energy Metals Railcar Gaming Mining Food Packaging Real Estate Home Fashion Holding Company Consolidated Adjusted EBITDA: Net income (loss) ($1,665) ($352) $7 ($51) $213 $38 ($195) ($3) $61 ($4) ($176) ($2,127) Interest expense, net 563 138 45 - 80 11 2 12 2 - 288 1,141 Income tax expense (benefit) - 50 59 (32) 69 27 1 10 - - (116) 68 Depreciation, depletion and amortization - 346 229 29 127 63 8 19 21 7 - 849 EBITDA before non-controlling interests ($1,102) $182 $340 ($54) $489 $139 ($184) $38 $84 $3 ($4) ($69) Impairment of assets - 344 253 20 - - 169 - 2 - - 788 Restructuring costs - 89 - 2 - - - 5 - 1 - 97 Non-service cost of U.S. based pension - (1) - - - - - 3 - - - 2 FIFO impact unfavorable - - 60 - - - - - - - - 60 Certain share-based compensation expense - (1) 13 - 1 - - - - - - 13 Major scheduled turnaround expense - - 109 - - - - - - - - 109 Expenses related to certain acquisitions - 6 - - - - - - - - - 6 Net loss on extinguishment of debt - - - - 2 - - - - - - 2 Unrealized gain on certain derivatives - - 2 - - - - - - - - 2 Other 2 32 (22) 3 - 3 6 13 (41) 2 (6) (8) Adjusted EBITDA before non-controlling interests ($1,100) $651 $755 ($29) $492 $142 ($9) $59 $45 $6 ($10) $1,002 Adjusted EBITDA attributable to IEP: Net income (loss) ($760) ($299) $25 ($51) $137 $26 ($150) ($3) $61 ($4) ($176) ($1,194) Interest expense, net 259 113 25 - 57 7 2 9 2 - 288 762 Income tax expense (benefit) - 46 54 (32) 36 18 1 7 - - (116) 14 Depreciation, depletion and amortization - 285 125 29 86 43 6 14 21 7 - 616 EBITDA attributable to Icahn Enterprises ($501) $145 $229 ($54) $316 $94 ($141) $27 $84 $3 ($4) $198 Impairment of assets - 282 110 20 - - 130 - 2 - - 544 Restructuring costs - 73 - 2 - - - 4 - 1 - 80 Non-service cost of U.S. based pension - (1) - - - - - 2 - - - 1 FIFO impact unfavorable - - 35 - - - - - - - - 35 Certain share-based compensation expense - (1) 11 - 1 - - - - - - 11 Major scheduled turnaround expense - - 62 - - - - - - - - 62 Expenses related to certain acquisitions - 5 - - - - - - - - - 5 Net loss on extinguishment of debt - - - - 1 - - - - - - 1 Unrealized gain on certain derivatives - - 2 - - - - - - - - 2 Other 1 28 (13) 3 - 2 5 10 (41) 2 (6) (9) Adjusted EBITDA attributable to Icahn Enterprises ($500) $531 $436 ($29) $318 $96 ($6) $43 $45 $6 ($10) $930
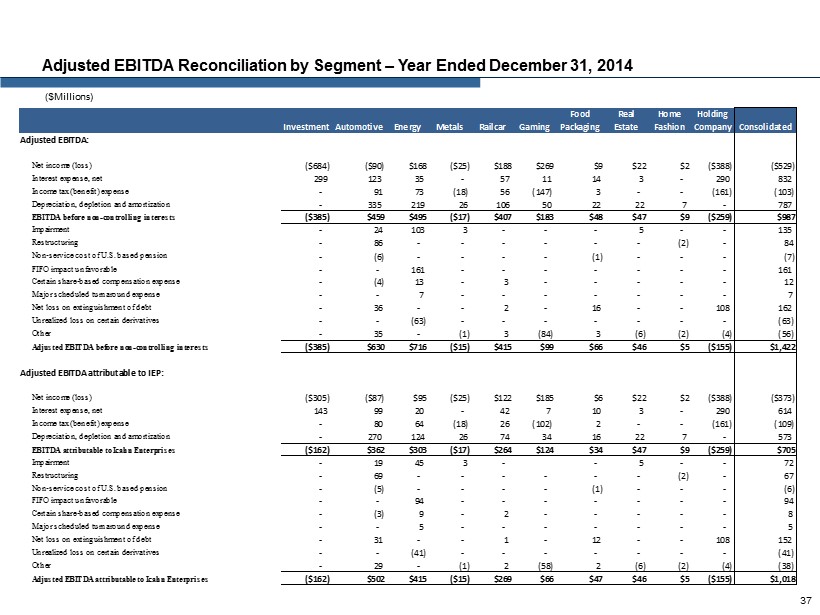
Adjusted EBITDA Reconciliation by Segment – Year Ended December 31, 2014 ($Millions) 37 Investment Automotive Energy Metals Railcar Gaming Food Packaging Real Estate Home Fashion Holding Company Consolidated Adjusted EBITDA: Net income (loss) ($684) ($90) $168 ($25) $188 $269 $9 $22 $2 ($388) ($529) Interest expense, net 299 123 35 - 57 11 14 3 - 290 832 Income tax (benefit) expense - 91 73 (18) 56 (147) 3 - - (161) (103) Depreciation, depletion and amortization - 335 219 26 106 50 22 22 7 - 787 EBITDA before non-controlling interests ($385) $459 $495 ($17) $407 $183 $48 $47 $9 ($259) $987 Impairment - 24 103 3 - - - 5 - - 135 Restructuring - 86 - - - - - - (2) - 84 Non-service cost of U.S. based pension - (6) - - - - (1) - - - (7) FIFO impact unfavorable - - 161 - - - - - - - 161 Certain share-based compensation expense - (4) 13 - 3 - - - - - 12 Major scheduled turnaround expense - - 7 - - - - - - - 7 Net loss on extinguishment of debt - 36 - - 2 - 16 - - 108 162 Unrealized loss on certain derivatives - - (63) - - - - - - - (63) Other - 35 - (1) 3 (84) 3 (6) (2) (4) (56) Adjusted EBITDA before non-controlling interests ($385) $630 $716 ($15) $415 $99 $66 $46 $5 ($155) $1,422 Adjusted EBITDA attributable to IEP: Net income (loss) ($305) ($87) $95 ($25) $122 $185 $6 $22 $2 ($388) ($373) Interest expense, net 143 99 20 - 42 7 10 3 - 290 614 Income tax (benefit) expense - 80 64 (18) 26 (102) 2 - - (161) (109) Depreciation, depletion and amortization - 270 124 26 74 34 16 22 7 - 573 EBITDA attributable to Icahn Enterprises ($162) $362 $303 ($17) $264 $124 $34 $47 $9 ($259) $705 Impairment - 19 45 3 - - 5 - - 72 Restructuring - 69 - - - - - - (2) - 67 Non-service cost of U.S. based pension - (5) - - - - (1) - - - (6) FIFO impact unfavorable - - 94 - - - - - - - 94 Certain share-based compensation expense - (3) 9 - 2 - - - - - 8 Major scheduled turnaround expense - - 5 - - - - - - - 5 Net loss on extinguishment of debt - 31 - - 1 - 12 - - 108 152 Unrealized loss on certain derivatives - - (41) - - - - - - - (41) Other - 29 - (1) 2 (58) 2 (6) (2) (4) (38) Adjusted EBITDA attributable to Icahn Enterprises ($162) $502 $415 ($15) $269 $66 $47 $46 $5 ($155) $1,018