Attached files
| file | filename |
|---|---|
| 8-K - CHINA FUND INC | fp0025922_8k.htm |

Data as of 4/30/17
Manager’s Commentary
Market Review
Greater China's stock market indices trended upwards in April, marking the fourth month of consecutive gain in 2017. Renewed concerns over economic growth dampened sentiment, as growth in China's manufacturing sector slowed faster than expected in April. The Caixin Manufacturing Purchasing Manager's Index ("PMI") fell to 50.5 in April from 51.2 in March, making it the weakest reading since September 2016. In addition, growth in China's services sector cooled in April to the slowest it's been in almost a year, as fears of slower economic growth dented business confidence, even as cost pressures eased. In the Hong Kong stock market, inflows from mainland China through the Stock Connect Schemes have helped push the index higher. These events have offset softer-than-expected economic readings in China. In Taiwan, supply chain names related to Apple Inc., continued to do well ahead of positive expectations on smartphone shipments.
Overall, the MSCI Golden Dragon Index gained 2.6% in April. The information technology and consumer discretionary sectors were the largest contributors; while the primary laggards were in the telecom services and energy sectors.
Fund Review
The China Fund, Inc. (the "Fund”) underperformed the benchmark in April, mainly due to weak stock selection within the financials sector.
Just as the cyclical rally seemed to have come to an end, our underweight in the cyclical sectors, including materials anc energy, helped relative performance.
Within the financials sector, our underweight position in AIA Group Limited ("AIA"), an Asia regional insurance provider, was our top detractor. While we like its well-recognized brand and superior management quality compared to Chinese insurers, we believe China's market is increasingly dominating AIA's growth. We find it difficult to justify its high valuation, which is almost twice as much as its counterparts in China. We therefore stand by our decision to not hold this security in our portfolio. Instead, we hold Ping an Insurance Group Company of China, one of the leading Chinese insurers with a more attractive valuation and good long-term growth potential.
On the positive side, three of the top five contributing stocks were underweight positions in cyclical stocks that have corrected meaningfully after their previous rally. Furthermore, our holding in Goldpac Group Ltd., a small-cap bank card manufacturer in China, also contributed to performance. This name was previously neglected by the market due to concerns over margin pressure, but a recent announcement showed a sequential improvement in company earnings with abundant cash on hand to support dividend payouts, leading to the share price reacting positively.
Key Transactions
We continue to add to China Mengniu Dairy Company Ltd., a leading dairy product provider in Hong Kong. We like the new management's commitment to turning around the business through revamping the product mix along with improving the operating efficiency of the company. We have also been adding to JD.com ("JD"), an e-commerce player competitive with Alibaba Group Holding Company ("Alibaba").
Outlook
With the economic and political situation in China providing few surprises this year, especially ahead of the National Congress in Q3, we believe the China equity market is likely to consolidate its year-to-date gains in the near-term. It is good news that China and Hong Kong equities remain one of the most under-owned emerging markets; therefore medium term positive catalysts, such as encouraging reform progress or visible improvement in company fundamentals, should help bring fund flow back to this market and help with valuation re-rating.
One noticeable portfolio change we made over the past month was introducing new names to the Chinese internet space in addition to the two leaders, Tencent Holdings Ltd. and Alibaba. These two stocks have become too big in the benchmark (25%), therefore difficult for active funds to generate alpha under the holding restrictions. Specifically, we have added to JD, as discussed above.
Supporting our positioning in the internet space is our positive view on China's consumption upgrade over the next couple of years. There will be huge opportunities for industries such as entertainment, consumer, and technology. At the same time, high-end manufacturing will remain one important driver of China's global competitiveness. For example, the top three categories of exports in 2016 were phone systems including smartphones, computers and integrated circuits. With China's commitment to research and development to enhance national productivity, we believe this trend is set to continue. We capture this trend through software services, semiconductor, and automation companies in the portfolio.
|
In Brief
|
|
|
Fund Data
|
|
|
Description
|
Seeks to achieve long-term capital appreciation through investments in China companies.
|
|
Listing Date (NYSE)
|
July 10, 1992
|
|
Total Fund Assets (millions)
|
$305.2
|
|
Median Market Cap (in billions)
|
$8.7
|
|
Distribution Frequency
|
Annual
|
|
Management Firm
|
Allianz Global Investors U.S. LLC
|
|
Portfolio Management
|
Christina Chung, CFA, CMA Lead Portfolio Manager
|
|
Performance (US$ Returns)
(as of 4/30/17)
|
||
|
Fund
|
Benchmark1
|
|
|
One Month
|
1.46%
|
2.60%
|
|
Three Month
|
5.15%
|
8.59%
|
|
One Year
|
19.21%
|
24.95%
|
|
Three Year
|
5.47%
|
8.32%
|
|
Net Asset Value / Market Price
|
|
|
Net Asset Value (NAV) / Market Price at Inception
|
$13.15 / $14.26
|
|
NAV / Market Price (as of 4/30/17)
|
$19.41 / $17.59
|
|
High / Low Ranges (52-Week)
|
|
|
High / Low NAV
|
$19.61 / $15.69
|
|
High / Low Market Price
|
$17.59 / $13.54
|
|
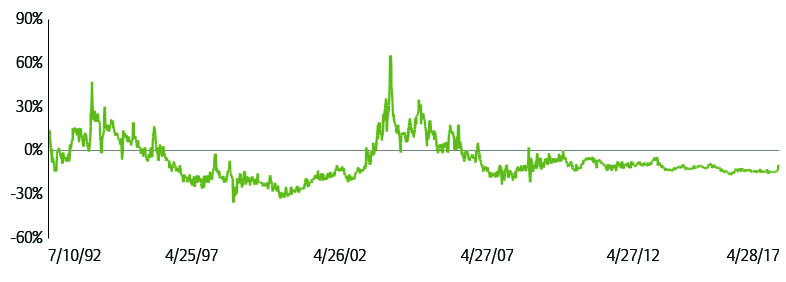
Premium/Discount to NAV (as of 4/30/17)
|
-9.38%
|
|
Fund Data (Common Shares)
|
|
|
Shares Outstanding
|
15,722,675
|
|
Average Daily Volume
|
29,546
|
|
Expense Ratio
|
1.53%
|
Fund Manager

Christina Chung, CFA, CMA
Lead Portfolio Manager
1. MSCI Golden Dragon Index.
The China Fund, Inc.
Proposed Manager Change
On March 31, 2017, the Fund announced that its Board of Directors had selected Open Door Investment Management, Ltd. ("Open Door") to become its Investment Manager, subject to stockholder approval at a Special Meeting of Stockholders expected to be held in June. Open Door, with offices in Shanghai and San Francisco, will provide the Fund with a Greater China investment strategy that focuses more on smaller capitalization and entrepreneurial companies than do most other investment funds investing in the Greater China markets. Open Door believes that this strategy will differentiate the Fund from other closed- end funds and exchange-traded funds, with index-anchored, large-capitalization approaches to investing in Greater China.
Investment Objective
The investment objective of the Fund is to achieve long-term capital appreciation. The Fund seeks to achieve its objective through investment in the equity securities of companies and other entities with significant assets, investments, production activities, trading or other business interests in China or which derive a significant part of their revenue from China.
The Fund has an operating policy that the Fund will invest at least 80% of its assets in China companies. For this purpose, 'China companies' are (i) companies for which the principal securities trading market is in China; (ii) companies for which the principal securities trading market is outside of China or in companies organized outside of China, that in both cases derive at least 50% of their revenues from goods or services sold or produced, or have at least 50% of their assets in China; or (iii) companies organized in China. Under the policy, China means the People's Republic of China, including Hong Kong, and Taiwan. The Fund will provide its stockholders with at least 60 days' prior notice of any change to this policy.
|
Returns For Periods Ended April 30, 2017*
|
||||||||
|
1 Month
|
3 Month
|
YTD
|
1 Year
|
3 Year
|
5 Year
|
10 Year
|
Inception
|
|
|
NAV
|
1.46% |
5.15%
|
11.49%
|
19.21%
|
5.47%
|
7.09%
|
7.26%
|
10.13%
|
|
Market Price
|
5.84% |
11.75%
|
16.88%
|
24.15%
|
6.31%
|
6.94%
|
8.04%
|
9.33%
|
|
MSCI Golden Dragon Index
|
2.60% |
8.59%
|
15.68%
|
24.95%
|
8.32%
|
7.46%
|
5.75%
|
—
|
|
Calendar Year Returns
|
||||||||
|
2009
|
2010
|
2011
|
2012
|
2013
|
2014
|
2015
|
2016
|
|
|
NAV
|
72.83% |
27.26%
|
-24.37%
|
12.12%
|
18.31%
|
7.82%
|
-5.50%
|
0.59%
|
|
Market Price
|
72.19% |
23.60%
|
-27.51%
|
20.52%
|
12.70%
|
5.29%
|
-6.38%
|
-0.47%
|
|
MSCI Golden Dragon Index
|
67.12% |
13.60%
|
-18.35%
|
22.65%
|
7.25%
|
8.06%
|
-7.12%
|
5.75%
|
Past performance is not a guide to future returns.
|
*
|
Annualized for periods greater than one year.
|
Source: State Street Bank and Trust Company. Source for index data: MSCI as at April 30, 2017. Investment returns are historical and do not guarantee future results. Investment returns reflect changes in net asset value and market price per share during each period and assumes that dividends and capital gains distributions, if any, were reinvested. The net asset value (NAV) percentages are not an indication of the performance of a shareholder's investment in the Fund, which is based on market price. NAV performance includes the deduction of management fees and other expenses. Market price performance does not include the deduction of brokerage commissions and other expenses of trading shares and would be lower had such commissions and expenses been deducted. It is not possible to invest directly in an index.
Premium/Discount
|
Sector Allocation
|
||
|
Fund
|
Benchmark1
|
|
|
Information Technology
|
39.43%
|
34.08%
|
|
Financials
|
18.87%
|
24.39%
|
|
Industrials
|
10.92%
|
6.53%
|
|
Telecom Services
|
8.94%
|
5.02%
|
|
Real Estate
|
7.01%
|
7.97%
|
|
Consumer Discretionary
|
6.41%
|
8.50%
|
|
Energy
|
2.55%
|
3.38%
|
|
Consumer Staples
|
1.61%
|
2.14%
|
|
Health Care
|
1.08%
|
1.18%
|
|
Utilities
|
1.05%
|
3.83%
|
|
Materials
|
0.28%
|
2.98%
|
|
Other assets & liabilities
|
1.87%
|
0.00%
|
Source: IDS GmbH - Analysis and Reporting Services, a subsidiary of Allianz SE.
|
Country Allocation
|
Fund
|
Benchmark1
|
|
China
|
72.90%
|
75.36%
|
|
Hong Kong Red Chips
|
26.80%
|
9.00%
|
|
Hong Kong 'H' shares
|
15.66%
|
20.06%
|
|
Equity linked securities ('A' shares)
|
0.86%
|
0.00%
|
|
China 'A' & 'B' shares
|
0.00%
|
0.12%
|
|
Other Hong Kong securities
|
29.58%
|
31.66%
|
|
Others
|
0.00%
|
14.53%
|
|
Taiwan
|
25.23%
|
24.64%
|
|
Other assets & liabilities
|
1.87%
|
0.00%
|
|
Top 10 Holdings
|
|
|
TAIWAN SEMIC CO LTD (Taiwan)
|
9.17%
|
|
TENCENT HOLDINGS LTD (China)
|
7.80%
|
|
SUN HUNG KAI PROPERTIES LTD (H.K.)
|
5.57%
|
|
ALIBABA GROUP HOLDING LTD (China)
|
5.40%
|
|
CHINA MERCHANTS BANK CO LTD (China)
|
4.87%
|
|
PING AN INSURANCE (China)
|
3.53%
|
|
HK EXCHANGES & CLEARING LTD (H.K.)
|
3.39%
|
|
CHINA UNICOM HONG KONG LTD (China)
|
3.16%
|
|
LARGAN PRECISION CO LTD (Taiwan)
|
2.94%
|
|
CHINA CONSTRUCTION BANK CORP (China)
|
2.88%
|
|
Portfolio Characteristics
|
||
|
Fund
|
Benchmark1
|
|
|
P/E Ratio
|
14.40
|
13.73
|
|
P/B Ratio
|
1.63
|
1.48
|
|
Issues in Portfolio
|
48
|
283
|
|
Foreign Holdings (%)
|
98.13
|
100.00
|
|
Other assets & liabilities (%)
|
1.87
|
0.00
|
|
Yield (%)
|
2.54
|
2.62
|
Source: IDS GmbH - Analysis and Reporting Services, a subsidiary of Allianz SE.
1. MSCI Golden Dragon Index.
The China Fund, Inc.
Distribution History (10 Year)
|
Declaration
Date
|
Ex-dividend Date
|
Record Date
|
Payable Date
|
Distribution/
Share
|
Income
|
Long-term
Capital Gain
|
Short-term
Capital Gain
|
|
12/7/07
|
12/19/07
|
12/21/07
|
1/25/08
|
$12.12000
|
$0.28000
|
$9.00000
|
$2.84000
|
|
12/8/08
|
12/22/08
|
12/24/08
|
1/23/09
|
$5.81740
|
$0.48130
|
$5.33610
|
—
|
|
12/9/09
|
12/22/09
|
12/24/09
|
12/29/09
|
$0.25570
|
$0.25570
|
—
|
—
|
|
12/8/10
|
12/21/10
|
12/24/10
|
12/29/10
|
$2.27420
|
$0.37460
|
$1.89960
|
—
|
|
12/8/11
|
12/21/11
|
12/23/11
|
12/29/11
|
$2.99640
|
$0.17420
|
$2.82220
|
—
|
|
12/10/12
|
12/20/12
|
12/24/12
|
12/28/12
|
$3.25170
|
$0.34730
|
$2.90440
|
—
|
|
12/13/13
|
12/19/13
|
12/23/13
|
12/27/13
|
$3.31400
|
$0.43870
|
$2.87530
|
—
|
|
12/8/14
|
12/18/14
|
12/22/14
|
1/5/15
|
$3.76510
|
$0.29820
|
$3.46690
|
—
|
|
12/16/15
|
12/23/15
|
12/28/15
|
1/6/16
|
$1.49580
|
$0.21330
|
$0.84620
|
$0.43630
|
|
12/9/16
|
12/19/16
|
12/21/16
|
1/5/17
|
$0.46780
|
$0.46780
|
—
|
—
|
Distribution/Share includes Income, Long-term Capital gains and Short-term Capital gains.
The China Fund NAV Performance of $10,000 since inception
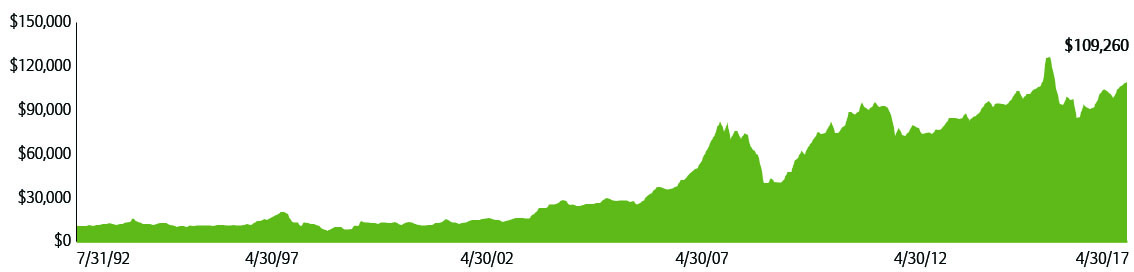
Past performance is not a guide to future returns.
Index Description
MSCI Golden Dragon Index
The MSCI Golden Dragon Index captures the equity market performance of large and mid cap China securities (H shares, B shares, Red-Chips and P-Chips) and non-domestic China securities listed in Hong Kong and Taiwan.
It is not possible to invest directly in an index.
The China Fund, Inc.
Portfolio in Full
|
Sector
|
Company
(exchange ticker)
|
Market Price
|
Holding
|
Value US$
|
% of net assets
|
|
Information Technology
|
39.42
|
||||
|
TAIWAN SEMICONDUCTOR MANUFACTURING CO LTD
|
2330
|
194.50
|
4,341,000
|
27,984,638
|
9.17
|
|
TENCENT HOLDINGS LTD
|
700
|
243.40
|
760,900
|
23,811,448
|
7.80
|
|
ALIBABA GROUP HOLDING LTD
|
BABA
|
115.50
|
142,647
|
16,475,729
|
5.40
|
|
LARGAN PRECISION CO LTD
|
3008
|
5,015.00
|
54,000
|
8,975,838
|
2.94
|
|
HON HAI PRECISION INDUSTRY CO LTD
|
2317
|
98.80
|
2,537,100
|
8,308,159
|
2.72
|
|
DELTA ELECTRONICS INC
|
2308
|
170.00
|
1,274,359
|
7,180,439
|
2.35
|
|
DIGITAL CHINA HOLDINGS LTD
|
861
|
6.40
|
7,444,000
|
6,125,252
|
2.01
|
|
ADVANTECH CO LTD
|
2395
|
244.00
|
703,841
|
5,692,128
|
1.87
|
|
BAIDU INC
|
BIDU
|
180.23
|
24,101
|
4,343,723
|
1.42
|
|
PRIMAX ELECTRONICS LTD
|
4915
|
50.30
|
1,985,000
|
3,309,320
|
1.08
|
|
SEMICONDUCTOR MANUFACTURING INTERNATIONAL CORP
|
981
|
9.86
|
2,470,900
|
3,132,346
|
1.03
|
|
YY INC
|
YY
|
48.97
|
62,990
|
3,084,620
|
1.01
|
|
GOLDPAC GROUP LTD
|
3315
|
2.95
|
5,021,000
|
1,904,364
|
0.62
|
|
Financials
|
18.86
|
||||
|
CHINA MERCHANTS BANK CO LTD
|
3968
|
20.20
|
5,723,500
|
14,864,514
|
4.87
|
|
PING AN INSURANCE GROUP CO OF CHINA LTD
|
2318
|
43.80
|
1,911,000
|
10,761,491
|
3.53
|
|
HONG KONG EXCHANGES & CLEARING LTD
|
388
|
191.60
|
419,700
|
10,338,847
|
3.39
|
|
CHINA CONSTRUCTION BANK CORP
|
939
|
6.32
|
10,814,000
|
8,787,009
|
2.88
|
|
CATHAY FINANCIAL HOLDING CO LTD
|
2882
|
48.40
|
2,880,000
|
4,620,066
|
1.51
|
|
FUBON FINANCIAL HOLDING CO LTD
|
2881
|
47.30
|
2,805,000
|
4,397,484
|
1.44
|
|
CITIC SECURITIES CO LTD
|
6030
|
16.32
|
1,810,000
|
3,797,837
|
1.24
|
|
Industrials
|
10.92
|
||||
|
CHINA EVERBRIGHT INTERNATIONAL LTD
|
257
|
10.52
|
5,616,000
|
7,595,922
|
2.49
|
|
CN STATE CONSTRUCTION INTERNATIONAL HOLDINGS LTD
|
3311
|
14.12
|
2,906,000
|
5,275,553
|
1.73
|
|
CK HUTCHISON HOLDINGS LTD
|
1
|
97.15
|
310,000
|
3,872,061
|
1.27
|
|
KING SLIDE WORKS CO LTD
|
2059
|
464.50
|
239,000
|
3,679,543
|
1.21
|
|
BEIJING ENTERPRISES HOLDINGS LTD
|
392
|
38.00
|
704,500
|
3,441,932
|
1.13
|
|
JARDINE MATHESON HOLDINGS LTD
|
J36
|
64.53
|
51,100
|
3,297,483
|
1.08
|
|
QINGDAO PORT INTERNATIONAL CO LTD
|
6198
|
4.14
|
6,077,000
|
3,234,649
|
1.06
|
|
ZHUZHOU CRRC TIMES ELECTRIC CO LTD
|
3898
|
40.05
|
565,500
|
2,911,875
|
0.95
|
|
Telecom Services
|
8.94
|
||||
|
CHINA UNICOM HONG KONG LTD
|
762
|
10.04
|
7,466,000
|
9,637,388
|
3.16
|
|
CHINA MOBILE LTD
|
941
|
82.95
|
709,000
|
7,561,366
|
2.48
|
|
PCCW LTD
|
8
|
4.39
|
8,623,000
|
4,866,991
|
1.59
|
|
CHUNGHWA TELECOM CO LTD
|
2412
|
102.00
|
846,000
|
2,860,097
|
0.94
|
|
HUTCHISON TELECOMMUNICATIONS HK HOLDINGS LTD
|
215
|
2.30
|
7,974,000
|
2,357,989
|
0.77
|
|
Real Estate
|
7.01
|
||||
|
SUN HUNG KAI PROPERTIES LTD
|
16
|
116.70
|
1,132,000
|
16,984,585
|
5.57
|
|
CHINA OVERSEAS LAND & INVESTMENT LTD
|
688
|
22.60
|
1,516,000
|
4,404,994
|
1.44
|
|
Consumer Discretionary
|
6.41
|
||||
|
QINGLING MOTORS CO LTD
|
1122
|
2.57
|
19,178,000
|
6,336,860
|
2.08
|
|
JD.com
|
JD
|
35.07
|
159,569
|
5,596,085
|
1.83
|
|
SANDS CHINA LTD
|
1928
|
35.30
|
810,800
|
3,679,816
|
1.21
|
|
CITIGROUP GLOBAL MARKETS HOLD (exch. for CHINA CYTS TOURS HOLDIN)
|
N/A
|
2.96
|
888,827
|
2,630,928
|
0.86
|
|
LI & FUNG LTD
|
494
|
3.26
|
3,128,000
|
1,311,058
|
0.43
|
|
CNOOC LTD
|
883
|
9.07
|
4,815,000
|
5,614,890
|
1.84
|
|
CHINA OILFIELD SERVICES LTD
|
2883
|
7.18
|
2,338,000
|
2,158,274
|
0.71
|
|
Consumer Staples
|
1.62
|
||||
|
CHINA MENGNIU DAIRY CO LTD
|
2319
|
15.06
|
1,508,000
|
2,919,873
|
0.96
|
|
VINDA INTERNATIONAL HOLDINGS LTD
|
3331
|
15.80
|
984,000
|
1,998,894
|
0.66
|
The China Fund, Inc.
Portfolio in Full
|
Sector
|
Company
(exchange ticker) |
Market Price
|
Holding
|
Value US$
|
% of net assets
|
|
Health Care
|
1.08
|
||||
|
CSPC PHARMACEUTICAL GROUP LTD
|
1093
|
10.80
|
2,364,000
|
3,282,531
|
1.08
|
|
Utilities
|
1.05
|
||||
|
CHINA RESOURCES POWER HOLDINGS CO LTD
|
836
|
14.02
|
1,778,000
|
3,204,922
|
1.05
|
|
Materials
|
0.30
|
||||
|
TIANGONG INTERNATIONAL CO LTD
|
826
|
0.77
|
8,612,000
|
852,575
|
0.28
|
|
CHINA EVERBRIGHT GREENTECH LTD
|
1257
|
5.96
|
69,333
|
53,123
|
0.02
|
Source: State Street Bank and Trust Company, IDS GmbH - Analysis and Reporting Services, a subsidiary of Allianz SE.
Important Information:
Holdings are subject to change daily. The Fund seeks to achieve its objective through investment in the equity securities of companies and other entities with significant assets, investments, production activities, trading or other business interests in China or which derive a significant part of their revenue from China. Investing in non-U.S. securities entails additional risks, including political and economic risk and the risk of currency fluctuations, as well as lower liquidity. These risks, which can result in greater price volatility, will generally be enhanced in less diversified funds that concentrate investments in a particular geographic region.
The information contained herein has been obtained from sources believed to be reliable but Allianz Global Investors U.S. LLC and its affiliates do not warrant the information to be accurate, complete or reliable. The opinions expressed herein are subject to change at any time and without notice. Past performance is not indicative of future results. This material is not intended as an offer or solicitation for the purchase or sale of any financial instrument. Investors should consider the investment objectives, risks, charges and expenses of any mutual fund carefully before investing. This and other information is contained in the Fund's annual and semiannual reports, proxy statement and other Fund information, which may be obtained by contacting your financial advisor or visiting the Fund's website at www.chinafundinc.com. This information is unaudited and is intended for informational purposes only. It is presented only to provide information on the Fund's holdings, performance and strategies. The Fund is a closed-end exchange traded management investment company. This material is presented only to provide information and is not intended for trading purposes. Closed-end funds, unlike open-end funds, are not continuously offered. After the initial public offering by a closed-end fund, its shares can be purchased and sold on the open market through a stock exchange, where shares may trade at a premium or a discount. The market price of holdings is subject to change daily.
P/E is a ratio of security price to earnings per share. Typically, an undervalued security is characterized by a low P/E ratio, while an overvalued security is characterized by a high P/E ratio. P/B is a ratio of the current stock price to the book value. This is used to identify undervalued stocks. Dividend yield is the annual percentage of return earned by an investor on a common or preferred stock. The average dividend yield is the dividend rate divided by current share price.
©2017 Allianz Global Investors Distributors LLC.
|
Investment Products: Not FDIC Insured | May Lose Value | Not Bank Guaranteed
|
FS-CHN-0417
|