Attached files
| file | filename |
|---|---|
| 8-K - FORM 8-K - Global Net Lease, Inc. | v467358_8k.htm |
Exhibit 99.1

May 2017 Investor Presentation
Table of Contents 2 Overview 3 Real Estate Portfolio 11 Results and Balance Sheet 16 Strategic Initiatives 23 Legal Notices 25
Overview 3
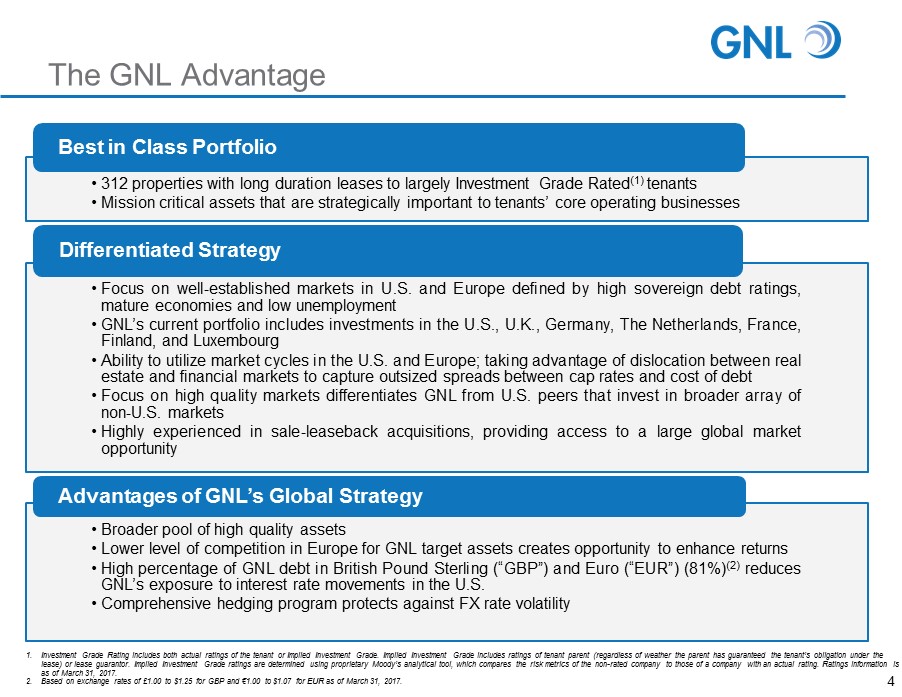
The GNL Advantage 4 • 312 properties with long duration leases to largely Investment Grade Rated ( 1 ) tenants • Mission critical assets that are strategically important to tenants’ core operating businesses Best in Class Portfolio • Focus on well - established markets in U . S . and Europe defined by high sovereign debt ratings, mature economies and low unemployment • GNL’s current portfolio includes investments in the U . S . , U . K . , Germany, The Netherlands, France, Finland, and Luxembourg • Ability to utilize market cycles in the U . S . and Europe ; taking advantage of dislocation between real estate and financial markets to capture outsized spreads between cap rates and cost of debt • Focus on high quality markets differentiates GNL from U . S . peers that invest in broader array of non - U . S . markets • Highly experienced in sale - leaseback acquisitions, providing access to a large global market opportunity Differentiated Strategy • Broader pool of high quality assets • Lower level of competition in Europe for GNL target assets creates opportunity to enhance returns • High percentage of GNL debt in British Pound Sterling (“GBP”) and Euro (“EUR”) ( 81 % ) ( 2 ) reduces GNL’s exposure to interest rate movements in the U . S . • Comprehensive hedging program protects against FX rate volatility Advantages of GNL’s Global Strategy 1. Investment Grade Rating includes both actual ratings of the tenant or Implied Investment Grade. Implied Investment Grade incl ude s ratings of tenant parent (regardless of weather the parent has guaranteed the tenant’s obligation under the lease) or lease guarantor. Implied Investment Grade ratings are determined using proprietary Moody’s analytical tool, which c omp ares the risk metrics of the non - rated company to those of a company with an actual rating. Ratings information is as of March 31, 2017. 2. Based on exchange rates of £1.00 to $1.25 for GBP and € 1.00 to $1.07 for EUR as of March 31, 2017.
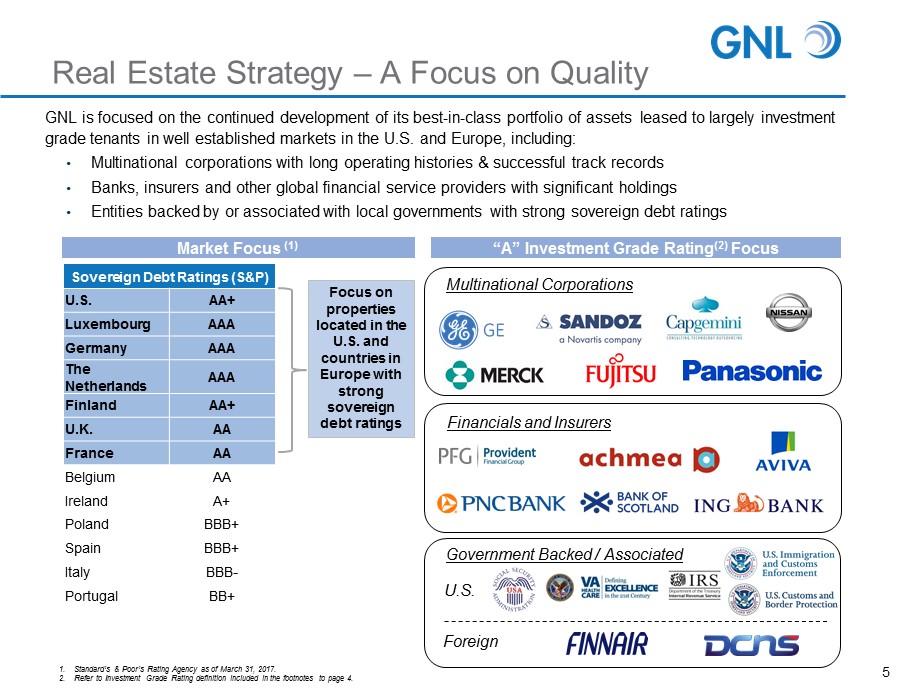
Real Estate Strategy – A Focus on Quality GNL is focused on the continued development of its best - in - class portfolio of assets leased to largely investment grade tenants in well established markets in the U.S. and Europe, including: • Multinational corporations with long operating histories & successful track records • Banks, insurers and other global financial service providers with significant holdings • Entities backed by or associated with local governments with strong sovereign debt ratings 5 Sovereign Debt Ratings (S&P) U.S. AA+ Luxembourg AAA Germany AAA The Netherlands AAA Finland AA+ U.K. AA France AA Belgium AA Ireland A+ Poland BBB+ Spain BBB+ Italy BBB - Portugal BB+ 1. Standard’s & Poor’s Rating Agency as of March 31, 2017. 2. Refer to Investment Grade Rating definition included in the footnotes to page 4. Focus on properties located in the U.S. and countries in Europe with strong sovereign debt ratings “A” Investment Grade Rating (2) Focus Market Focus (1) $2.4tn $4.5tn Multinational Corporations Financials and Insurers Government Backed / Associated U.S. Foreign

Company Highlights 6 High - Quality, Diversified Net Lease Portfolio Strong, Creditworthy Tenant Base with Attractive Lease Term Global Investment Strategy Experienced Management Team Flexible Balance Sheet • Diversified by asset type, geography, tenant and industry • Focus on single tenant, net lease, income producing, mission critical assets in the U.S., U.K., Germany, The Netherlands, France, Finland and Luxembourg • Investment grade rated tenants, inclusive of implied investment grade, make up 76.7% of portfolio rent (1)(2) • Weighted average remaining lease term of 9.5 years (3) providing reliable cash flows that include contractual and indexed rent growth • GNL has the strategic advantage to opportunistically invest in the broad pool of U.S. and European real estate markets • Management teams on both sides of the Atlantic with proven track record across multiple economic cycles • High - quality balance sheet with flexibility to fund growth from multiple sources 1. Refer to Investment Grade Rating definition included in the footnotes to page 4. 2. Weighted by annualized straight - line rent (“SLR”) converted from local currency into USD as of March 31, 2017 for the in - place l ease on the property on a straight - line basis, which includes tenant concessions such as free rent, as applicable. 3. Weighted average remaining lease term in years based on square feet as of March 31, 2017.
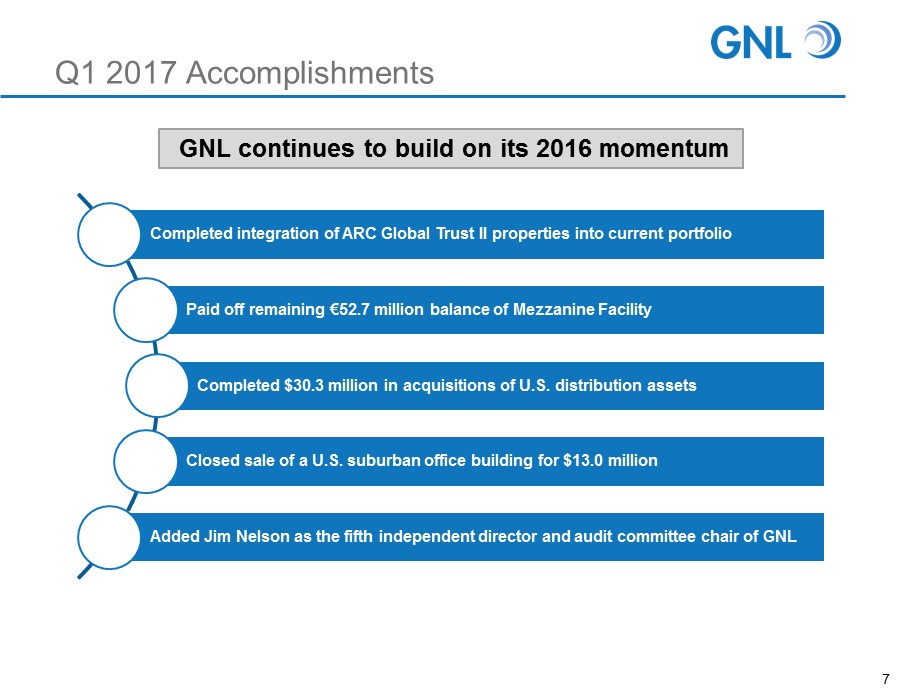
Completed integration of ARC Global Trust II properties into current portfolio Paid off remaining € 52.7 million balance of Mezzanine Facility Completed $30.3 million in acquisitions of U.S. distribution assets Closed sale of a U.S. suburban office building for $13.0 million Added Jim Nelson as the fifth independent director and audit committee chair of GNL Q1 2017 Accomplishments 7 GNL continues to build on its 2016 momentum
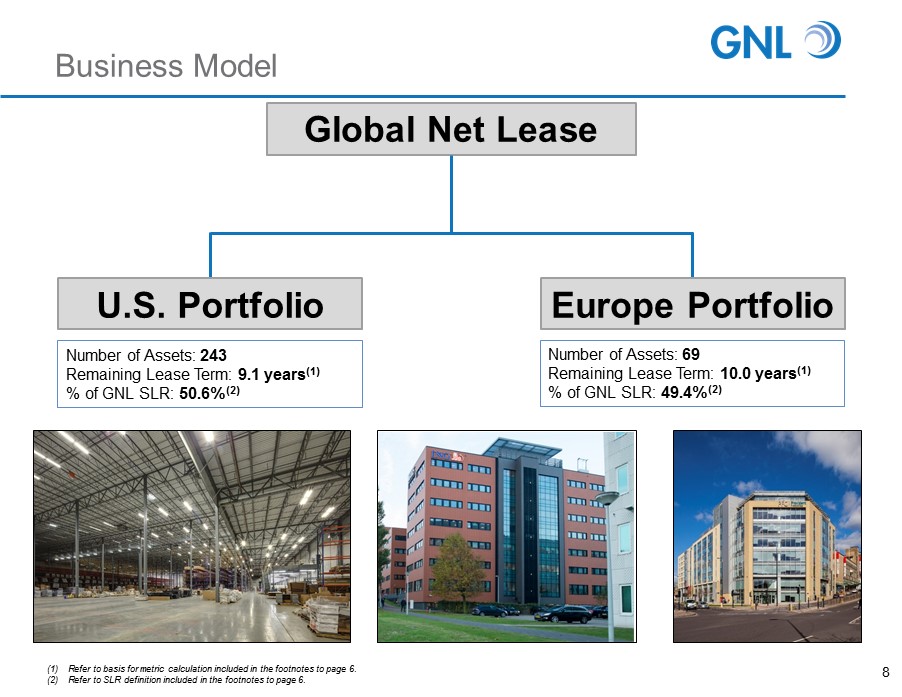
Business Model 8 Global Net Lease U.S. Portfolio Number of Assets: 243 Remaining Lease Term: 9.1 years (1) % of GNL SLR: 50.6% (2) Europe Portfolio Number of Assets: 69 Remaining Lease Term: 10.0 years (1) % of GNL SLR: 49.4% (2) (1) Refer to basis for metric calculation included in the footnotes to page 6. (2) Refer to SLR definition included in the footnotes to page 6.
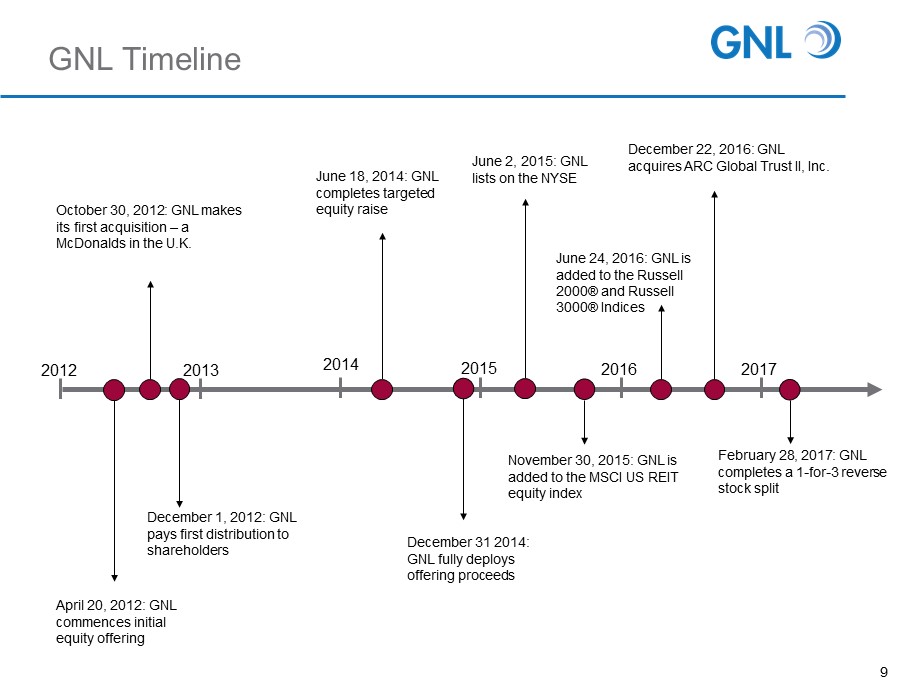
GNL Timeline October 30, 2012: GNL makes its first acquisition – a McDonalds in the U.K. 2013 June 18, 2014: GNL completes targeted equity raise 2014 2015 2016 2017 December 31 2014: GNL fully deploys offering proceeds November 30, 2015: GNL is added to the MSCI US REIT equity index December 22, 2016: GNL acquires ARC Global Trust II, Inc. February 28, 2017: GNL completes a 1 - for - 3 reverse stock split 2012 June 2, 2015: GNL lists on the NYSE June 24, 2016: GNL is added to the Russell 2000® and Russell 3000® Indices 9 April 20, 2012: GNL commences initial equity offering December 1, 2012: GNL pays first distribution to shareholders
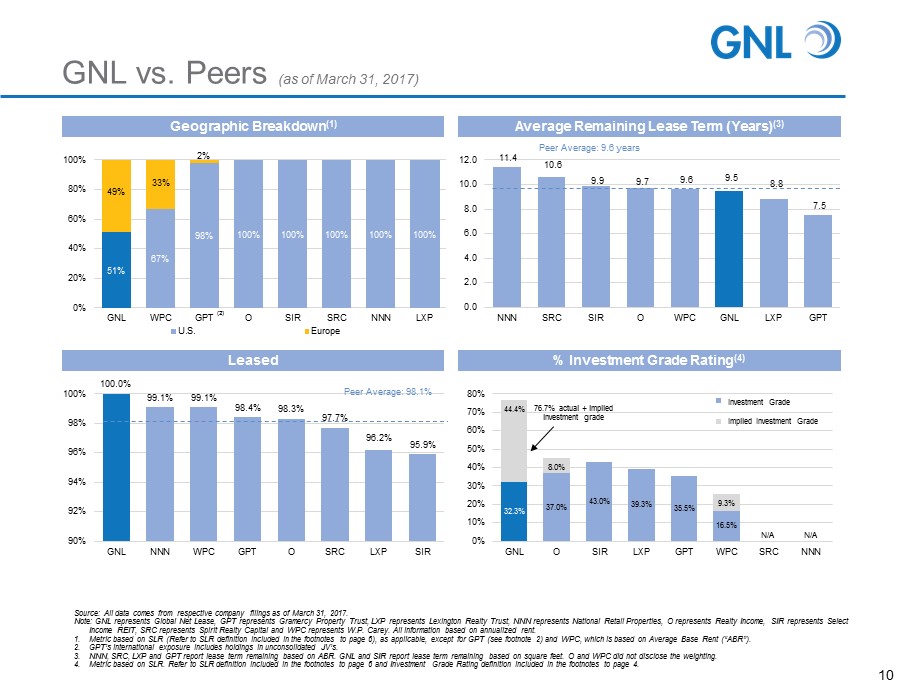
GNL vs. Peers (as of March 31, 2017) 51% 67% 98% 100% 100% 100% 100% 100% 0% 20% 40% 60% 80% 100% GNL WPC GPT O SIR SRC NNN LXP U.S. Europe 49% Geographic Breakdown (1) 11.4 10.6 9.9 9.7 9.6 9.5 8.8 7.5 0.0 2.0 4.0 6.0 8.0 10.0 12.0 NNN SRC SIR O WPC GNL LXP GPT Average Remaining Lease Term (Years) (3) 100.0% 99.1% 99.1% 98.4% 98.3% 97.7% 96.2% 95.9% 90% 92% 94% 96% 98% 100% GNL NNN WPC GPT O SRC LXP SIR Leased 32.3% 37.0% 43.0% 39.3% 35.5% 16.5% 44.4% 8.0% 9.3% 0% 10% 20% 30% 40% 50% 60% 70% 80% GNL O SIR LXP GPT WPC SRC NNN % Investment Grade Rating (4) Peer Average: 9.6 years Peer Average: 98.1% Source: All data comes from respective company filings as of March 31, 2017. Note: GNL represents Global Net Lease, GPT represents Gramercy Property Trust, LXP represents Lexington Realty Trust, NNN rep res ents National Retail Properties, O represents Realty Income, SIR represents Select Income REIT, SRC represents Spirit Realty Capital and WPC represents W.P. Carey. All information based on annualized rent. 1. Metric based on SLR (Refer to SLR definition included in the footnotes to page 6), as applicable, except for GPT (see footnot e 2 ) and WPC, which is based on Average Base Rent (“ABR”). 2. GPT’s international exposure includes holdings in unconsolidated JV’s. 3. NNN, SRC, LXP and GPT report lease term remaining based on ABR. GNL and SIR report lease term remaining based on square feet. O and WPC did not disclose the weighting. 4. Metric based on SLR. Refer to SLR definition included in the footnotes to page 6 and Investment Grade Rating definition inclu ded in the footnotes to page 4. (2) 10 Investment Grade Implied Investment Grade 76.7% actual + implied investment grade N/A N/A 33% 2%

Real Estate Portfolio 11
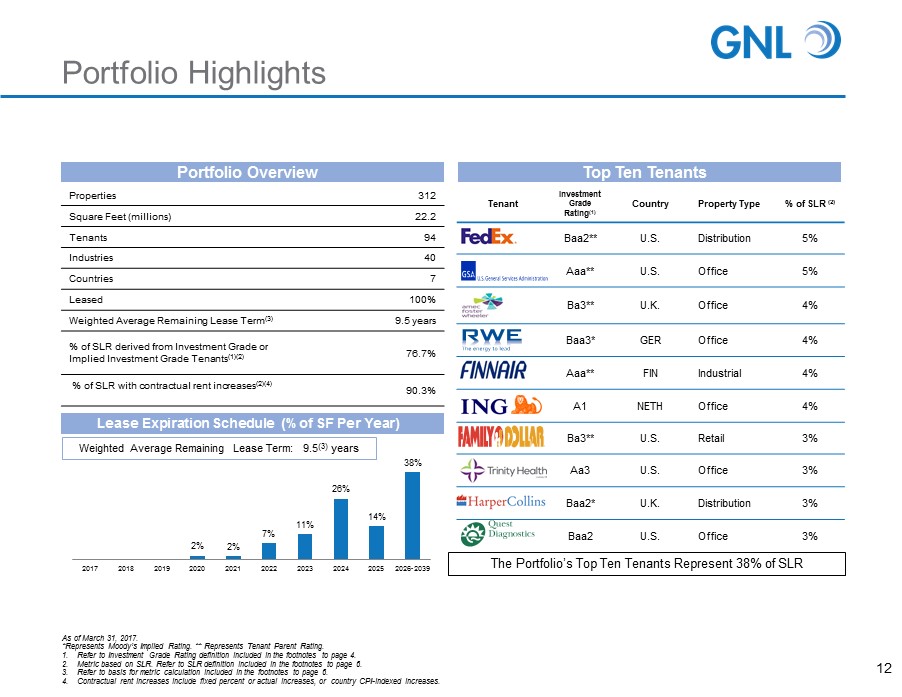
2% 2% 7% 11% 26% 14% 38% 2017 2018 2019 2020 2021 2022 2023 2024 2025 2026-2039 Portfolio Highlights 12 Portfolio Overview As of March 31, 2017. *Represents Moody’s Implied Rating. ** Represents Tenant Parent Rating. 1. Refer to Investment Grade Rating definition included in the footnotes to page 4. 2. Metric based on SLR. Refer to SLR definition included in the footnotes to page 6. 3. Refer to basis for metric calculation included in the footnotes to page 6. 4. Contractual rent increases include fixed percent or actual increases, or country CPI - indexed increases. Lease Expiration Schedule (% of SF Per Year) Weighted Average Remaining Lease Term: 9.5 (3) years Properties 312 Square Feet (millions) 22.2 Tenants 94 Industries 40 Countries 7 Leased 100% Weighted Average Remaining Lease Term (3) 9.5 years % of SLR derived from Investment Grade or Implied Investment Grade Tenants (1)(2) 76.7% % of SLR with contractual rent increases (2)(4) 90.3% Tenant Investment Grade Rating (1) Country Property Type % of SLR (2) Baa2** U.S. Distribution 5% Aaa ** U.S. Office 5% Ba3** U.K. Office 4% Baa3* GER Office 4% Aaa ** FIN Industrial 4% A1 NETH Office 4% Ba3** U.S. Retail 3% Aa3 U.S. Office 3% Baa2* U.K. Distribution 3% Baa2 U.S. Office 3% Top Ten Tenants The Portfolio’s Top Ten Tenants Represent 38% of SLR

First Quarter Portfolio Activity 13 Dispositions: One suburban office asset Acquisitions: Three distribution assets *As of 3/31/2017 **As of 12/31/2016 Two Pack Property Type: Distribution Industry: Freight Location: Great Falls, MT and Morgantown, WV Lease Term: 9.5 years* Credit Rating: Parent - Baa2 Property Type: Distribution Industry: Food/Beverage Distribution Location: Sikeston, MO Lease Term: 9.8 years* Credit Rating: B3 Sale Price: $13.0 mm Property Type: Office Industry: Technology Location: Ft. Washington, PA Lease Term: 6.8 years** Credit Rating: implied – Baa1 Acquisitions Dispositions Stated Guidance $150 - $200 million $50 - $75 million Completed Q1 2017 $30.3 million $13.0 million Cap Rate 7.2% (1) 10.1% (2) 1. Based on annualized Cash Net Operating Income (“Cash NOI”) divided by purchase price. 2. Based on the then current annualized Cash NOI divided by disposition price.
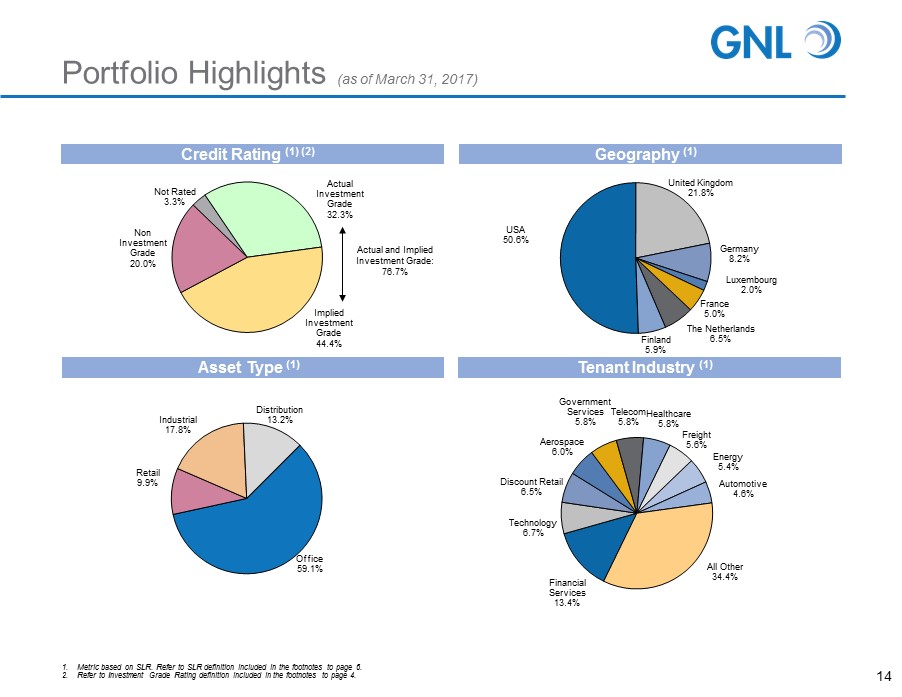
Portfolio Highlights (as of March 31, 2017) 14 1. Metric based on SLR. Refer to SLR definition included in the footnotes to page 6. 2. Refer to Investment Grade Rating definition included in the footnotes to page 4. Credit Rating (1) (2) Tenant Industry (1) USA 50.6% United Kingdom 21.8% Germany 8.2% Luxembourg 2.0% France 5.0% The Netherlands 6.5% Finland 5.9% Geography (1) Office 59.1% Retail 9.9% Industrial 17.8% Distribution 13.2% Asset Type (1) Financial Services 13.4% Technology 6.7% Discount Retail 6.5% Aerospace 6.0% Government Services 5.8% Telecom 5.8% Healthcare 5.8% Freight 5.6% Energy 5.4% Automotive 4.6% All Other 34.4% Not Rated 3.3% Actual Investment Grade 32.3% Implied Investment Grade 44.4% Non Investment Grade 20.0% Actual and Implied Investment Grade: 76.7%
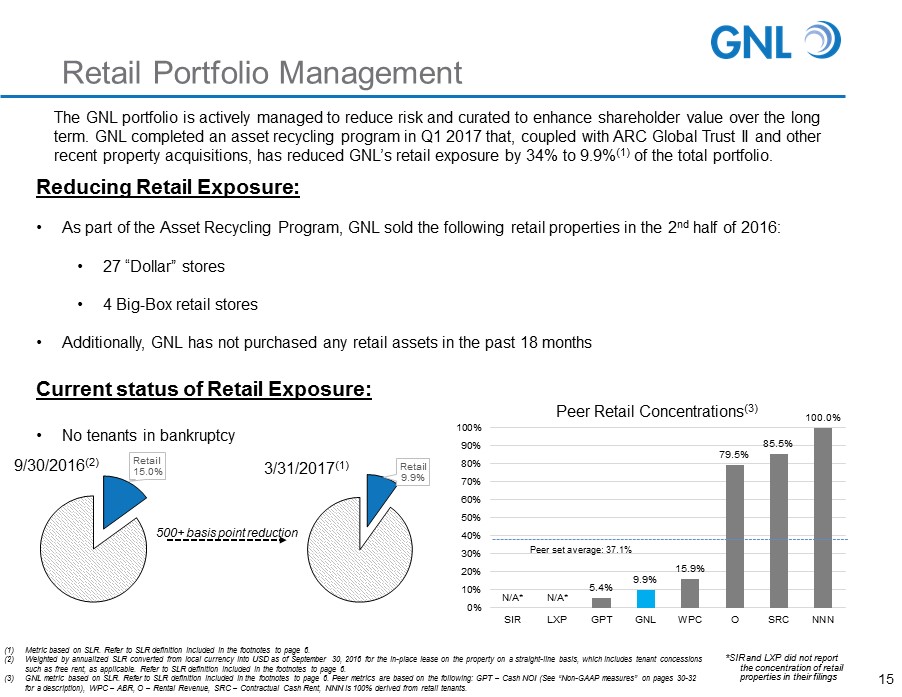
Retail Portfolio Management The GNL portfolio is actively managed to reduce risk and curated to enhance shareholder value over the long term. GNL completed an asset recycling program in Q1 2017 that, coupled with ARC Global Trust II and other recent property acquisitions, has reduced GNL’s retail exposure by 34% to 9.9% (1) of the total portfolio. Reducing Retail Exposure: • As part of the Asset Recycling Program, GNL sold the following retail properties in the 2 nd half of 2016: • 27 “Dollar” stores • 4 Big - Box retail stores • Additionally, GNL has not purchased any retail assets in the past 18 months Current status of Retail Exposure: • No tenants in bankruptcy Retail 15.0% Retail 9.9% 9/30/2016 (2) 3/31/2017 (1) 500+ basis point reduction 15 N/A* N/A* 5.4% 9.9% 15.9% 79.5% 85.5% 100.0% 0% 10% 20% 30% 40% 50% 60% 70% 80% 90% 100% SIR LXP GPT GNL WPC O SRC NNN Peer Retail Concentrations (3) Peer set average: 37.1% *SIR and LXP did not report the concentration of retail properties in their filings (1) Metric based on SLR. Refer to SLR definition included in the footnotes to page 6. (2) Weighted by annualized SLR converted from local currency into USD as of September 30, 2016 for the in - place lease on the propert y on a straight - line basis, which includes tenant concessions such as free rent, as applicable. Refer to SLR definition included in the footnotes to page 6. (3) GNL metric based on SLR. Refer to SLR definition included in the footnotes to page 6. Peer metrics are based on the following : G PT – Cash NOI (See “Non - GAAP measures” on pages 30 - 32 for a description), WPC – ABR, O – Rental Revenue, SRC – Contractual Cash Rent, NNN is 100% derived from retail tenants.

Results & Balance Sheet 16
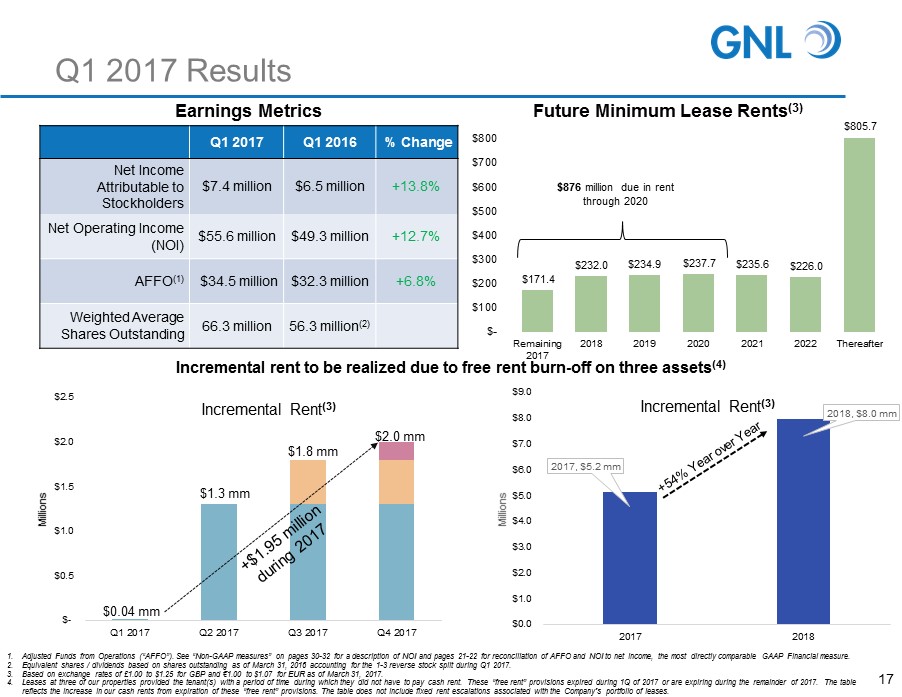
Q1 2017 Results Earnings Metrics Q1 2017 Q1 2016 % Change Net Income Attributable to Stockholders $7.4 million $6.5 million +13.8% Net Operating Income (NOI) $55.6 million $49.3 million +12.7% AFFO (1) $34.5 million $32.3 million +6.8% Weighted Average Shares Outstanding 66.3 million 56.3 million (2) 1. Adjusted Funds from Operations (“AFFO”). See “Non - GAAP measures” on pages 30 - 32 for a description of NOI and pages 21 - 22 for rec onciliation of AFFO and NOI to net income, the most directly comparable GAAP Financial measure. 2. Equivalent shares / dividends based on shares outstanding as of March 31, 2016 accounting for the 1 - 3 reverse stock split during Q1 2017. 3. Based on exchange rates of £1.00 to $1.25 for GBP and € 1.00 to $1.07 for EUR as of March 31, 2017. 4. Leases at three of our properties provided the tenant(s) with a period of time during which they did not have to pay cash ren t. These “free rent” provisions expired during 1Q of 2017 or are expiring during the remainder of 2017. The table reflects the increase in our cash rents from expiration of these “free rent” provisions. The table does not include fixed ren t e scalations associated with the Company's portfolio of leases. 17 2017 , $5.2 mm 2018 , $8.0 mm $0.0 $1.0 $2.0 $3.0 $4.0 $5.0 $6.0 $7.0 $8.0 $9.0 2017 2018 Millions Incremental Rent (3) $- $0.5 $1.0 $1.5 $2.0 $2.5 Q1 2017 Q2 2017 Q3 2017 Q4 2017 Millions Incremental Rent (3) $1.3 mm $1.8 mm $2.0 mm Incremental rent to be realized due to free rent burn - off on three assets (4) $0.04 mm Future Minimum Lease Rents (3) $171.4 $232.0 $234.9 $237.7 $235.6 $226.0 $805.7 $- $100 $200 $300 $400 $500 $600 $700 $800 Remaining 2017 2018 2019 2020 2021 2022 Thereafter $876 million due in rent through 2020
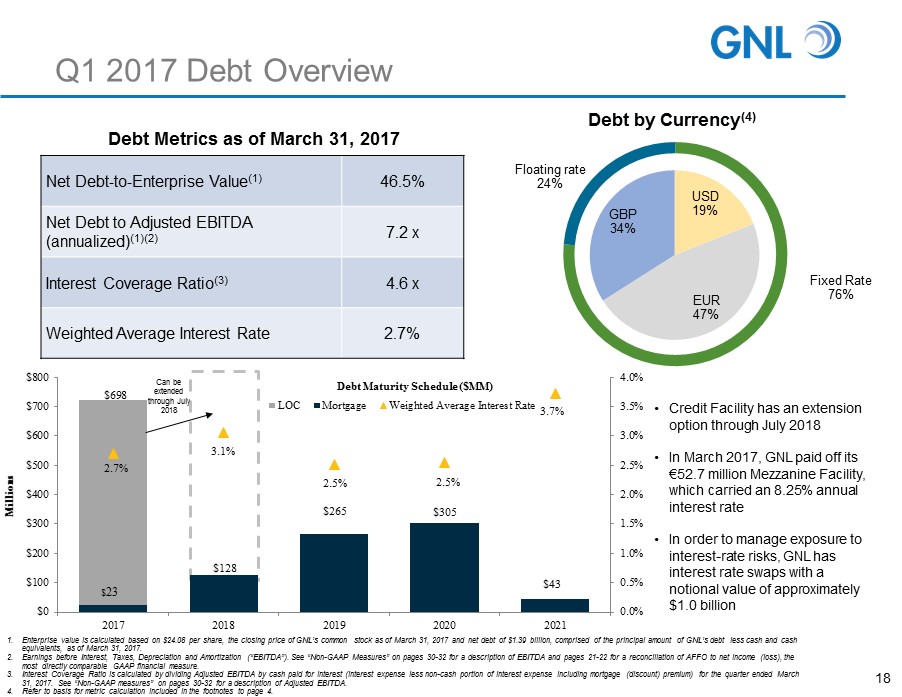
Q1 2017 Debt Overview Debt Metrics as of March 31, 2017 Net Debt - to - Enterprise Value (1) 46.5% Net Debt to Adjusted EBITDA (annualized) (1)(2) 7.2 x Interest Coverage Ratio (3) 4.6 x Weighted Average Interest Rate 2.7% Debt by Currency (4) 1. Enterprise value is calculated based on $24.08 per share, the closing price of GNL’s common stock as of March 31, 2017 and ne t d ebt of $1.39 billion, comprised of the principal amount of GNL’s debt less cash and cash equivalents, as of March 31, 2017. 2. Earnings before Interest, Taxes, Depreciation and Amortization (“EBITDA”). See “Non - GAAP Measures” on pages 30 - 32 for a descript ion of EBITDA and pages 21 - 22 for a reconciliation of AFFO to net income (loss), the most directly comparable GAAP financial measure. 3. Interest Coverage Ratio is calculated by dividing Adjusted EBITDA by cash paid for interest (interest expense less non - cash port ion of interest expense including mortgage (discount) premium) for the quarter ended March 31, 2017. See “Non - GAAP measures” on pages 30 - 32 for a description of Adjusted EBITDA. 4. Refer to basis for metric calculation included in the footnotes to page 4. USD 19% EUR 47% GBP 34% Fixed Rate 76% Floating rate 24% 18 • Credit Facility has an extension option through July 2018 • In March 2017, GNL paid off its € 52.7 million Mezzanine Facility, which carried an 8.25% annual interest rate • In order to manage exposure to interest - rate risks, GNL has interest rate swaps with a notional value of approximately $1.0 billion $128 $265 $305 $43 $698 2.7% 3.1% 2.5% 2.5% 3.7% 0.0% 0.5% 1.0% 1.5% 2.0% 2.5% 3.0% 3.5% 4.0% $0 $100 $200 $300 $400 $500 $600 $700 $800 2017 2018 2019 2020 2021 Millions Debt Maturity Schedule ($MM) LOC Mortgage Weighted Average Interest Rate $ 23 Can be extended through July 2018
Comprehensive Hedging Program Hedging Foreign Currency Exchange Risk (“Cash Flow Hedging Instruments”) Provides protection against unfavorable movements in EUR and GBP versus the U.S. Dollar (“USD”) associated with the Company’s foreign property operations Interest Rate Swaps: Fixing Interest on Floating Rate Debt Cost effective tools that mitigate against adverse fluctuations in interest rates; effectively acting to convert variable rate debt into fixed rate debt resulting in reduced exposure to variability in cash flows related to interest payments Net Investment Hedges: Asset – Liability Matching Matches the value of assets with liabilities in the same currency (EUR or GBP), creating a “natural hedge” on the value of GNL assets against movement in FX rates vs USD 19 GNL continues to employ a comprehensive hedging program, with a number of components designed to limit the impact of currency and interest rate movements to its European portfolio
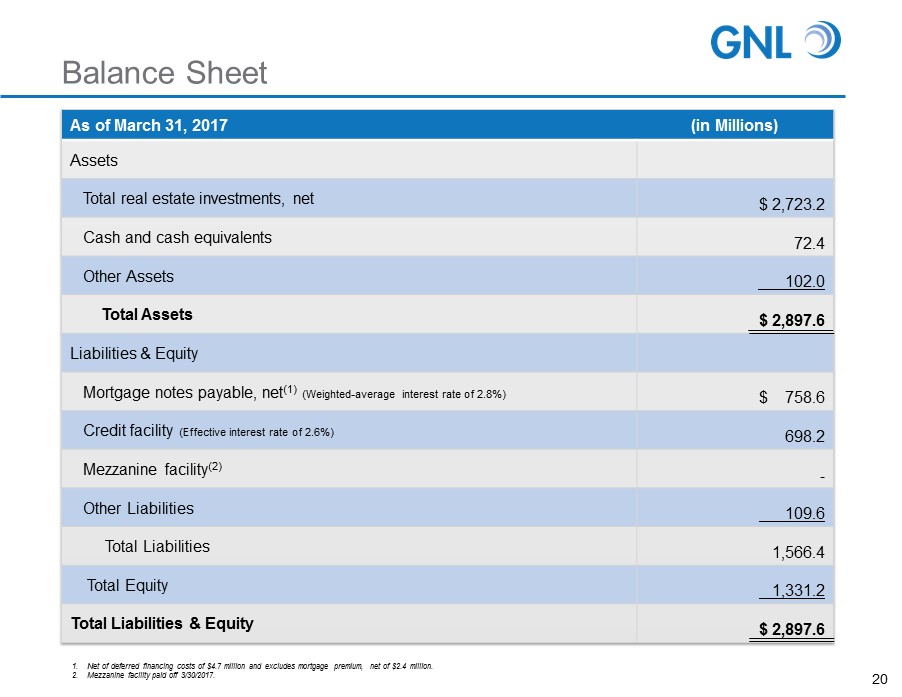
Balance Sheet 20 As of March 31, 2017 (in Millions) Assets Total real estate investments, net $ 2,723.2 Cash and cash equivalents 72.4 Other Assets 102.0 Total Assets $ 2,897.6 Liabilities & Equity Mortgage notes payable, net (1) (Weighted - average interest rate of 2.8%) $ 758.6 Credit facility (Effective interest rate of 2.6%) 698.2 Mezzanine facility (2) - Other Liabilities 109.6 Total Liabilities 1,566.4 Total Equity 1,331.2 Total Liabilities & Equity $ 2,897.6 1. Net of deferred financing costs of $4.7 million and excludes mortgage premium, net of $2.4 million. 2. Mezzanine facility paid off 3/30/2017.

Non – GAAP Reconciliations 21 Three Months Ended (In thousands) Mar 31, 2017 Mar 31, 2016 EBITDA: Net income $ 7,450 $ 6,558 Depreciation and amortization 27,114 23,756 Interest expense 11,531 10,569 Income tax expense 906 550 EBITDA $ 47,001 $ 41,433 Adjusted EBITDA: Equity based compensation $ 16 $ 1,044 Acquisition and transaction related 696 (129) Gains on dispositions of real estate investments (957) - Losses on derivative instruments 470 349 Unrealized losses on undesignated foreign currency advances and other hedge infectiveness 882 98 Other income (7) (9) Adjusted EBITDA $ 48,101 $ 42,786 Net Operating Income (NOI): Operating fees to related parties $ 5,730 $ 4,718 General and administrative 1,770 1,704 NOI $ 55,601 $ 49,307 Cash Net Operating Income (Cash NOI): Amortization of above - and below - market leases and ground lease assets and liabilities, net $ 404 $ 16 Straight - line rent (3,878) (2,801) Cash NOI $ 52,127 $ 46,522

Non – GAAP Reconciliations 22 Three Months Ended (In thousands, except per share data) Mar 31, 2017 Mar 31, 2016 Funds from operations (FFO): Net income attributable to stockholders (in accordance with GAAP) $ 7,429 $ 6,488 Depreciation and amortization 27,114 23,756 Gains on dispositions of real estate investments (957) - Proportionate share of adjustments for non - controlling interest to arrive at FFO (71) (252) FFO (as defined by NAREIT) attributable to stockholders $ 33,515 $ 29 ,992 Acquisition and transaction fees (1) 696 (129) Proportionate share of adjustments for non - controlling interest to arrive at Core FFO (2) 1 Core FFO attributable to stockholders $ 34,209 $ 29,864 Non - cash equity based compensation 16 1,044 Non - cash portion of interest expense 880 2,418 Amortization of above and below - market leases and ground lease assets and liabilities, net 404 16 Straight - line rent (3,878) (2,801) Unrealized losses on undesignated foreign currency advances and other hedge ineffectiveness 882 98 Eliminate unrealized losses on foreign currency transactions (2) 1,792 1,809 Amortization of mortgage premium (discount), net and mezzanine discount 153 (121) Proportionate share of adjustments for non - controlling interest to arrive at AFFO (1) (26) Adjusted funds from operations (AFFO) attributable to shareholders $ 34,457 $ 32,301 Weighted average shares outstanding 66,271 56,312 FFO per share $ 0.51 $ 0.53 Core FFO per share 0.52 0.53 Dividends declared $ 35,288 $ 30,020 (1) For the three months ended March 31, 2017, Merger related costs were $0.7 million. There were no Merger related costs for th e three months ended March 31, 2016. (2) For the three months ended March 31, 2017, losses on foreign currency transactions were $0.5 million which were comprised of unrealized losses of $1.8 million offset by realized gains of $1.3 million. For the three months ended March 31, 2016, losses on foreign currency transactions were $0.3 million, which were comprised of unrealized lo sse s of $1.8 million offset by realized gains of $1.5 million. For AFFO purposes, we add back unrealized (gains) losses.

2017 Strategic Initiatives 23
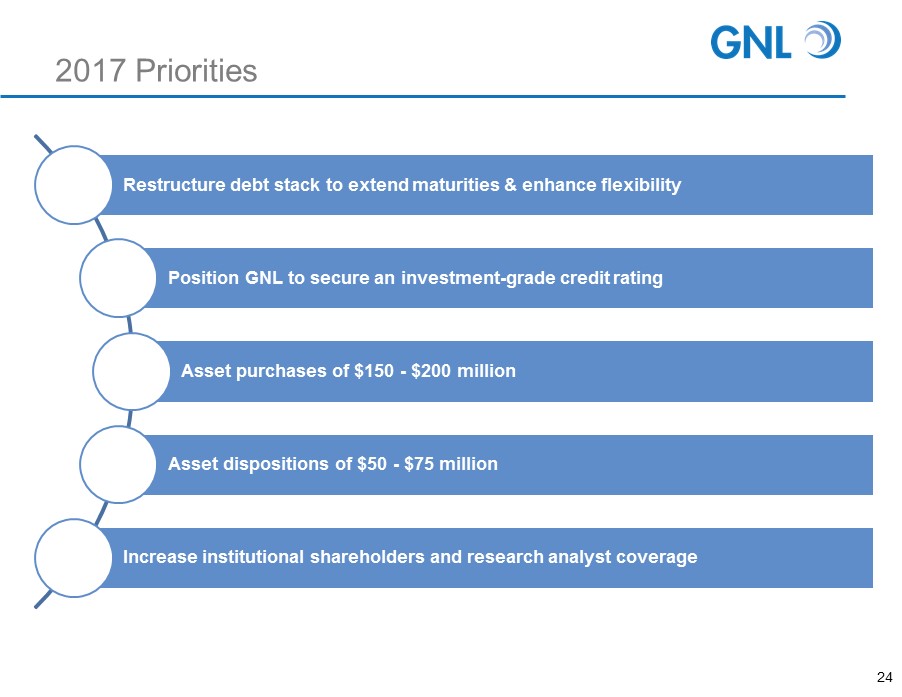
2017 Priorities 24 Restructure debt stack to extend maturities & enhance flexibility Position GNL to secure an investment - grade credit rating Asset purchases of $150 - $200 million Asset dispositions of $50 - $75 million Increase institutional shareholders and research analyst coverage

Legal Notices 25
Forward Looking Statements 26 Certain statements made in this presentation are “forward - looking statements” (as defined in Section 21 E of the Exchange Act), which reflect the expectations of GNL regarding future events . The forward - looking statements involve a number of risks, uncertainties and other factors that could cause actual results to differ materially from those contained in the forward - looking statements . Such forward - looking statements include, but are not limited to, the company’s plans, market and other expectations, objectives, intentions, as well as any expectations or projections, including regarding future dividends and market valuations, and other statements that are not historical facts . The following additional factors, among others, could cause actual results to differ from those set forth in the forward - looking statements : whether the benefits from the merger with ARC Global Trust II are achieved ; market volatility ; continuation or deterioration of current market conditions ; future regulatory or legislative actions that could adversely affect the company ; and the business plans of its tenants . Additional factors that may affect future results are contained in GNL’s filings with the SEC, including (i) the Annual Report on Form 10 - K for the year ended December 31 , 2016 filed on February 28 , 2017 , the Quarterly Report on Form 10 - Q for the quarter ended March 31 , 2017 , filed on May 8 , 2017 , and in future periodic reports filed by GNL under the Securities Exchange Act of 1934 , as amended, which are available at the SEC’s website at www . sec . gov . GNL disclaims any obligation to update and revise statements contained in these materials based on new information or otherwise .
Risk Factors 27 The following are some of the risks and uncertainties, although not all risks and uncertainties, that could cause our actual results to differ materially from those presented in our forward - looking statements . See the section entitled “Item 1 A . Risk Factors” in GNL’s Annual Report on Form 10 - K filed with the SEC on February 28 , 2017 and the section entitled “Item 1 A . Risk Factors” in GNL’s Quarterly Report on form 10 - Q filed with the SEC on May 8 , 2017 for a discussion of the risks which should be considered in connection with your investment . All of our executive officers are also officers, managers and/or holders of a direct or indirect controlling interest in the Advisor and other entities affiliated with AR Global Investments, LLC ("AR Global") . As a result, our executive officers, the Advisor and its affiliates face conflicts of interest, including significant conflicts created by the Advisor's compensation arrangements with us and other investment programs advised by AR Global affiliates and conflicts in allocating time among these investment programs and us . These conflicts could result in unanticipated actions . Because investment opportunities that are suitable for us may also be suitable for other AR Global - advised investment programs, the Advisor and its affiliates face conflicts of interest relating to the purchase of properties and other investments and such conflicts may not be resolved in our favor, which could reduce the investment return to our stockholders . The anticipated benefits from the merger with ARC Global Trust II may not be realized or may take longer to realize than expected . We may be unable to pay or maintain cash dividends or increase dividends over time . We are obligated to pay fees which may be substantial to the Advisor and its affiliates . We depend on tenants for our rental revenue and, accordingly, our rental revenue is dependent upon the success and economic viability of our tenants . Increases in interest rates could increase the amount of our debt payments and limit our ability to pay dividends to our stockholders . We may be unable to raise additional debt or equity financing on attractive terms or at all . Adverse changes in exchange rates may reduce the value of our properties located outside of the United States ("U . S . ") .

Risk Factors (Continued) 28 We may not generate cash flows sufficient to pay dividends to our stockholders, as such, we may be forced to borrow at unfavorable rates or depend on the Advisor to waive reimbursement of certain expense and fees to fund our operations . There is no assurance that the Advisor will waive reimbursement of expenses or fees . Any dividends in excess of cash flow may reduce the amount of capital we ultimately invest in properties and other permitted investments and negatively impact the value of our common stock . We are subject to risks associated with our international investments, including risks associated with compliance with and changes in foreign laws, fluctuations in foreign currency exchange rates and inflation . We are subject to risks associated with any dislocations or liquidity disruptions that may exist or occur in the credit markets of the U . S . and Europe from time to time . We may fail to continue to qualify, as a real estate investment trust for U . S . federal income tax purposes ("REIT"), which would result in higher taxes, may adversely affect operations and would reduce the trading price of our common stock and our cash available for dividends . We may be deemed to be an investment company under the Investment Company Act of 1940 , as amended (the “Investment Company Act"), and thus subject to regulation under the Investment Company Act . We may be exposed to risks due to a lack of tenant diversity, investment types and geographic diversity . The revenue derived from, and the market value of, properties located in the United Kingdom and continental Europe may decline as a result of the U . K . 's discussions with respect to exiting the European Union (the “Brexit Process”) . Our ability to refinance or sell properties located in the United Kingdom and continental Europe may be impacted by the economic and political uncertainty caused by the Brexit Process . We may be exposed to changes in general economic, business and political conditions, including the possibility of intensified international hostilities, acts of terrorism, and changes in conditions of U . S . or international lending, capital and financing markets, including as a result of the Brexit Process .
Projections 29 This presentation includes estimated projections of future operating results . These projections were not prepared in accordance with published guidelines of the SEC or the guidelines established by the American Institute of Certified Public Accountants for preparation and presentation of financial projections . This information is not fact and should not be relied upon as being necessarily indicative of future results ; the projections were prepared in good faith by management and are based on numerous assumptions that may prove to be wrong . Important factors that may affect actual results and cause the projections to not be achieved include, but are not limited to, risks and uncertainties relating to the company and other factors described in the “Risk Factors” section of GNL's Annual Report on Form 10 - K filed with the SEC on February 28 , 2017 , GNL's Quarterly Report on Form 10 - Q filed for the quarter ended March 31 , 2017 , filed on May 8 , 2017 , and in GNL's future filings with the SEC . The projections also reflect assumptions as to certain business decisions that are subject to change . As a result, actual results may differ materially from those contained in the estimates . Accordingly, there can be no assurance that the estimates will be realized . This presentation also contains estimates and information concerning our industry, including market position, market size, and growth rates of the markets in which we participate, that are based on industry publications and reports . This information involves a number of assumptions and limitations, and you are cautioned not to give undue weight to these estimates . We have not independently verified the accuracy or completeness of the data contained in these industry publications and reports . The industry in which we operate is subject to a high degree of uncertainty and risk due to variety of factors, including those described in the “Risk Factors” section of GNL’s Annual Report on Form 10 - K filed with the SEC on February 28 , 2017 , the Quarterly Report on Form 10 - Q filed for the quarter ended March 31 , 2017 , filed on May 8 , 2017 , and in future filings with the SEC . These and other factors could cause results to differ materially from those expressed in these publications and reports .
Definitions 30 Due to certain unique operating characteristics of real estate companies, as discussed below, the National Association of Real Estate Investment Trusts ("NAREIT"), an industry trade group, has promulgated a measure known as funds from operations ("FFO"), which we believe to be an appropriate supplemental measure to reflect the operating performance of a REIT . The use of FFO is recommended by the REIT industry as a supplemental performance measure . FFO is not equivalent to net income or loss as determined under accounting principles generally accepted in the United States ("GAAP") . We define FFO, a non - GAAP measure, consistent with the standards established by the White Paper on FFO approved by the Board of Governors of NAREIT, as revised in February 2004 (the "White Paper") . The White Paper defines FFO as net income or loss computed in accordance with GAAP, excluding gains or losses from sales of property but including asset impairment writedowns, plus depreciation and amortization, and after adjustments for unconsolidated partnerships and joint ventures . Adjustments for unconsolidated partnerships and joint ventures are calculated to reflect FFO . Our FFO calculation complies with NAREIT's definition . The historical accounting convention used for real estate assets requires straight - line depreciation of buildings and improvements, and straight - line amortization of intangibles, which implies that the value of a real estate asset diminishes predictably over time, especially if not adequately maintained or repaired and renovated as required by relevant circumstances or as requested or required by lessees for operational purposes in order to maintain the value disclosed . We believe that, because real estate values historically rise and fall with market conditions, including inflation, interest rates, unemployment and consumer spending, presentations of operating results for a REIT using historical accounting for depreciation and certain other items may be less informative . Historical accounting for real estate involves the use of GAAP . Any other method of accounting for real estate such as the fair value method cannot be construed to be any more accurate or relevant than the comparable methodologies of real estate valuation found in GAAP . Nevertheless, we believe that the use of FFO, which excludes the impact of real estate related depreciation and amortization, among other things, provides a more complete understanding of our performance to investors and to management, and when compared year over year, reflects the impact on our operations from trends in occupancy rates, rental rates, operating costs, general and administrative expenses, and interest costs, which may not be immediately apparent from net income . However, FFO, core funds from operations ("Core FFO") and adjusted funds from operations (“AFFO”), as described below, should not be construed to be more relevant or accurate than the current GAAP methodology in calculating net income or in its applicability in evaluating our operating performance . The method utilized to evaluate the value and performance of real estate under GAAP should be construed as a more relevant measure of operational performance and considered more prominently than the non - GAAP FFO, Core FFO and AFFO measures and the adjustments to GAAP in calculating FFO, Core FFO and AFFO . Other REITs may not define FFO in accordance with the current NAREIT definition (as we do) or may interpret the current NAREIT definition differently than we do or calculate Core FFO or AFFO differently than we do . Consequently, our presentation of FFO, Core FFO and AFFO may not be comparable to other similarly titled measures presented by other REITs . We consider FFO, Core FFO and AFFO useful indicators of our performance . Because FFO calculations exclude such factors as depreciation and amortization of real estate assets and gains or losses from sales of operating real estate assets (which can vary among owners of identical assets in similar conditions based on historical cost accounting and useful - life estimates), FFO facilitates comparisons of operating performance between periods and between other REITs in our peer group .
Definitions (Continued) 31 Changes in the accounting and reporting promulgations under GAAP (for acquisition fees and expenses from a capitalization/depreciation model to an expensed - as - incurred model) that were put into effect in 2009 and other changes to GAAP accounting for real estate subsequent to the establishment of NAREIT's definition of FFO have prompted an increase in cash - settled expenses, specifically acquisition fees and expenses for all industries as items that are expensed under GAAP . Core FFO is FFO, excluding acquisition and transaction related costs as well as certain other costs that are considered to be non - core, such as charges relating to the Listing Note and listing related fees . The purchase of properties, and the corresponding expenses associated with that process, is a key operational feature of our business plan to generate operational income and cash flows in order to make dividend payments to stockholders . In evaluating investments in real estate, we differentiate the costs to acquire the investment from the operations derived from the investment . By excluding expensed acquisition and transaction related costs as well as non - core costs, we believe Core FFO provides useful supplemental information that is comparable for each type of real estate investment and is consistent with management's analysis of the investing and operating performance of our properties We exclude certain income or expense items from AFFO that we consider more reflective of investing activities, other non - cash income and expense items and the income and expense effects of other activities that are not a fundamental attribute of our business plan . These items include early extinguishment of debt and unrealized gains and losses, which may not ultimately be realized, such as gains or losses on derivative instruments, gains and losses on foreign currency transactions, and gains and losses on investments . In addition, by excluding non - cash income and expense items such as amortization of above - market and below - market leases intangibles, amortization of deferred financing costs, straight - line rent and equity - based compensation from AFFO, we believe we provide useful information regarding income and expense items which have a direct impact on our ongoing operating performance . We also include the realized gains or losses on foreign currency exchange contracts for AFFO as such items are part of our ongoing operations and affect the current operating performance of the Company . By providing AFFO, we believe we are presenting useful information that assists investors and analysts to better assess the sustainability of our ongoing operating performance without the impacts of transactions that are not related to the ongoing profitability of our portfolio of properties . We also believe that AFFO is a recognized measure of sustainable operating performance by the REIT industry . Further, we believe AFFO is useful in comparing the sustainability of our operating performance with the sustainability of the operating performance of other real estate companies . However, AFFO is not indicative of cash available to fund ongoing cash needs, including the ability to make cash distributions . Investors are cautioned that AFFO should only be used to assess the sustainability of our operating performance excluding these activities, as it excludes certain costs that have a negative effect on our operating performance during the periods in which these costs are incurred . In calculating AFFO, we exclude certain expenses, which under GAAP are characterized as operating expenses in determining operating net income . All paid and accrued merger, acquisition and transaction related fees and certain other expenses negatively impact our operating performance during the period in which expenses are incurred or properties are acquired will also have negative effects on returns to investors, but are not reflective of our on - going performance . AFFO that excludes such costs and expenses would only be comparable to companies that did not have such activities . Further, under GAAP, certain contemplated non - cash fair value and other non - cash adjustments are considered operating non - cash adjustments to net income . In addition, as discussed above, we view gains and losses from fair value adjustments as items which are unrealized and may not ultimately be realized and not reflective of ongoing operations and are therefore typically adjusted for when assessing operating performance .
Definitions (Continued) 32 Excluding income and expense items detailed above from our calculation of AFFO provides information consistent with management's analysis of the operating performance of the Company . Additionally, fair value adjustments, which are based on the impact of current market fluctuations and underlying assessments of general market conditions, but can also result from operational factors such as rental and occupancy rates, may not be directly related or attributable to our current operating performance . By excluding such changes that may reflect anticipated and unrealized gains or losses, we believe AFFO provides useful supplemental information . As a result, we believe that the use of FFO, Core FFO and AFFO, together with the required GAAP presentations, provide a more complete understanding of our performance including relative to our peers and a more informed and appropriate basis on which to make decisions involving operating, financing, and investing activities . We believe that earnings before interest, taxes, depreciation and amortization (“EBITDA”) adjusted for acquisition and transaction - related expenses, other non - cash items and including our pro - rata share from unconsolidated joint ventures ("Adjusted EBITDA") is an appropriate measure of our ability to incur and service debt . Adjusted EBITDA should not be considered as an alternative to cash flows from operating activities, as a measure of our liquidity or as an alternative to net income as an indicator of our operating activities . Other REITs may calculate Adjusted EBITDA differently and our calculation should not be compared to that of other REITs . NOI is a non - GAAP financial measure equal to net income (loss), the most directly comparable GAAP financial measure, less discontinued operations, interest, other income and income from preferred equity investments and investment securities, plus corporate general and administrative expense, acquisition and transaction - related expenses, depreciation and amortization, other non - cash expenses and interest expense . NOI is adjusted to include our pro rata share of NOI from unconsolidated joint ventures . We use NOI internally as a performance measure and believe NOI provides useful information to investors regarding our financial condition and results of operations because it reflects only those income and expense items that are incurred at the property level . Therefore, we believe NOI is a useful measure for evaluating the operating performance of our real estate assets and to make decisions about resource allocations . Further, we believe NOI is useful to investors as a performance measure because, when compared across periods, NOI reflects the impact on operations from trends in occupancy rates, rental rates, operating costs and acquisition activity on an unlevered basis, providing perspective not immediately apparent from net income . NOI excludes certain components from net income in order to provide results that are more closely related to a property's results of operations . For example, interest expense is not necessarily linked to the operating performance of a real estate asset and is often incurred at the corporate level as opposed to the property level . In addition, depreciation and amortization, because of historical cost accounting and useful life estimates, may distort operating performance at the property level . NOI presented by us may not be comparable to NOI reported by other REITs that define NOI differently . We believe that in order to facilitate a clear understanding of our operating results, NOI should be examined in conjunction with net income (loss) as presented in our consolidated financial statements . NOI should not be considered as an alternative to net income (loss) as an indication of our performance or to cash flows as a measure of our liquidity . Cash NOI, is a non - GAAP financial measure that is intended to reflect the performance of our properties . We define Cash NOI as net operating income (which is separately defined herein) excluding amortization of above/below market lease intangibles and straight - line adjustments that are included in GAAP lease revenues . We believe that Cash NOI is a helpful measure that both investors and management can use to evaluate the current financial performance of our properties and it allows for comparison of our operating performance between periods and to other REITs . Cash NOI should not be considered as an alternative to net income, as an indication of our financial performance, or to cash flows as a measure of liquidity or our ability to fund all needs . The method by which we calculate and present Cash NOI may not be directly comparable to the way other REITs present Cash NOI .