Attached files
| file | filename |
|---|---|
| 8-K - 8-K - GERMAN AMERICAN BANCORP, INC. | a8kannualmeetingpresentati.htm |


Directors for Re-election
Christina M.
Ernst
Chris A.
Ramsey
M. Darren
Root
Mark A.
Schroeder

Board of Directors

Introductions


Management Report

CAUTIONARY NOTE REGARDING
FORWARD-LOOKING STATEMENTS
When used in this presentation and our oral statements, the words or phrases “believe,” “will likely result,” “are expected to,” “will
continue,” “is anticipated,” “estimate,” “project,” “plans,” or similar expressions are intended to identify “forward-looking
statements” within the meaning of the Private Securities Litigation Reform Act of 1995. You are cautioned not to place undue
reliance on any forward-looking statements, which speak only as of the date of this presentation, and we do not undertake any
obligation to update any forward-looking statement to reflect circumstances or events that occur in the future. By their nature,
these statements are subject to numerous risks and uncertainties that could cause actual results to differ materially from those
anticipated in the statements.
Factors that could cause actual results and performance to vary materially from those expressed or implied by any forward-looking
statement include those that are discussed in Item 1, “Business – Forward Looking Statements and Associated Risk,” and Item 1A,
“Risk Factors,” in our Annual Report on Form 10-K for 2016 as updated and supplemented by our other SEC reports filed from time
to time.

2016 Year in Review
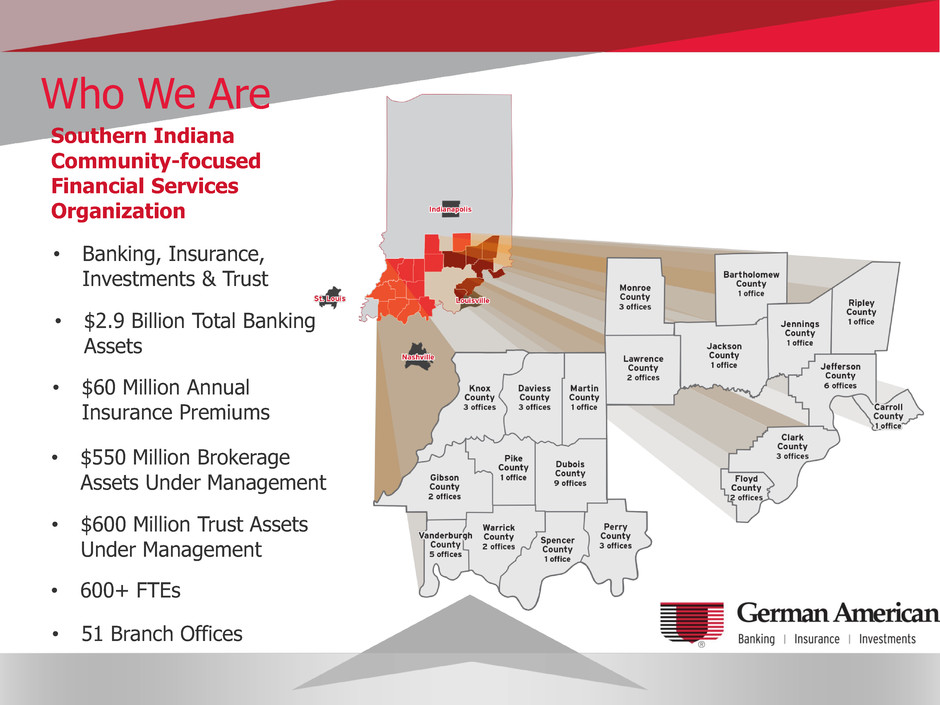
Southern Indiana
Community-focused
Financial Services
Organization
• $2.9 Billion Total Banking
Assets
• $550 Million Brokerage
Assets Under Management
• $60 Million Annual
Insurance Premiums
• Banking, Insurance,
Investments & Trust
• $600 Million Trust Assets
Under Management
Who We Are
• 51 Branch Offices
• 600+ FTEs


Bradley M. Rust
Executive Vice President
and CFO

Financial Trends
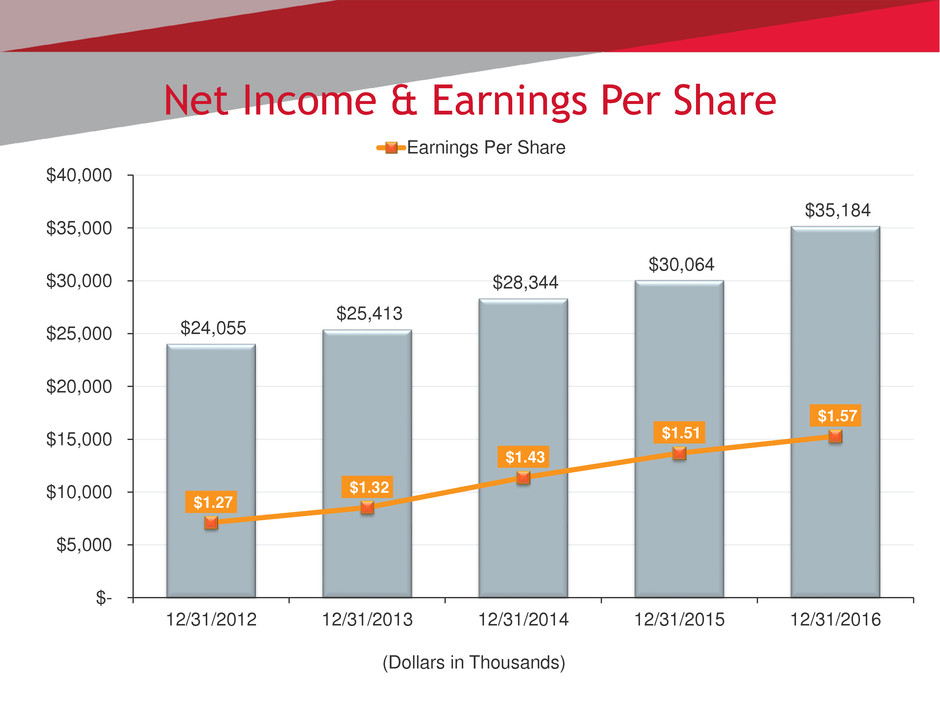
$24,055
$25,413
$28,344
$30,064
$35,184
$1.27
$1.32
$1.43
$1.51
$1.57
$-
$5,000
$10,000
$15,000
$20,000
$25,000
$30,000
$35,000
$40,000
12/31/2012 12/31/2013 12/31/2014 12/31/2015 12/31/2016
(Dollars in Thousands)
Net Income & Earnings Per Share
Earnings Per Share
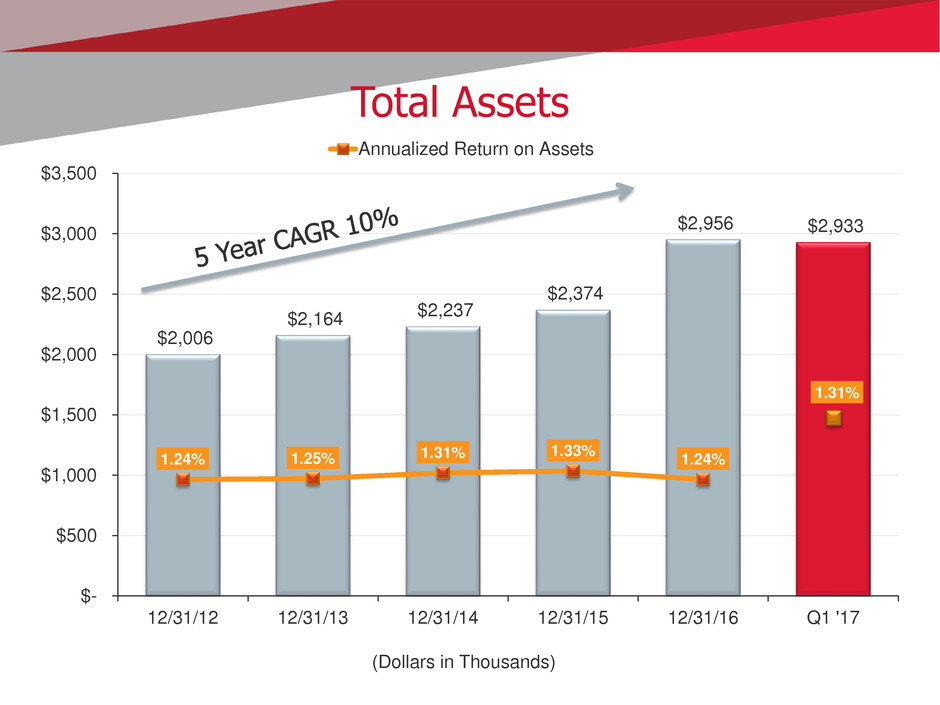
$2,006
$2,164 $2,237
$2,374
$2,956 $2,933
1.24% 1.25% 1.31%
1.33%
1.24%
1.31%
$-
$500
$1,000
$1,500
$2,000
$2,500
$3,000
$3,500
12/31/12 12/31/13 12/31/14 12/31/15 12/31/16 Q1 '17
(Dollars in Thousands)
Total Assets
Annualized Return on Assets
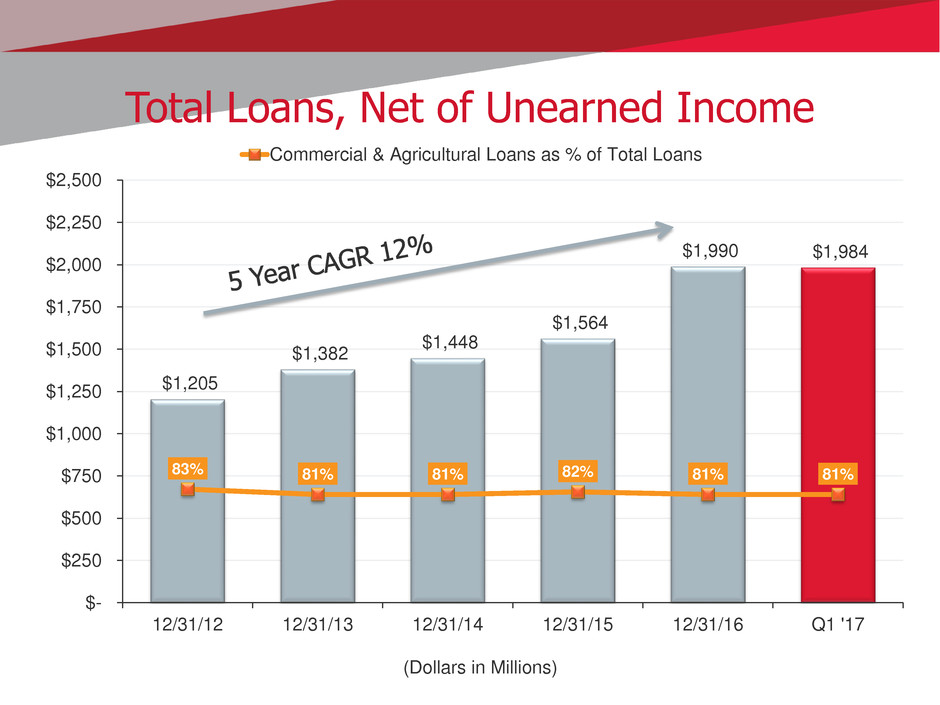
$1,205
$1,382
$1,448
$1,564
$1,990 $1,984
83% 81% 81% 82% 81% 81%
$-
$250
$500
$750
$1,000
$1,250
$1,500
$1,750
$2,000
$2,250
$2,500
12/31/12 12/31/13 12/31/14 12/31/15 12/31/16 Q1 '17
(Dollars in Millions)
Total Loans, Net of Unearned Income
Commercial & Agricultural Loans as % of Total Loans
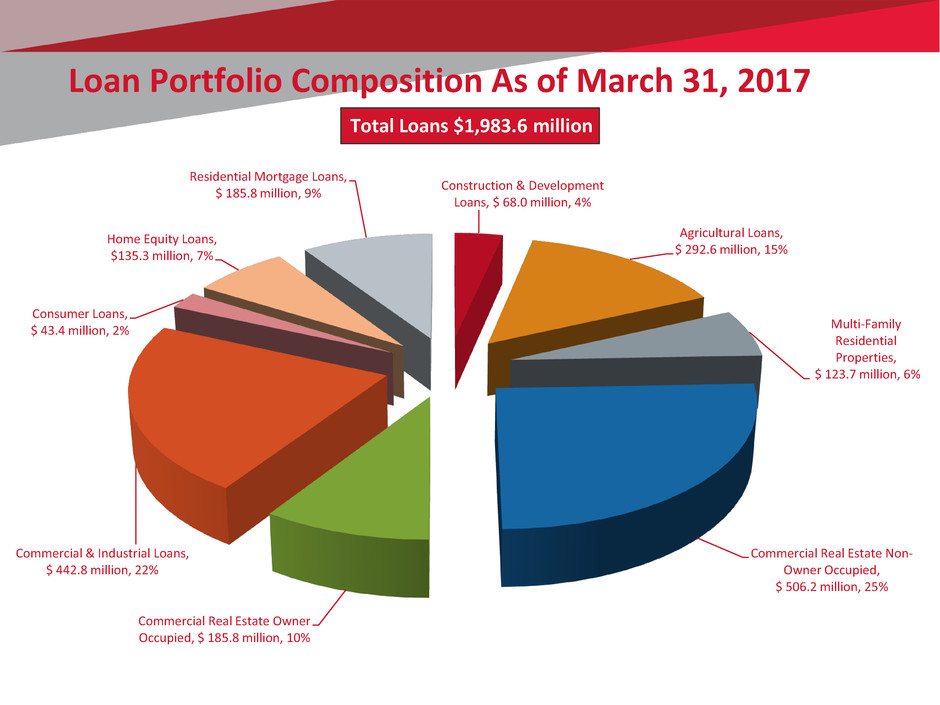
Construction & Development
Loans, $ 68.0 million, 4%
Agricultural Loans,
$ 292.6 million, 15%
Multi-Family
Residential
Properties,
$ 123.7 million, 6%
Commercial Real Estate Non-
Owner Occupied,
$ 506.2 million, 25%
Commercial Real Estate Owner
Occupied, $ 185.8 million, 10%
Commercial & Industrial Loans,
$ 442.8 million, 22%
Consumer Loans,
$ 43.4 million, 2%
Home Equity Loans,
$135.3 million, 7%
Residential Mortgage Loans,
$ 185.8 million, 9%
Total Loans $1,983.6 million
Loan Portfolio Composition As of March 31, 2017
17
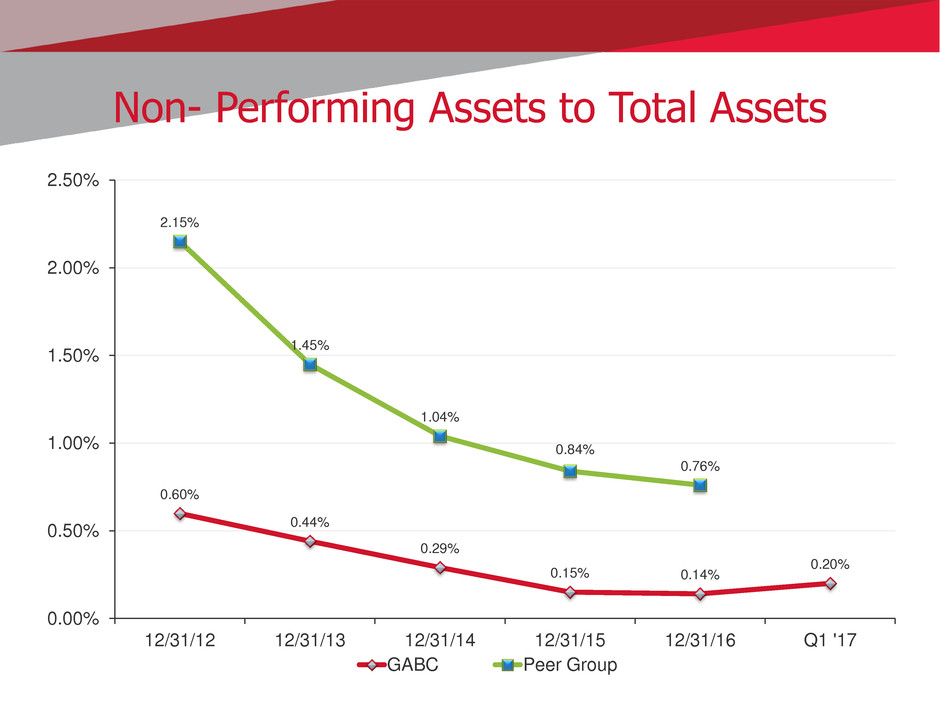
0.60%
0.44%
0.29%
0.15% 0.14%
0.20%
2.15%
1.45%
1.04%
0.84%
0.76%
0.00%
0.50%
1.00%
1.50%
2.00%
2.50%
12/31/12 12/31/13 12/31/14 12/31/15 12/31/16 Q1 '17
Non- Performing Assets to Total Assets
GABC Peer Group

0.19%
0.10%
-0.01%
0.03%
0.04% 0.03%
0.59%
0.25%
0.15%
0.08%
0.10%
-0.10%
0.15%
0.40%
0.65%
0.90%
12/31/12 12/31/13 12/31/14 12/31/15 12/31/16 Q1 '17
Net Charge-offs to Average Loans
GABC Peer Group
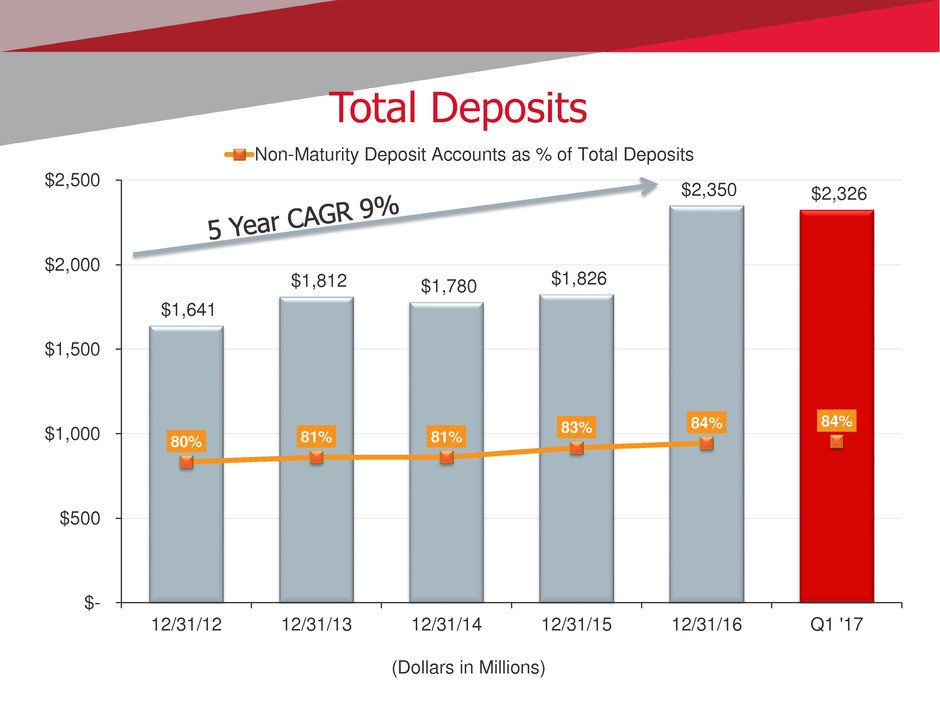
$1,641
$1,812 $1,780 $1,826
$2,350 $2,326
80% 81% 81%
83% 84% 84%
$-
$500
$1,000
$1,500
$2,000
$2,500
12/31/12 12/31/13 12/31/14 12/31/15 12/31/16 Q1 '17
(Dollars in Millions)
Total Deposits
Non-Maturity Deposit Accounts as % of Total Deposits

Non-Interest Bearing Demand,
$572.9 million, 24%
Interest Bearing Demand,
Savings & Money Market,
$1,389.8 million, 60%
Time Deposits, $363.8 million,
16%
Total Deposit Composition as of March 31, 2017
Cost of Funds
2012 0.60%
2013 0.37%
2014 0.30%
2015 0.28%
2016 0.32%
Q1 2017 0.34%
Total Deposits $2,326.5 million

$185
$200
$229
$252
$330
$341
13.57% 13.40% 13.21% 12.47%
10.94%
11.39%
$-
$50
$100
$150
$200
$250
$300
$350
$400
12/31/12 12/31/13 12/31/14 12/31/15 12/31/16 Q1 '17
(Dollars in Millions)
Total Shareholders’ Equity
Annualized Return on Equity
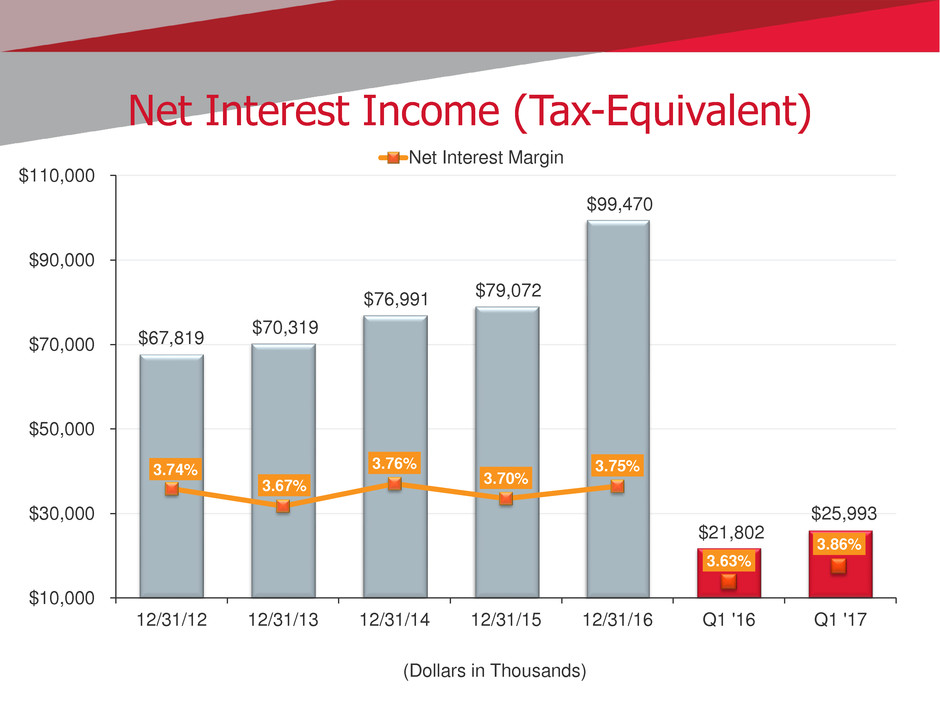
$67,819
$70,319
$76,991 $79,072
$99,470
$21,802
$25,993
3.74%
3.67%
3.76%
3.70%
3.75%
3.63%
3.86%
$10,000
$30,000
$50,000
$70,000
$90,000
$110,000
12/31/12 12/31/13 12/31/14 12/31/15 12/31/16 Q1 '16 Q1 '17
(Dollars in Thousands)
Net Interest Income (Tax-Equivalent)
Net Interest Margin

$21,811
$23,615 $23,937
$27,444
$32,013
$7,217
$8,188
24% 25% 24%
26%
24%
25%
24%
$-
$5,000
$10,000
$15,000
$20,000
$25,000
$30,000
$35,000
12/31/12 12/31/13 12/31/14 12/31/15 12/31/16 Q1 '16 Q1 '17
(Dollars in Thousands)
Non-Interest Income
Non-Interest Income as % of Total Revenue

$50,923
$54,905
$57,713
$61,326
$76,587
$20,240
$19,036
56.8%
58.5%
57.2% 57.6%
58.3%
69.8%
55.7%
$-
$10,000
$20,000
$30,000
$40,000
$50,000
$60,000
$70,000
$80,000
$90,000
12/31/12 12/31/13 12/31/14 12/31/15 12/31/16 Q1 '16 Q1 '17
(Dollars in Thousands)
Non-Interest Expense
Efficiency Ratio

$24,055
$25,413
$28,344
$30,064
$35,184
$5,146
$9,556
$1.27 $1.32
$1.43 $1.51
$1.57
$0.25
$0.42
$-
$5,000
$10,000
$15,000
$20,000
$25,000
$30,000
$35,000
$40,000
12/31/12 12/31/13 12/31/14 12/31/15 12/31/16 Q1 '16 Q1 '17
(Dollars in Thousands)
Net Income & Earnings Per Share
Earnings Per Share

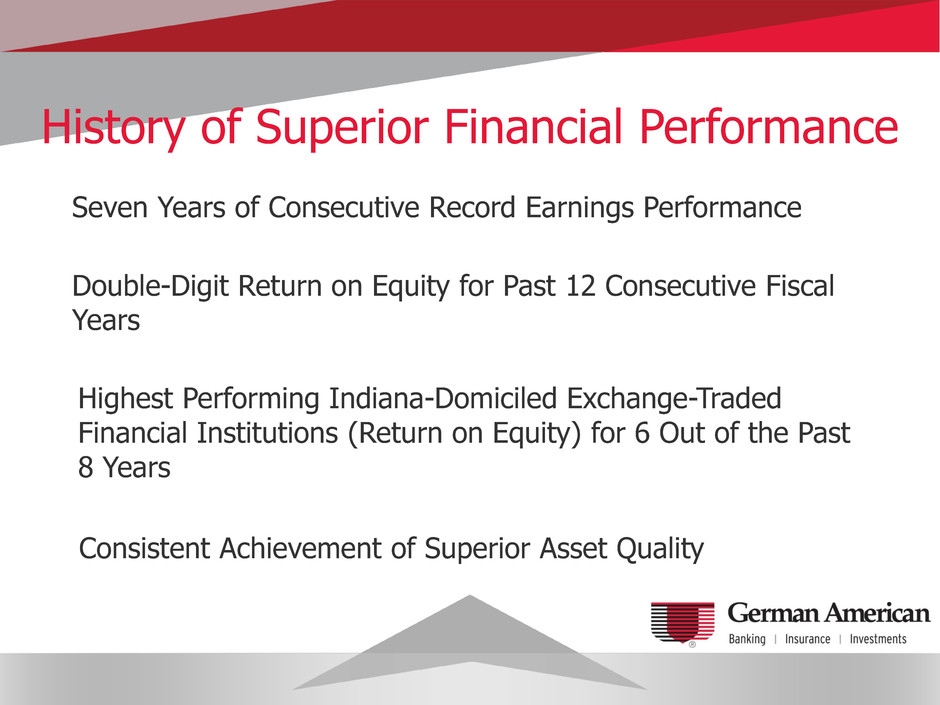
History of Superior Financial Performance
Seven Years of Consecutive Record Earnings Performance
Double-Digit Return on Equity for Past 12 Consecutive Fiscal
Years
Highest Performing Indiana-Domiciled Exchange-Traded
Financial Institutions (Return on Equity) for 6 Out of the Past
8 Years
Consistent Achievement of Superior Asset Quality
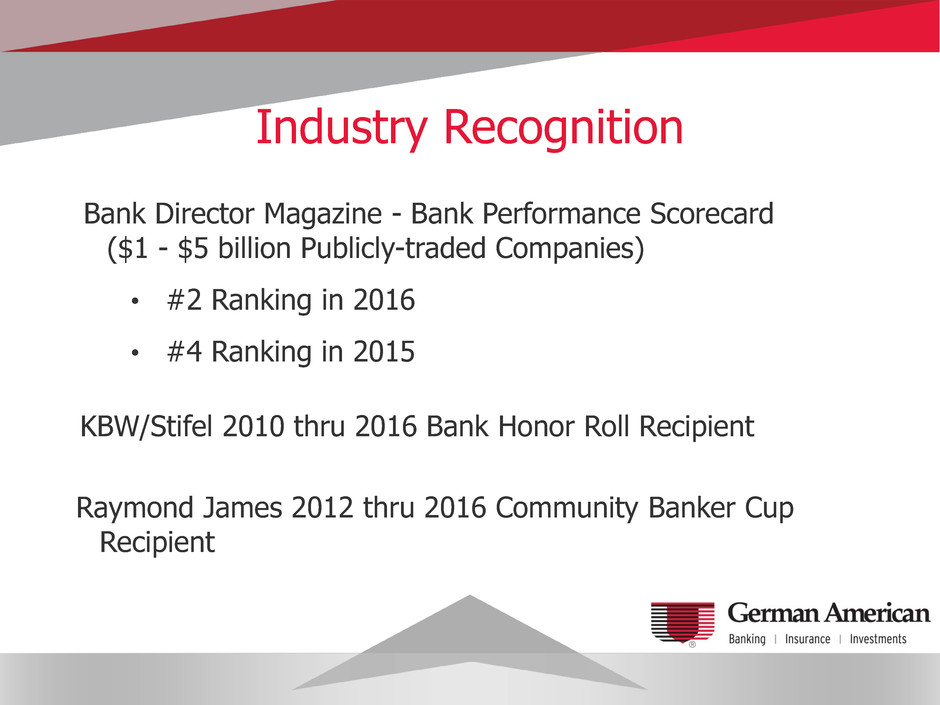
Industry Recognition
KBW/Stifel 2010 thru 2016 Bank Honor Roll Recipient
Bank Director Magazine - Bank Performance Scorecard
($1 - $5 billion Publicly-traded Companies)
• #2 Ranking in 2016
• #4 Ranking in 2015
Raymond James 2012 thru 2016 Community Banker Cup
Recipient
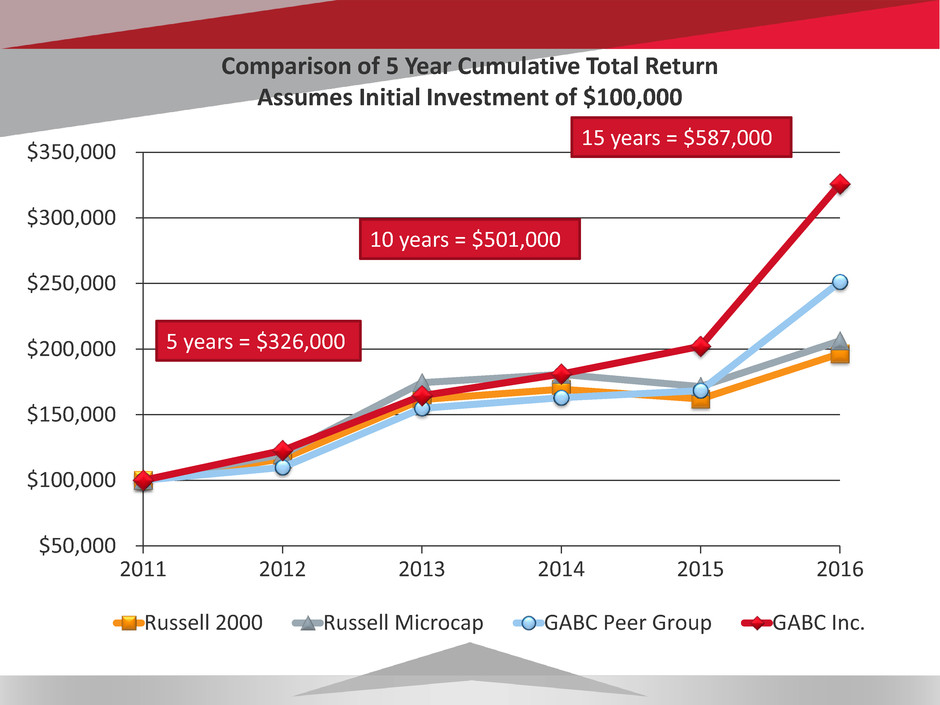
Comparison of 5 Year Cumulative Total Return
Assumes Initial Investment of $100,000
$50,000
$100,000
$150,000
$200,000
$250,000
$300,000
$350,000
2011 2012 2013 2014 2015 2016
Russell 2000 Russell Microcap GABC Peer Group GABC Inc.
5 years = $326,000
10 years = $501,000
15 years = $587,000


Questions & Answers


Directors for Re-election
Christina M.
Ernst
Chris A.
Ramsey
M. Darren
Root
Mark A.
Schroeder


Jane Thoma

