Attached files
| file | filename |
|---|---|
| 8-K - 8-K - Atlantic Capital Bancshares, Inc. | acb-form8xkshareholderpres.htm |

2017 ANNUAL SHAREHOLDERS MEETING
May 18, 2017
Forward‐Looking Statements
This presentation contains forward‐looking statements within the meaning of section 27A of the Securities Act of 1933, as amended, and section
21E of the Securities Exchange Act of 1934, as amended. These forward‐looking statements reflect our current views with respect to, among
other things, future events and our financial performance. These statements are often, but not always, made through the use of words or
phrases such as “may,” “should,” “could,” “predict,” “potential,” “believe,” “will likely result,” “expect,” “continue,” “will,” “anticipate,” “seek,”
“estimate,” “intend,” “plan,” “projection,” “would” and “outlook,” or the negative version of those words or other comparable of a future or
forward‐looking nature. These forward‐looking statements are not historical facts, and are based on current expectations, estimates and
projections about our industry, management’s beliefs and certain assumptions made by management, many of which, by their nature, are
inherently uncertain and beyond our control. Accordingly, we caution you that any such forward‐looking statements are not guarantees of future
performance and are subject to risks, assumptions and uncertainties that are difficult to predict. Although we believe that the expectations
reflected in these forward‐looking statements are reasonable as of the date made, actual results may prove to be materially different from the
results expressed or implied by the forward‐looking statements.
The following risks, among others, could cause actual results to differ materially from the anticipated results or other expectations expressed in
the forward‐looking statements: (1) the expected growth opportunities and cost savings from the transaction with First Security Group, Inc.
(“First Security”) may not be fully realized or may take longer to realize than expected; (2) loss of income from our TriNet division following our
exit of this business; (3) changes in asset quality and credit risk; (4) the cost and availability of capital; (5) customer acceptance of our products
and services; (6) customer borrowing, repayment, investment and deposit practices; (7) the introduction, withdrawal, success and timing of
business initiatives; (8) the impact, extent, and timing of technological changes; (9) severe catastrophic events in our geographic area; (10) a
weakening of the economies in which we conduct operations may adversely affect our operating results; (11) the U.S. legal and regulatory
framework, including those associated with the Dodd‐Frank Wall Street Reform and Consumer Protection Act could adversely affect the
operating results of the combined company; (12) the interest rate environment may compress margins and adversely affect net interest income;
(13) changes in trade, monetary and fiscal policies of various governmental bodies and central banks could affect the economic environment in
which we operate; (14) our ability to determine accurate values of certain assets and liabilities; (15) adverse developments in securities, public
debt, and capital markets, including changes in market liquidity and volatility; (16) our ability to anticipate interest rate changes correctly and
manage interest rate risk presented through unanticipated changes in our interest rate risk position and/or short‐ and long‐term interest rates;
(17) unanticipated changes in our liquidity position, including but not limited to our ability to enter the financial markets to manage and respond
to any changes to our liquidity position; (18) adequacy of our risk management program; (19) increased costs associated with operating as a
public company; (20) competition from other financial services companies in the companies’ markets could adversely affect operations; and (21)
other factors described in Atlantic Capital’s reports filed with the Securities and Exchange Commission and available on the SEC’s website
(www.sec.gov).
2
Non‐GAAP Financial Information
Non‐GAAP Financial Measures
Statements included in this presentation include non‐GAAP financial measures and should be read along with the accompanying tables, which
provide a reconciliation of non‐GAAP financial measures to GAAP financial measures. Atlantic Capital management uses non‐GAAP financial
measures, including: (i) operating net income; (ii) taxable equivalent net interest margin; and (iii) deposits excluding deposits held for branch sale,
in its analysis of the Company's performance. Please see slides 11 and 12 for a reconciliation of each of these non‐GAAP financial measures to its
most comparable GAAP measure.
Management uses these non‐GAAP financial measures because it believes they provide a greater understanding of ongoing performance and
operations, enhance comparability with prior periods, and provide users of our financial information with a meaningful measure for assessing our
financial results and credit trends. Non‐GAAP financial measures have limitations as analytical tools, and investors should not consider them in
isolation or as an alternative to any measure of performance or financial condition as determined in accordance with GAAP. In addition, non‐
GAAP financial measures may not be comparable to similarly titled non‐GAAP financial measures presented by other companies. Investors should
consider Atlantic Capital’s performance and financial condition as reported under GAAP and all other relevant information when assessing the
performance or financial condition of the Company.
3
Atlantic Capital Bank: 10 years of success
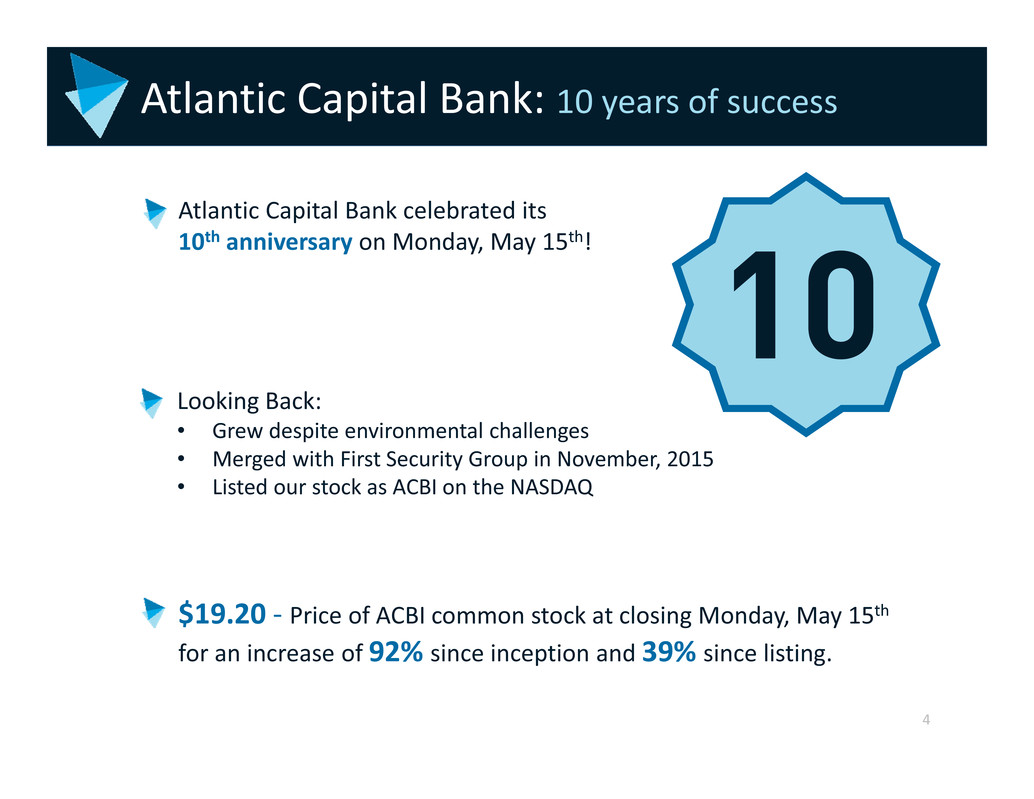
Atlantic Capital Bank celebrated its
10th anniversary on Monday, May 15th!
Looking Back:
• Grew despite environmental challenges
• Merged with First Security Group in November, 2015
• Listed our stock as ACBI on the NASDAQ
$19.20 ‐ Price of ACBI common stock at closing Monday, May 15th
for an increase of 92% since inception and 39% since listing.
4

Atlantic Capital Bank: Highlights
Branch Location
Loan Production Office
Main Office Location
Legend
$2.8 billion in assets
Offices in Atlanta, Charlotte,
Chattanooga and Knoxville
metropolitan areas
Attractive Markets:*
• Combined population of almost 10 million people
• Projected population growth over the next five years:
• Atlanta and Charlotte: ~ 7%
• Chattanooga and Knoxville: 3%‐4%
• Estimated 7,000 companies in these four markets with revenue
greater than $10 million
*Source: US MSA Census Information + market data from Data.com (Salesforce) 5
2016 Financial Highlights
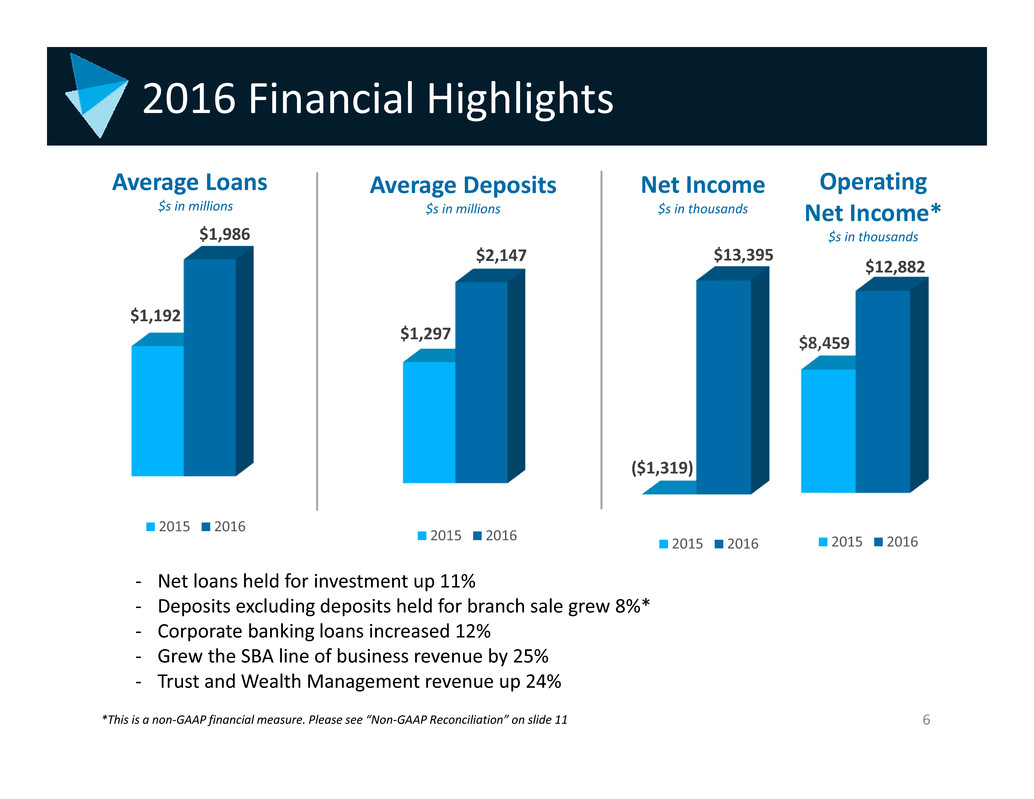
Average Loans
$s in millions
Average Deposits
$s in millions
$8,459
$12,882
2015 2016
Net Income
$s in thousands
‐ Net loans held for investment up 11%
‐ Deposits excluding deposits held for branch sale grew 8%*
‐ Corporate banking loans increased 12%
‐ Grew the SBA line of business revenue by 25%
‐ Trust and Wealth Management revenue up 24%
$1,192
$1,986
2015 2016
$1,297
$2,147
2015 2016
*This is a non‐GAAP financial measure. Please see “Non‐GAAP Reconciliation” on slide 11
($1,319)
$13,395
2015 2016
Operating
Net Income*
$s in thousands
6

Repositioned For Better Performance
Added 13 new origination bankers in 2016
Reduced branch network by 40%
Closed TriNet business
Undertook comprehensive review of all businesses
Opened loan production office in Charlotte
7

2017 Q1 Financial Highlights
‐ Increased SBA income to $1.2 million from $600,000 in the fourth quarter of 2016
‐ Decreased noninterest expense to $17.7 million from $18.8 million in the fourth quarter
of 2016
‐ Reported nonperforming assets to total assets of 0.21% as of March 31, 2017
‐ Increased average noninterest bearing deposits $29.2 million, or 19.7% annualized, to
$620 million
‐ Average noninterest bearing deposits equaled 29.4% of total deposits
Linked Quarter Comparison Q1 2017 Q4 2016
Net income $3.2 million $1.6 million
Diluted earnings per share $0.13 $0.06
Taxable equivalent net interest margin* 3.20% 3.11%
NPAs/Total Assets 0.21% 0.13%
*This is a non‐GAAP financial measure. Please see “Non‐GAAP Reconciliation” on slide 12 8

Proprietary & Confidential
Atlantic Capital Strategy
Become a premier
southeastern business and
private banking company
Accelerated Organic Growth
• Investing in people and capabilities to accelerate organic growth and build profitability
• Well positioned in attractive growth markets
• Attractive interest rate risk position
Strategic Expansion
• Completed acquisition of First Security on October 31, 2015
• Ongoing evaluation of new market expansion through mergers
and acquisitions and de novo entry
• Patient and disciplined approach with focus on shareholder value
9

Key Priorities
Improve performance in all of our lines of business and geographies
Invest in capacity for future growth to lever the cost structure
Improve profitability
Building a profitable
and sound future
10
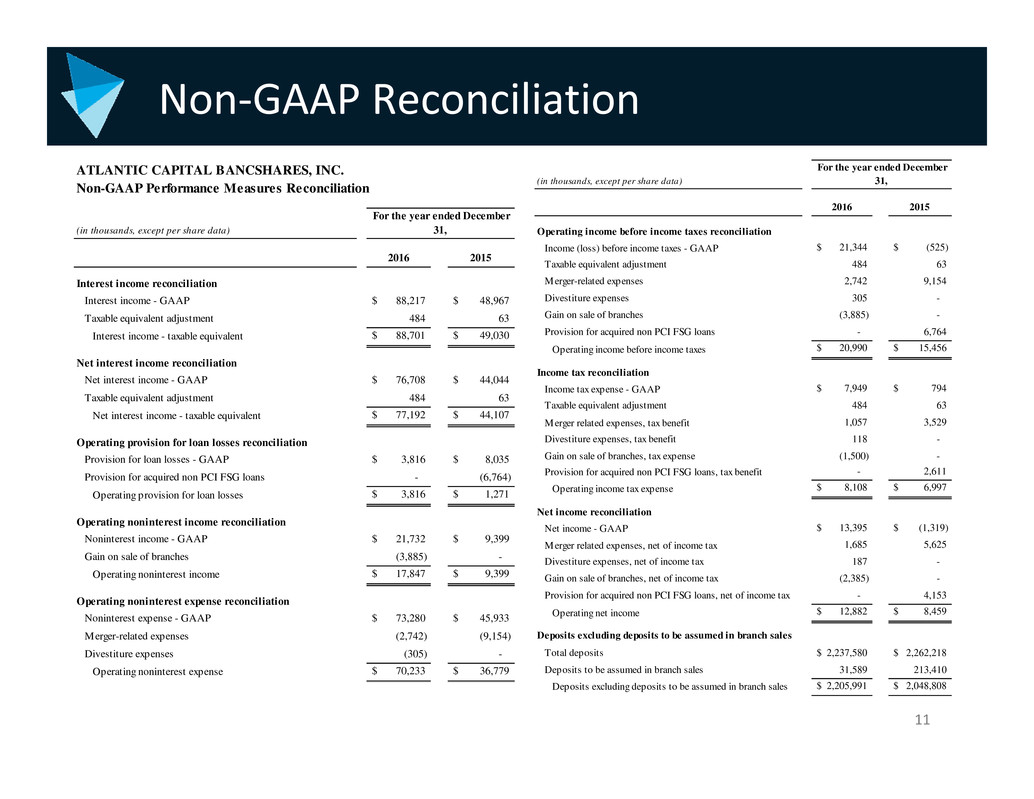
Non‐GAAP Reconciliation
ATLANTIC CAPITAL BANCSHARES, INC.
Non-GAAP Performance Measures Reconciliation
(in thousands, except per share data)
2016 2015
Interest income reconciliation
Interest income - GAAP $ 88,217 $ 48,967
Taxable equivalent adjustment 484 63
Interest income - taxable equivalent $ 88,701 $ 49,030
Net interest income reconciliation
Net interest income - GAAP $ 76,708 $ 44,044
Taxable equivalent adjustment 484 63
Net interest income - taxable equivalent $ 77,192 $ 44,107
Operating provision for loan losses reconciliation
Provision for loan losses - GAAP $ 3,816 $ 8,035
Provision for acquired non PCI FSG loans - (6,764)
Operating provision for loan losses $ 3,816 $ 1,271
Operating noninterest income reconciliation
Noninterest income - GAAP $ 21,732 $ 9,399
Gain on sale of branches (3,885) -
Operating noninterest income $ 17,847 $ 9,399
Operating noninterest expense reconciliation
Noninterest expense - GAAP $ 73,280 $ 45,933
Merger-related expenses (2,742) (9,154)
Divestiture expenses (305) -
Operating noninterest expense $ 70,233 $ 36,779
For the year ended December
31,
(in thousands, except per share data)
2016 2015
Operating income before income taxes reconciliation
Income (loss) before income taxes - GAAP $ 21,344 $ (525)
Taxable equivalent adjustment 484 63
Merger-related expenses 2,742 9,154
Divestiture expenses 305 -
Gain on sale of branches (3,885) -
Provision for acquired non PCI FSG loans - 6,764
Operating income before income taxes $ 20,990 $ 15,456
Income tax reconciliation
Income tax expense - GAAP $ 7,949 $ 794
Taxable equivalent adjustment 484 63
Merger related expenses, tax benefit 1,057 3,529
Divestiture expenses, tax benefit 118 -
Gain on sale of branches, tax expense (1,500) -
Provision for acquired non PCI FSG loans, tax benefit - 2,611
Operating income tax expense $ 8,108 $ 6,997
Net income reconciliation
Net income - GAAP $ 13,395 $ (1,319)
Merger related expenses, net of income tax 1,685 5,625
Divestiture expenses, net of income tax 187 -
Gain on sale of branches, net of income tax (2,385) -
Provision for acquired non PCI FSG loans, net of income tax - 4,153
Operating net income $ 12,882 $ 8,459
Deposits excluding deposits to be assumed in branch sales
Total deposits $ 2,237,580 $ 2,262,218
Deposits to be assumed in branch sales 31,589 213,410
Deposits excluding deposits to be assumed in branch sales $ 2,205,991 $ 2,048,808
For the year ended December
31,
11
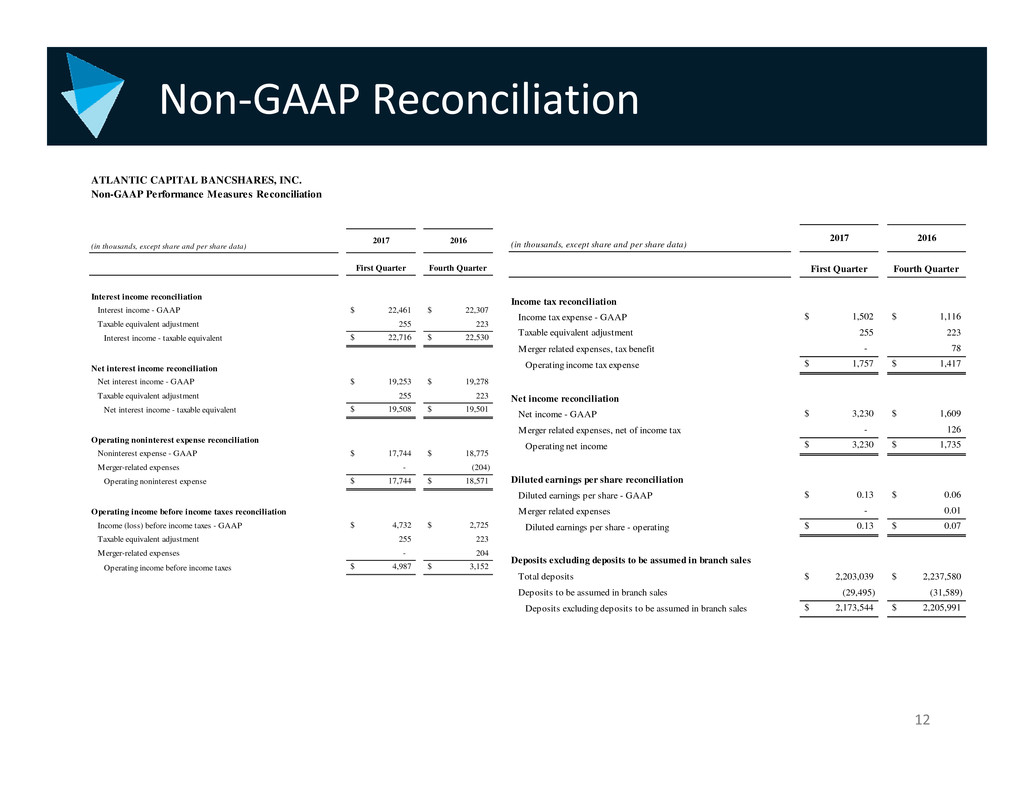
Non‐GAAP Reconciliation
ATLANTIC CAPITAL BANCSHARES, INC.
Non-GAAP Performance Measures Reconciliation
(in thousands, except share and per share data)
2017 2016
First Quarter Fourth Quarter
Interest income reconciliation
Interest income - GAAP $ 22,461 $ 22,307
Taxable equivalent adjustment 255 223
Interest income - taxable equivalent $ 22,716 $ 22,530
Net interest income reconciliation
Net interest income - GAAP $ 19,253 $ 19,278
Taxable equivalent adjustment 255 223
Net interest income - taxable equivalent $ 19,508 $ 19,501
Operating noninterest expense reconciliation
Noninterest expense - GAAP $ 17,744 $ 18,775
Merger-related expenses - (204)
Operating noninterest expense $ 17,744 $ 18,571
Operating income before income taxes reconciliation
Income (loss) before income taxes - GAAP $ 4,732 $ 2,725
Taxable equivalent adjustment 255 223
Merger-related expenses - 204
Operating income before income taxes $ 4,987 $ 3,152
(in thousands, except share and per share data)
2017 2016
First Quarter Fourth Quarter
Income tax reconciliation
Income tax expense - GAAP $ 1,502 $ 1,116
Taxable equivalent adjustment 255 223
Merger related expenses, tax benefit - 78
Operating income tax expense $ 1,757 $ 1,417
Net income reconciliation
Net income - GAAP $ 3,230 $ 1,609
Merger related expenses, net of income tax - 126
Operating net income $ 3,230 $ 1,735
Diluted earnings per share reconciliation
Diluted earnings per share - GAAP $ 0.13 $ 0.06
Merger related expenses - 0.01
Diluted earnings per share - operating $ 0.13 $ 0.07
Deposits excluding deposits to be assumed in branch sales
Total deposits $ 2,203,039 $ 2,237,580
Deposits to be assumed in branch sales (29,495) (31,589)
Deposits excluding deposits to be assumed in branch sales $ 2,173,544 $ 2,205,991
12

THANK YOU
