Attached files
| file | filename |
|---|---|
| 8-K - 8-K - PATRICK INDUSTRIES INC | annualmeeting8-k.htm |

Annual Shareholders Meeting
May 17, 2017

Welcome
Julie Ann Kotowski
Director of Investor Relations

Forward-Looking Statements
This presentation contains certain statements related to future results or states our intentions, beliefs and expectations
or predictions for the future which are forward-looking statements as that term is defined in the Private Securities
Litigation Reform Act of 1995. These forward-looking statements are subject to certain risks and uncertainties that
could cause actual results to differ materially from either historical or anticipated results depending on a variety of
factors. Further information concerning the Company and its business, including factors that potentially could
materially affect the Company’s financial results, is contained in the Company’s filings with the Securities and
Exchange Commission. The Company does not undertake any obligation to update any forward-looking statements for
any reason. The information included in this presentation is as of May 17, 2017.
This presentation includes market and industry data, forecasts and valuations that have been obtained from
independent consultant reports, publicly available information, various industry publications and other published
industry sources. Although we believe these sources are reliable, we have not independently verified the information
and cannot make any representation as to the accuracy or completeness of such information.
We disclaim any obligation or undertaking to disseminate any updates or revisions to any forward-looking statements
contained in this presentation or to reflect any change in our expectations after the date of this presentation or any
change in events, conditions or circumstances on which any statement is based.
3

Paul Hassler
Chairman of the Board
Andy Nemeth
President

Strong Brands
5

2016 Review
Todd Cleveland
Chief Executive Officer

Sales & Earnings Growth
7
Sales continue to grow and outpace their respective markets, driven by acquisitions, new products and
extension growth and market share gains
Net Income and EPS continue steady growth driven by the following:
Leveraging of fixed costs
Tight management of controllable expenses
*2012 net income excludes the benefit of the income tax credit associated with NOLs - $7MM or $0.43 per diluted share
($ in millions except per share data)
$21
+13%
$24
+28%
$31
+38%
$42
+32%
$56
$1.33
+11%
$1.49
+29%
$1.91
+42%
$2.72
+34%
$3.64
2012* 2013 2014 2015 2016
Earnings Growth
Net Income Diluted EPS
Realized cost synergies from acquisitions
Share buyback program
7
$437
+36%
$595
+24%
$736
+25
$920
+33%
$1,222
2012 2013 2014 2015 2016
Sales Growth
Sales

Stock Performance
0.0
0.2
0.4
0.6
0.8
1.0
1.2
1.4
1.6
1.8
2.0
1 Year
0.0
0.5
1.0
1.5
2.0
2.5
3.0
3.5
4.0
4.5
3 Years
0
5
10
15
20
25
30
5 Years
0
1
2
3
4
5
6
7
8
9
10
10 Years
*Stock price performance calculated based on year ending
% D
PATK 296%
DJI 19%
S&P 500 21%
% D
PATK 2691%
DJI 62%
S&P 500 78%
% D
PATK 816%
DJI 59%
S&P 500 58%
Our Goal is continued differentiated performance in excess of expectations!
8
% D
PATK 75%
DJI 13%
S&P 500 10%

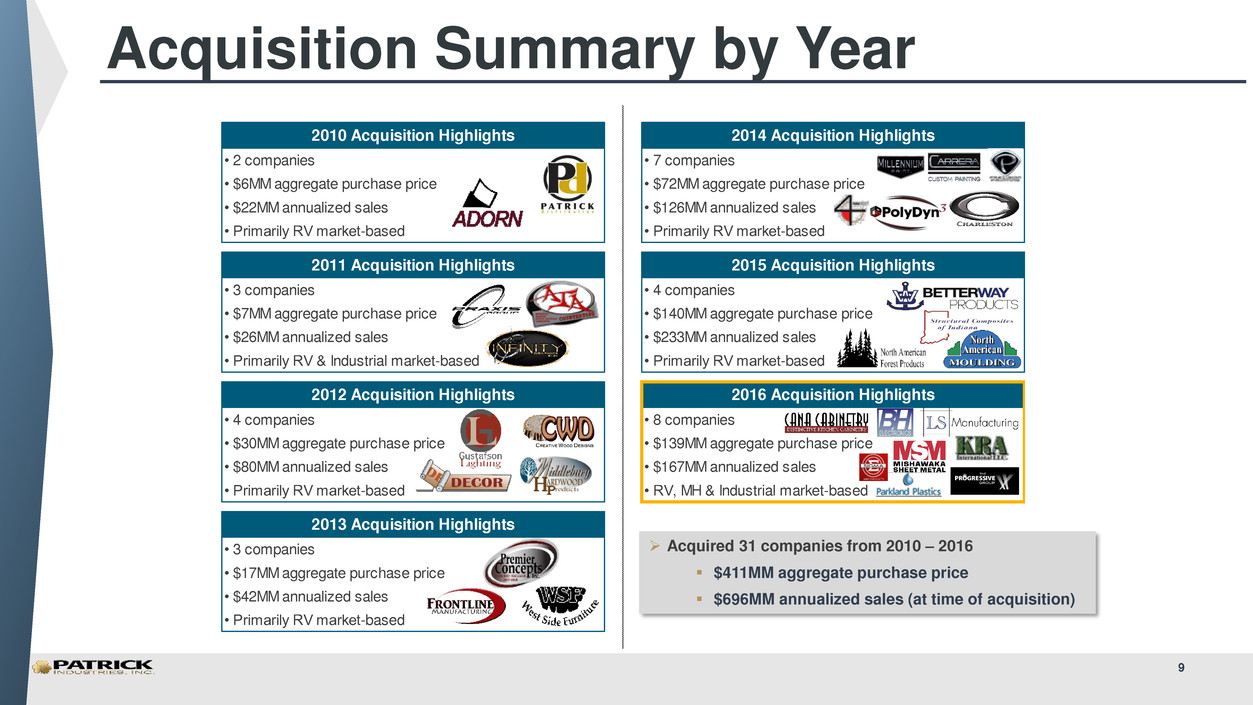
2010 Acquisition Highlights 2014 Acquisition Highlights
• 2 companies • 7 companies
• $6MM aggregate purchase price • $72MM aggregate purchase price
• $22MM annualized sales • $126MM annualized sales
• Primarily RV market-based • Primarily RV market-based
2011 Acquisition Highlights 2015 Acquisition Highlights
• 3 companies • 4 companies
• $7MM aggregate purchase price • $140MM aggregate purchase price
• $26MM annualized sales • $233MM annualized sales
• Primarily RV & Industrial market-based • Primarily RV market-based
2012 Acquisition Highlights 2016 Acquisition Highlights
• 4 companies • 8 companies
• $30MM aggregate purchase price • $139MM aggregate purchase price
• $80MM annualized sales • $167MM annualized sales
• Primarily RV market-based • RV, MH & Industrial market-based
2013 Acquisition Highlights
• 3 companies
• $17MM aggregate purchase price
• $42MM annualized sales
• Primarily RV market-based
Acquired 31 companies from 2010 – 2016
$411MM aggregate purchase price
$696MM annualized sales (at time of acquisition)
Acquisition Summary by Year
9

*Annualized sales represents projected full year sales volumes as of the acquisition date
2016 – 2017 Acquisition Summary
10
2016 2017
Parkland
Plastics
The
Progressive
Group
Cana
Cabinetry
Mishawaka
Sheet Metal
L.S.
Manufacturing
Inc.
BH
Electronics,
Inc.
Sigma Wire &
KRA Intl.
Medallion
Plastics, Inc.
Marine
Concepts
Marine
Electrical
Products
Florida Marine
Tanks
Date of
Acquisition:
02/2016 03/2016 05/2016 06/2016 07/2016 07/2016 12/2016 03/2017
Annualized
Revenue
$30.0 $23.0 $18.0 $28.0 $12.0 $35.0 $21.0 $20.0
Segment: Manufacturing Distribution Manufacturing Manufacturing Manufacturing Manufacturing Manufacturing Manufacturing Manufacturing Manufacturing Manufacturing
Industry: RV & Industrial RV & Industrial MH & Industrial RV & Industrial RV & Industrial Marine
RV, Marine &
Industrial
RV & Industrial
Marine &
Industrial
Marine
Marine &
Industrial
$75.0
Acquisition:
Leisure Product Enterprises, LLC
05/2017

Industry Trends
Andy Nemeth
President

(shipments in thousands)
Source: RVIA
Highest level of annual shipments in 40 years
Wholesale unit shipments increased by 15% over 2015
Double digit growth in every quarter in 2016
Retail shipments increased by 11% compared to 2015
RV Industry Annual Shipment Trends
12
173 163
203
228
259 247 248 255
293
321
300
257
311 321
370 384
391
353
237
166
242 252
286
321
357
374
431
RV Dealer Unit Shipments

(shipments in thousands)
Source: Manufactured Housing Institute
MH Industry Annual Shipment Trends
Industry growth of 15% compared to 2015
Increased demand as a resource for those displaced by Hurricane Matthew and flooding
13
188
171
211
254
304
340
363 353
373
349
251
193
168
131 131
147
118
96
82
50 50 52 55 60
64 71
81
MH Dealer Unit Shipments

(housing starts in thousands)
Source: U.S. Census Bureau
New Housing Starts Trends
1,193
1,014
1,200
1,288
1,457
1,354
1,477 1,474
1,617
1,641
1,569 1,603
1,705
1,848
1,956
2,068
1,801
1,355
906
554 587
609
781
925
1,003
1,112
1,174
New Housing Starts
Housing starts were up 6% compared to 2015
Approximately 50% of our industrial revenue base was directly tied to the
residential housing market
14

1st Quarter
2017 Review

Q1-2017 Q1-2016 Change
Net Sales $345.4 $278.6 24%
Operating Income $23.9 $20.6 16%
Net Income $17.5 $13.0 35%
Net Income per Diluted Share $1.12 $0.85 32%
$2,167
$2,044
$1,904
$1,787
RV MH
2017 2016
RV
72%
MH
13%
Industrial
11%
Marine
4%
Revenue Mix
Sales increased $67 million for the first quarter 2017, up 24% compared to 2016
RV Sales up 21% Industry up 12%
Content per unit, on a trailing twelve month basis, increased 14% for both RV and MH
Net income per diluted share increased 32% in the first quarter 2017 to $1.12 per share
Equity offering completed in March 2017 – proceeds of approximately $94 million
Proceeds were used immediately to pay down a portion of outstanding indebtedness
Credit facility expanded to $450 million
($ in millions except per share data)
Industry/Housing Starts data per industry sources: RVIA, MHI and US Census Bureau
Q1 2017 Summary
P&L Content per Unit
16
MH Sales up 36% Industry up 20% Industrial Sales up 35% New housing starts up 8%

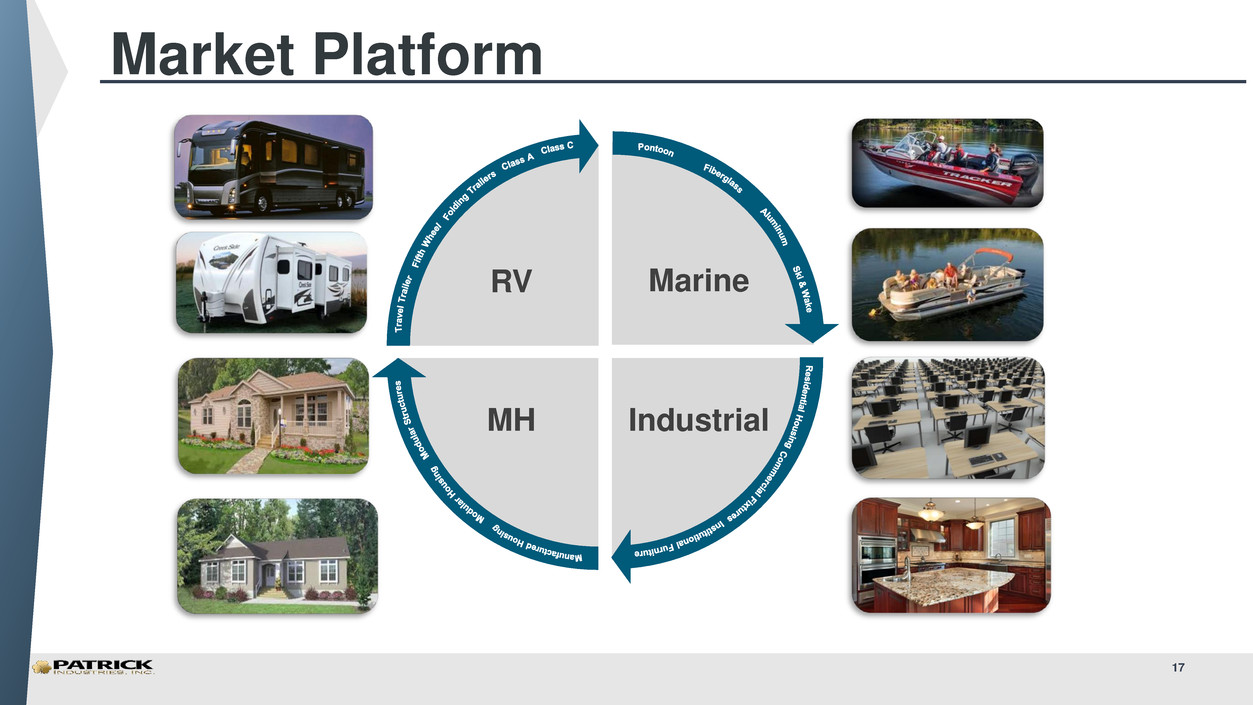
Market Platform
Marine
Industrial MH
RV
17

18
Strategically aligned with OEM customers with a nationwide network
Over 80 facilities in 19 states with
approximately 6,000 employees
Headquarters
Existing Patrick Facility
Geographic & Product Expansion
18

Annual Shareholders Meeting
May 17, 2017
