Attached files
| file | filename |
|---|---|
| 8-K - 8-K - BAR HARBOR BANKSHARES | annualmeeting-bhbxregfd8xk.htm |

Annual Shareholders’ Meeting
May 16, 2017
Forward Looking Statements
This document contains forward-looking statements as defined in the Private Securities Litigation Reform Act of 1995. There are several factors that could cause
actual results to differ significantly from expectations described in the forward-looking statements. For a discussion of such factors, please see the Company’s most
recent reports on Forms 10-K and 10-Q filed with the Securities and Exchange Commission and available on the SEC’s website at www.sec.gov. The Company
does not undertake any obligation to update forward-looking statements.
2
Non-GAAP Financial Statements
This document contains certain non-GAAP financial measures in addition to results presented in accordance with Generally Accepted Accounting Principles
(“GAAP”). These non-GAAP measures provide supplemental perspectives on operating results, performance trends, and financial condition. They are not a
substitute for GAAP measures; they should be read and used in conjunction with the Company’s GAAP financial information. A reconciliation of non-GAAP
financial measures to GAAP measures is included in the first quarter earnings release and Form 10-Q which can be found at www.bhbt.com, as well as within the
Appendix of this presentation. In all cases, it should be understood that non-GAAP per share measures do not depict amounts that accrue directly to the benefit
of shareholders.
The Company utilizes the non-GAAP measure of core earnings in evaluating operating trends, including components for core revenue and expense. These
measures exclude items which the Company does not view as related to its normalized operations. These items include securities gains/losses, merger costs,
restructuring costs, and systems conversion costs. Non-core adjustments are presented net of an adjustment for income tax expense. This adjustment is determined
as the difference between the GAAP tax rate and the effective tax rate applicable to core income. The efficiency ratio is adjusted for non-core revenue and expense
items and for tax preference items. The Company also calculates measures related to tangible equity, which adjust equity (and assets where applicable) to exclude
intangible assets due to the importance of these measures to the investment community. Charges related to the acquisition of Lake Sunapee Bank Group consist
primarily of severance and retention cost, systems conversion and integration costs, and professional fees. The Company’s disclosure of organic growth of loans in
2017 is also adjusted for the acquisition of Lake Sunapee Bank Group.
A True Community Bank
We understand the unique opportunities and challenges our customers face
We provide exceptional support to the people, businesses and communities in
the places we call home
Our people are resourceful and friendly, and our customers can count on them to
help find solutions
We value geography, heritage and performance while balancing growth and
earnings
Risk management and earnings sustainability while remaining true to our
culture
Commitment to continued improvement and process discipline
3
We recognize, appreciate and support the unique people and culture in the places we call home

Invested in Processes, Products, Technology, Training, Leadership and Infrastructure
Expanded our brand and business model into markets with similar geographic
attributes and like-minded partners
Created opportunity and growth for existing employees, while adding catalyst recruits
across all levels of the organization with broader experience and depth that value our
culture
Maintained our strong commitment to compliance and to risk management given the
evolving environment within the industry
Created a service and sales driven culture with focus on core business growth
Preparing For Our Future
4
Employee and customer experience is the foundation of superior performance,
which leads to significant financial benefit to our shareholders
2016 Achievements
Announced the acquisition of Lake Sunapee Bank Group (“LSBG”) in May 2016
and closed the transaction in January 2017
Total assets increased $175 million in the year to $1.8 billion
Strong loan growth of 14% and deposit growth of 11%
Net income of $14.9 million, which included $2.7 million of expenses related to the
acquisition and core system conversion compared to $15.2 million in 2015
Non-performing assets to total assets of 0.38%, down from 0.46%
Total non-performing loans to total loans of 0.58%, down from 0.71%
5
Highlights represent Bar Harbor Bankshares prior to completing the acquisition of LSBG. A reconciliation of non-GAAP financial measures to GAAP
measures are included in the first quarter earnings release and Form 10-Q which can be found at www.bhbt.com, as well as within the attached Appendix.
As necessary for comparative purposes, amounts are restated to reflect 3-for-2 stock split completed in the first quarter of 2017.

We are now the only community bank
based in New England with a branch presence in
Maine, New Hampshire, and Vermont
6
First Quarter 2017 Highlights
(comparisons are to first quarter 2016 unless otherwise stated)
Completed acquisition of Lake Sunapee Bank Group on January 13, 2017
$3.4 billion in total assets, including $1.6 billion added from the acquisition
Achieved 13% annualized organic total loan growth with 20% annualized in commercial, while
maintaining our risk appetite
Core diluted earnings per share of $0.43 versus $0.38 per share
Core net income of $6.2 million compared to $3.5 million
Core return on average assets of 0.74% compared to 0.86%
Core return on average equity of 7.88% compared to 8.76%
Non-performing assets to total assets of 0.19% compared to 0.40%
Completed a three-for-two split payable in the form of a large stock dividend to common
stockholders of record at the close of business on March 7, 2017
Tangible book value of $15.07 per share after giving effect to the stock split
7
Highlights represent Bar Harbor Bankshares. A reconciliation of non-GAAP financial measures to GAAP measures are included in the first quarter
earnings release and Form 10-Q which can be found at www.bhbt.com, as well as within the attached Appendix. As necessary for comparative purposes,
amounts are restated to reflect 3-for-2 stock split completed in the first quarter of 2017.
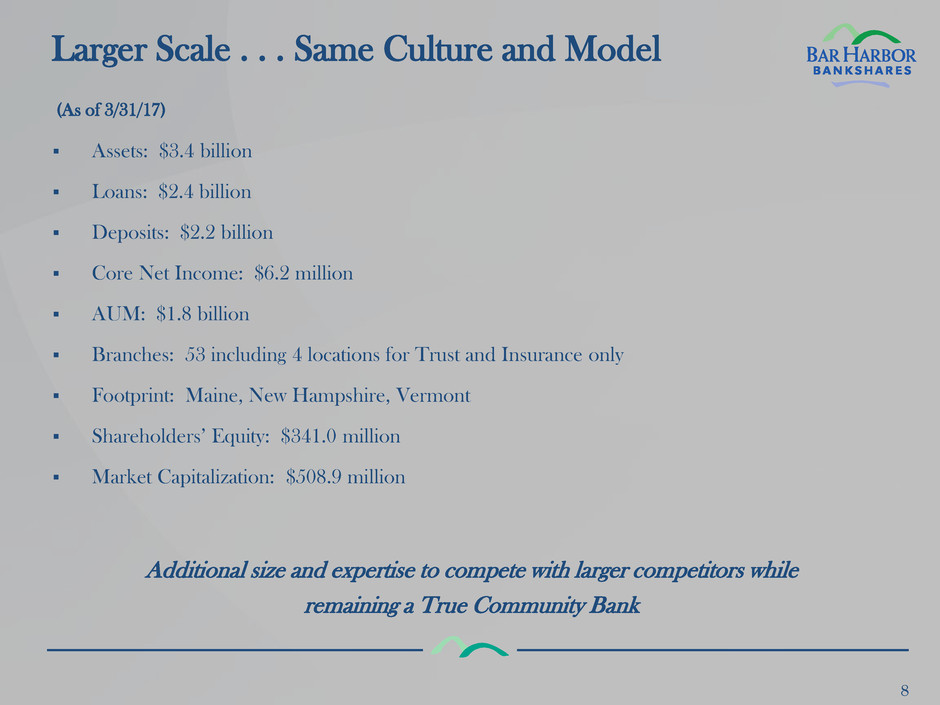
Larger Scale . . . Same Culture and Model
Assets: $3.4 billion
Loans: $2.4 billion
Deposits: $2.2 billion
Core Net Income: $6.2 million
AUM: $1.8 billion
Branches: 53 including 4 locations for Trust and Insurance only
Footprint: Maine, New Hampshire, Vermont
Shareholders’ Equity: $341.0 million
Market Capitalization: $508.9 million
8
Additional size and expertise to compete with larger competitors while
remaining a True Community Bank
(As of 3/31/17)
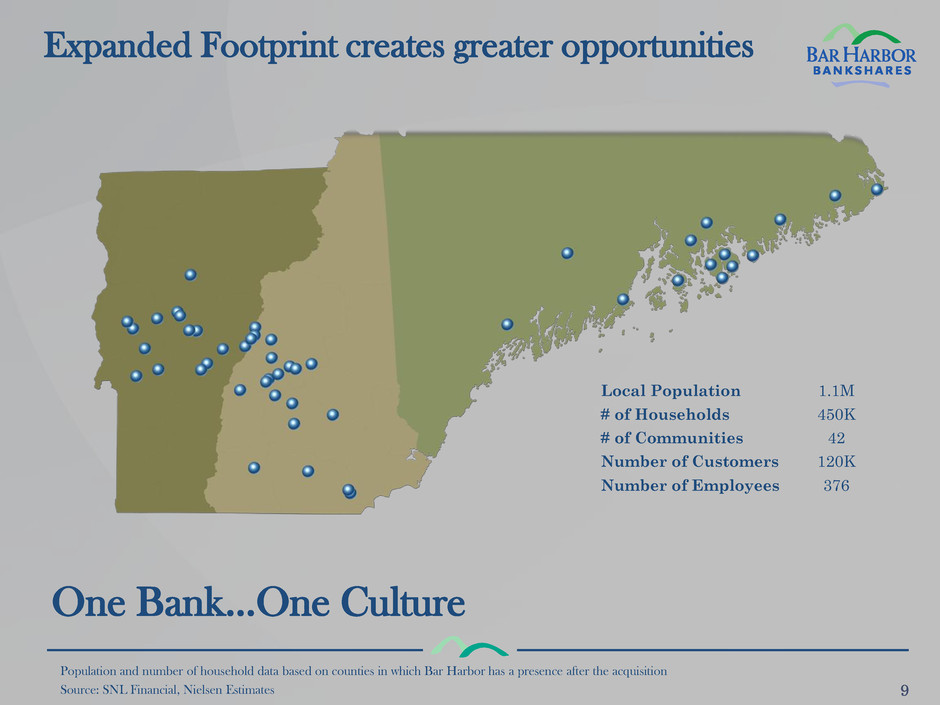
One Bank…One Culture
Expanded Footprint creates greater opportunities
Population and number of household data based on counties in which Bar Harbor has a presence after the acquisition
Source: SNL Financial, Nielsen Estimates
Local Population 1.1M
# of Households 450K
# of Communities 42
Number of Customers 120K
Number of Employees 376
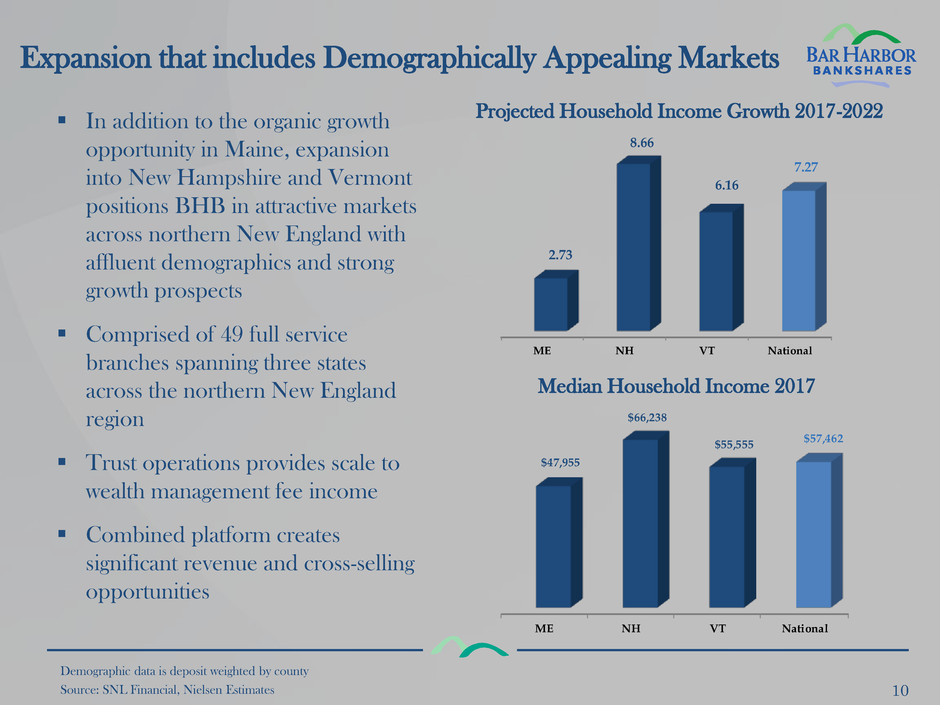
Expansion that includes Demographically Appealing Markets
10
Demographic data is deposit weighted by county
Source: SNL Financial, Nielsen Estimates
Projected Household Income Growth 2017-2022
Median Household Income 2017
In addition to the organic growth
opportunity in Maine, expansion
into New Hampshire and Vermont
positions BHB in attractive markets
across northern New England with
affluent demographics and strong
growth prospects
Comprised of 49 full service
branches spanning three states
across the northern New England
region
Trust operations provides scale to
wealth management fee income
Combined platform creates
significant revenue and cross-selling
opportunities
ME NH VT National
$47,955
$66,238
$55,555
$57,462
ME NH VT National
2.73
8.66
6.16
7.27
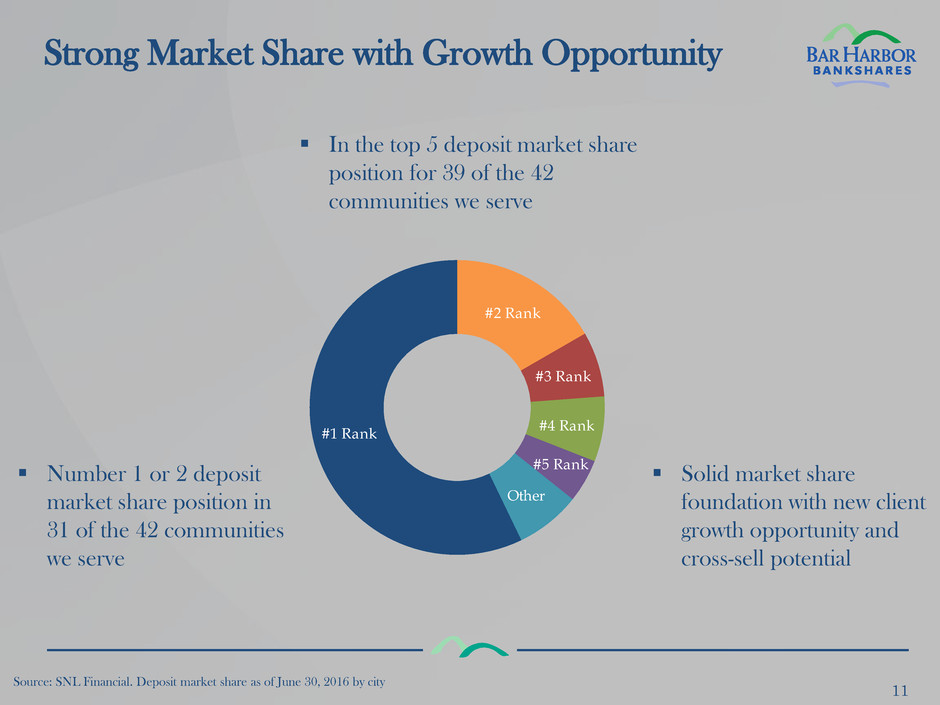
Strong Market Share with Growth Opportunity
11
Source: SNL Financial. Deposit market share as of June 30, 2016 by city
In the top 5 deposit market share
position for 39 of the 42
communities we serve
#2 Rank
#3 Rank
#4 Rank
#5 Rank
Other
#1 Rank
Number 1 or 2 deposit
market share position in
31 of the 42 communities
we serve
Solid market share
foundation with new client
growth opportunity and
cross-sell potential

Validation of Our Approach
12
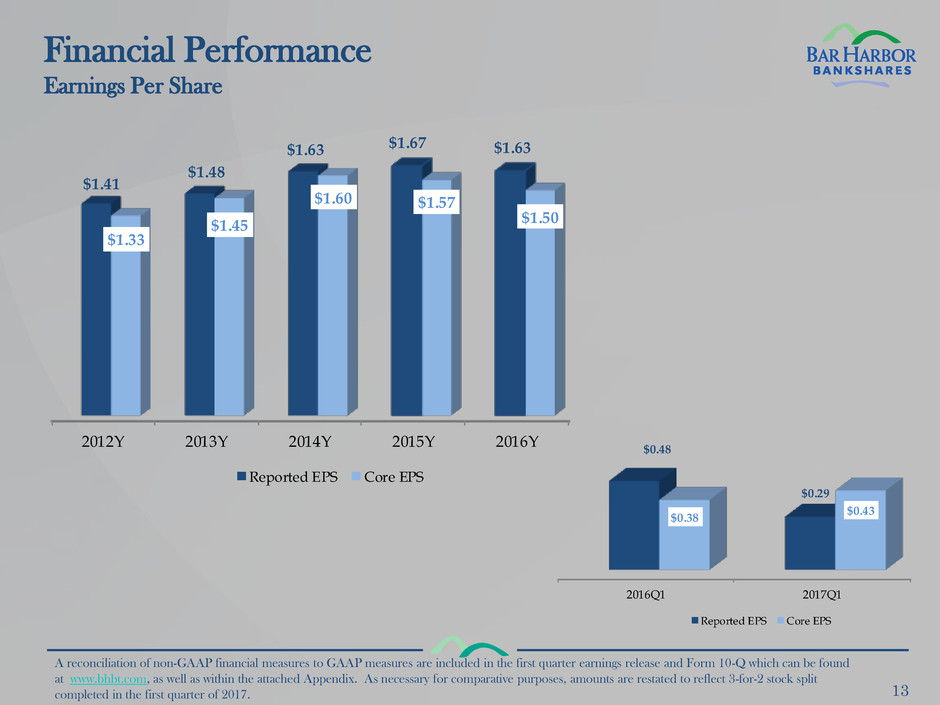
Financial Performance
Earnings Per Share
13
2012Y 2013Y 2014Y 2015Y 2016Y
$1.41
$1.48
$1.63 $1.67 $1.63
$1.33
$1.45
$1.60 $1.57
$1.50
Reported EPS Core EPS
2016Q1 2017Q1
$0.48
$0.29
$0.38
$0.43
Reported EPS Core EPS
A reconciliation of non-GAAP financial measures to GAAP measures are included in the first quarter earnings release and Form 10-Q which can be found
at www.bhbt.com, as well as within the attached Appendix. As necessary for comparative purposes, amounts are restated to reflect 3-for-2 stock split
completed in the first quarter of 2017.
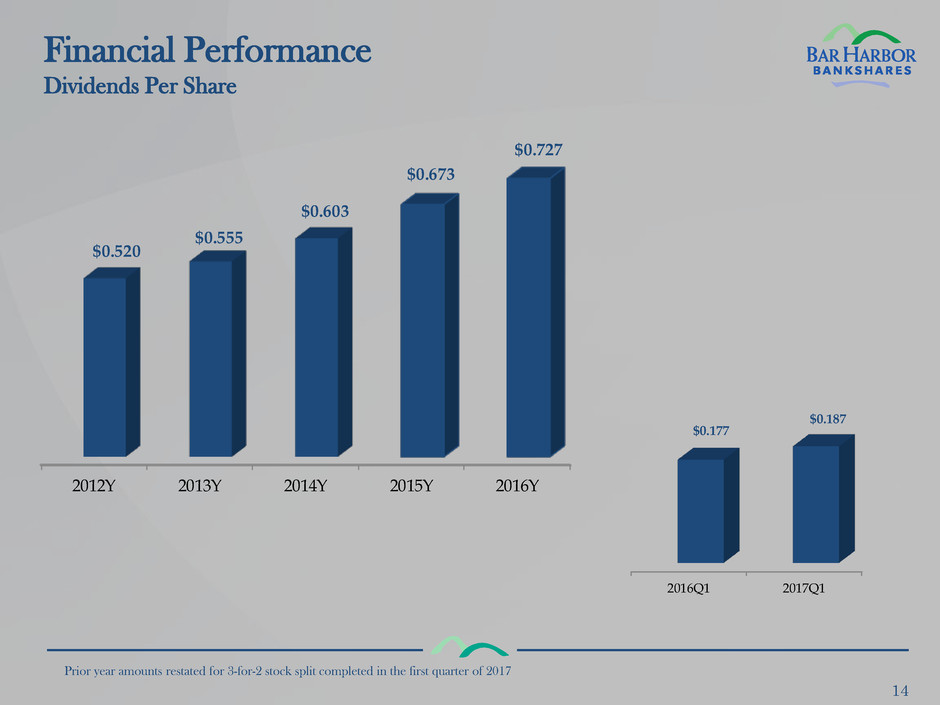
Financial Performance
Dividends Per Share
14
Prior year amounts restated for 3-for-2 stock split completed in the first quarter of 2017
2012Y 2013Y 2014Y 2015Y 2016Y
$0.520
$0.555
$0.603
$0.673
$0.727
2016Q1 2017Q1
$0.177
$0.187
15
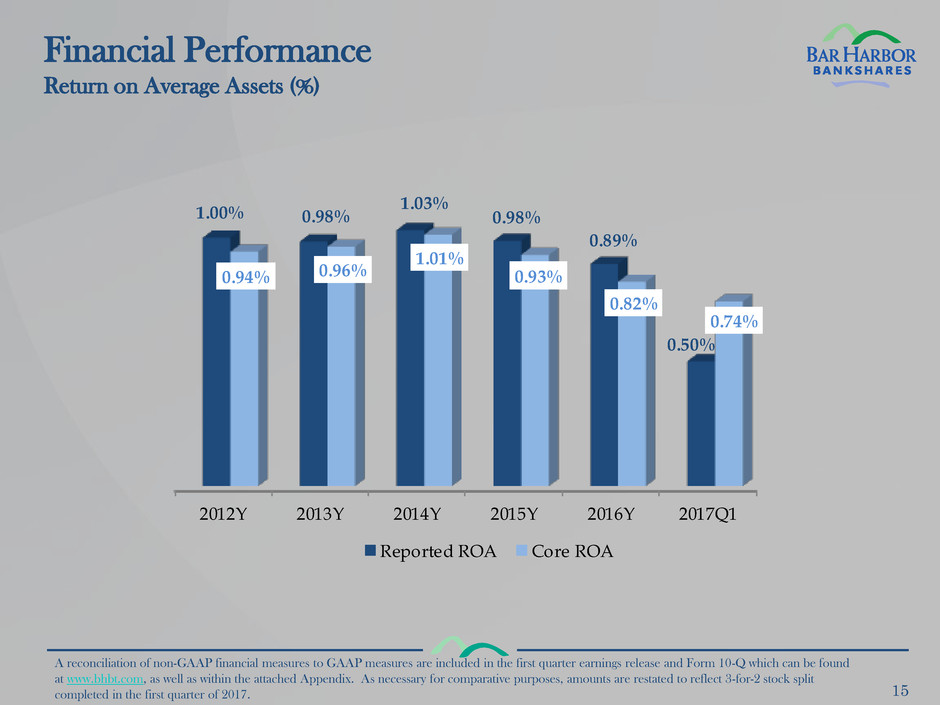
Financial Performance
Return on Average Assets (%)
A reconciliation of non-GAAP financial measures to GAAP measures are included in the first quarter earnings release and Form 10-Q which can be found
at www.bhbt.com, as well as within the attached Appendix. As necessary for comparative purposes, amounts are restated to reflect 3-for-2 stock split
completed in the first quarter of 2017.
2012Y 2013Y 2014Y 2015Y 2016Y 2017Q1
1.00% 0.98%
1.03%
0.98%
0.89%
0.50%
0.94% 0.96%
1.01%
0.93%
0.82%
0.74%
Reported ROA Core ROA
16
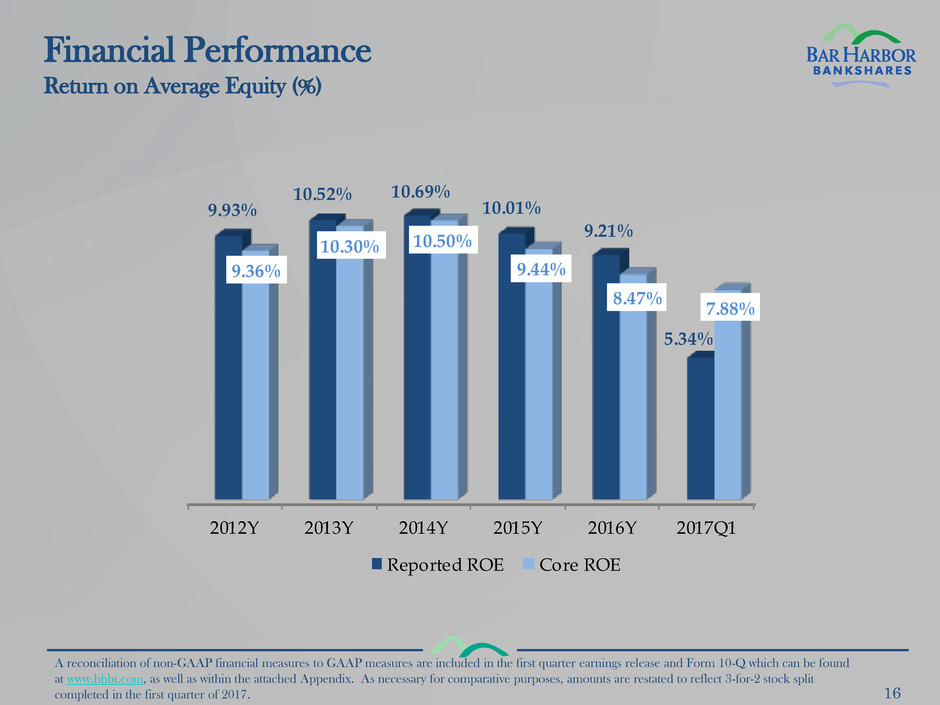
Financial Performance
Return on Average Equity (%)
A reconciliation of non-GAAP financial measures to GAAP measures are included in the first quarter earnings release and Form 10-Q which can be found
at www.bhbt.com, as well as within the attached Appendix. As necessary for comparative purposes, amounts are restated to reflect 3-for-2 stock split
completed in the first quarter of 2017.
2012Y 2013Y 2014Y 2015Y 2016Y 2017Q1
9.93%
10.52% 10.69%
10.01%
9.21%
5.34%
9.36%
10.30% 10.50%
9.44%
8.47%
7.88%
Reported ROE Core ROE
17
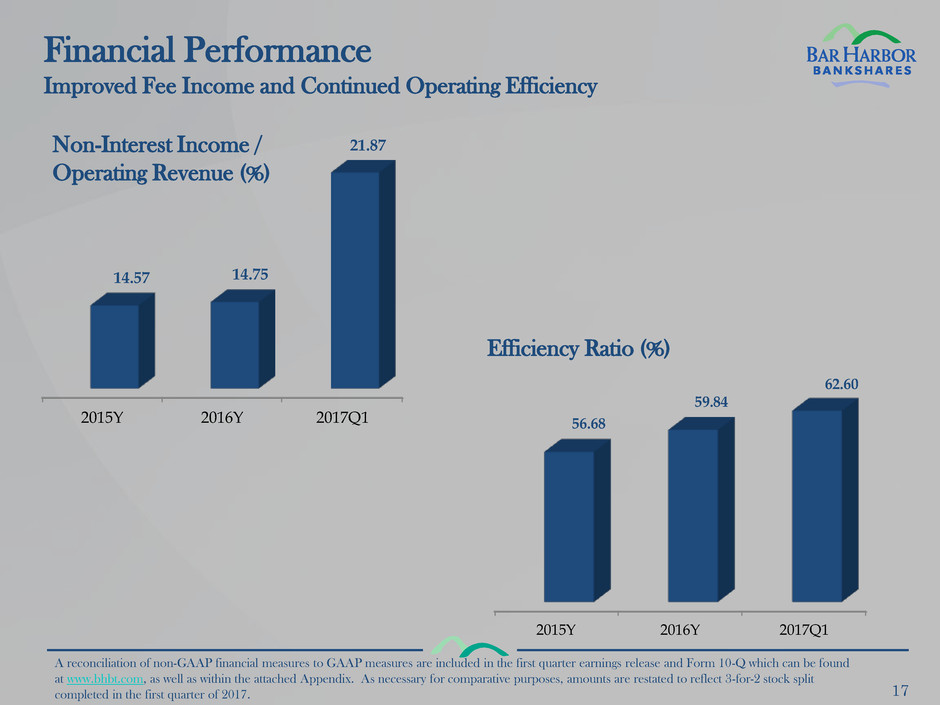
2015Y 2016Y 2017Q1
14.57 14.75
21.87
Non-Interest Income /
Operating Revenue (%)
Financial Performance
Improved Fee Income and Continued Operating Efficiency
2015Y 2016Y 2017Q1
56.68
59.84
62.60
Efficiency Ratio (%)
A reconciliation of non-GAAP financial measures to GAAP measures are included in the first quarter earnings release and Form 10-Q which can be found
at www.bhbt.com, as well as within the attached Appendix. As necessary for comparative purposes, amounts are restated to reflect 3-for-2 stock split
completed in the first quarter of 2017.
Loans
18
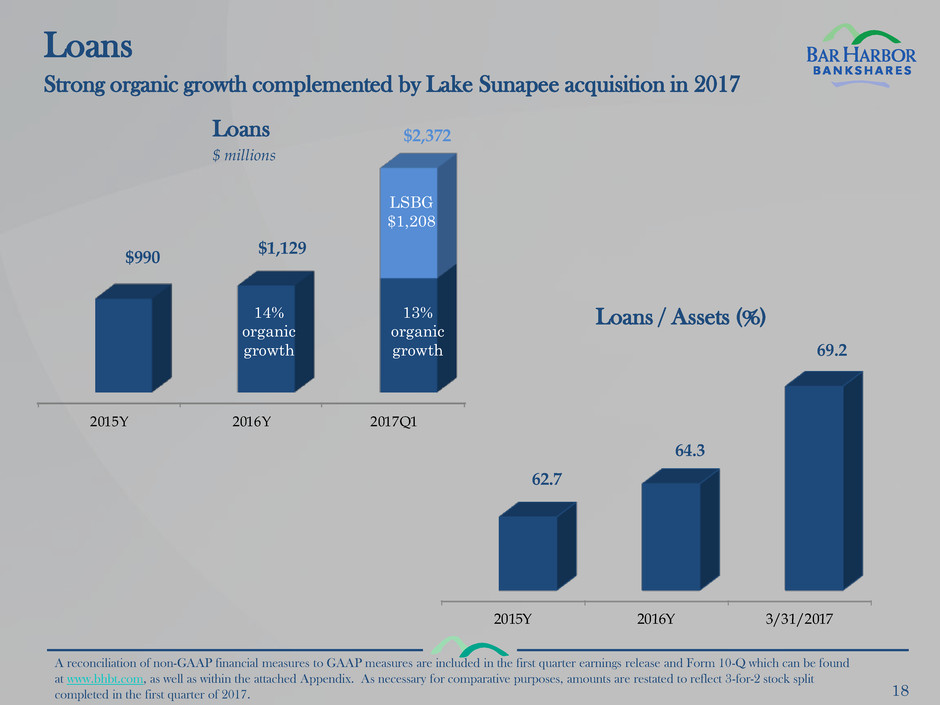
2015Y 2016Y 2017Q1
$990
$1,129
$2,372
Strong organic growth complemented by Lake Sunapee acquisition in 2017
Loans
2015Y 2016Y 3/31/2017
62.7
64.3
69.2
Loans / Assets (%) 14%
organic
growth
13%
organic
growth
LSBG
$1,208
$ millions
A reconciliation of non-GAAP financial measures to GAAP measures are included in the first quarter earnings release and Form 10-Q which can be found
at www.bhbt.com, as well as within the attached Appendix. As necessary for comparative purposes, amounts are restated to reflect 3-for-2 stock split
completed in the first quarter of 2017.
Strengthened Balance Sheet Mix
19
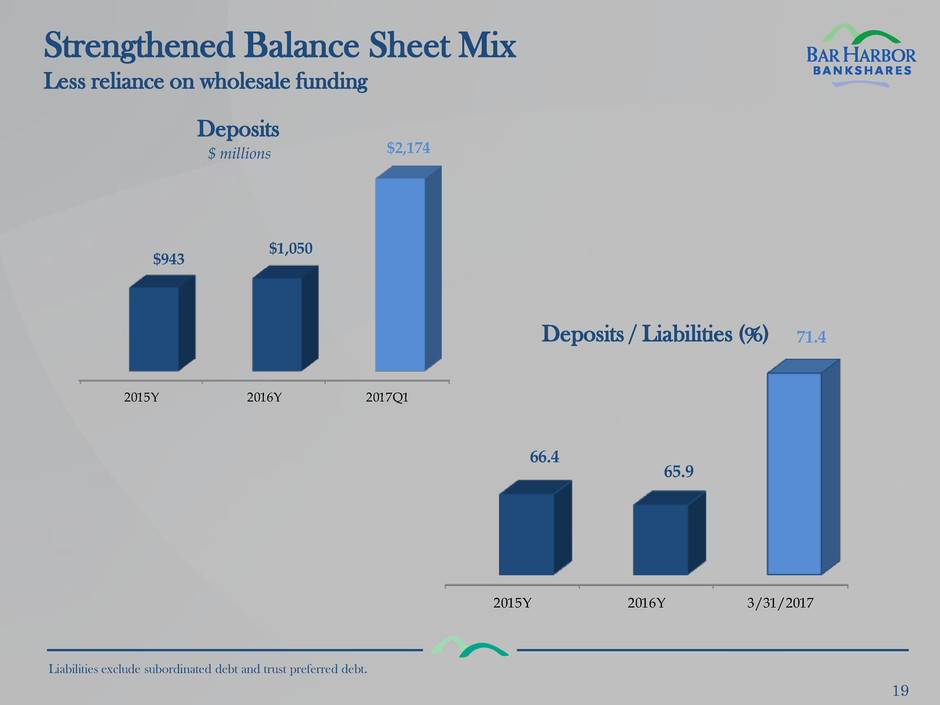
Less reliance on wholesale funding
2015Y 2016Y 3/31/2017
66.4
65.9
71.4
Deposits / Liabilities (%) 2015Y 2016Y 2017Q1
$943
$1,050
$2,174
Deposits
$ millions
Liabilities exclude subordinated debt and trust preferred debt.
Loan Composition (As of 3/31/17)
20
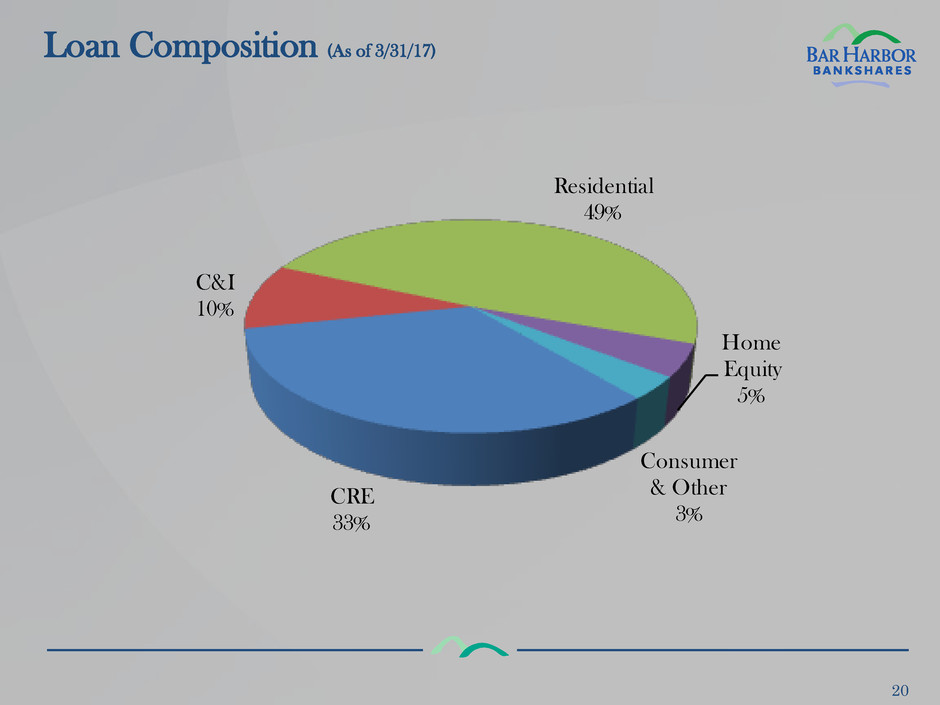
CRE
33%
C&I
10%
Residential
49%
Home
Equity
5%
Consumer
& Other
3%
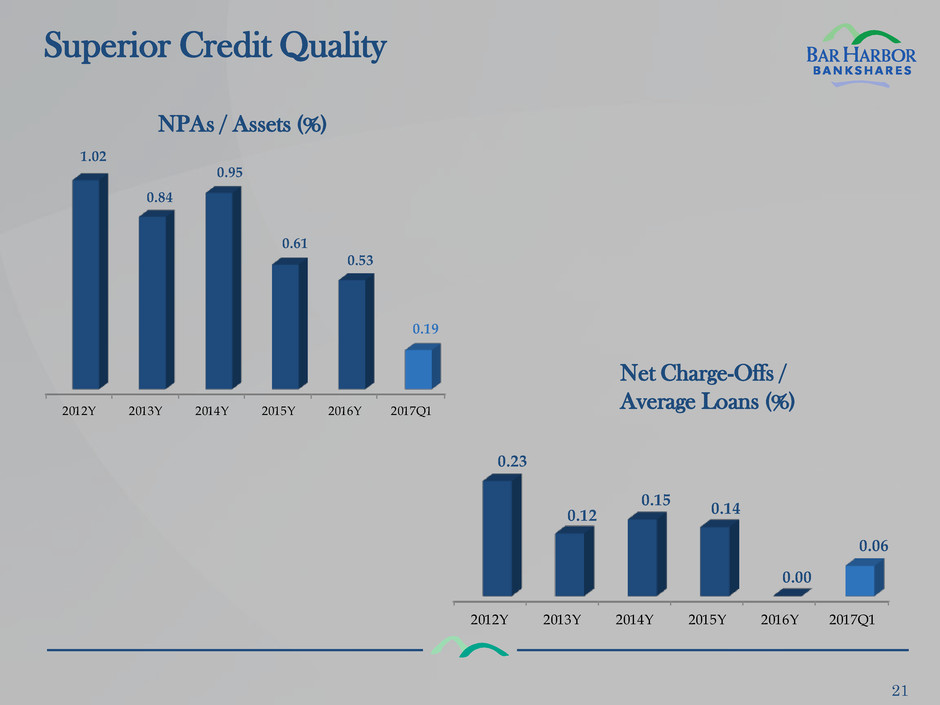
Superior Credit Quality
21
2012Y 2013Y 2014Y 2015Y 2016Y 2017Q1
1.02
0.84
0.95
0.61
0.53
0.19
NPAs / Assets (%)
2012Y 2013Y 2014Y 2015Y 2016Y 2017Q1
0.23
0.12
0.15
0.14
0.00
0.06
Net Charge-Offs /
Average Loans (%)
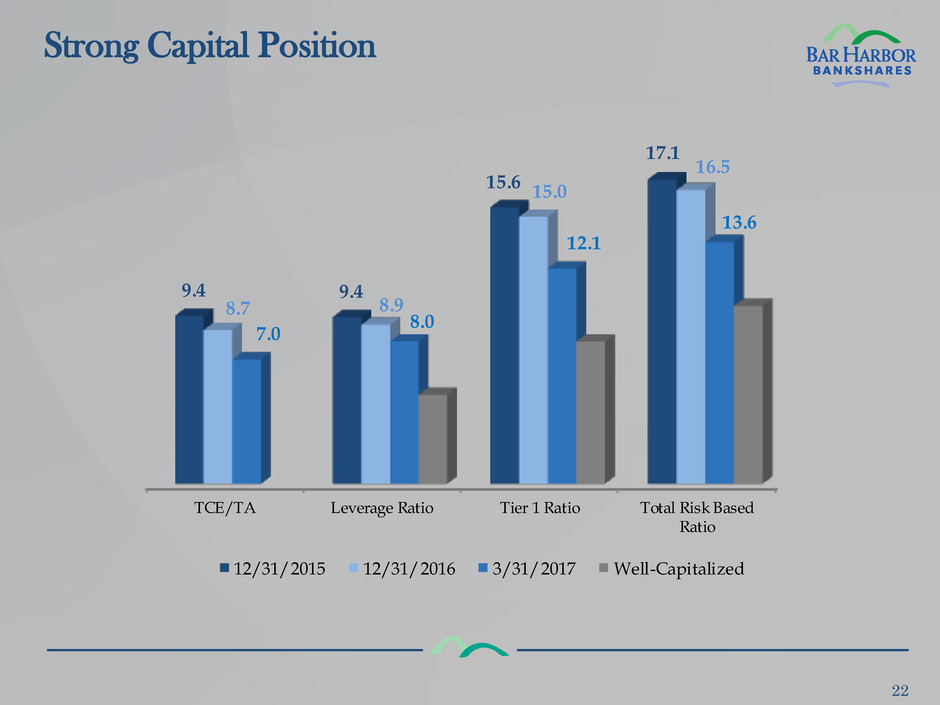
Strong Capital Position
22
TCE/TA Leverage Ratio Tier 1 Ratio Total Risk Based
Ratio
9.4 9.4
15.6
17.1
8.7 8.9
15.0
16.5
7.0
8.0
12.1
13.6
12/31/2015 12/31/2016 3/31/2017 Well-Capitalized
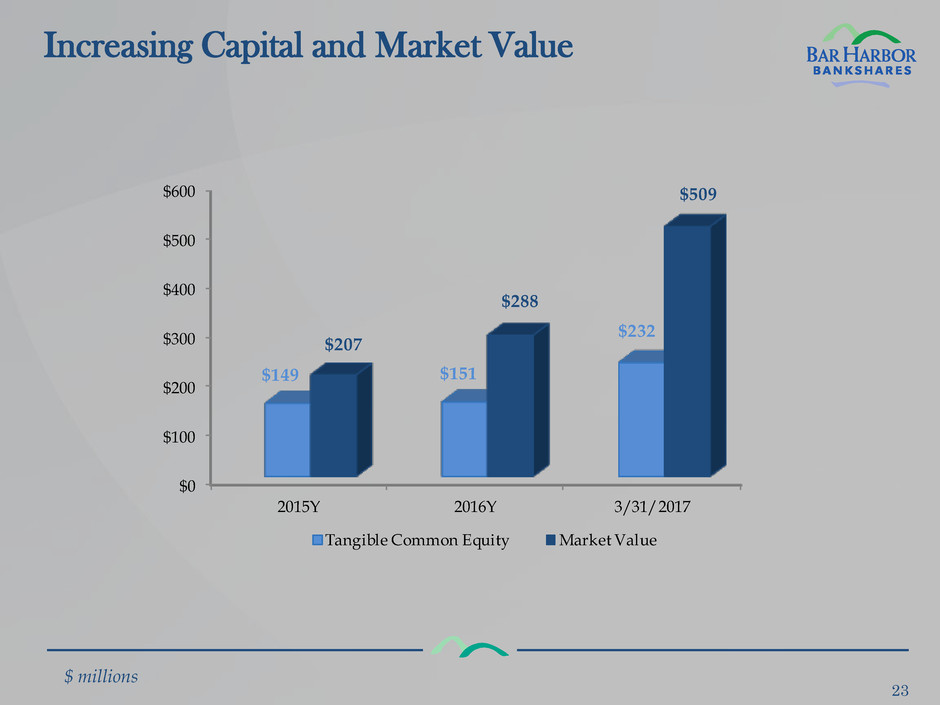
Increasing Capital and Market Value
23
$0
$100
$200
$300
$400
$500
$600
2015Y 2016Y 3/31/2017
$149 $151
$232
$207
$288
$509
Tangible Common Equity Market Value
$ millions
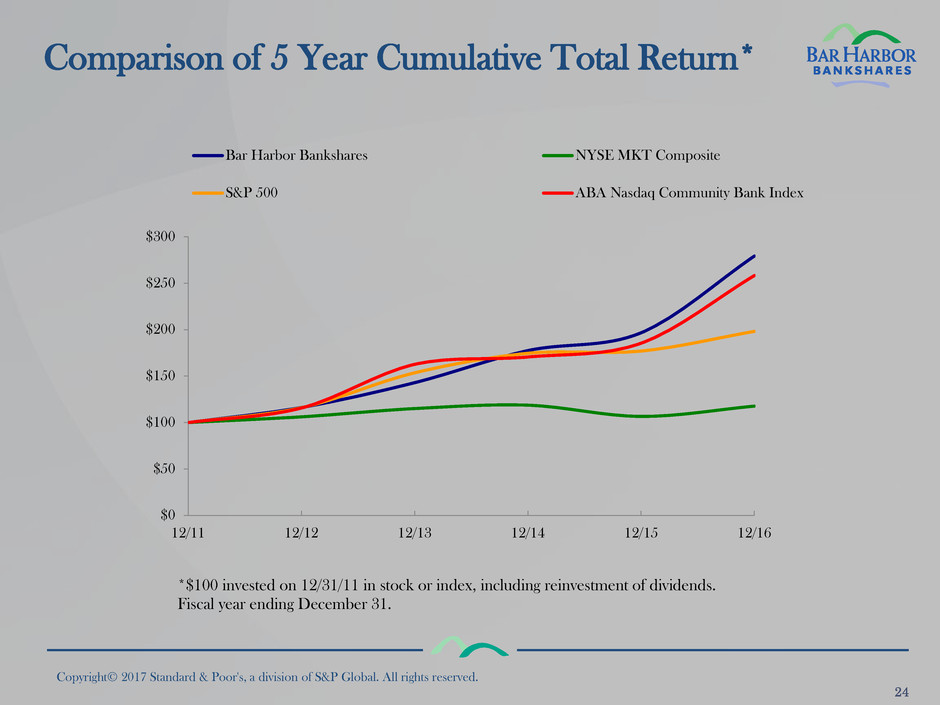
Comparison of 5 Year Cumulative Total Return*
Copyright© 2017 Standard & Poor's, a division of S&P Global. All rights reserved.
$0
$50
$100
$150
$200
$250
$300
12/11 12/12 12/13 12/14 12/15 12/16
Bar Harbor Bankshares NYSE MKT Composite
S&P 500 ABA Nasdaq Community Bank Index
*$100 invested on 12/31/11 in stock or index, including reinvestment of dividends.
Fiscal year ending December 31.
The Path Forward
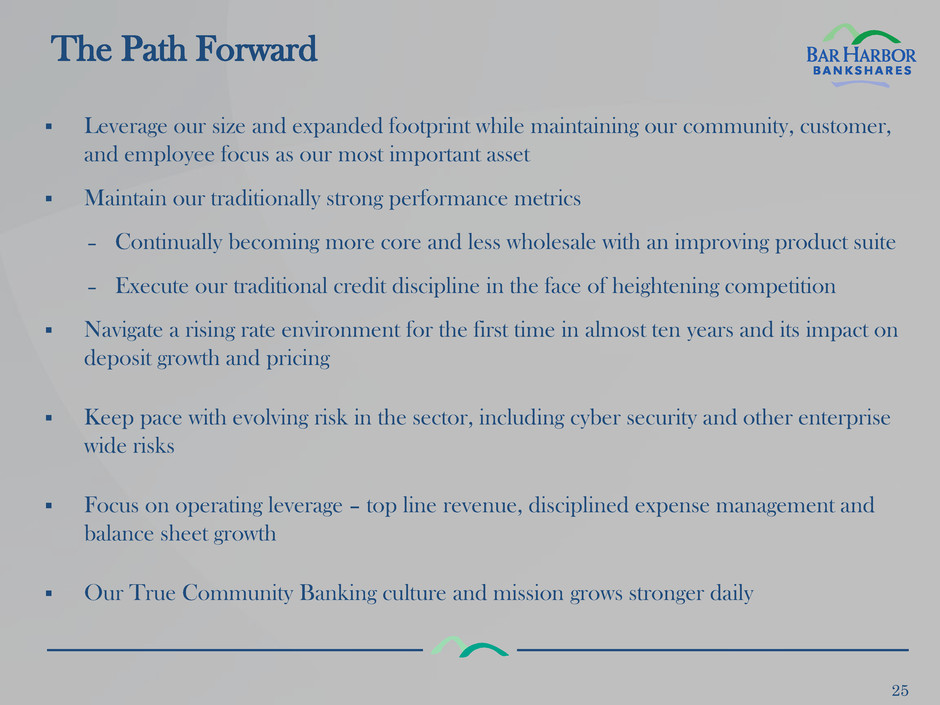
Leverage our size and expanded footprint while maintaining our community, customer,
and employee focus as our most important asset
Maintain our traditionally strong performance metrics
– Continually becoming more core and less wholesale with an improving product suite
– Execute our traditional credit discipline in the face of heightening competition
Navigate a rising rate environment for the first time in almost ten years and its impact on
deposit growth and pricing
Keep pace with evolving risk in the sector, including cyber security and other enterprise
wide risks
Focus on operating leverage – top line revenue, disciplined expense management and
balance sheet growth
Our True Community Banking culture and mission grows stronger daily
25

Appendix
27
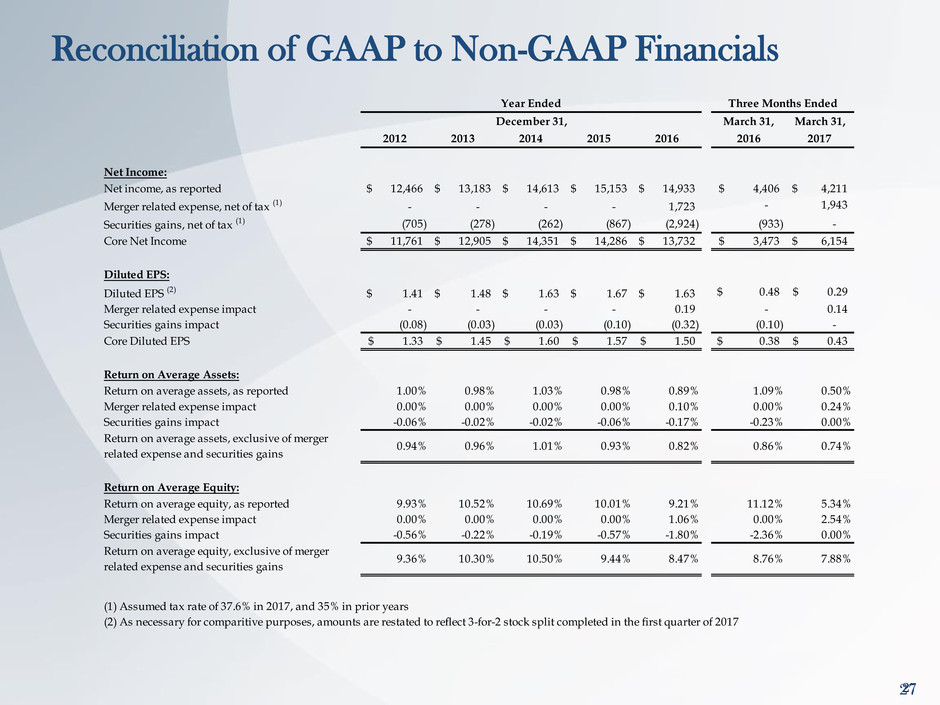
Reconciliation of GAAP to Non-GAAP Financials
2
Year Ended
December 31, March 31, March 31,
2012 2013 2014 2015 2016 2016 2017
Net Income:
Net income, as reported 12,466$ 13,183$ 14,613$ 15,153$ 14,933$ 4,406$ 4,211$
Merger related expense, net of tax (1) - - - - 1,723 - 1,943
Securities gains, net of tax (1) (705) (278) (262) (867) (2,924) (933) -
Core Net Income 11,761$ 12,905$ 14,351$ 14,286$ 13,732$ 3,473$ 6,154$
Diluted EPS:
Diluted EPS (2) 1.41$ 1.48$ 1.63$ 1.67$ 1.63$ 0.48$ 0.29$
Merger related expense impact - - - - 0.19 - 0.14
Securities gains impact (0.08) (0.03) (0.03) (0.10) (0.32) (0.10) -
Core Diluted EPS 1.33$ 1.45$ 1.60$ 1.57$ 1.50$ 0.38$ 0.43$
Return on Average Assets:
Return on average assets, as reported 1.00% 0.98% 1.03% 0.98% 0.89% 1.09% 0.50%
Merger related expense impact 0.00% 0.00% 0.00% 0.00% 0.10% 0.00% 0.24%
Securities gains impact -0.06% -0.02% -0.02% -0.06% -0.17% -0.23% 0.00%
Return on average assets, exclusive of merger
related expense and securities gains
0.94% 0.96% 1.01% 0.93% 0.82% 0.86% 0.74%
Return on Average Equity:
Return on average equity, as reported 9.93% 10.52% 10.69% 10.01% 9.21% 11.12% 5.34%
Merger related expense impact 0.00% 0.00% 0.00% 0.00% 1.06% 0.00% 2.54%
Securities gains impact -0.56% -0.22% -0.19% -0.57% -1.80% -2.36% 0.00%
Return on average equity, exclusive of merger
related expense and securities gains
9.36% 10.30% 10.50% 9.44% 8.47% 8.76% 7.88%
(1) Assumed tax rate of 37.6% in 2017, and 35% in prior years
(2) As necessary for comparitive purposes, amounts are restated to reflect 3-for-2 stock split completed in the first quarter of 2017
Three Months Ended
