Attached files
| file | filename |
|---|---|
| EX-99.1 - ASHLAND GLOBAL HOLDINGS INC | ex99-1.htm |
| 8-K - ASHLAND GLOBAL HOLDINGS INC | form8k.htm |
Exhibit 99.2

Lender Presentation May 15, 2017 Public ashland.com / efficacy usability allure integrity profitability

Forward-Looking Statements This presentation contains forward-looking statements within the meaning of Section 27A of the Securities Act of 1933, as amended and Section 21E of the Securities Exchange Act of 1934, as amended. Ashland has identified some of these forward-looking statements with words such as “anticipates,” “believes,” “expects,” “estimates,” “is likely,” “predicts,” “projects,” “forecasts,” “objectives,” “may,” “will,” “should,” “plans” and “intends” and the negative of these words or other comparable terminology. These forward-looking statements include statements relating to our expectation that the proposed acquisition of Pharmachem Laboratories, Inc. (Pharmachem) will be completed before the end of the June quarter, Pharmachem’s expected revenue and adjusted EBITDA for the year ending September 30, 2017 and that the proposed acquisition will be accretive to earnings per share. In addition, Ashland may from time to time make forward-looking statements in its annual reports, quarterly reports and other filings with the SEC, news releases and other written and oral communications. These forward-looking statements are based on Ashland’s expectations and assumptions, as of the date such statements are made, regarding Ashland’s future operating performance and financial condition, the strategic and competitive advantages of Valvoline and Ashland following the final separation, and future opportunities for each company, as well as the economy and other future events or circumstances. Ashland’s expectations and assumptions include, without limitation, internal forecasts and analyses of current and future market conditions and trends, management plans and strategies, operating efficiencies and economic conditions (such as prices, supply and demand, cost of raw materials, and the ability to recover raw-material cost increases through price increases), and risks and uncertainties associated with the following: Ashland’s substantial indebtedness (including the possibility that such indebtedness and related restrictive covenants may adversely affect Ashland’s future cash flows, results of operations, financial condition and its ability to repay debt); the impact of acquisitions and/or divestitures Ashland has made or may make, including the proposed acquisition of Pharmachem (including the possibility that Ashland may not complete the proposed acquisition of Pharmachem or Ashland may not realize the anticipated benefits from such transactions); and severe weather, natural disasters, and legal proceedings and claims (including environmental and asbestos matters). Various risks and uncertainties may cause actual results to differ materially from those stated, projected or implied by any forward-looking statements, including, without limitation, risks and uncertainties affecting Ashland that are described in Ashland’s most recent Form 10-K (including Item 1A Risk Factors) filed with the SEC, which is available on Ashland’s website at http://investor.ashland.com or on the SEC’s website at http://www.sec.gov. Ashland believes its expectations and assumptions are reasonable, but there can be no assurance that the expectations reflected herein will be achieved. Unless legally required, Ashland undertakes no obligation to update any forward-looking statements made in this presentation whether as a result of new information, future events or otherwise. Information on Ashland’s website is not incorporated into or a part of this presentation. Regulation G: Adjusted Results The information presented herein regarding certain unaudited adjusted results does not conform to generally accepted accounting principles in the United States (U.S. GAAP) and should not be construed as an alternative to the reported results determined in accordance with U.S. GAAP. Ashland has included this non-GAAP information to assist in understanding the operating performance of the company and its reportable segments. The non-GAAP information provided may not be consistent with the methodologies used by other companies. All non-GAAP information related to previous Ashland filings with the SEC has been reconciled with reported U.S. GAAP results. Although Ashland provides forward-looking guidance for adjusted EBITDA, Ashland is not reaffirming or providing forward-looking guidance for U.S. GAAP-reported financial measures or a reconciliation of forward-looking non-GAAP financial measures to the most directly comparable U.S. GAAP measure because it is unable to predict with reasonable certainty the ultimate outcome of certain significant items without unreasonable effort.
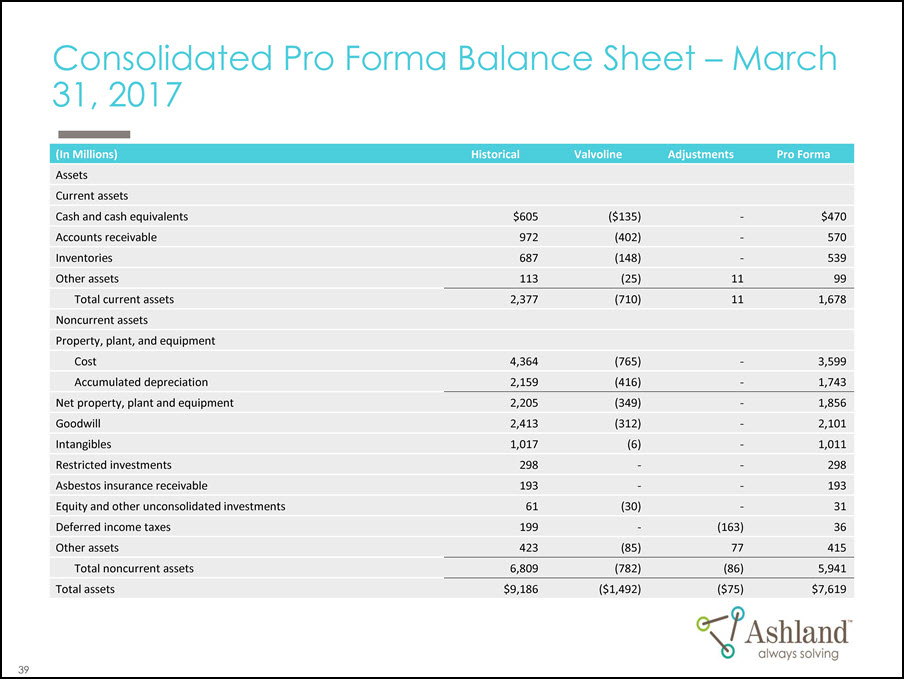
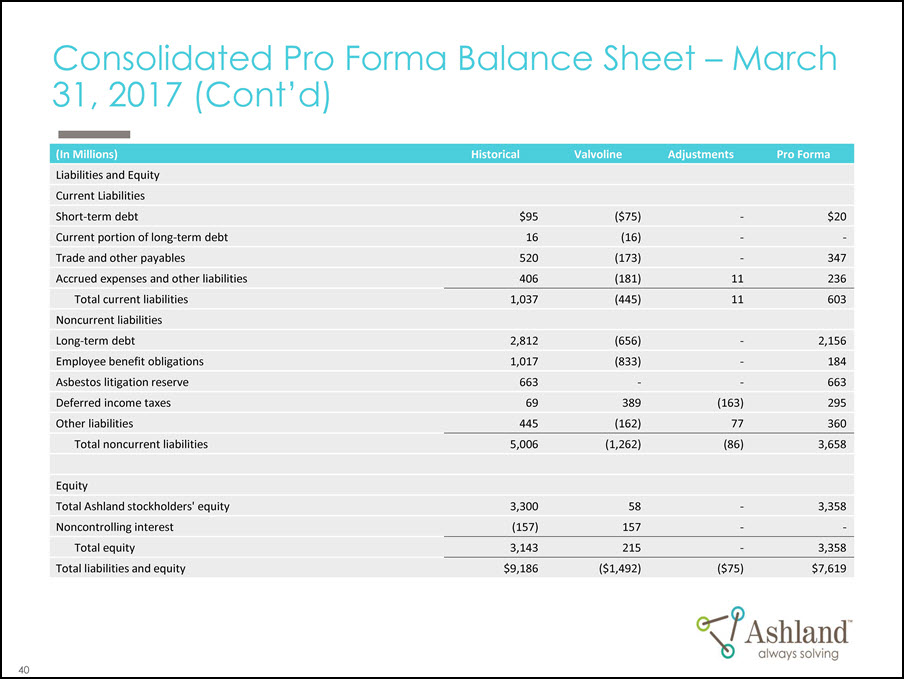
Special Notice Regarding Pro Forma Information Contained Herein This Lender Presentation sets forth certain pro forma financial information. This pro forma financial information gives effect to certain pending transactions and, for historical periods, to the separation of Valvoline. Such pro forma information is based on certain assumptions and adjustments and does not purport to present Ashland’s or Pharmachem’s actual results of operations or financial condition had the transactions reflected in such pro forma financial information occurred at the beginning of the relevant period, in the case of income statement information, or at the end of such period, in the case of balance sheet information, nor is it necessarily indicative of the results of operations that may be achieved in the future. In addition, such assumptions and adjustments may change over time and Ashland undertakes no obligation to update the pro forma financial information contained herein.

Agenda Transaction Overview Ashland Overview and Investment Highlights Financial Update Syndication Process Kirkwood Roland Managing Director, Citi J. Kevin Willis CFO, Ashland Eric Boni Treasurer, Ashland Kirkwood Roland Managing Director, Citi

Transaction Overview

Introduction ● On April 17th Ashland announced the acquisition of Pharmachem Laboratories, Inc. (“Pharmachem”) - Pharmachem is a leading international provider of (i) customized solutions and high quality ingredients to the global health & wellness industries and (ii) high value, differentiated products to fragrance & flavor houses - For the full year ending September 30, 2017, Pharmachem is expected to generate sales and adjusted EBITDA of ~$300mm and ~$60mm, respectively ● Ashland plans to fund the Pharmachem acquisition, refinance its existing revolving credit facility, and refinance its 2018 Senior Notes with new debt facilities and cash on hand: - $800mm Senior Secured Revolving Credit Facility - $500mm Senior Secured Term Loan A, to be used solely to finance the acquisition of the shares of Pharmachem held by the shareholders thereof - $600mm Senior Secured Term Loan B, to be used primarily to retire the 2018 Senior Notes ● Pro forma for the transaction, Ashland’s net secured and net total leverage ratios will be 1.4x and 3.9x, respectively based on LTM 3/31/17 Adj. EBITDA(1) (1) Adjusted EBITDA is a non-GAAP financial measure. See appendix for a reconciliation to the most directly comparable GAAP financial measure.
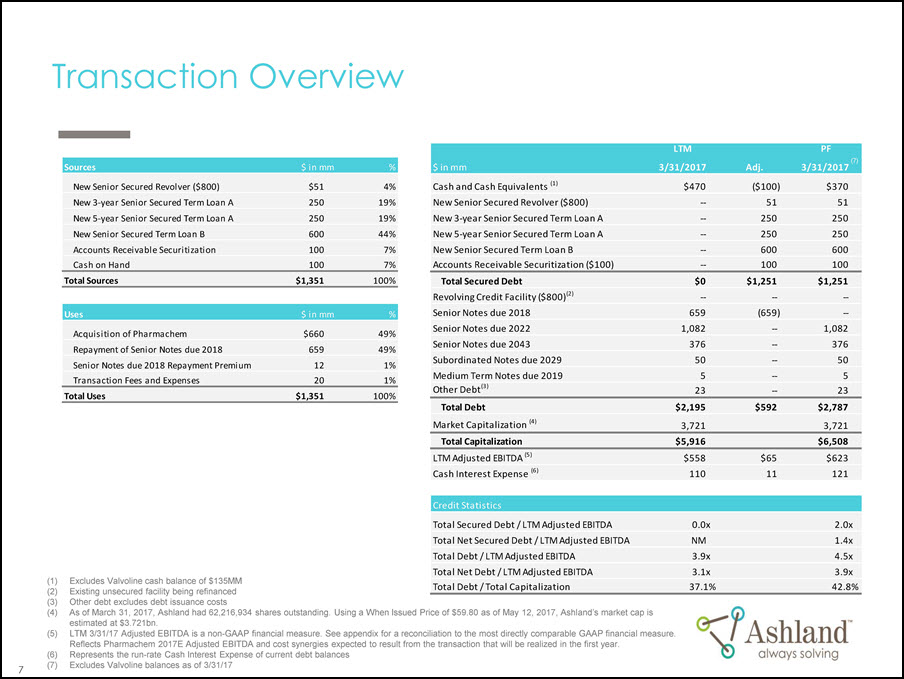
Transaction Overview LTM PF Uses $ in mm % Acquisition of Pharmachem $660 49% Total Sources $1,351 100% Sources Accounts Receivable Securitization Cash on Hand New Senior Secured Revolver ($800) New 3-year Senior Secured Term Loan A New 5-year Senior Secured Term Loan A New Senior Secured Term Loan B $ in mm % $ in mm 3/31/2017 Adj. (7) 3/31/2017 $51 4% Cash and Cash Equivalents (1) $470 ($100) $370 250 19% New Senior Secured Revolver ($800) -- 51 51 250 19% New 3-year Senior Secured Term Loan A -- 250 250 600 44% New 5-year Senior Secured Term Loan A -- 250 250 100 7% New Senior Secured Term Loan B -- 600 600 100 7% Accounts Receivable Securitization ($100) -- 100 100 Senior Notes due 2018 659 (659) - Senior Notes due 2022 1,082 -- 1,082 Senior Notes due 2043 376 -- 376 Subordinated Notes due 2029 50 -- 50 Other Debt(3) 23 -- 23 Revolving Credit Facility ($800)(2) -- -- -- Medium Term Notes due 2019 5 -- 5 Total Secured Debt $0 $1,251 $1,251 Total Debt $2,195 $592 $2,787 Total Uses $1,351 100% Transaction Fees and Expenses 20 1% Senior Notes due 2018 Repayment Premium 12 1% Repayment of Senior Notes due 2018 659 49% (1) Excludes Valvoline cash balance of $135MM (2) Existing unsecured facility being refinanced Market Capitalization (4) 3,721 3,721 Total Capitalization $5,916 $6,508 LTM Adjusted EBITDA (5) $558 $65 $623 Credit Statistics Total Secured Debt / LTM Adjusted EBITDA 0.0 x 2.0 x Cash Interest Expense (6) 110 11 121 Total Net Secured Debt / LTM Adjusted EBITDA NM 1.4x Total Debt / LTM Adjusted EBITDA 3.9x 4.5x Total Net Debt / LTM Adjusted EBITDA 3.1x 3.9x Total Debt / Total Capitalization 37.1% 42.8% (3) Other debt excludes debt issuance costs (4) As of March 31, 2017, Ashland had 62,216,934 shares outstanding. Using a When Issued Price of $59.80 as of May 12, 2017, Ashland’s market cap is estimated at $3.721bn. (5) LTM 3/31/17 Adjusted EBITDA is a non-GAAP financial measure. See appendix for a reconciliation to the most directly comparable GAAP financial measure. Reflects Pharmachem 2017E Adjusted EBITDA and cost synergies expected to result from the transaction that will be realized in the first year. (6) Represents the run-rate Cash Interest Expense of current debt balances (7) Excludes Valvoline balances as of 3/31/17

Ashland Overview and Investment Highlights
Investment Highlights Market Leading Specialty Ingredients and Performance Materials Businesses Focused on Higher Growth / Less Cyclical Specialty Products End-market Diversity Experienced Management Team History of Prudent Balance Sheet Management
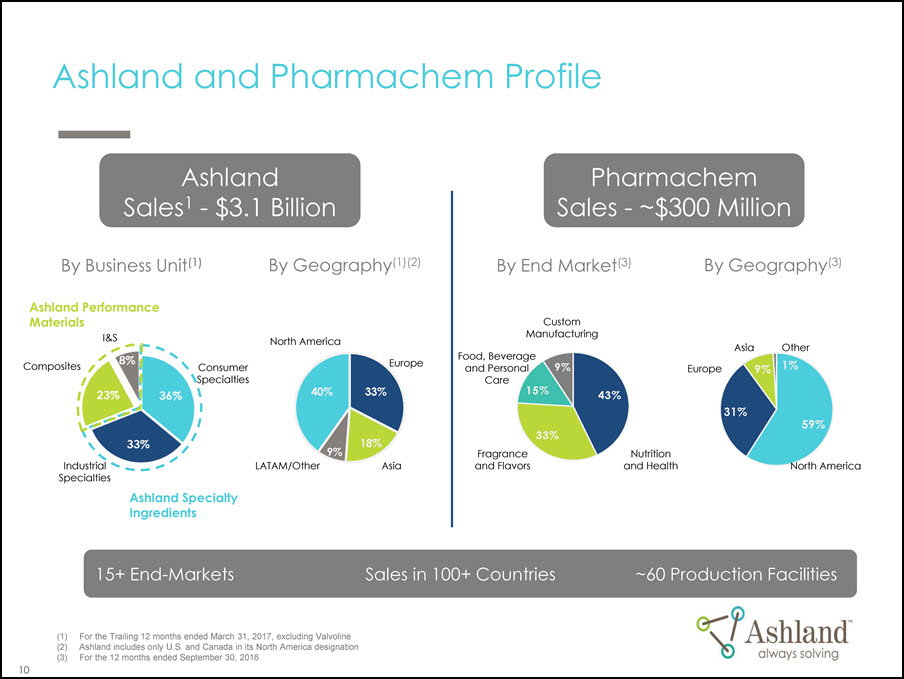
Ashland and Pharmachem Profile Pharmachem Sales - ~$300 Million By End Market(3) By Geography(3) Asia Other Europe 9% 31% 1% 59% North America By Business Unit(1) Ashland Performance Materials By Geography(1)(2) North America I&S Composites Consumer Specialties Industrial Specialties Asia LATAM/Other Europe 40% 33% 18% 9% Ashland Sales1 - $3.1 Billion Custom Manufacturing Fragrance and Flavors Nutrition and Health Food, Beverage and Personal Care 9% 15% 43% 33% Ashland Specialty Ingredients 15+ End-Markets Sales in 100+ Countries ~60 Production Facilities 10 (1) For the Trailing 12 months ended March 31, 2017, excluding Valvoline (2) Ashland includes only U.S. and Canada in its North America designation (3) For the 12 months ended September 30, 2016
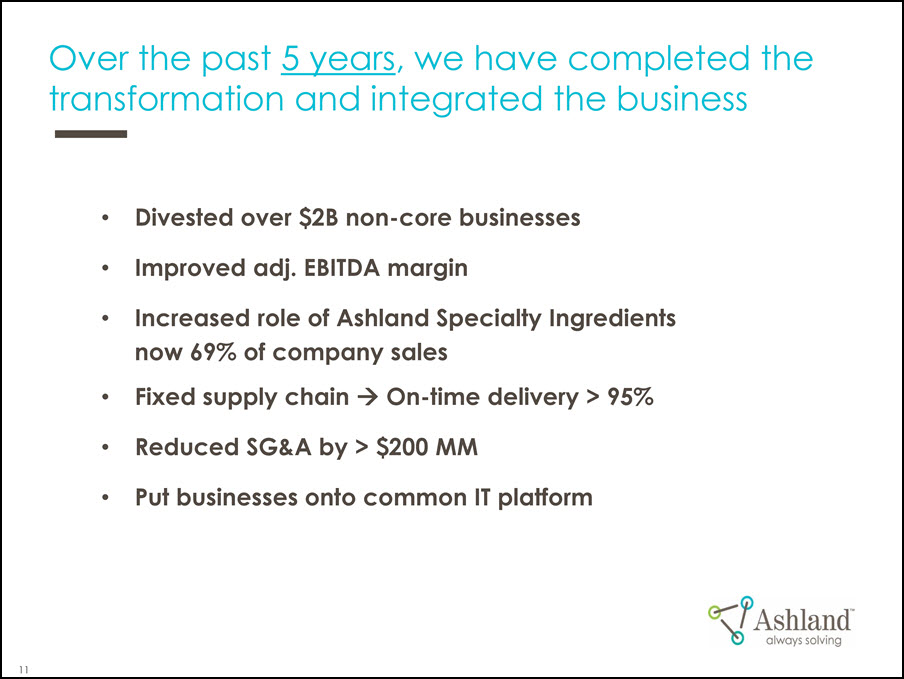
Over the past 5 years, we have completed the transformation and integrated the business ● Divested over $2B non-core businesses ● Improved adj. EBITDA margin ● Increased role of Ashland Specialty Ingredients now 69% of company sales ● Fixed supply chain 4 On-time delivery > 95% ● Reduced SG&A by > $200 MM ● Put businesses onto common IT platform

Over the last 18 months, we have successfully completed the separation of Valvoline ● Completed IPO in September 2016 - Net proceeds from Valvoline capital raised along with cash on hand dividended to Ashland and were used to fund $1.9bn of gross debt reduction ● Took actions to enable cost neutrality ● Kept separation costs <$150mm ● Valvoline had approximately $875mm in Pension and OBEB Liabilities as of 12/31/16, primarily comprised of US plans assumed from Ashland ● Kept mid to high BB credit ratings for both companies Distribution date May 12, 2017

Pharmachem Profile - Leading provider of: - Customized solutions and high quality ingredients to the global health and wellness industries - High value, differentiated products to fragrance and flavor houses - Applications include nutraceuticals, fine perfumes, laundry and personal care products, skin care, cosmetics and food and beverage FY’16 Pharmachem Revenue By End Market Custom Manufacturing Food, Beverage and Personal Care Nutrition and Health Fragrance and Flavors FY’16 Pharmachem Revenue By Geography Asia Other - Strong capabilities in extraction, refining, granulation, spray drying, turnkey packaging solutions, fermentation and fermentation purification Europe North America - Revenue of -$300 million and adjusted EBITDA margin of -20% Strong commercial & financial profile

Pharmachem fits our investment philosophy Winning Strategy Core Principles ... ... In Action: Pharmachem - Fit with Ashland Specialty model - Profit zone: Pharma and PC - Differentiation: Unique, high value ingredients critical to customer product - Customization: Highly customized formulations - Financial returns: See below - Fit with Ashland Specialty model - “One degree from the core” - Technology - Manufacturing - Geography - Customer/market - Economics - Near-term EPS accretion - Risk weighted returns well above WACC - Strong cash conversion - Cost driven synergies - Maintain mid to high BB credit rating (1) Pharma and Nutritional Specialties, and Personal Care - “One degree from the core” Advanced formulation expertise Complementary production capabilities US/EU centric Close connection to PNS1 & PC1; new opportunity in fragrances and flavors Economics Expected to be accretive 1st year Attractive double digit returns Strong cash conversion ~$10MM cost / ~$110MM NPV expected tax synergies Believe metrics substantiate mid to high BB credit ratings

We are focused on higher growth / less cyclical Specialty Products Blue chip markets - Technology: Leverage our core platforms Customers: Technology, brand and quality critical - End markets: Close to consumer - Competitive landscape: - Few approved suppliers - High barriers to entry Small cost with big impact on end product - Amplify the efficacy Refine the usability Add to the allure - Ensure the integrity - Improve the profitability Ashland always solving Customization differentiates R&D: Create proprietary platforms - Derivatize: Enhance functionality - Tech service: Improve customer application - Leverage our brand name, specifications or claims Financial returns EBITDA% of sales > 20% GDP + growth - Low cyclicality/volatility - Strong cash conversion ROIC well above VVACC
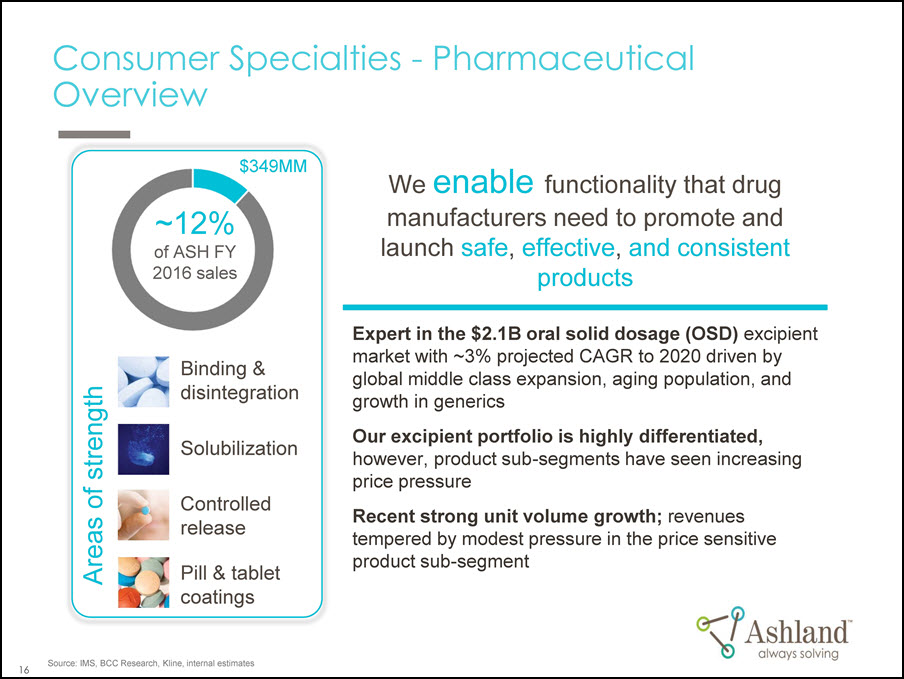
Consumer Specialties – Pharmaceutical Overview Source: IMS, BCC Research, Kline, internal estimates We enable functionality that drug manufacturers need to promote and launch safe, effective, and consistent products Expert in the $2.1B oral solid dosage (OSD) excipient market with ~3% projected CAGR to 2020 driven by global middle class expansion, aging population, and growth in generics Our excipient portfolio is highly differentiated, however, product sub-segments have seen increasing price pressure Recent strong unit volume growth; revenues tempered by modest pressure in the price sensitive product sub-segment Areas of strength ~12% of ASH FY 2016 sales Binding & disintegration Solubilization Pill & tablet coatings Controlled release $349MM

Consumer Specialties – Personal Care Overview Source: Euromonitor, Datamonitor, Kline, BCC, Internal estimates We innovate scientifically proven solutions for personal care with specialty ingredient platforms in vinyl pyrrolidone, vinyl ether, cellulosics and biofunctionals Leader in $6B specialty ingredients market with ~3% projected CAGR to 2020 due to mega-trends: rising emerging market middle class and shift to higher-price natural products Strong volume growth 2013-16, driven by specialty areas that are high-performance and innovation-focused (e.g., biofunctionals) Some margin and pricing pressures due to increased competition in the lower end of our offering (e.g., purchase-for-resale) 3 specialty areas ~19% of ASH FY 2016 sales Hair care Oral care Skin care $566MM

Source: Kline, Internal estimates Personal Care – Three business areas with strong market presence Hair care Top 3 in styling fixatives Top 3 in hair rheology Top 10 in conditioning polymers Oral care Leader in functional polymers and denture bioadhesives Pioneered whitening actives delivery Skin care Pioneered sunscreen waterproofing Top 3 in skin rheology Top 5 in UV absorbers Top 10 in biofunctionals Broad product range and leading positions in hair, oral and skin
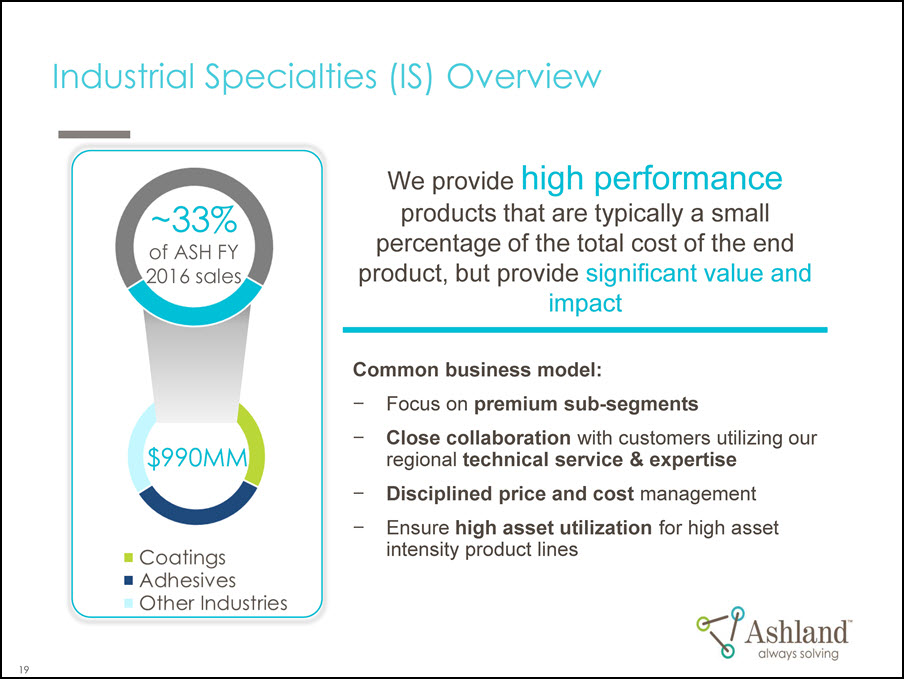
Industrial Specialties (IS) Overview ~33% of ASH FY 2016 sales $990MM We provide high performance products that are typically a small percentage of the total cost of the end product, but provide significant value and impact Common business model: - Focus on premium sub-segments - Close collaboration with customers utilizing our regional technical service & expertise - Disciplined price and cost management - Ensure high asset utilization for high asset intensity product lines

Industrial Specialties (IS) Overview (Cont’d) Energy (E) Construction (C) Performance Specialties (PS) Source: KNG, IHS, internal estimates Coatings Our 3 strengths Rheology Surfactants Foam control ● $321MM or ~11% of ASH FY 2016 sales ● Market leader in $2.8B market for architectural coatings additives with a 3% CAGR ● Our segmented strategy is driving growth in the premium segment Packaging Transportation Structural & Graphics ● $332MM or ~11% of ASH FY 2016 sales ● Niche player in the $22B specialty formulated adhesives market with a 3% CAGR ● Our adhesives portfolio is nimble, capturing a premium in niche applications throughout the market Adhesives Our key end uses Other Industries 3 main segments ● $337MM or ~11% of ASH FY 2016 sales ● PS: Focus on unique applications with complex performance needs ● E: Energy is a much smaller portion of today’s IS portfolio, with a recent uptick as oil prices have recovered ● C: Focus on premium applications & improving productivity. Significant cost restructuring and asset focus will drive success

Ashland Specialty Ingredients End-market Diversity ● Tablets ● Capsules ● Wound Care ● Tablets ● Shampoos ● Conditioners ● Mousses/gels ● Hairspray Disintegrants/ Time Release Oral Care Coatings Hair Care Binders Skin Care Pharma Personal Care Nutrition Coatings Adhesives Construction Energy ● Skin lotions ● Anti-aging products ● Body washes ● Suncare ● Food— texturant ● Custom food blends ● Clarification ● Stabilization Food Beverage ● Water based architectural paints ● Paints ● Adhesives Paint and Coatings Emulsion Polymerization Transportation ● Light-weighting ● Structural integrity ● Pressure sensitive ● Laminating adhesives Packaging and Converting Building and Construction ● Dry Mortar ● Gypsum ● Joint compound Additives Drilling ● Fluids ● Muds ● Mortar additives Stimulation/ Production Cementing ● Tablets ● Capsules ● Toothpaste ● Mouthwash ● Denture adhesives ● Engineered wood ● Proppants ● Yield enhancers

Composites Overview $669MM ~22% of ASH FY 2016 sales Specialties Epoxy vinyl ester resins (EVER) Gelcoat Core Unsaturated polyester resins (UPR) Source: Euromonitor, Datamonitor, Kline, BCC, Internal estimates We solve customer problems around the world, improving the integrity and allure of their composite products with high performance resins Premium resins used in structural & semi-structural applications - Infrastructure – corrosion & fire retardant - Automotive & heavy duty truck - Marine - Building & construction Strong gross profit growth 2013-16 despite flat volume due to aggressive cost & margin management Divided our business into core (UPR) and specialties (EVER, Gelcoat)
Intermediates / Solvents Overview One of world’s leading producers and suppliers of: ● 1-4 butanediol (BDO) ● Tetrahydrofuran (THF) ● N-methyl-pyrrolidone (NMP) ● Gamma-butyrolactone (GBL, BLO) Diverse end markets including: ● Electronics ● Pharmaceuticals ● Shoe soles ● Water filtration Supply Ashland Specialty Ingredients and merchant market 23 Manufacturing facilities: ● Lima, Ohio, USA ● Marl, Germany

Experienced Management Team Bill Wulfsohn Chairman and CEO ● Former CEO Carpenter Technology ● Previous leadership roles at PPG, Honeywell, Morton International / Rohm & Haas ● Serves as a Director of PolyOne Corporation Kevin Willis SVP & CFO ● Nearly 30 yrs at Ashland ● Leads worldwide financial functions and processes including the transformation to new Ashland Brian McGrath VP Supply Chain ● 27 yrs with Ashland in various leadership roles ● Moving to Zurich in June to also lead European Leadership team Dr. Osama Musa VP R&D & CTO ● More than 350 patents and patents pending ● Published book on Maleic Anhydride based materials Dave Neuberger VP Pharma, Nutrition & Agriculture ● Former director Ashland IR, 10 yrs at Ashland Andy Johnston Group VP Composites ● 23 yrs at Ashland focused on composites and adhesives Anne Schumann VP HR & IT ● Multi-faceted career with leadership roles in finance, IT, supply chain & HR Suzanne Rowland Group VP Industrial Specialities ● 17 yrs of senior executive and Board experience Vito Consiglio VP Personal and Home Care ● 23 yrs in Specialty Chemicals Peter Ganz SVP, General Counsel & Secretary ● 30 yrs private and corporate law experience ● 12 yrs general counsel for multinational corporations ● 6 yrs at Ashland Jean Zappia VP, Intermediates and Solvents ● 30 yrs chemical industry experience ● Featured in "Successful Women in Chemistry - Corporate America's Contribution to Science" Dr. Keith Silverman VP, EHS, Quality & Regulatory Affairs ● 23 yrs in pharmaceuticals- R&D, EHS ● 14 patents ● 5 yrs at Ashland ● Board Member SOCMA Operating Committee Executive Committee

Financial Update

Historical Financial Overview (1) Adjusted EBITDA & Margin(2) ($ in mm) Revenues ($ in mm) $4,080 $686 $677 $3,420 $598 $558 16.8% 19.8% 19.8% 18.3% $3,019 $3,054 FY 2014 FY 2015 FY 2016 LTM Q2 2017 FY 2014 FY 2015 FY 2016 LTM Q2 2017 EBITDA EBITDA Margin Commentary Sales decline from FY 2014 to FY 2016 driven by: - -$260 million from pricing declines, which were more than offset by falling raw material prices - -$340 million from divestitures - -$250 million from foreign currency impact - -$160 million from energy market decline Primary drivers of Adjusted EBITDA reductions from FY 2014 to FY 2016 include: - -$55 million of negative currency translation impact in ASI and APM - -$50 million of net negative impact from acquisitions / divestitures / other in ASI and APM including Elastomers divestiture Decline in Adjusted EBITDA from FY 2016 to TTM Q2 2017 is primarily due to margin declines in the I&S division within APM (1) Excludes Valvoline (2) Adjusted EBITDA and Adjusted EBITDA margin are non-GAAP financial measures. See appendix for reconciliation to the most directly comparable GAAP financial measure. Capex ($ in mm) $220 $212 $230 $218 FY 2014 FY 2015 FY 2016 LTM Q2 2017

Financial Outlook: Driven by 7 core levers 2018 – 2021 Performance Targets Adjusted ASI EBITDA (%) >25%* Cash generation1 $1B+ Adjusted EPS growth (CAGR) >15% o New actions to sustain and grow premium mix 1. Evolve business portfolio 2. Implement new market strategies 3. Expand new and proprietary product sales2 (NPI) o New initiatives to improve competitiveness 4. Asset utilization programs 5. Price to value efforts 6. SG&A inflation initiatives 7. Ensure CapEx plus changes in working capital <6.5% per year
Note: Adjusted EPS growth, Adjusted EBITDA and Free Cash Flow are forward looking non-GAAP financial measures. See Slide 1 for an explanation for why reconciliations are not available to the most directly comparable forward looking GAAP financial measure; 1. Cumulative Free Cash Flow generation over target period less certain key items; 2. New and Proprietary Product Sales defined as new products in the market for <= 5 years and patented products for life of patent * = 2021 Adjusted EBITDA Target. Does not represent guidance.

2

Capital allocation - Current Priorities First priority Debt Reduction -Eliminate debt related to Pharmachem acquisition -Reduce other debt as appropriate -Remain committed to targeting mid to high BB credit ratings - Expected gross debt / Adjusted EBITDA below 3.5x(1) over time Other allocation priorities Organic investment Acquisitions Return cash to shareholders Dividends -Capital expenditures + working capital investment < 6.5% of sales -Willing to pursue high return opportunities -Selective small to mid¬sized acquisitions with attractive returns well in excess of our cost of capital -Yield and payout ratios in line with specialty chemicals peers Share repurchases -Opportunistic after leverage reduced Primary focus – debt reduction (1) Adjusted EBITDA is a forward looking non-GAAP financial measure. See slide 1 for an explanation for why reconciliations are not available to the most directly comparable forward-looking GAAP financial measure.

Syndication Overview
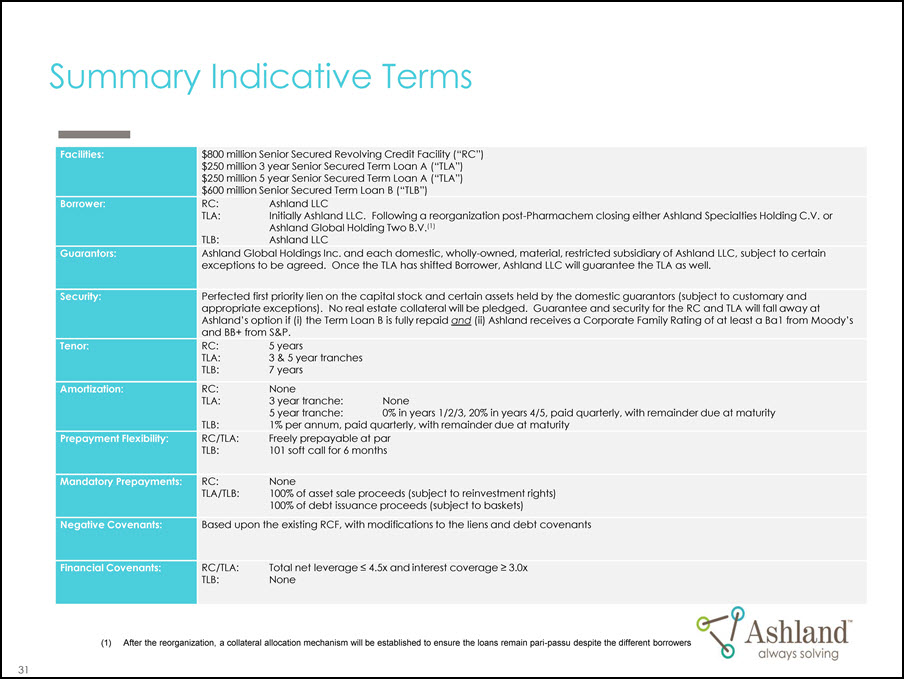
Summary Indicative Terms Facilities: $800 million Senior Secured Revolving Credit Facility (“RC”) $250 million 3 year Senior Secured Term Loan A (“TLA”) $250 million 5 year Senior Secured Term Loan A (“TLA”) $600 million Senior Secured Term Loan B (“TLB”) Borrower: RC: Ashland LLC TLA: Initially Ashland LLC. Following a reorganization post-Pharmachem closing either Ashland Specialties Holding C.V. or Ashland Global Holding Two B.V.(1) TLB: Ashland LLC Guarantors: Ashland Global Holdings Inc. and each domestic, wholly-owned, material, restricted subsidiary of Ashland LLC, subject to certain exceptions to be agreed. Once the TLA has shifted Borrower, Ashland LLC will guarantee the TLA as well. Security: Perfected first priority lien on the capital stock and certain assets held by the domestic guarantors (subject to customary and appropriate exceptions). No real estate collateral will be pledged. Guarantee and security for the RC and TLA will fall away at Ashland’s option if (i) the Term Loan B is fully repaid and (ii) Ashland receives a Corporate Family Rating of at least a Ba1 from Moody’s and BB+ from S&P. Tenor: Amortization: RC: 5 years TLA: 3 & 5 year tranches TLB: 7 years RC: None TLA: 3 year tranche: None 5 year tranche: 0% in years 1/2/3, 20% in years 4/5, paid quarterly, with remainder due at maturity TLB: 1% per annum, paid quarterly, with remainder due at maturity Prepayment Flexibility: RC/TLA: Freely prepayable at par TLB: 101 soft call for 6 months Mandatory Prepayments: RC: None TLA/TLB: 100% of asset sale proceeds (subject to reinvestment rights) 100% of debt issuance proceeds (subject to baskets) Negative Covenants: Based upon the existing RCF, with modifications to the liens and debt covenants Financial Covenants: RC/TLA: Total net leverage 4.5x and interest coverage 3.0x TLB: None (1) After the reorganization, a collateral allocation mechanism will be established to ensure the loans remain pari-passu despite the different borrowers

Transaction Timeline May 2017 S M T W T F S 1 2 3 4 5 6 7 8 9 10 11 12 13 14 15 16 17 18 19 20 12 13 1415 Bank Holiday 21 22 23 24 25 26 27 28 29 30 31 Date Event May 15 ● May 24 ● Late May ● Launch TLB Syndication TLB Commitments due at Noon Eastern Expected Closing and Funding of TLB

2
2

2
2

2
2
2
2

2
2

2
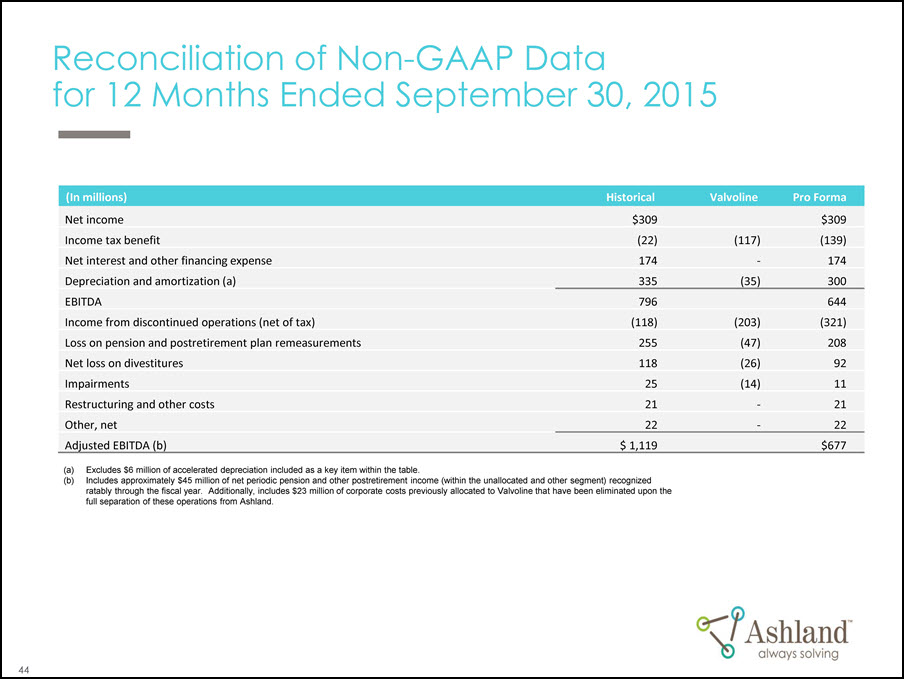
Reconciliation of Non-GAAP Data for 12 Months Ended September 30, 2015 (In millions) Historical Valvoline Pro Forma Net income $309 $309 Income tax benefit (22) (117) (139) Net interest and other financing expense 174 - 174 Depreciation and amortization (a) 335 (35) 300 EBITDA 796 644 Income from discontinued operations (net of tax) (118) (203) (321) Loss on pension and postretirement plan remeasurements 255 (47) 208 Net loss on divestitures 118 (26) 92 Impairments 25 (14) 11 Restructuring and other costs 21 - 21 Other, net 22 - 22 Adjusted EBITDA (b) $ 1,119 $677 (a) Excludes $6 million of accelerated depreciation included as a key item within the table. (b) Includes approximately $45 million of net periodic pension and other postretirement income (within the unallocated and other segment) recognized ratably through the fiscal year. Additionally, includes $23 million of corporate costs previously allocated to Valvoline that have been eliminated upon the full separation of these operations from Ashland.

2

2
2

AshlandTM always solving ® Registered trademark, Ashland or its subsidiaries, registered in various countries TM Trademark, Ashland or its subsidiaries, registered in various countries